Alaska Native Male Disability
COMPARE
Alaska Native
Select to Compare
Male Disability
Alaska Native Male Disability
13.6%
DISABILITY | MALES
0.0/ 100
METRIC RATING
316th/ 347
METRIC RANK
Alaska Native Male Disability Correlation Chart
The statistical analysis conducted on geographies consisting of 76,765,214 people shows a slight positive correlation between the proportion of Alaska Natives and percentage of males with a disability in the United States with a correlation coefficient (R) of 0.092 and weighted average of 13.6%. On average, for every 1% (one percent) increase in Alaska Natives within a typical geography, there is an increase of 0.053% in percentage of males with a disability.
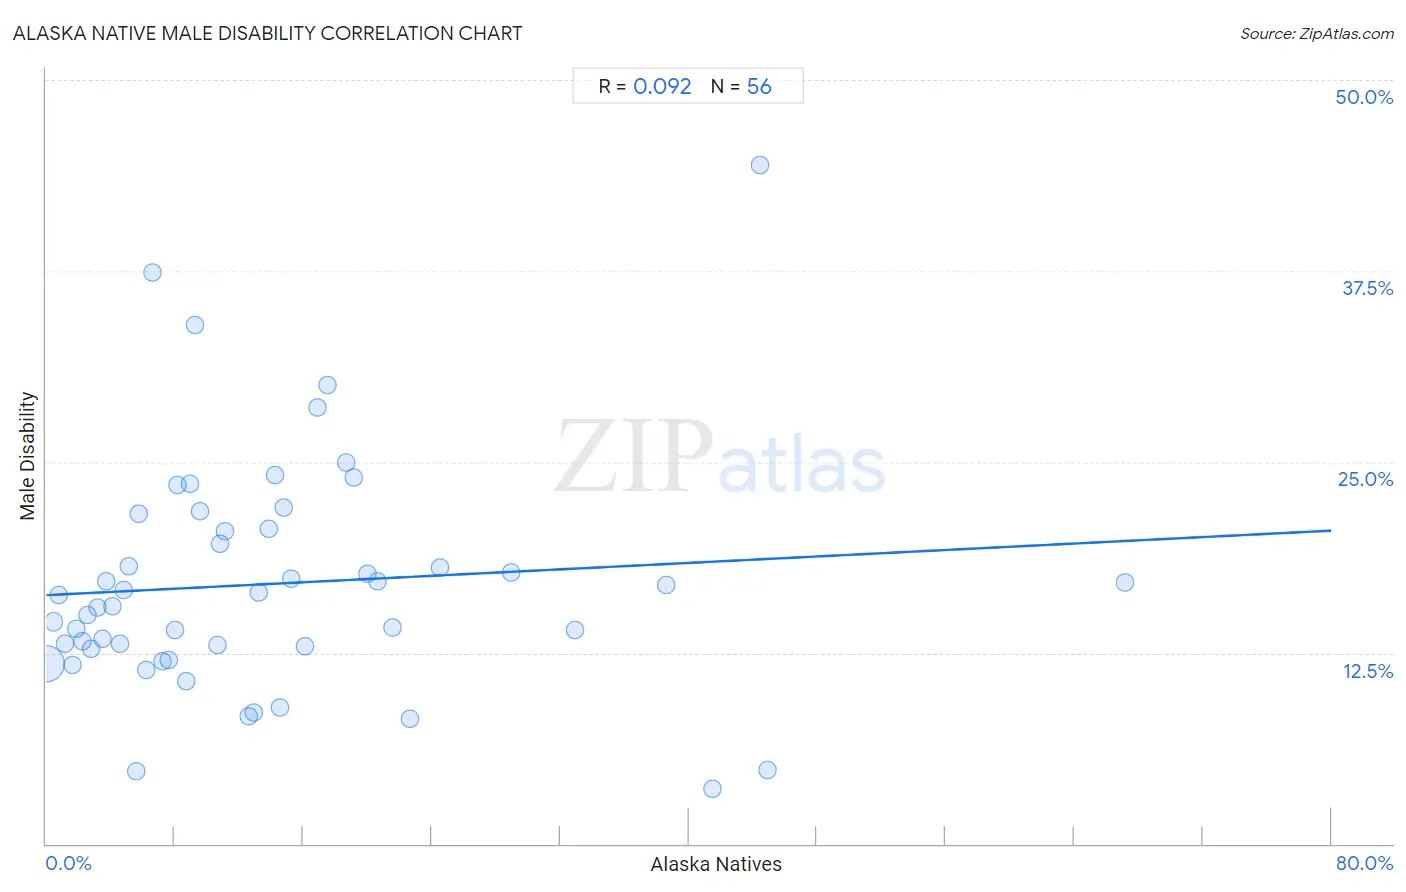
It is essential to understand that the correlation between the percentage of Alaska Natives and percentage of males with a disability does not imply a direct cause-and-effect relationship. It remains uncertain whether the presence of Alaska Natives influences an upward or downward trend in the level of percentage of males with a disability within an area, or if Alaska Natives simply ended up residing in those areas with higher or lower levels of percentage of males with a disability due to other factors.
Demographics Similar to Alaska Natives by Male Disability
In terms of male disability, the demographic groups most similar to Alaska Natives are Iroquois (13.6%, a difference of 0.050%), Aleut (13.5%, a difference of 0.21%), Puget Sound Salish (13.5%, a difference of 0.27%), Yakama (13.5%, a difference of 0.29%), and Paiute (13.7%, a difference of 0.80%).
| Demographics | Rating | Rank | Male Disability |
| Blackfeet | 0.0 /100 | #309 | Tragic 13.4% |
| Immigrants from the Azores | 0.0 /100 | #310 | Tragic 13.4% |
| Delaware | 0.0 /100 | #311 | Tragic 13.5% |
| Yakama | 0.0 /100 | #312 | Tragic 13.5% |
| Puget Sound Salish | 0.0 /100 | #313 | Tragic 13.5% |
| Aleuts | 0.0 /100 | #314 | Tragic 13.5% |
| Iroquois | 0.0 /100 | #315 | Tragic 13.6% |
| Alaska Natives | 0.0 /100 | #316 | Tragic 13.6% |
| Paiute | 0.0 /100 | #317 | Tragic 13.7% |
| Cree | 0.0 /100 | #318 | Tragic 13.7% |
| Americans | 0.0 /100 | #319 | Tragic 13.8% |
| Tlingit-Haida | 0.0 /100 | #320 | Tragic 13.8% |
| Shoshone | 0.0 /100 | #321 | Tragic 13.8% |
| Apache | 0.0 /100 | #322 | Tragic 14.0% |
| Osage | 0.0 /100 | #323 | Tragic 14.0% |
Alaska Native Male Disability Correlation Summary
| Measurement | Alaska Native Data | Male Disability Data |
| Minimum | 0.020% | 3.6% |
| Maximum | 67.1% | 44.4% |
| Range | 67.1% | 40.8% |
| Mean | 13.8% | 17.0% |
| Median | 10.1% | 15.9% |
| Interquartile 25% (IQ1) | 4.7% | 12.8% |
| Interquartile 75% (IQ3) | 18.1% | 20.5% |
| Interquartile Range (IQR) | 13.4% | 7.7% |
| Standard Deviation (Sample) | 13.3% | 7.6% |
| Standard Deviation (Population) | 13.1% | 7.6% |
Correlation Details
| Alaska Native Percentile | Sample Size | Male Disability |
[ 0.0% - 0.5% ] 0.020% | 74,745,615 | 11.8% |
[ 0.0% - 0.5% ] 0.47% | 565,632 | 14.5% |
[ 0.5% - 1.0% ] 0.81% | 109,403 | 16.3% |
[ 1.0% - 1.5% ] 1.17% | 156,543 | 13.1% |
[ 1.5% - 2.0% ] 1.61% | 442,307 | 11.7% |
[ 1.5% - 2.0% ] 1.85% | 110,172 | 14.0% |
[ 2.0% - 2.5% ] 2.24% | 135,927 | 13.2% |
[ 2.5% - 3.0% ] 2.55% | 95,573 | 15.0% |
[ 2.5% - 3.0% ] 2.81% | 106,439 | 12.7% |
[ 3.0% - 3.5% ] 3.22% | 58,493 | 15.5% |
[ 3.0% - 3.5% ] 3.48% | 111,167 | 13.5% |
[ 3.5% - 4.0% ] 3.77% | 26,605 | 17.2% |
[ 4.0% - 4.5% ] 4.14% | 35,270 | 15.6% |
[ 4.5% - 5.0% ] 4.56% | 11,330 | 13.1% |
[ 4.5% - 5.0% ] 4.79% | 1,419 | 16.6% |
[ 5.0% - 5.5% ] 5.15% | 8,636 | 18.2% |
[ 5.5% - 6.0% ] 5.59% | 2,308 | 4.8% |
[ 5.5% - 6.0% ] 5.78% | 329 | 21.6% |
[ 6.0% - 6.5% ] 6.19% | 1,712 | 11.4% |
[ 6.5% - 7.0% ] 6.58% | 471 | 37.4% |
[ 7.0% - 7.5% ] 7.22% | 2,893 | 11.9% |
[ 7.5% - 8.0% ] 7.60% | 803 | 12.0% |
[ 8.0% - 8.5% ] 8.05% | 174 | 14.0% |
[ 8.0% - 8.5% ] 8.20% | 256 | 23.5% |
[ 8.5% - 9.0% ] 8.69% | 1,128 | 10.6% |
[ 8.5% - 9.0% ] 8.96% | 2,969 | 23.5% |
[ 9.0% - 9.5% ] 9.29% | 560 | 34.0% |
[ 9.5% - 10.0% ] 9.55% | 220 | 21.8% |
[ 10.5% - 11.0% ] 10.66% | 544 | 13.0% |
[ 10.5% - 11.0% ] 10.79% | 1,668 | 19.6% |
[ 11.0% - 11.5% ] 11.11% | 144 | 20.5% |
[ 12.5% - 13.0% ] 12.61% | 444 | 8.3% |
[ 12.5% - 13.0% ] 12.95% | 2,077 | 8.6% |
[ 13.0% - 13.5% ] 13.26% | 558 | 16.4% |
[ 13.5% - 14.0% ] 13.89% | 864 | 20.6% |
[ 14.0% - 14.5% ] 14.23% | 843 | 24.1% |
[ 14.5% - 15.0% ] 14.52% | 248 | 8.9% |
[ 14.5% - 15.0% ] 14.78% | 9,863 | 22.0% |
[ 15.0% - 15.5% ] 15.25% | 2,714 | 17.3% |
[ 16.0% - 16.5% ] 16.13% | 155 | 12.9% |
[ 16.5% - 17.0% ] 16.91% | 272 | 28.6% |
[ 17.0% - 17.5% ] 17.50% | 40 | 30.0% |
[ 18.5% - 19.0% ] 18.64% | 236 | 25.0% |
[ 19.0% - 19.5% ] 19.12% | 68 | 24.0% |
[ 20.0% - 20.5% ] 20.00% | 60 | 17.6% |
[ 20.5% - 21.0% ] 20.60% | 2,554 | 17.2% |
[ 21.5% - 22.0% ] 21.55% | 1,828 | 14.1% |
[ 22.5% - 23.0% ] 22.63% | 760 | 8.2% |
[ 24.0% - 24.5% ] 24.49% | 690 | 18.1% |
[ 28.5% - 29.0% ] 28.92% | 830 | 17.7% |
[ 32.5% - 33.0% ] 32.89% | 900 | 14.0% |
[ 38.5% - 39.0% ] 38.57% | 1,768 | 16.9% |
[ 41.0% - 41.5% ] 41.44% | 222 | 3.6% |
[ 44.0% - 44.5% ] 44.44% | 54 | 44.4% |
[ 44.5% - 45.0% ] 44.94% | 316 | 4.8% |
[ 67.0% - 67.5% ] 67.14% | 140 | 17.1% |