Alaska Native vs Hungarian 3 or more Vehicles in Household
COMPARE
Alaska Native
Hungarian
3 or more Vehicles in Household
3 or more Vehicles in Household Comparison
Alaska Natives
Hungarians
21.0%
3 OR MORE VEHICLES IN HOUSEHOLD
98.2/ 100
METRIC RATING
99th/ 347
METRIC RANK
19.8%
3 OR MORE VEHICLES IN HOUSEHOLD
70.5/ 100
METRIC RATING
157th/ 347
METRIC RANK
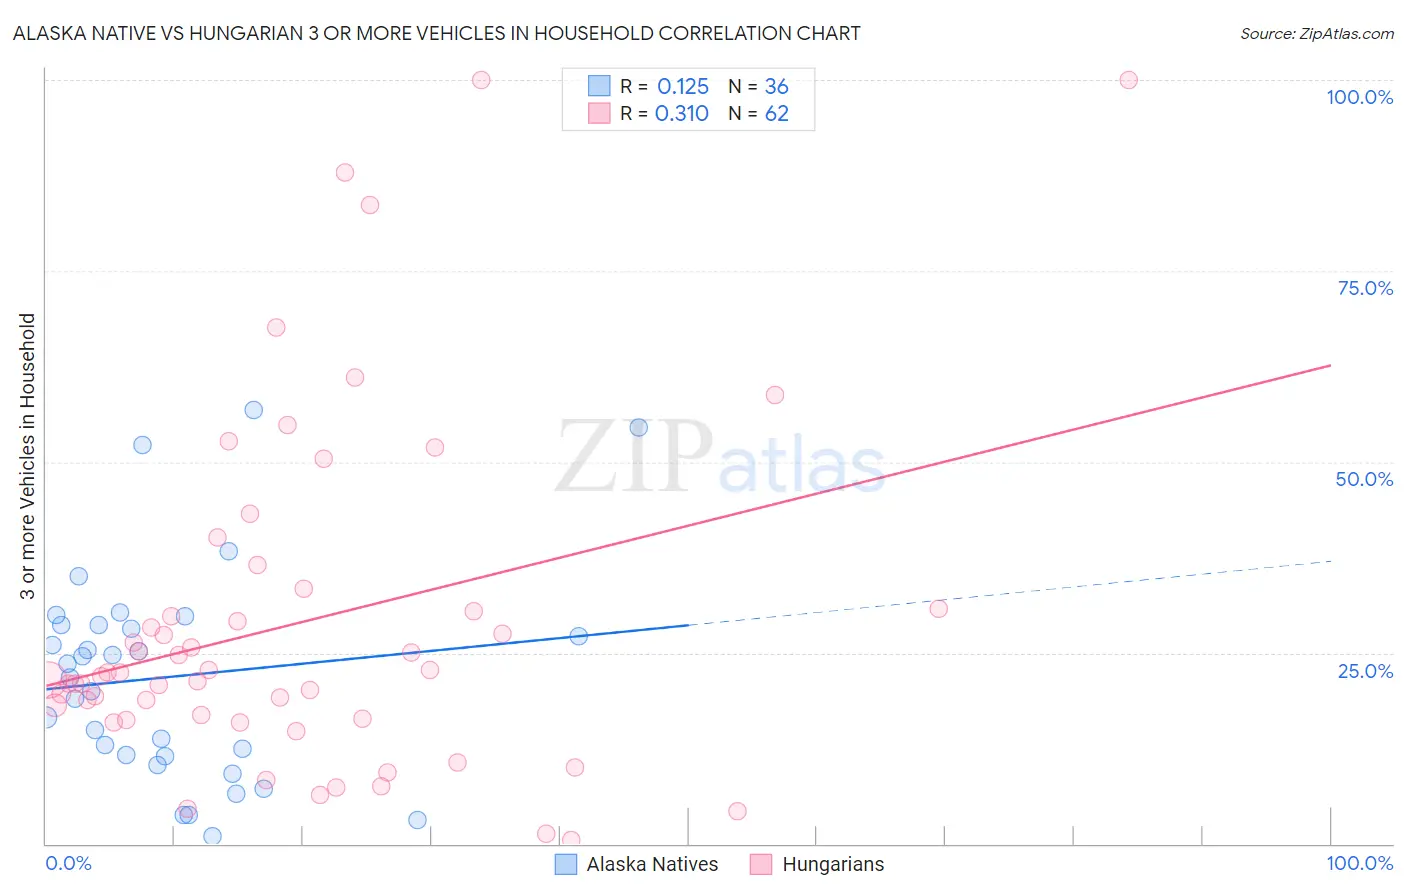
Alaska Native vs Hungarian 3 or more Vehicles in Household Correlation Chart
The statistical analysis conducted on geographies consisting of 76,712,110 people shows a poor positive correlation between the proportion of Alaska Natives and percentage of households with 3 or more vehicles available in the United States with a correlation coefficient (R) of 0.125 and weighted average of 21.0%. Similarly, the statistical analysis conducted on geographies consisting of 485,698,849 people shows a mild positive correlation between the proportion of Hungarians and percentage of households with 3 or more vehicles available in the United States with a correlation coefficient (R) of 0.310 and weighted average of 19.8%, a difference of 5.9%.
3 or more Vehicles in Household Correlation Summary
| Measurement | Alaska Native | Hungarian |
| Minimum | 0.90% | 0.54% |
| Maximum | 56.7% | 100.0% |
| Range | 55.8% | 99.5% |
| Mean | 21.9% | 28.9% |
| Median | 22.6% | 22.2% |
| Interquartile 25% (IQ1) | 11.5% | 16.4% |
| Interquartile 75% (IQ3) | 28.6% | 30.8% |
| Interquartile Range (IQR) | 17.1% | 14.4% |
| Standard Deviation (Sample) | 13.9% | 22.4% |
| Standard Deviation (Population) | 13.7% | 22.2% |
Similar Demographics by 3 or more Vehicles in Household
Demographics Similar to Alaska Natives by 3 or more Vehicles in Household
In terms of 3 or more vehicles in household, the demographic groups most similar to Alaska Natives are Hmong (21.0%, a difference of 0.0%), Comanche (21.0%, a difference of 0.040%), Canadian (21.0%, a difference of 0.060%), Cree (21.0%, a difference of 0.17%), and Pakistani (21.0%, a difference of 0.26%).
| Demographics | Rating | Rank | 3 or more Vehicles in Household |
| Apache | 98.9 /100 | #92 | Exceptional 21.2% |
| Immigrants | Indonesia | 98.8 /100 | #93 | Exceptional 21.1% |
| Immigrants | Cambodia | 98.6 /100 | #94 | Exceptional 21.1% |
| Pakistanis | 98.5 /100 | #95 | Exceptional 21.0% |
| Cree | 98.4 /100 | #96 | Exceptional 21.0% |
| Canadians | 98.3 /100 | #97 | Exceptional 21.0% |
| Hmong | 98.2 /100 | #98 | Exceptional 21.0% |
| Alaska Natives | 98.2 /100 | #99 | Exceptional 21.0% |
| Comanche | 98.2 /100 | #100 | Exceptional 21.0% |
| Blackfeet | 97.9 /100 | #101 | Exceptional 20.9% |
| Seminole | 97.8 /100 | #102 | Exceptional 20.9% |
| Dutch West Indians | 97.8 /100 | #103 | Exceptional 20.9% |
| Luxembourgers | 97.7 /100 | #104 | Exceptional 20.9% |
| Austrians | 97.5 /100 | #105 | Exceptional 20.9% |
| Bolivians | 97.4 /100 | #106 | Exceptional 20.8% |
Demographics Similar to Hungarians by 3 or more Vehicles in Household
In terms of 3 or more vehicles in household, the demographic groups most similar to Hungarians are Thai (19.8%, a difference of 0.050%), Armenian (19.8%, a difference of 0.15%), Immigrants from Pakistan (19.8%, a difference of 0.21%), Tlingit-Haida (19.9%, a difference of 0.26%), and Immigrants from Lebanon (19.8%, a difference of 0.26%).
| Demographics | Rating | Rank | 3 or more Vehicles in Household |
| Immigrants | Immigrants | 80.8 /100 | #150 | Excellent 20.0% |
| Taiwanese | 80.6 /100 | #151 | Excellent 20.0% |
| Lebanese | 79.8 /100 | #152 | Good 20.0% |
| Yuman | 75.6 /100 | #153 | Good 19.9% |
| Immigrants | Jordan | 75.0 /100 | #154 | Good 19.9% |
| Tlingit-Haida | 73.4 /100 | #155 | Good 19.9% |
| Thais | 71.1 /100 | #156 | Good 19.8% |
| Hungarians | 70.5 /100 | #157 | Good 19.8% |
| Armenians | 68.8 /100 | #158 | Good 19.8% |
| Immigrants | Pakistan | 68.2 /100 | #159 | Good 19.8% |
| Immigrants | Lebanon | 67.6 /100 | #160 | Good 19.8% |
| Immigrants | Guatemala | 65.6 /100 | #161 | Good 19.7% |
| Estonians | 63.2 /100 | #162 | Good 19.7% |
| Chileans | 63.0 /100 | #163 | Good 19.7% |
| Yugoslavians | 62.9 /100 | #164 | Good 19.7% |