Alaska Native 2 or more Vehicles in Household
COMPARE
Alaska Native
Select to Compare
2 or more Vehicles in Household
Alaska Native 2 or more Vehicles in Household
53.6%
2+ VEHICLES AVAILABLE
3.9/ 100
METRIC RATING
228th/ 347
METRIC RANK
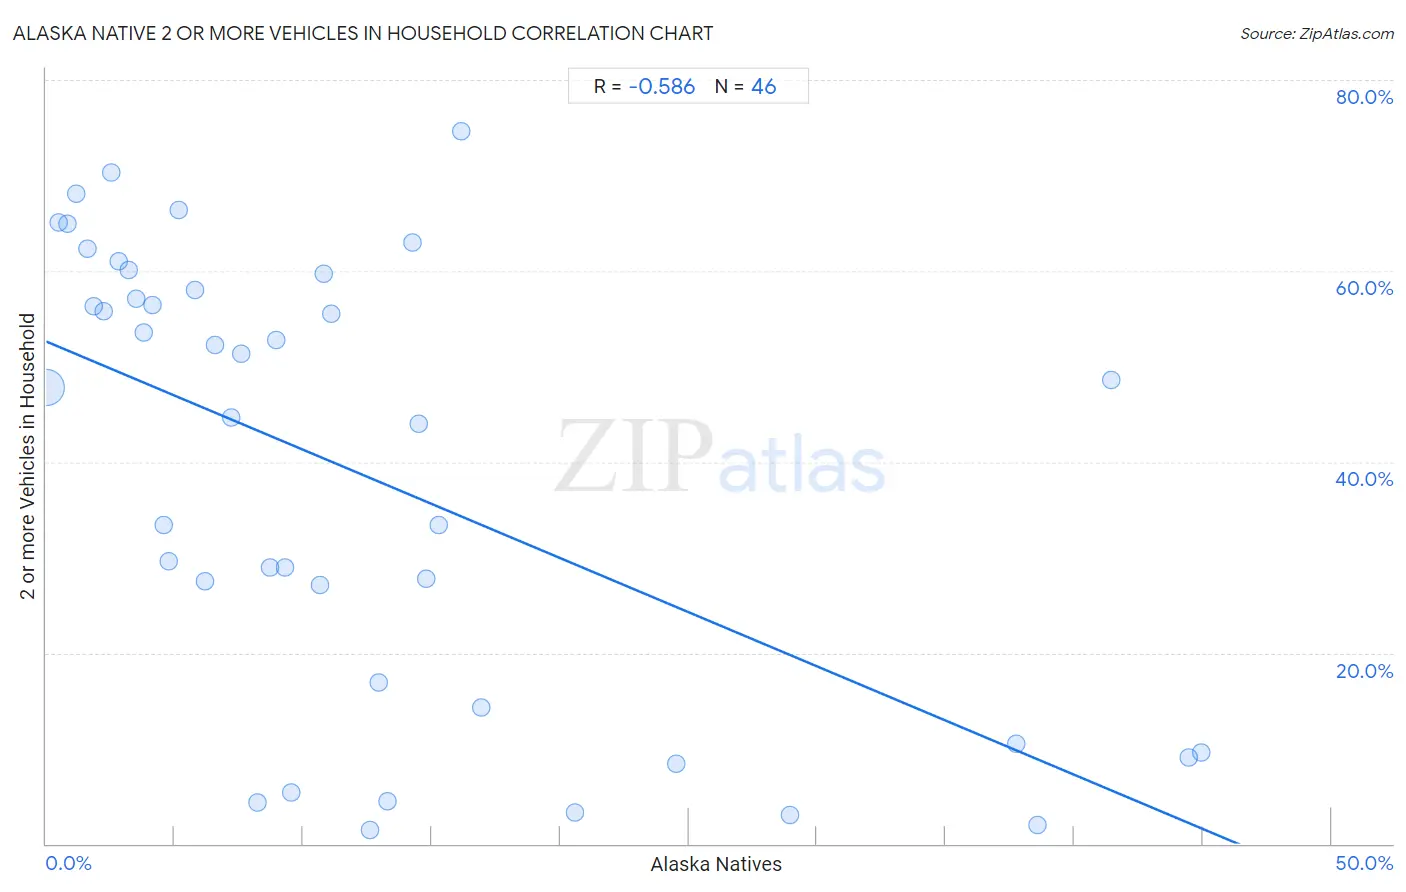
Alaska Native 2 or more Vehicles in Household Correlation Chart
The statistical analysis conducted on geographies consisting of 76,736,682 people shows a substantial negative correlation between the proportion of Alaska Natives and percentage of households with 2 or more vehicles available in the United States with a correlation coefficient (R) of -0.586 and weighted average of 53.6%. On average, for every 1% (one percent) increase in Alaska Natives within a typical geography, there is a decrease of 1.1% in percentage of households with 2 or more vehicles available.
It is essential to understand that the correlation between the percentage of Alaska Natives and percentage of households with 2 or more vehicles available does not imply a direct cause-and-effect relationship. It remains uncertain whether the presence of Alaska Natives influences an upward or downward trend in the level of percentage of households with 2 or more vehicles available within an area, or if Alaska Natives simply ended up residing in those areas with higher or lower levels of percentage of households with 2 or more vehicles available due to other factors.
Demographics Similar to Alaska Natives by 2 or more Vehicles in Household
In terms of 2 or more vehicles in household, the demographic groups most similar to Alaska Natives are Immigrants from Turkey (53.6%, a difference of 0.020%), Sudanese (53.6%, a difference of 0.060%), Immigrants from Nepal (53.5%, a difference of 0.080%), Panamanian (53.5%, a difference of 0.13%), and Immigrants from Guatemala (53.5%, a difference of 0.20%).
| Demographics | Rating | Rank | 2 or more Vehicles in Household |
| Immigrants from Singapore | 6.3 /100 | #221 | Tragic 53.9% |
| Kiowa | 6.2 /100 | #222 | Tragic 53.9% |
| Immigrants from Bosnia and Herzegovina | 5.5 /100 | #223 | Tragic 53.8% |
| Brazilians | 5.3 /100 | #224 | Tragic 53.8% |
| Immigrants from Egypt | 5.2 /100 | #225 | Tragic 53.8% |
| Immigrants from Eastern Africa | 5.1 /100 | #226 | Tragic 53.7% |
| Sudanese | 4.1 /100 | #227 | Tragic 53.6% |
| Alaska Natives | 3.9 /100 | #228 | Tragic 53.6% |
| Immigrants from Turkey | 3.8 /100 | #229 | Tragic 53.6% |
| Immigrants from Nepal | 3.6 /100 | #230 | Tragic 53.5% |
| Panamanians | 3.4 /100 | #231 | Tragic 53.5% |
| Immigrants from Guatemala | 3.2 /100 | #232 | Tragic 53.5% |
| Ugandans | 3.2 /100 | #233 | Tragic 53.5% |
| Immigrants from Switzerland | 3.0 /100 | #234 | Tragic 53.4% |
| Immigrants from Middle Africa | 3.0 /100 | #235 | Tragic 53.4% |
Alaska Native 2 or more Vehicles in Household Correlation Summary
| Measurement | Alaska Native Data | 2 or more Vehicles in Household Data |
| Minimum | 0.020% | 1.5% |
| Maximum | 44.9% | 74.6% |
| Range | 44.9% | 73.1% |
| Mean | 12.3% | 38.7% |
| Median | 8.8% | 46.2% |
| Interquartile 25% (IQ1) | 3.8% | 14.3% |
| Interquartile 75% (IQ3) | 14.8% | 58.0% |
| Interquartile Range (IQR) | 11.0% | 43.8% |
| Standard Deviation (Sample) | 12.1% | 23.4% |
| Standard Deviation (Population) | 12.0% | 23.2% |
Correlation Details
| Alaska Native Percentile | Sample Size | 2 or more Vehicles in Household |
[ 0.0% - 0.5% ] 0.020% | 74,733,860 | 47.8% |
[ 0.0% - 0.5% ] 0.47% | 570,386 | 65.1% |
[ 0.5% - 1.0% ] 0.81% | 104,029 | 64.9% |
[ 1.0% - 1.5% ] 1.17% | 159,092 | 68.1% |
[ 1.5% - 2.0% ] 1.61% | 442,307 | 62.3% |
[ 1.5% - 2.0% ] 1.85% | 110,172 | 56.4% |
[ 2.0% - 2.5% ] 2.24% | 135,539 | 55.8% |
[ 2.5% - 3.0% ] 2.55% | 93,808 | 70.3% |
[ 2.5% - 3.0% ] 2.81% | 106,095 | 61.0% |
[ 3.0% - 3.5% ] 3.22% | 57,315 | 60.1% |
[ 3.0% - 3.5% ] 3.48% | 111,079 | 57.2% |
[ 3.5% - 4.0% ] 3.77% | 26,339 | 53.6% |
[ 4.0% - 4.5% ] 4.13% | 33,962 | 56.4% |
[ 4.5% - 5.0% ] 4.56% | 11,330 | 33.4% |
[ 4.5% - 5.0% ] 4.78% | 1,298 | 29.5% |
[ 5.0% - 5.5% ] 5.15% | 8,636 | 66.4% |
[ 5.5% - 6.0% ] 5.78% | 329 | 58.0% |
[ 6.0% - 6.5% ] 6.19% | 1,712 | 27.5% |
[ 6.5% - 7.0% ] 6.58% | 471 | 52.3% |
[ 7.0% - 7.5% ] 7.19% | 1,071 | 44.7% |
[ 7.5% - 8.0% ] 7.60% | 803 | 51.4% |
[ 8.0% - 8.5% ] 8.20% | 256 | 4.3% |
[ 8.5% - 9.0% ] 8.69% | 1,128 | 29.0% |
[ 8.5% - 9.0% ] 8.96% | 2,969 | 52.8% |
[ 9.0% - 9.5% ] 9.29% | 560 | 29.0% |
[ 9.5% - 10.0% ] 9.55% | 220 | 5.4% |
[ 10.5% - 11.0% ] 10.66% | 544 | 27.1% |
[ 10.5% - 11.0% ] 10.79% | 1,668 | 59.7% |
[ 11.0% - 11.5% ] 11.11% | 144 | 55.6% |
[ 12.5% - 13.0% ] 12.61% | 444 | 1.5% |
[ 12.5% - 13.0% ] 12.95% | 2,077 | 16.8% |
[ 13.0% - 13.5% ] 13.26% | 558 | 4.5% |
[ 14.0% - 14.5% ] 14.23% | 843 | 63.0% |
[ 14.5% - 15.0% ] 14.52% | 248 | 43.9% |
[ 14.5% - 15.0% ] 14.78% | 9,863 | 27.7% |
[ 15.0% - 15.5% ] 15.29% | 170 | 33.3% |
[ 16.0% - 16.5% ] 16.13% | 155 | 74.6% |
[ 16.5% - 17.0% ] 16.91% | 272 | 14.3% |
[ 20.5% - 21.0% ] 20.59% | 952 | 3.3% |
[ 24.0% - 24.5% ] 24.49% | 690 | 8.4% |
[ 28.5% - 29.0% ] 28.92% | 830 | 3.1% |
[ 37.5% - 38.0% ] 37.76% | 98 | 10.5% |
[ 38.5% - 39.0% ] 38.57% | 1,768 | 2.0% |
[ 41.0% - 41.5% ] 41.44% | 222 | 48.6% |
[ 44.0% - 44.5% ] 44.44% | 54 | 9.1% |
[ 44.5% - 45.0% ] 44.94% | 316 | 9.5% |