Jena, LA Map & Demographics
Jena Map
Jena Overview
$36,161
PER CAPITA INCOME
$83,673
AVG FAMILY INCOME
$67,009
AVG HOUSEHOLD INCOME
41.0%
WAGE / INCOME GAP [ % ]
59.0¢/ $1
WAGE / INCOME GAP [ $ ]
0.39
INEQUALITY / GINI INDEX
4,099
TOTAL POPULATION
2,234
MALE POPULATION
1,865
FEMALE POPULATION
119.79
MALES / 100 FEMALES
83.48
FEMALES / 100 MALES
37.5
MEDIAN AGE
2.8
AVG FAMILY SIZE
2.5
AVG HOUSEHOLD SIZE
2,130
LABOR FORCE [ PEOPLE ]
62.4%
PERCENT IN LABOR FORCE
3.9%
UNEMPLOYMENT RATE
Jena Zip Codes
Jena Area Codes
Income in Jena
Income Overview in Jena
Per Capita Income in Jena is $36,161, while median incomes of families and households are $83,673 and $67,009 respectively.
| Characteristic | Number | Measure |
| Per Capita Income | 4,099 | $36,161 |
| Median Family Income | 1,158 | $83,673 |
| Mean Family Income | 1,158 | $102,613 |
| Median Household Income | 1,500 | $67,009 |
| Mean Household Income | 1,500 | $88,410 |
| Income Deficit | 1,158 | $0 |
| Wage / Income Gap (%) | 4,099 | 40.96% |
| Wage / Income Gap ($) | 4,099 | 59.04¢ per $1 |
| Gini / Inequality Index | 4,099 | 0.39 |
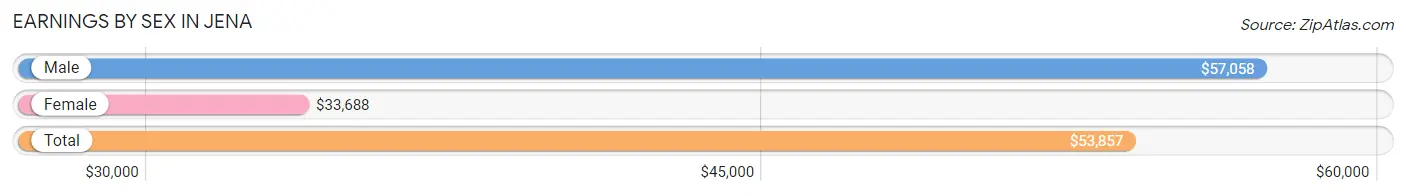
Earnings by Sex in Jena
Average Earnings in Jena are $53,857, $57,058 for men and $33,688 for women, a difference of 41.0%.
| Sex | Number | Average Earnings |
| Male | 1,332 (59.3%) | $57,058 |
| Female | 914 (40.7%) | $33,688 |
| Total | 2,246 (100.0%) | $53,857 |
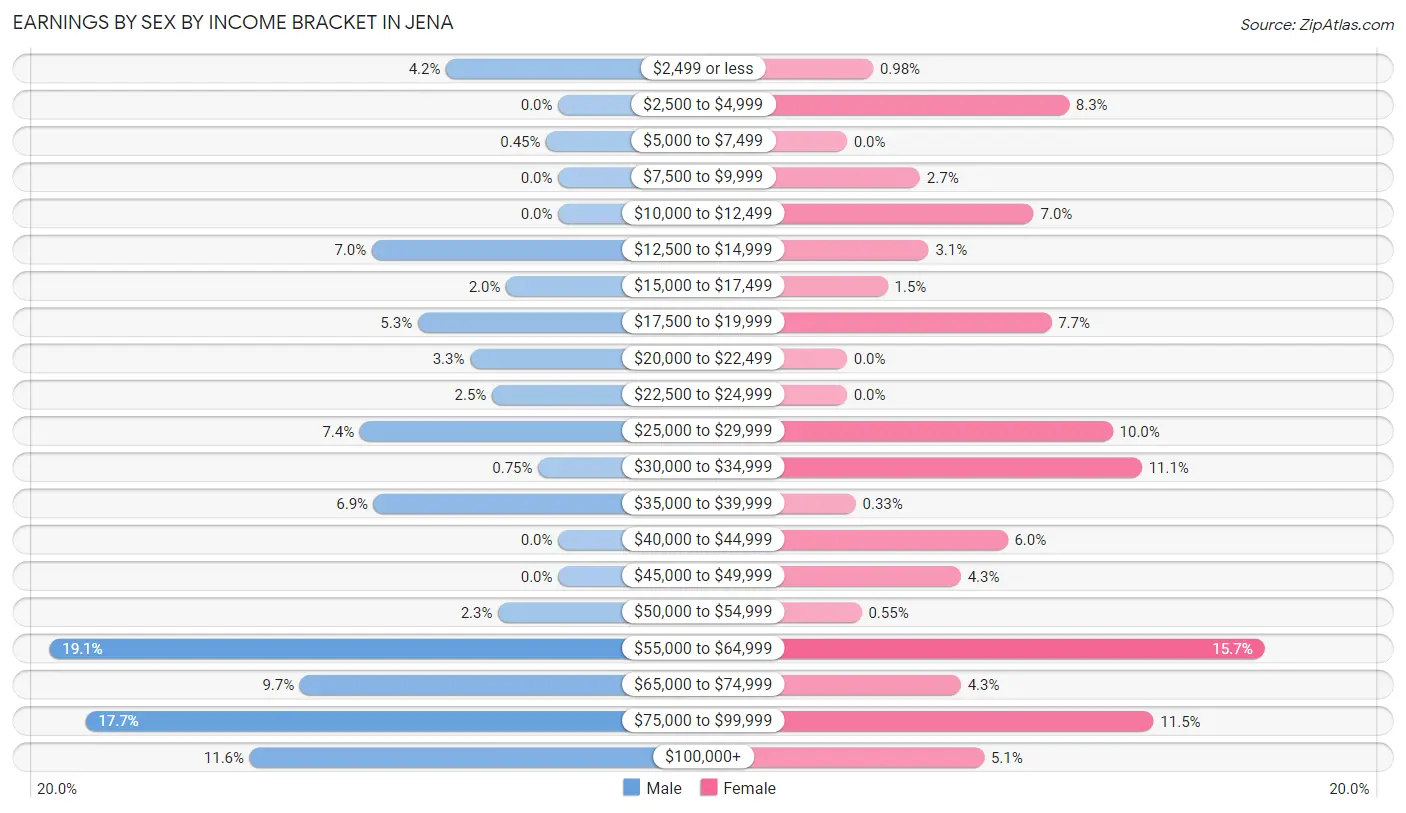
Earnings by Sex by Income Bracket in Jena
The most common earnings brackets in Jena are $55,000 to $64,999 for men (254 | 19.1%) and $55,000 to $64,999 for women (143 | 15.7%).
| Income | Male | Female |
| $2,499 or less | 56 (4.2%) | 9 (1.0%) |
| $2,500 to $4,999 | 0 (0.0%) | 76 (8.3%) |
| $5,000 to $7,499 | 6 (0.4%) | 0 (0.0%) |
| $7,500 to $9,999 | 0 (0.0%) | 25 (2.7%) |
| $10,000 to $12,499 | 0 (0.0%) | 64 (7.0%) |
| $12,500 to $14,999 | 93 (7.0%) | 28 (3.1%) |
| $15,000 to $17,499 | 26 (1.9%) | 14 (1.5%) |
| $17,500 to $19,999 | 70 (5.3%) | 70 (7.7%) |
| $20,000 to $22,499 | 44 (3.3%) | 0 (0.0%) |
| $22,500 to $24,999 | 33 (2.5%) | 0 (0.0%) |
| $25,000 to $29,999 | 99 (7.4%) | 91 (10.0%) |
| $30,000 to $34,999 | 10 (0.7%) | 101 (11.1%) |
| $35,000 to $39,999 | 92 (6.9%) | 3 (0.3%) |
| $40,000 to $44,999 | 0 (0.0%) | 55 (6.0%) |
| $45,000 to $49,999 | 0 (0.0%) | 39 (4.3%) |
| $50,000 to $54,999 | 30 (2.2%) | 5 (0.5%) |
| $55,000 to $64,999 | 254 (19.1%) | 143 (15.7%) |
| $65,000 to $74,999 | 129 (9.7%) | 39 (4.3%) |
| $75,000 to $99,999 | 236 (17.7%) | 105 (11.5%) |
| $100,000+ | 154 (11.6%) | 47 (5.1%) |
| Total | 1,332 (100.0%) | 914 (100.0%) |
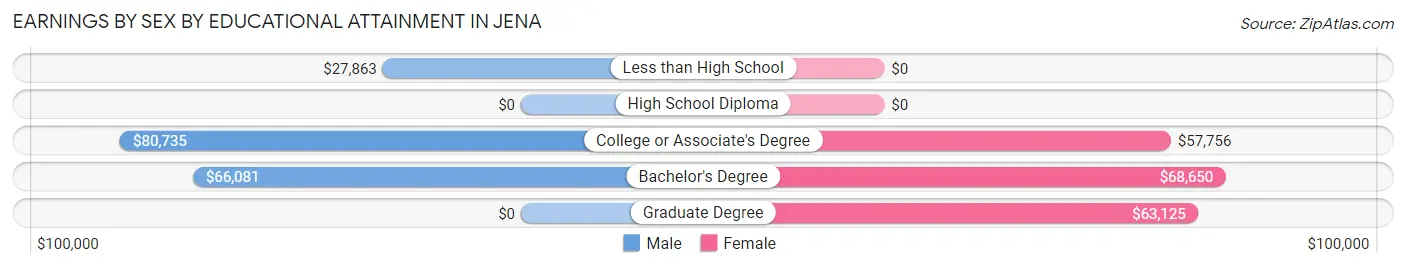
Earnings by Sex by Educational Attainment in Jena
Average earnings in Jena are $61,339 for men and $34,688 for women, a difference of 43.4%. Men with an educational attainment of college or associate's degree enjoy the highest average annual earnings of $80,735, while those with less than high school education earn the least with $27,863. Women with an educational attainment of bachelor's degree earn the most with the average annual earnings of $68,650, while those with college or associate's degree education have the smallest earnings of $57,756.
| Educational Attainment | Male Income | Female Income |
| Less than High School | $27,863 | $0 |
| High School Diploma | - | - |
| College or Associate's Degree | $80,735 | $57,756 |
| Bachelor's Degree | $66,081 | $68,650 |
| Graduate Degree | - | - |
| Total | $61,339 | $34,688 |
Family Income in Jena
Family Income Brackets in Jena
According to the Jena family income data, there are 287 families falling into the $75,000 to $99,999 income range, which is the most common income bracket and makes up 24.8% of all families. Conversely, the less than $10,000 income bracket is the least frequent group with only 19 families (1.6%) belonging to this category.
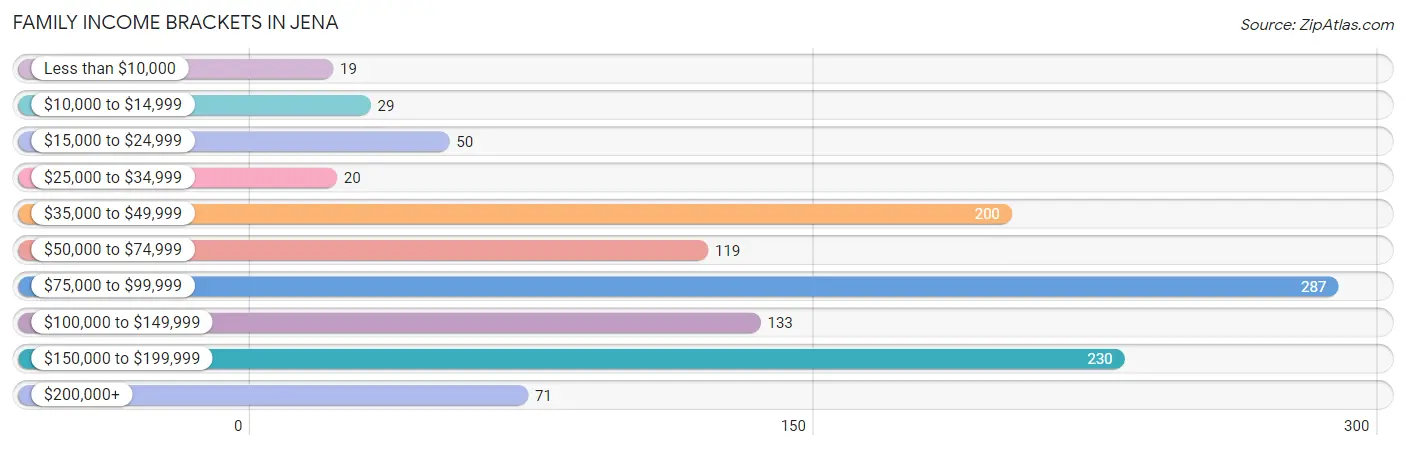
| Income Bracket | # Families | % Families |
| Less than $10,000 | 19 | 1.6% |
| $10,000 to $14,999 | 29 | 2.5% |
| $15,000 to $24,999 | 50 | 4.3% |
| $25,000 to $34,999 | 20 | 1.7% |
| $35,000 to $49,999 | 200 | 17.3% |
| $50,000 to $74,999 | 119 | 10.3% |
| $75,000 to $99,999 | 287 | 24.8% |
| $100,000 to $149,999 | 133 | 11.5% |
| $150,000 to $199,999 | 230 | 19.9% |
| $200,000+ | 71 | 6.1% |
Family Income by Famaliy Size in Jena
4-person families (217 | 18.7%) account for the highest median family income in Jena with $150,277 per family, while 4-person families (217 | 18.7%) have the highest median income of $37,569 per family member.
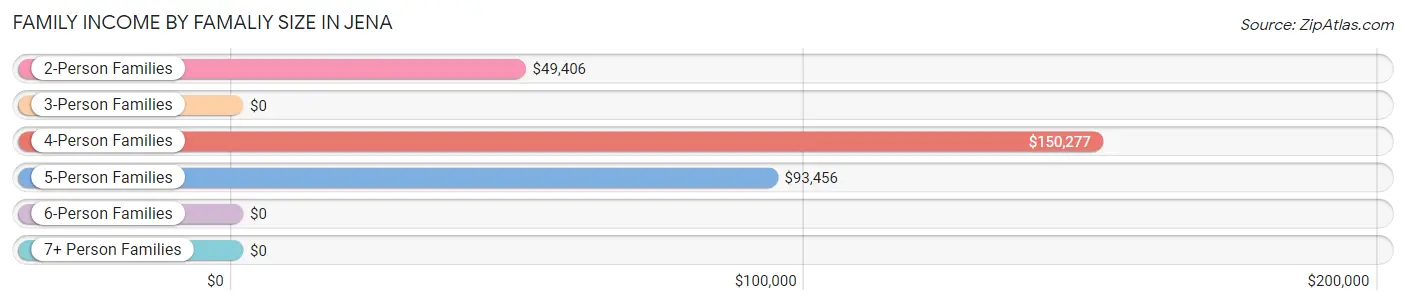
| Income Bracket | # Families | Median Income |
| 2-Person Families | 512 (44.2%) | $49,406 |
| 3-Person Families | 98 (8.5%) | $0 |
| 4-Person Families | 217 (18.7%) | $150,277 |
| 5-Person Families | 201 (17.4%) | $93,456 |
| 6-Person Families | 130 (11.2%) | $0 |
| 7+ Person Families | 0 (0.0%) | $0 |
| Total | 1,158 (100.0%) | $83,673 |
Family Income by Number of Earners in Jena
The median family income in Jena is $83,673, with families comprising 2 earners (504) having the highest median family income of $151,004, while families with no earners (184) have the lowest median family income of $48,566, accounting for 43.5% and 15.9% of families, respectively.
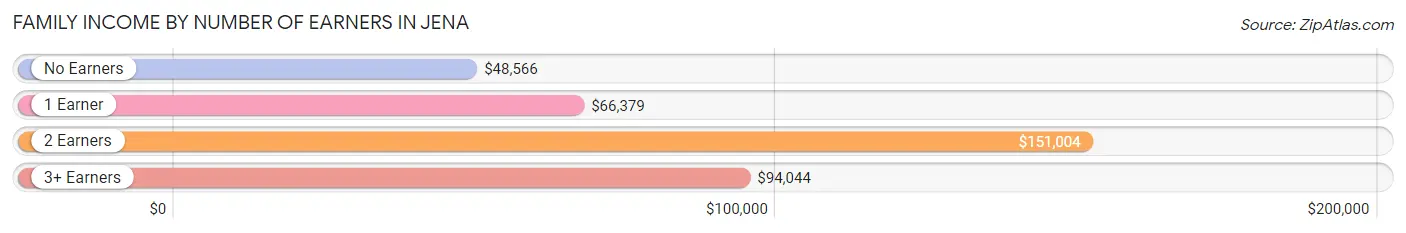
| Number of Earners | # Families | Median Income |
| No Earners | 184 (15.9%) | $48,566 |
| 1 Earner | 363 (31.4%) | $66,379 |
| 2 Earners | 504 (43.5%) | $151,004 |
| 3+ Earners | 107 (9.2%) | $94,044 |
| Total | 1,158 (100.0%) | $83,673 |
Household Income in Jena
Household Income Brackets in Jena
With 304 households falling in the category, the $35,000 to $49,999 income range is the most frequent in Jena, accounting for 20.3% of all households. In contrast, only 20 households (1.3%) fall into the less than $10,000 income bracket, making it the least populous group.
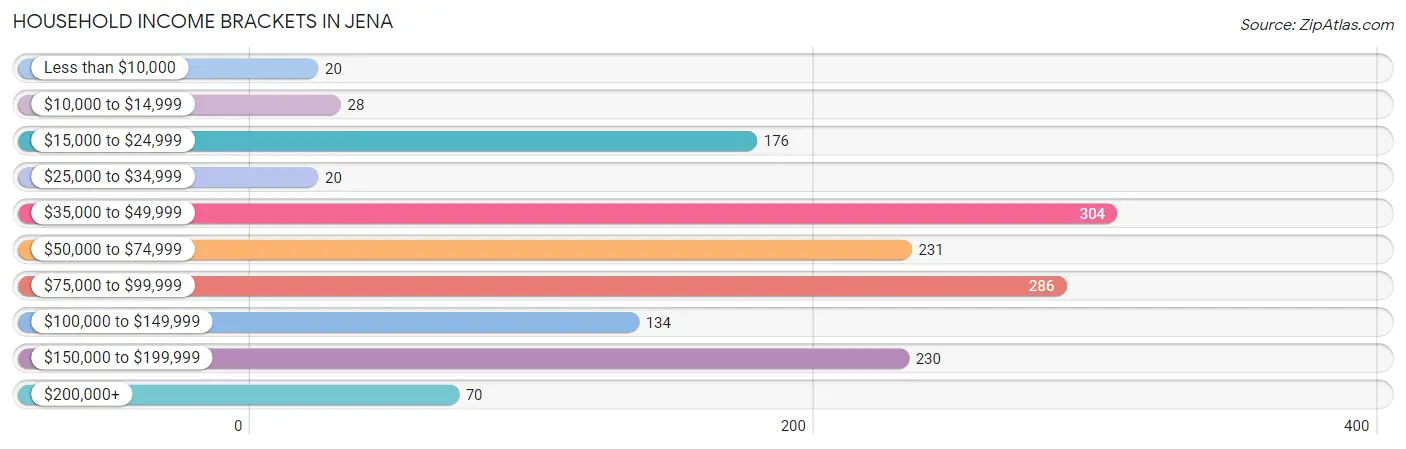
| Income Bracket | # Households | % Households |
| Less than $10,000 | 20 | 1.3% |
| $10,000 to $14,999 | 28 | 1.9% |
| $15,000 to $24,999 | 176 | 11.7% |
| $25,000 to $34,999 | 20 | 1.3% |
| $35,000 to $49,999 | 304 | 20.3% |
| $50,000 to $74,999 | 231 | 15.4% |
| $75,000 to $99,999 | 286 | 19.1% |
| $100,000 to $149,999 | 134 | 8.9% |
| $150,000 to $199,999 | 230 | 15.3% |
| $200,000+ | 70 | 4.7% |
Household Income by Householder Age in Jena
The median household income in Jena is $67,009, with the highest median household income of $83,856 found in the 45 to 64 years age bracket for the primary householder. A total of 573 households (38.2%) fall into this category. Meanwhile, the 15 to 24 years age bracket for the primary householder has the lowest median household income of $0, with 5 households (0.3%) in this group.
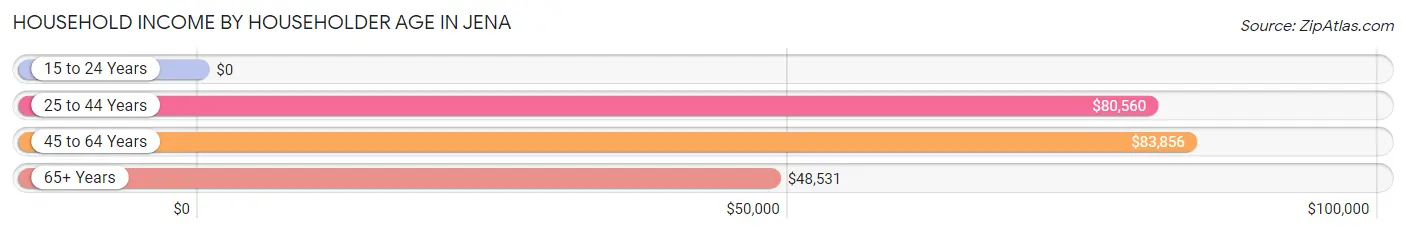
| Income Bracket | # Households | Median Income |
| 15 to 24 Years | 5 (0.3%) | $0 |
| 25 to 44 Years | 462 (30.8%) | $80,560 |
| 45 to 64 Years | 573 (38.2%) | $83,856 |
| 65+ Years | 460 (30.7%) | $48,531 |
| Total | 1,500 (100.0%) | $67,009 |
Poverty in Jena
Income Below Poverty by Sex and Age in Jena
With 8.2% poverty level for males and 11.0% for females among the residents of Jena, 6 to 11 year old males and 18 to 24 year old females are the most vulnerable to poverty, with 35 males (32.1%) and 40 females (46.0%) in their respective age groups living below the poverty level.
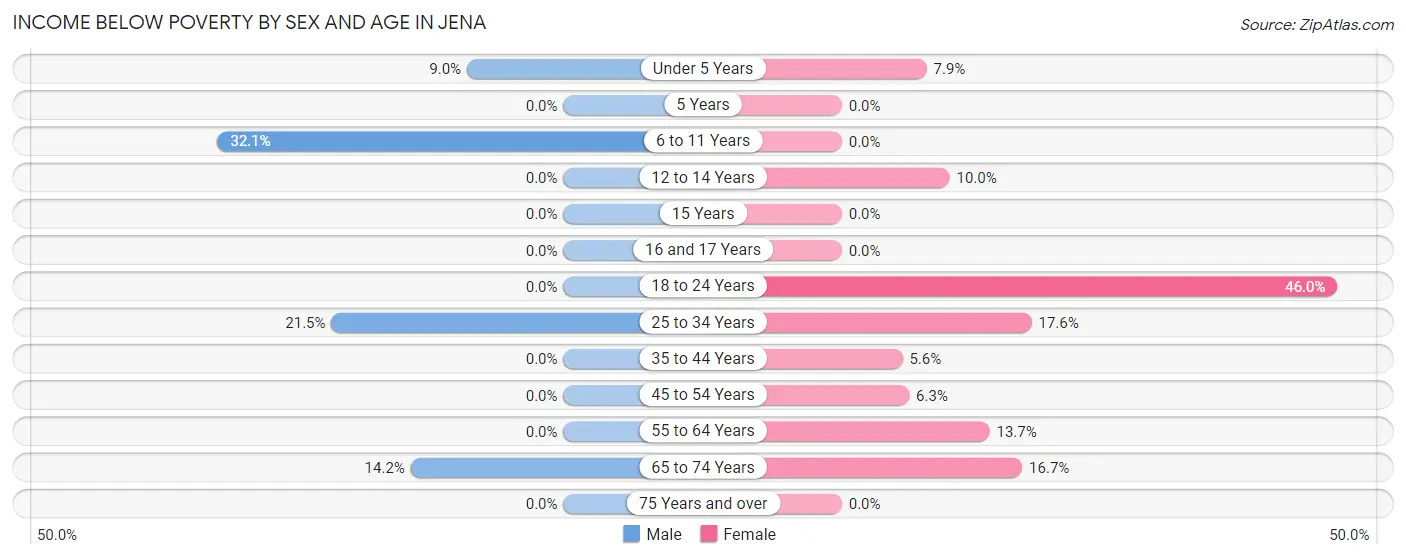
| Age Bracket | Male | Female |
| Under 5 Years | 17 (8.9%) | 7 (7.9%) |
| 5 Years | 0 (0.0%) | 0 (0.0%) |
| 6 to 11 Years | 35 (32.1%) | 0 (0.0%) |
| 12 to 14 Years | 0 (0.0%) | 13 (10.0%) |
| 15 Years | 0 (0.0%) | 0 (0.0%) |
| 16 and 17 Years | 0 (0.0%) | 0 (0.0%) |
| 18 to 24 Years | 0 (0.0%) | 40 (46.0%) |
| 25 to 34 Years | 93 (21.5%) | 50 (17.6%) |
| 35 to 44 Years | 0 (0.0%) | 20 (5.6%) |
| 45 to 54 Years | 0 (0.0%) | 15 (6.2%) |
| 55 to 64 Years | 0 (0.0%) | 17 (13.7%) |
| 65 to 74 Years | 18 (14.2%) | 36 (16.7%) |
| 75 Years and over | 0 (0.0%) | 0 (0.0%) |
| Total | 163 (8.2%) | 198 (11.0%) |
Income Above Poverty by Sex and Age in Jena
According to the poverty statistics in Jena, males aged 5 years and females aged 5 years are the age groups that are most secure financially, with 100.0% of males and 100.0% of females in these age groups living above the poverty line.
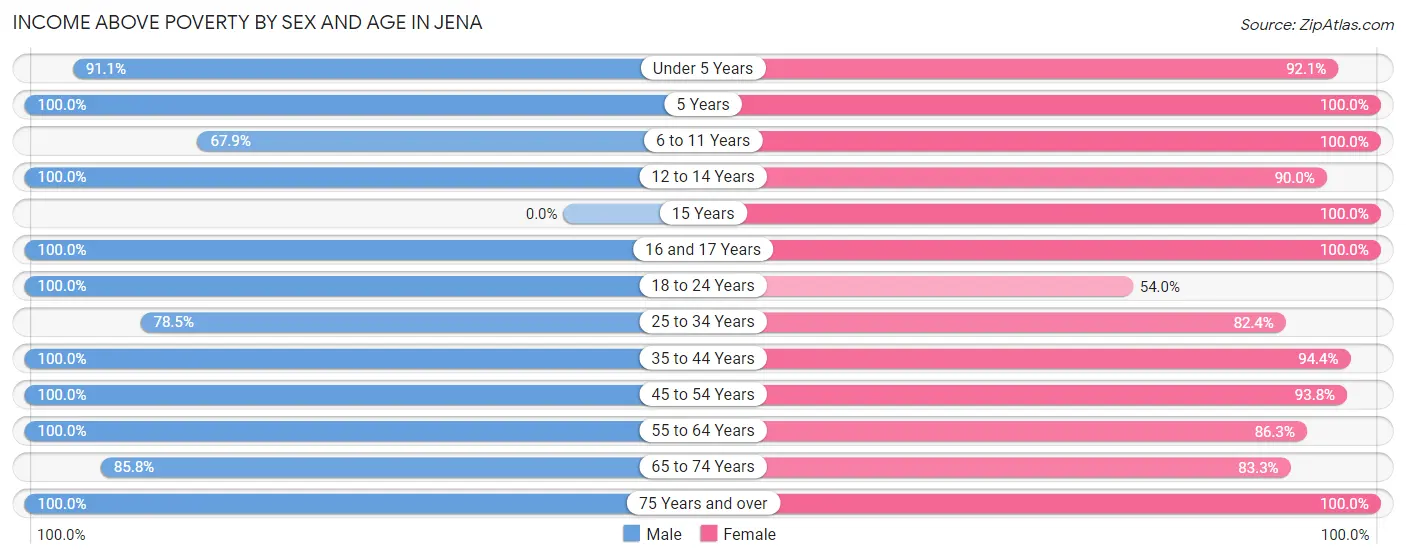
| Age Bracket | Male | Female |
| Under 5 Years | 173 (91.0%) | 82 (92.1%) |
| 5 Years | 7 (100.0%) | 24 (100.0%) |
| 6 to 11 Years | 74 (67.9%) | 58 (100.0%) |
| 12 to 14 Years | 55 (100.0%) | 117 (90.0%) |
| 15 Years | 0 (0.0%) | 23 (100.0%) |
| 16 and 17 Years | 139 (100.0%) | 60 (100.0%) |
| 18 to 24 Years | 135 (100.0%) | 47 (54.0%) |
| 25 to 34 Years | 339 (78.5%) | 234 (82.4%) |
| 35 to 44 Years | 47 (100.0%) | 335 (94.4%) |
| 45 to 54 Years | 395 (100.0%) | 225 (93.8%) |
| 55 to 64 Years | 180 (100.0%) | 107 (86.3%) |
| 65 to 74 Years | 109 (85.8%) | 179 (83.3%) |
| 75 Years and over | 181 (100.0%) | 105 (100.0%) |
| Total | 1,834 (91.8%) | 1,596 (89.0%) |
Income Below Poverty Among Married-Couple Families in Jena
The poverty statistics for married-couple families in Jena show that 1.8% or 14 of the total 767 families live below the poverty line. Families with no children have the highest poverty rate of 4.1%, comprising of 14 families. On the other hand, families with 1 or 2 children have the lowest poverty rate of 0.0%, which includes 0 families.
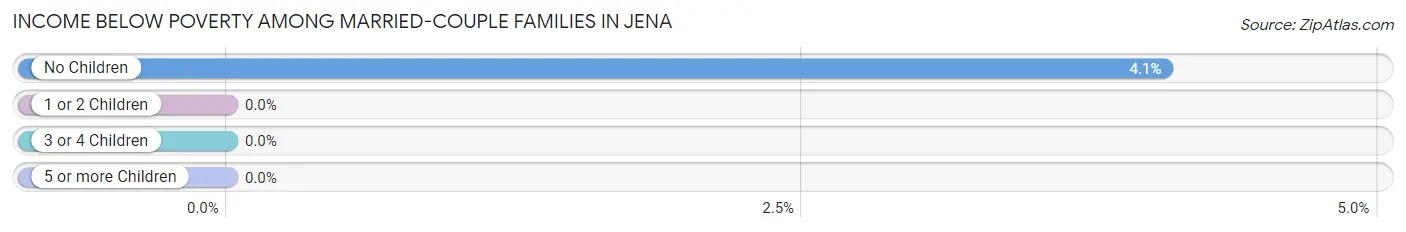
| Children | Above Poverty | Below Poverty |
| No Children | 330 (95.9%) | 14 (4.1%) |
| 1 or 2 Children | 184 (100.0%) | 0 (0.0%) |
| 3 or 4 Children | 239 (100.0%) | 0 (0.0%) |
| 5 or more Children | 0 (0.0%) | 0 (0.0%) |
| Total | 753 (98.2%) | 14 (1.8%) |
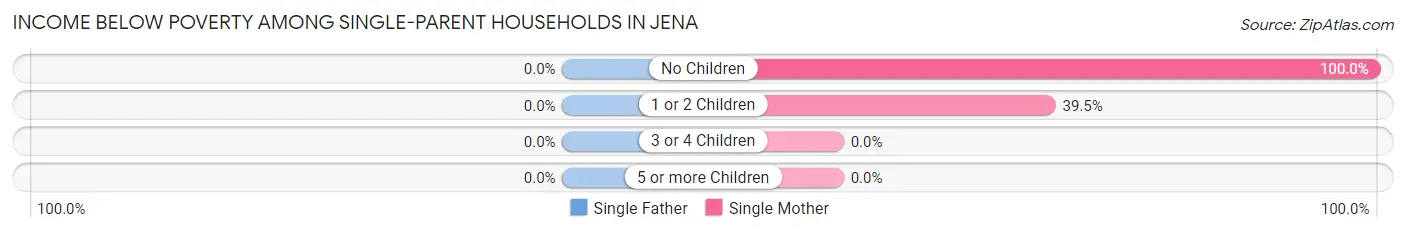
Income Below Poverty Among Single-Parent Households in Jena
| Children | Single Father | Single Mother |
| No Children | 0 (0.0%) | 9 (100.0%) |
| 1 or 2 Children | 0 (0.0%) | 75 (39.5%) |
| 3 or 4 Children | 0 (0.0%) | 0 (0.0%) |
| 5 or more Children | 0 (0.0%) | 0 (0.0%) |
| Total | 0 (0.0%) | 84 (42.2%) |
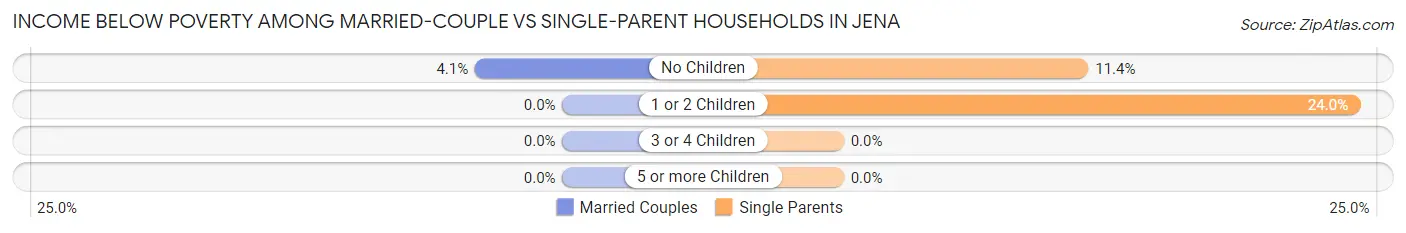
Income Below Poverty Among Married-Couple vs Single-Parent Households in Jena
The poverty data for Jena shows that 14 of the married-couple family households (1.8%) and 84 of the single-parent households (21.5%) are living below the poverty level. Within the married-couple family households, those with no children have the highest poverty rate, with 14 households (4.1%) falling below the poverty line. Among the single-parent households, those with 1 or 2 children have the highest poverty rate, with 75 household (24.0%) living below poverty.
| Children | Married-Couple Families | Single-Parent Households |
| No Children | 14 (4.1%) | 9 (11.4%) |
| 1 or 2 Children | 0 (0.0%) | 75 (24.0%) |
| 3 or 4 Children | 0 (0.0%) | 0 (0.0%) |
| 5 or more Children | 0 (0.0%) | 0 (0.0%) |
| Total | 14 (1.8%) | 84 (21.5%) |
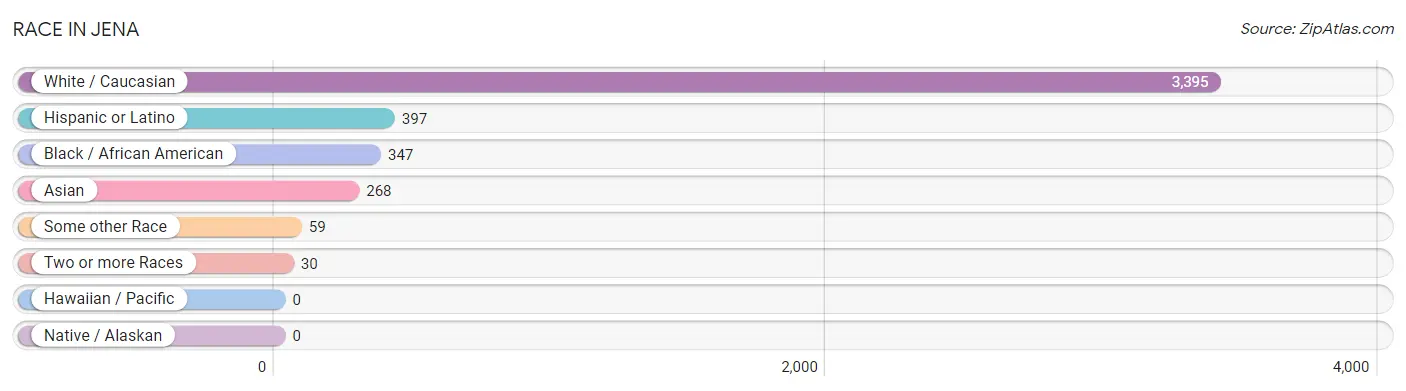
Race in Jena
The most populous races in Jena are White / Caucasian (3,395 | 82.8%), Hispanic or Latino (397 | 9.7%), and Black / African American (347 | 8.5%).
| Race | # Population | % Population |
| Asian | 268 | 6.5% |
| Black / African American | 347 | 8.5% |
| Hawaiian / Pacific | 0 | 0.0% |
| Hispanic or Latino | 397 | 9.7% |
| Native / Alaskan | 0 | 0.0% |
| White / Caucasian | 3,395 | 82.8% |
| Two or more Races | 30 | 0.7% |
| Some other Race | 59 | 1.4% |
| Total | 4,099 | 100.0% |
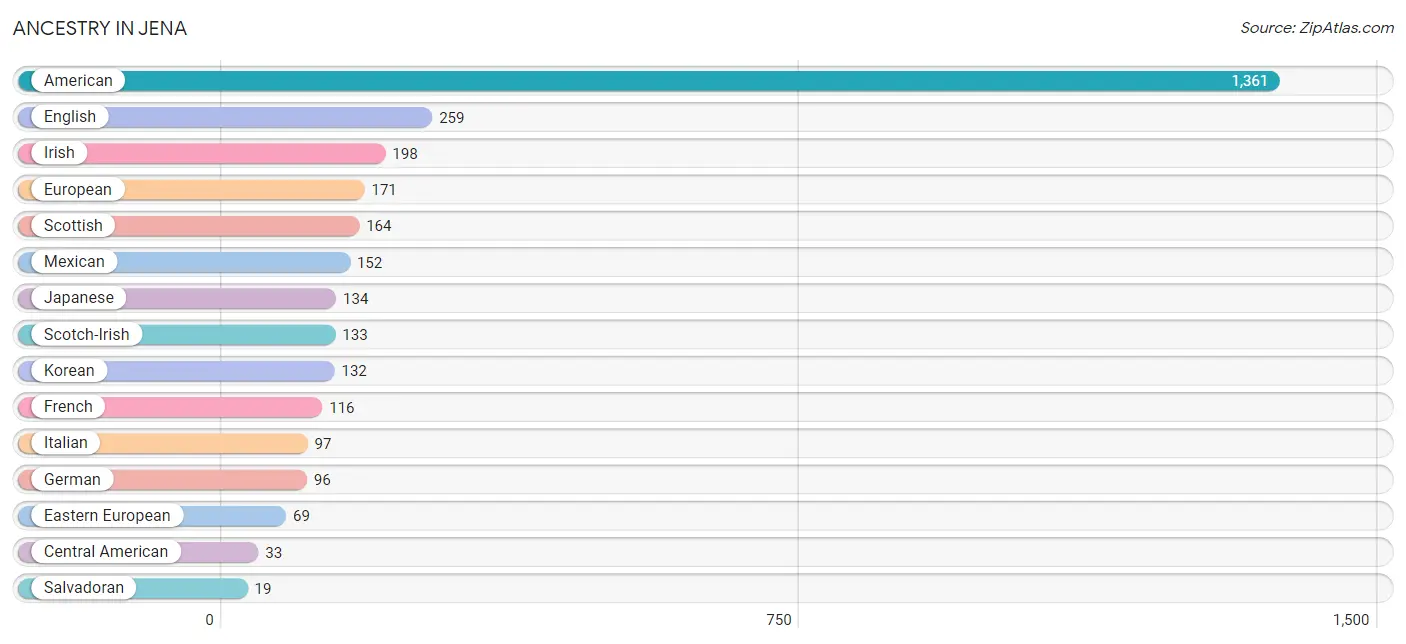
Ancestry in Jena
The most populous ancestries reported in Jena are American (1,361 | 33.2%), English (259 | 6.3%), Irish (198 | 4.8%), European (171 | 4.2%), and Scottish (164 | 4.0%), together accounting for 52.5% of all Jena residents.
| Ancestry | # Population | % Population |
| American | 1,361 | 33.2% |
| Arab | 11 | 0.3% |
| Austrian | 10 | 0.2% |
| Belgian | 3 | 0.1% |
| British | 16 | 0.4% |
| Central American | 33 | 0.8% |
| Cuban | 14 | 0.3% |
| Eastern European | 69 | 1.7% |
| English | 259 | 6.3% |
| European | 171 | 4.2% |
| French | 116 | 2.8% |
| German | 96 | 2.3% |
| Guatemalan | 5 | 0.1% |
| Honduran | 4 | 0.1% |
| Iraqi | 6 | 0.2% |
| Irish | 198 | 4.8% |
| Italian | 97 | 2.4% |
| Japanese | 134 | 3.3% |
| Korean | 132 | 3.2% |
| Mexican | 152 | 3.7% |
| Nicaraguan | 5 | 0.1% |
| Salvadoran | 19 | 0.5% |
| Scandinavian | 8 | 0.2% |
| Scotch-Irish | 133 | 3.2% |
| Scottish | 164 | 4.0% | View All 25 Rows |
Immigrants in Jena
The most numerous immigrant groups reported in Jena came from Latin America (144 | 3.5%), Central America (135 | 3.3%), Mexico (97 | 2.4%), El Salvador (24 | 0.6%), and Asia (13 | 0.3%), together accounting for 10.1% of all Jena residents.
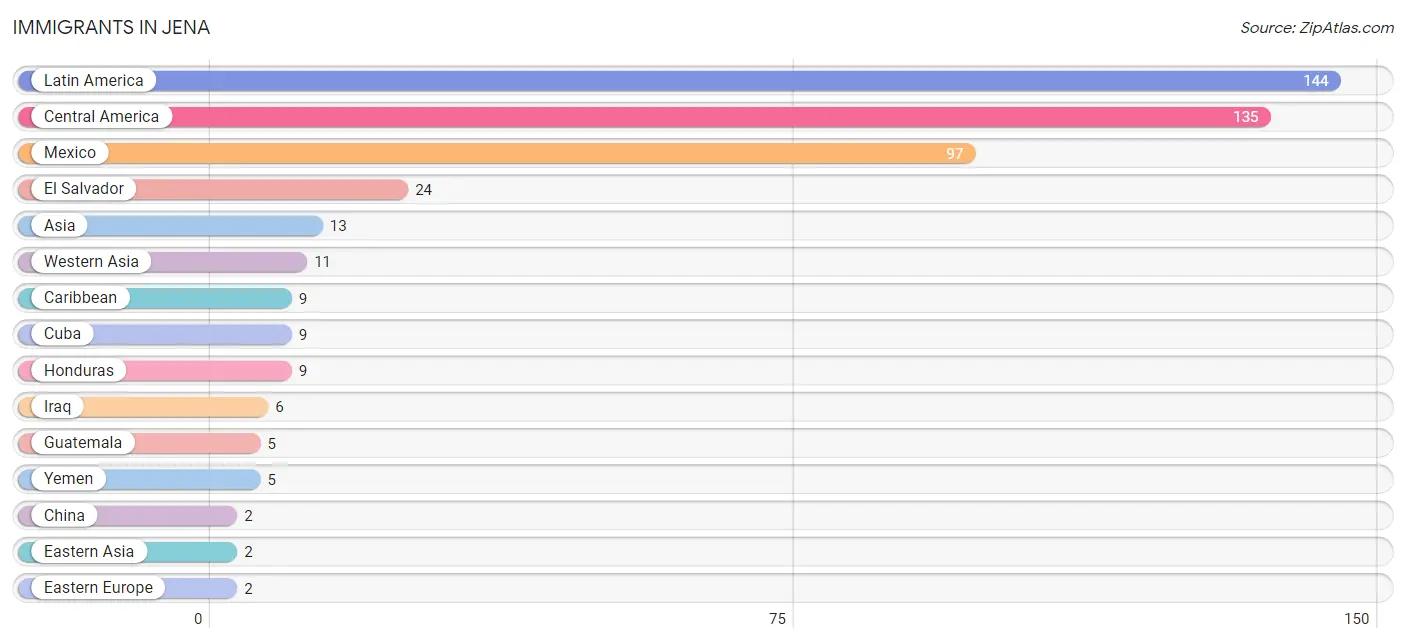
| Immigration Origin | # Population | % Population |
| Asia | 13 | 0.3% |
| Caribbean | 9 | 0.2% |
| Central America | 135 | 3.3% |
| China | 2 | 0.1% |
| Cuba | 9 | 0.2% |
| Eastern Asia | 2 | 0.1% |
| Eastern Europe | 2 | 0.1% |
| El Salvador | 24 | 0.6% |
| Europe | 2 | 0.1% |
| Guatemala | 5 | 0.1% |
| Honduras | 9 | 0.2% |
| Iraq | 6 | 0.2% |
| Latin America | 144 | 3.5% |
| Mexico | 97 | 2.4% |
| Romania | 2 | 0.1% |
| Western Asia | 11 | 0.3% |
| Yemen | 5 | 0.1% | View All 17 Rows |
Sex and Age in Jena
Sex and Age in Jena
The most populous age groups in Jena are 45 to 49 Years (291 | 13.0%) for men and 35 to 39 Years (244 | 13.1%) for women.
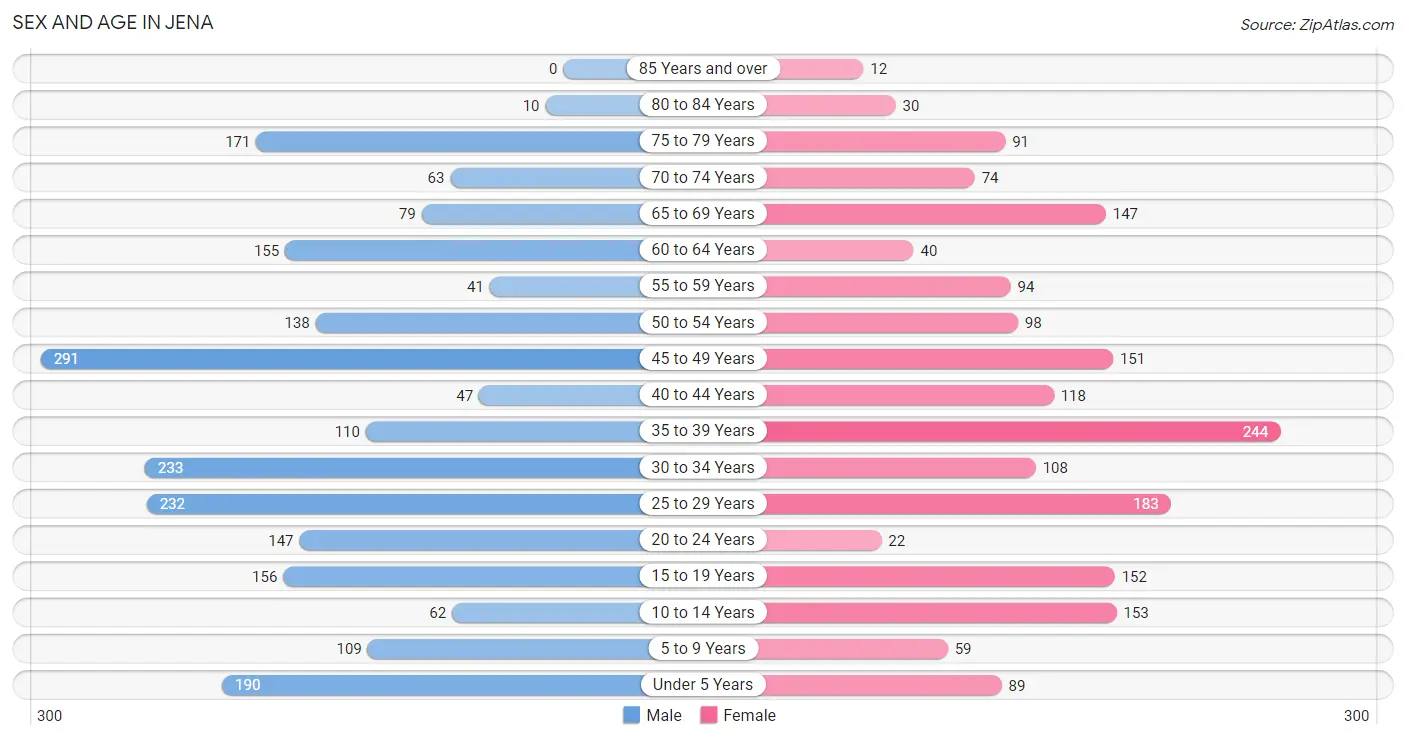
| Age Bracket | Male | Female |
| Under 5 Years | 190 (8.5%) | 89 (4.8%) |
| 5 to 9 Years | 109 (4.9%) | 59 (3.2%) |
| 10 to 14 Years | 62 (2.8%) | 153 (8.2%) |
| 15 to 19 Years | 156 (7.0%) | 152 (8.2%) |
| 20 to 24 Years | 147 (6.6%) | 22 (1.2%) |
| 25 to 29 Years | 232 (10.4%) | 183 (9.8%) |
| 30 to 34 Years | 233 (10.4%) | 108 (5.8%) |
| 35 to 39 Years | 110 (4.9%) | 244 (13.1%) |
| 40 to 44 Years | 47 (2.1%) | 118 (6.3%) |
| 45 to 49 Years | 291 (13.0%) | 151 (8.1%) |
| 50 to 54 Years | 138 (6.2%) | 98 (5.2%) |
| 55 to 59 Years | 41 (1.8%) | 94 (5.0%) |
| 60 to 64 Years | 155 (6.9%) | 40 (2.1%) |
| 65 to 69 Years | 79 (3.5%) | 147 (7.9%) |
| 70 to 74 Years | 63 (2.8%) | 74 (4.0%) |
| 75 to 79 Years | 171 (7.6%) | 91 (4.9%) |
| 80 to 84 Years | 10 (0.4%) | 30 (1.6%) |
| 85 Years and over | 0 (0.0%) | 12 (0.6%) |
| Total | 2,234 (100.0%) | 1,865 (100.0%) |
Families and Households in Jena
Median Family Size in Jena
The median family size in Jena is 2.80 persons per family, with single female/mother families (199 | 17.2%) accounting for the largest median family size of 3.19 persons per family. On the other hand, single male/father families (192 | 16.6%) represent the smallest median family size with 2.46 persons per family.
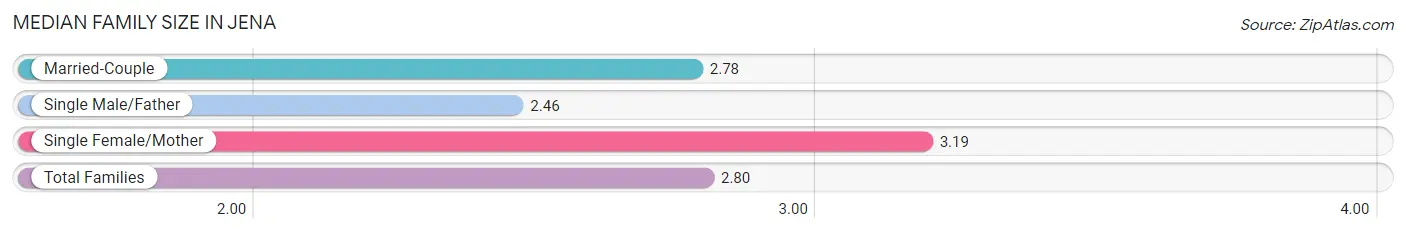
| Family Type | # Families | Family Size |
| Married-Couple | 767 (66.2%) | 2.78 |
| Single Male/Father | 192 (16.6%) | 2.46 |
| Single Female/Mother | 199 (17.2%) | 3.19 |
| Total Families | 1,158 (100.0%) | 2.80 |
Median Household Size in Jena
The median household size in Jena is 2.52 persons per household, with single female/mother households (199 | 13.3%) accounting for the largest median household size of 3.19 persons per household. non-family households (342 | 22.8%) represent the smallest median household size with 1.42 persons per household.
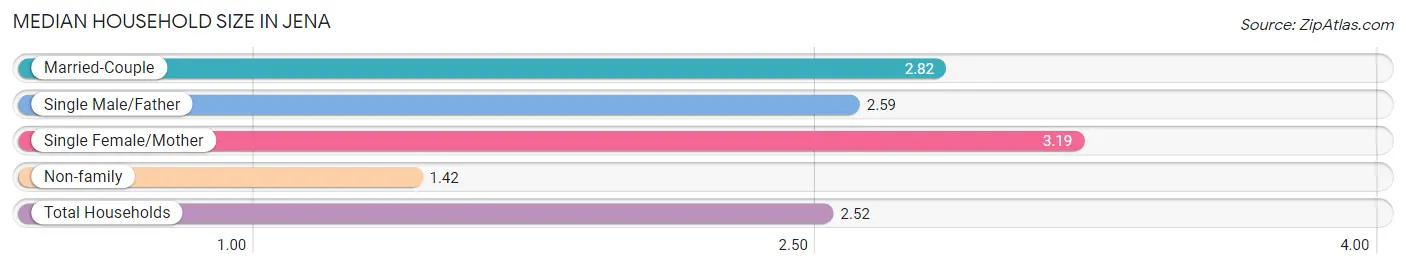
| Household Type | # Households | Household Size |
| Married-Couple | 767 (51.1%) | 2.82 |
| Single Male/Father | 192 (12.8%) | 2.59 |
| Single Female/Mother | 199 (13.3%) | 3.19 |
| Non-family | 342 (22.8%) | 1.42 |
| Total Households | 1,500 (100.0%) | 2.52 |
Household Size by Marriage Status in Jena
Out of a total of 1,500 households in Jena, 1,158 (77.2%) are family households, while 342 (22.8%) are nonfamily households. The most numerous type of family households are 2-person households, comprising 481, and the most common type of nonfamily households are 1-person households, comprising 263.
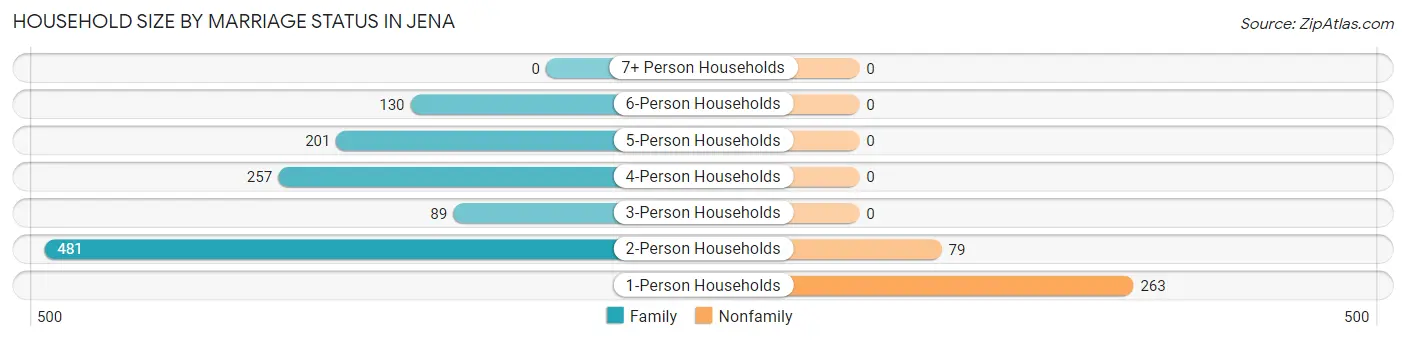
| Household Size | Family Households | Nonfamily Households |
| 1-Person Households | - | 263 (17.5%) |
| 2-Person Households | 481 (32.1%) | 79 (5.3%) |
| 3-Person Households | 89 (5.9%) | 0 (0.0%) |
| 4-Person Households | 257 (17.1%) | 0 (0.0%) |
| 5-Person Households | 201 (13.4%) | 0 (0.0%) |
| 6-Person Households | 130 (8.7%) | 0 (0.0%) |
| 7+ Person Households | 0 (0.0%) | 0 (0.0%) |
| Total | 1,158 (77.2%) | 342 (22.8%) |
Female Fertility in Jena
Fertility by Age in Jena
Average fertility rate in Jena is 86.0 births per 1,000 women. Women in the age bracket of 20 to 34 years have the highest fertility rate with 281.0 births per 1,000 women. Women in the age bracket of 20 to 34 years acount for 100.0% of all women with births.
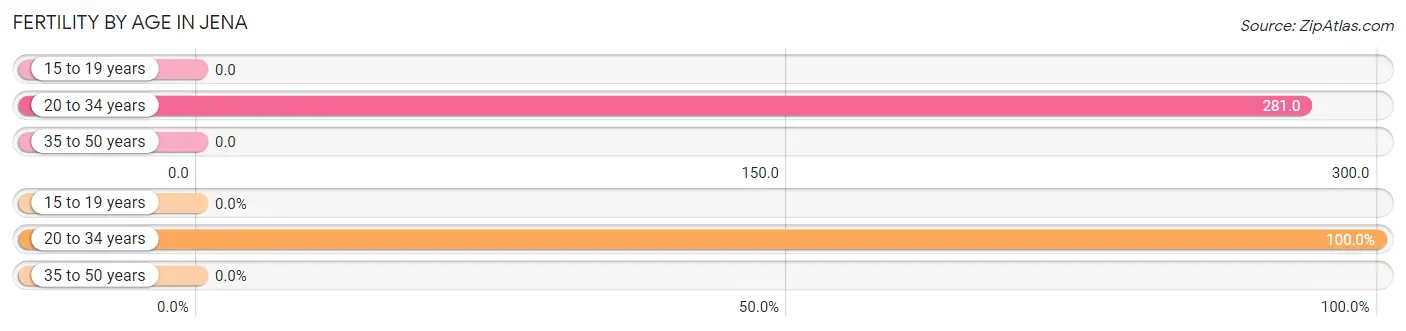
| Age Bracket | Women with Births | Births / 1,000 Women |
| 15 to 19 years | 0 (0.0%) | 0.0 |
| 20 to 34 years | 88 (100.0%) | 281.0 |
| 35 to 50 years | 0 (0.0%) | 0.0 |
| Total | 88 (100.0%) | 86.0 |
Fertility by Age by Marriage Status in Jena
94.3% of women with births (88) in Jena are married. The highest percentage of unmarried women with births falls into 20 to 34 years age bracket with 5.7% of them unmarried at the time of birth, while the lowest percentage of unmarried women with births belong to 20 to 34 years age bracket with 5.7% of them unmarried.
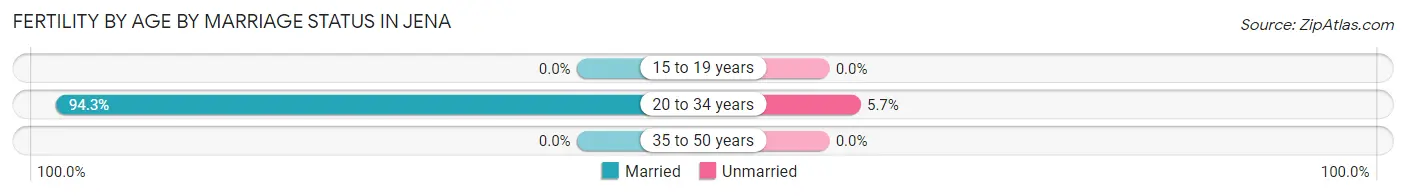
| Age Bracket | Married | Unmarried |
| 15 to 19 years | 0 (0.0%) | 0 (0.0%) |
| 20 to 34 years | 83 (94.3%) | 5 (5.7%) |
| 35 to 50 years | 0 (0.0%) | 0 (0.0%) |
| Total | 83 (94.3%) | 5 (5.7%) |
Fertility by Education in Jena
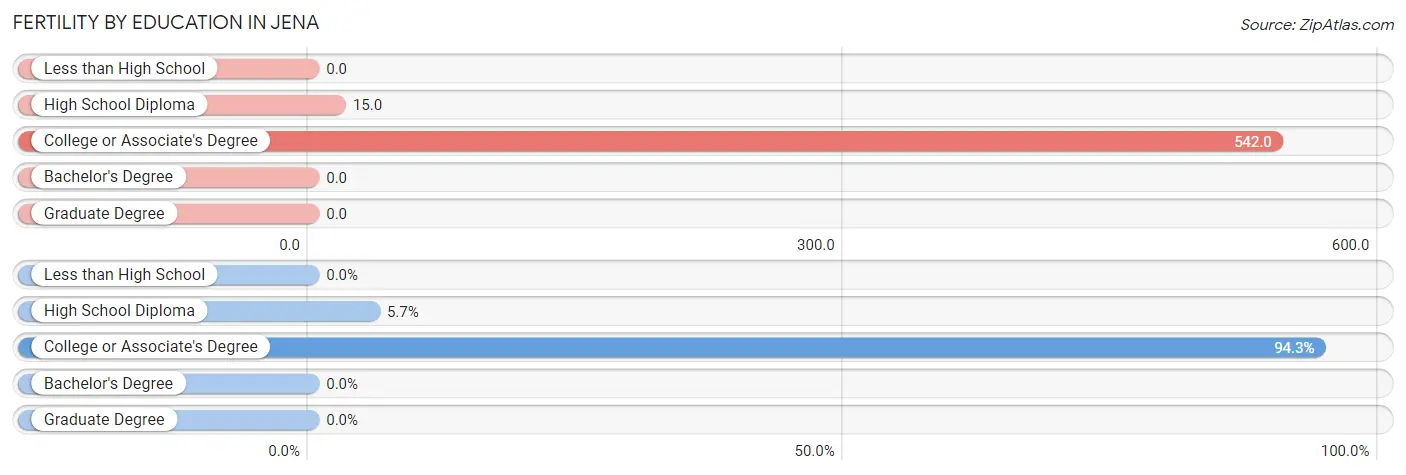
| Educational Attainment | Women with Births | Births / 1,000 Women |
| Less than High School | 0 (0.0%) | 0.0 |
| High School Diploma | 5 (5.7%) | 15.0 |
| College or Associate's Degree | 83 (94.3%) | 542.0 |
| Bachelor's Degree | 0 (0.0%) | 0.0 |
| Graduate Degree | 0 (0.0%) | 0.0 |
| Total | 88 (100.0%) | 86.0 |
Fertility by Education by Marriage Status in Jena
5.7% of women with births in Jena are unmarried. Women with the educational attainment of college or associate's degree are most likely to be married with 100.0% of them married at childbirth, while women with the educational attainment of high school diploma are least likely to be married with 100.0% of them unmarried at childbirth.
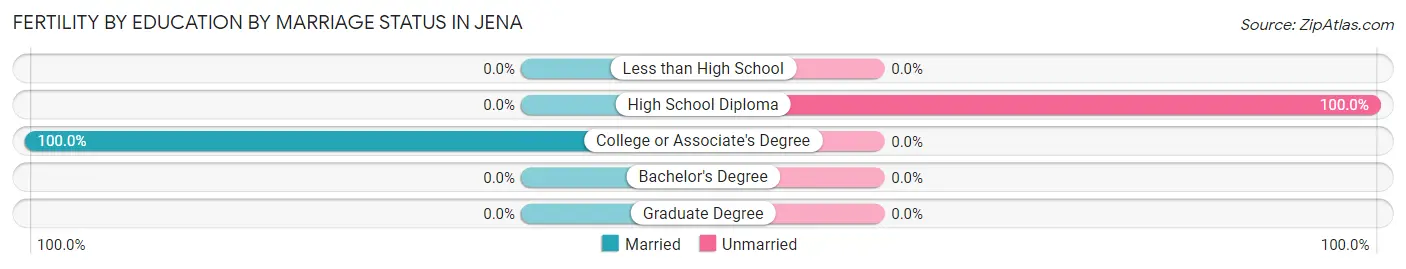
| Educational Attainment | Married | Unmarried |
| Less than High School | 0 (0.0%) | 0 (0.0%) |
| High School Diploma | 0 (0.0%) | 5 (100.0%) |
| College or Associate's Degree | 83 (100.0%) | 0 (0.0%) |
| Bachelor's Degree | 0 (0.0%) | 0 (0.0%) |
| Graduate Degree | 0 (0.0%) | 0 (0.0%) |
| Total | 83 (94.3%) | 5 (5.7%) |
Employment Characteristics in Jena
Employment by Class of Employer in Jena
Among the 2,046 employed individuals in Jena, private company employees (1,426 | 69.7%), self-employed (not incorporated) (196 | 9.6%), and state government employees (140 | 6.8%) make up the most common classes of employment.
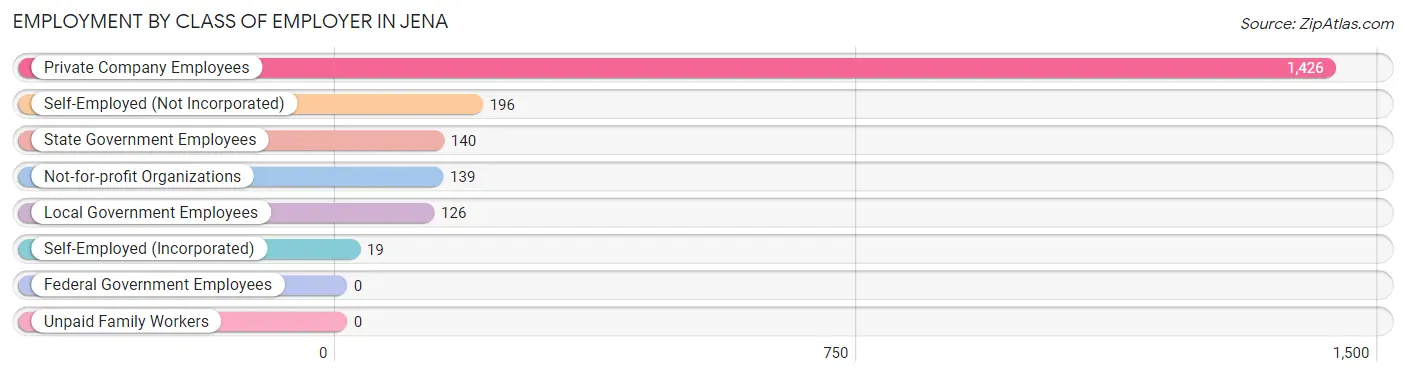
| Employer Class | # Employees | % Employees |
| Private Company Employees | 1,426 | 69.7% |
| Self-Employed (Incorporated) | 19 | 0.9% |
| Self-Employed (Not Incorporated) | 196 | 9.6% |
| Not-for-profit Organizations | 139 | 6.8% |
| Local Government Employees | 126 | 6.2% |
| State Government Employees | 140 | 6.8% |
| Federal Government Employees | 0 | 0.0% |
| Unpaid Family Workers | 0 | 0.0% |
| Total | 2,046 | 100.0% |
Employment Status by Age in Jena
According to the labor force statistics for Jena, out of the total population over 16 years of age (3,414), 62.4% or 2,130 individuals are in the labor force, with 3.9% or 83 of them unemployed. The age group with the highest labor force participation rate is 30 to 34 years, with 96.2% or 328 individuals in the labor force. Within the labor force, the 35 to 44 years age range has the highest percentage of unemployed individuals, with 29.3% or 83 of them being unemployed.
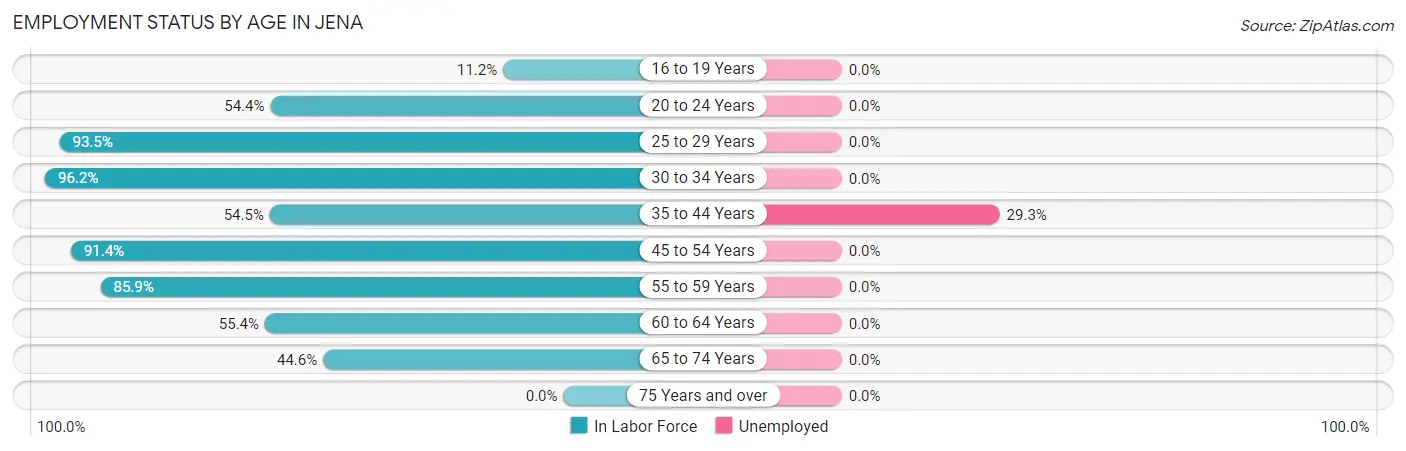
| Age Bracket | In Labor Force | Unemployed |
| 16 to 19 Years | 32 (11.2%) | 0 (0.0%) |
| 20 to 24 Years | 92 (54.4%) | 0 (0.0%) |
| 25 to 29 Years | 388 (93.5%) | 0 (0.0%) |
| 30 to 34 Years | 328 (96.2%) | 0 (0.0%) |
| 35 to 44 Years | 283 (54.5%) | 83 (29.3%) |
| 45 to 54 Years | 620 (91.4%) | 0 (0.0%) |
| 55 to 59 Years | 116 (85.9%) | 0 (0.0%) |
| 60 to 64 Years | 108 (55.4%) | 0 (0.0%) |
| 65 to 74 Years | 162 (44.6%) | 0 (0.0%) |
| 75 Years and over | 0 (0.0%) | 0 (0.0%) |
| Total | 2,130 (62.4%) | 83 (3.9%) |
Employment Status by Educational Attainment in Jena
According to labor force statistics for Jena, 80.7% of individuals (1,842) out of the total population between 25 and 64 years of age (2,283) are in the labor force, with 4.5% or 83 of them being unemployed. The group with the highest labor force participation rate are those with the educational attainment of bachelor's degree or higher, with 97.9% or 755 individuals in the labor force. Within the labor force, individuals with less than high school education have the highest percentage of unemployment, with 61.9% or 83 of them being unemployed.
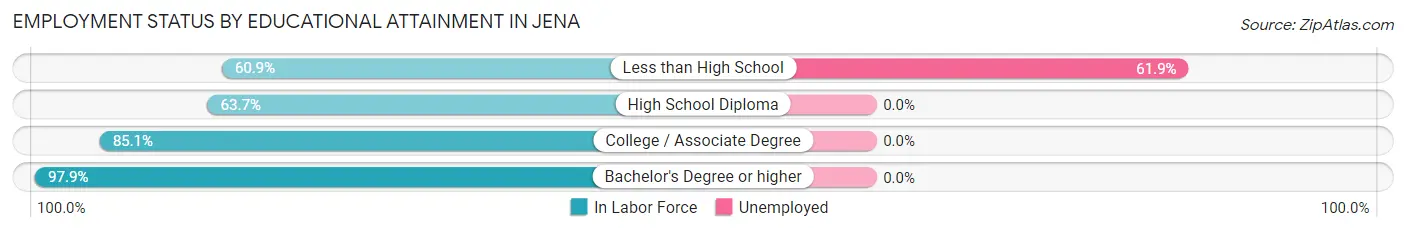
| Educational Attainment | In Labor Force | Unemployed |
| Less than High School | 134 (60.9%) | 136 (61.9%) |
| High School Diploma | 434 (63.7%) | 0 (0.0%) |
| College / Associate Degree | 520 (85.1%) | 0 (0.0%) |
| Bachelor's Degree or higher | 755 (97.9%) | 0 (0.0%) |
| Total | 1,842 (80.7%) | 103 (4.5%) |
Employment Occupations by Sex in Jena
Management, Business, Science and Arts Occupations
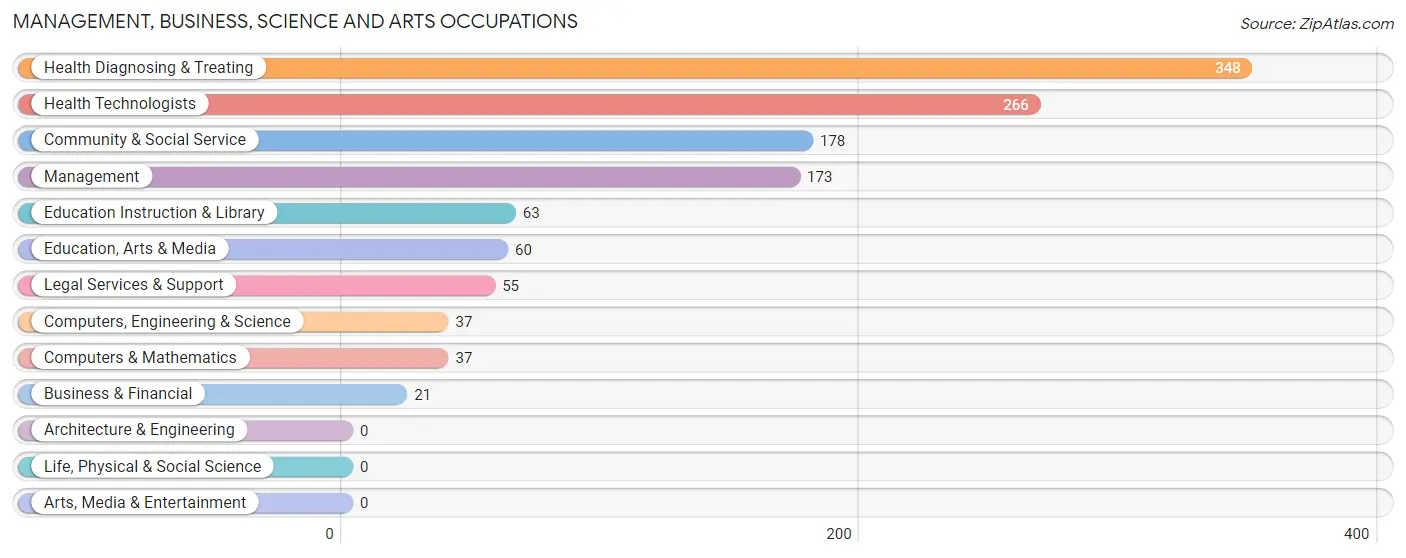
The most common Management, Business, Science and Arts occupations in Jena are Health Diagnosing & Treating (348 | 17.0%), Health Technologists (266 | 13.0%), Community & Social Service (178 | 8.7%), Management (173 | 8.5%), and Education Instruction & Library (63 | 3.1%).
Management, Business, Science and Arts Occupations by Sex
Within the Management, Business, Science and Arts occupations in Jena, the most male-oriented occupations are Business & Financial (100.0%), Computers, Engineering & Science (100.0%), and Computers & Mathematics (100.0%), while the most female-oriented occupations are Legal Services & Support (100.0%), Education Instruction & Library (100.0%), and Community & Social Service (91.0%).
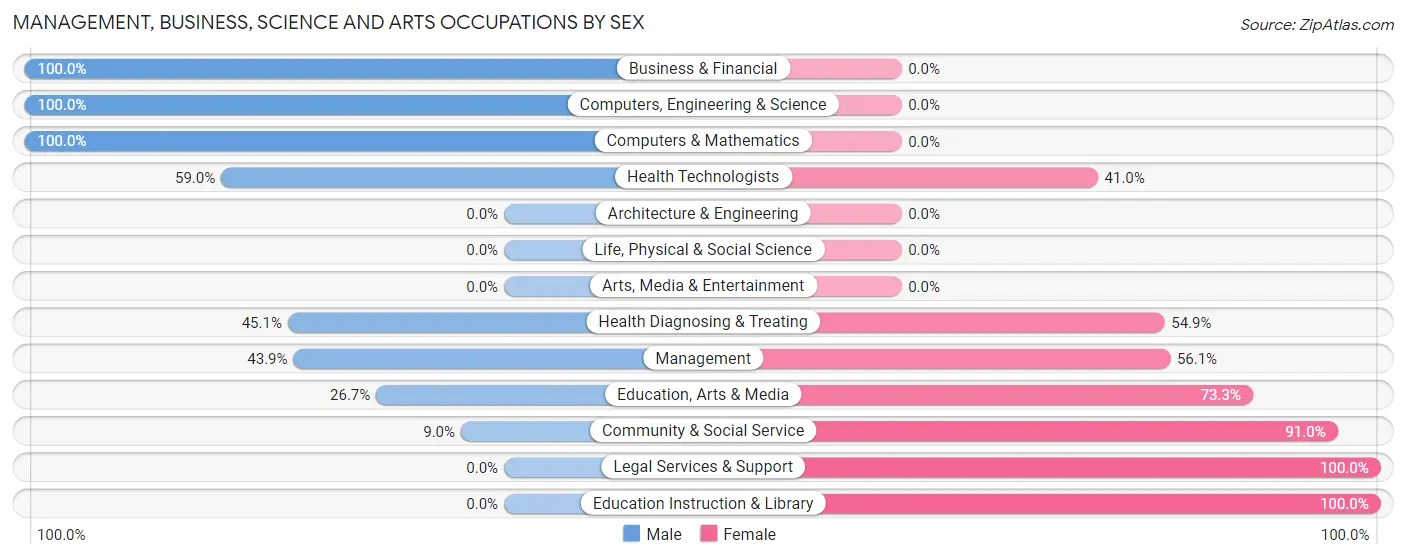
| Occupation | Male | Female |
| Management | 76 (43.9%) | 97 (56.1%) |
| Business & Financial | 21 (100.0%) | 0 (0.0%) |
| Computers, Engineering & Science | 37 (100.0%) | 0 (0.0%) |
| Computers & Mathematics | 37 (100.0%) | 0 (0.0%) |
| Architecture & Engineering | 0 (0.0%) | 0 (0.0%) |
| Life, Physical & Social Science | 0 (0.0%) | 0 (0.0%) |
| Community & Social Service | 16 (9.0%) | 162 (91.0%) |
| Education, Arts & Media | 16 (26.7%) | 44 (73.3%) |
| Legal Services & Support | 0 (0.0%) | 55 (100.0%) |
| Education Instruction & Library | 0 (0.0%) | 63 (100.0%) |
| Arts, Media & Entertainment | 0 (0.0%) | 0 (0.0%) |
| Health Diagnosing & Treating | 157 (45.1%) | 191 (54.9%) |
| Health Technologists | 157 (59.0%) | 109 (41.0%) |
| Total (Category) | 307 (40.6%) | 450 (59.5%) |
| Total (Overall) | 1,176 (57.5%) | 870 (42.5%) |
Services Occupations
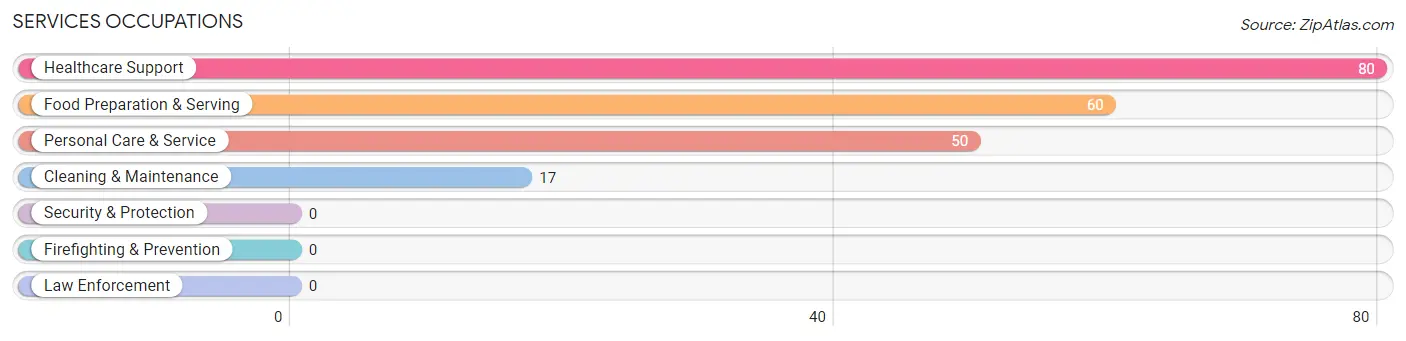
The most common Services occupations in Jena are Healthcare Support (80 | 3.9%), Food Preparation & Serving (60 | 2.9%), Personal Care & Service (50 | 2.4%), and Cleaning & Maintenance (17 | 0.8%).
Services Occupations by Sex
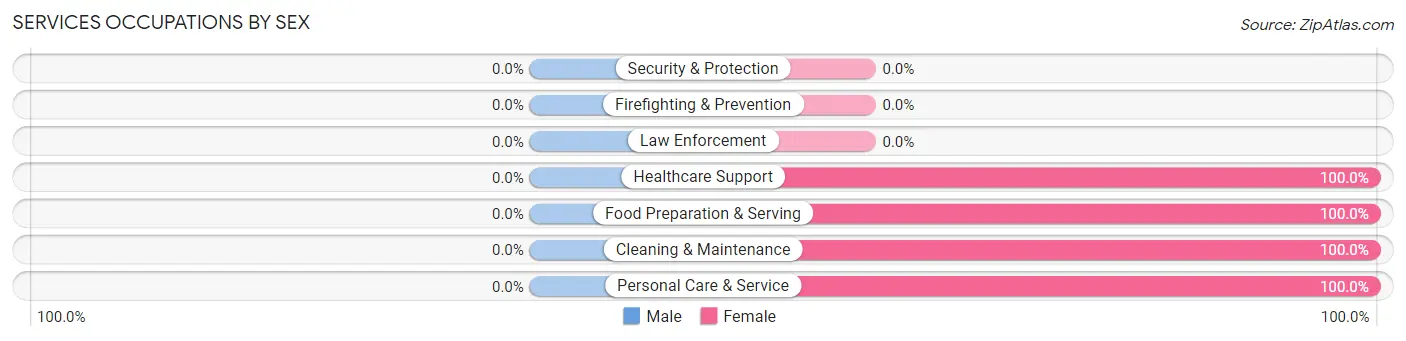
| Occupation | Male | Female |
| Healthcare Support | 0 (0.0%) | 80 (100.0%) |
| Security & Protection | 0 (0.0%) | 0 (0.0%) |
| Firefighting & Prevention | 0 (0.0%) | 0 (0.0%) |
| Law Enforcement | 0 (0.0%) | 0 (0.0%) |
| Food Preparation & Serving | 0 (0.0%) | 60 (100.0%) |
| Cleaning & Maintenance | 0 (0.0%) | 17 (100.0%) |
| Personal Care & Service | 0 (0.0%) | 50 (100.0%) |
| Total (Category) | 0 (0.0%) | 207 (100.0%) |
| Total (Overall) | 1,176 (57.5%) | 870 (42.5%) |
Sales and Office Occupations
The most common Sales and Office occupations in Jena are Sales & Related (456 | 22.3%), and Office & Administration (86 | 4.2%).

Sales and Office Occupations by Sex

| Occupation | Male | Female |
| Sales & Related | 281 (61.6%) | 175 (38.4%) |
| Office & Administration | 48 (55.8%) | 38 (44.2%) |
| Total (Category) | 329 (60.7%) | 213 (39.3%) |
| Total (Overall) | 1,176 (57.5%) | 870 (42.5%) |
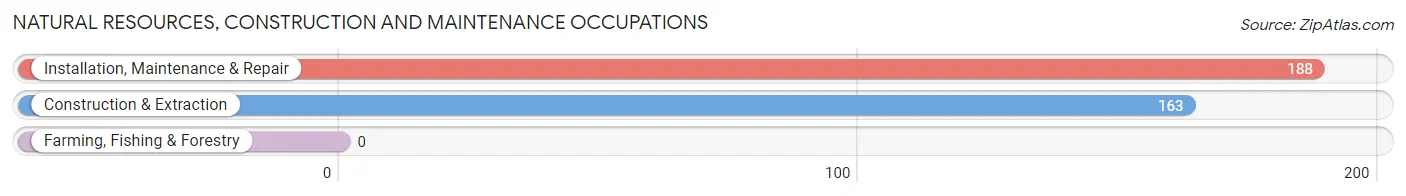
Natural Resources, Construction and Maintenance Occupations
The most common Natural Resources, Construction and Maintenance occupations in Jena are Installation, Maintenance & Repair (188 | 9.2%), and Construction & Extraction (163 | 8.0%).
Natural Resources, Construction and Maintenance Occupations by Sex
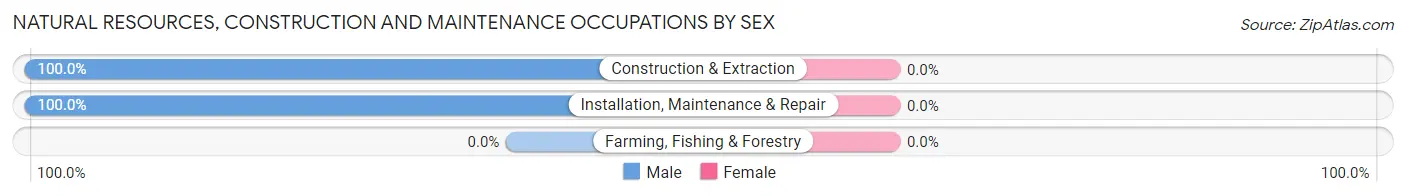
| Occupation | Male | Female |
| Farming, Fishing & Forestry | 0 (0.0%) | 0 (0.0%) |
| Construction & Extraction | 163 (100.0%) | 0 (0.0%) |
| Installation, Maintenance & Repair | 188 (100.0%) | 0 (0.0%) |
| Total (Category) | 351 (100.0%) | 0 (0.0%) |
| Total (Overall) | 1,176 (57.5%) | 870 (42.5%) |
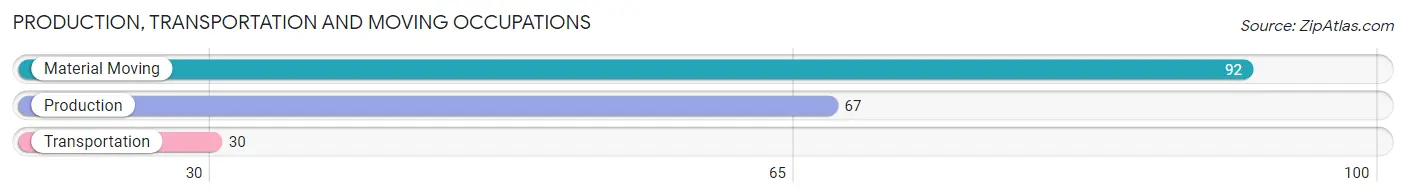
Production, Transportation and Moving Occupations
The most common Production, Transportation and Moving occupations in Jena are Material Moving (92 | 4.5%), Production (67 | 3.3%), and Transportation (30 | 1.5%).
Production, Transportation and Moving Occupations by Sex
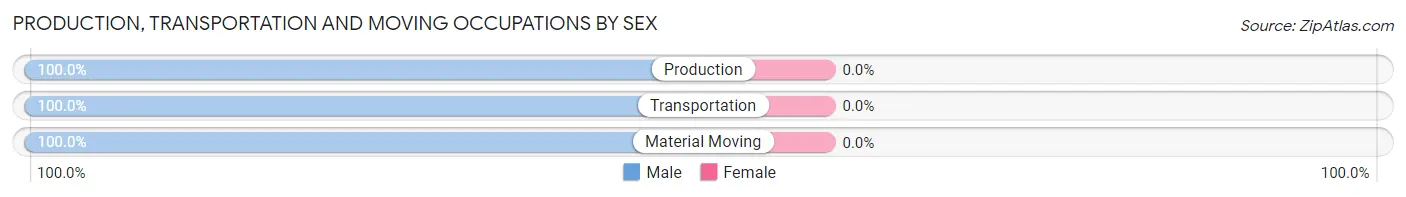
| Occupation | Male | Female |
| Production | 67 (100.0%) | 0 (0.0%) |
| Transportation | 30 (100.0%) | 0 (0.0%) |
| Material Moving | 92 (100.0%) | 0 (0.0%) |
| Total (Category) | 189 (100.0%) | 0 (0.0%) |
| Total (Overall) | 1,176 (57.5%) | 870 (42.5%) |
Employment Industries by Sex in Jena
Employment Industries in Jena
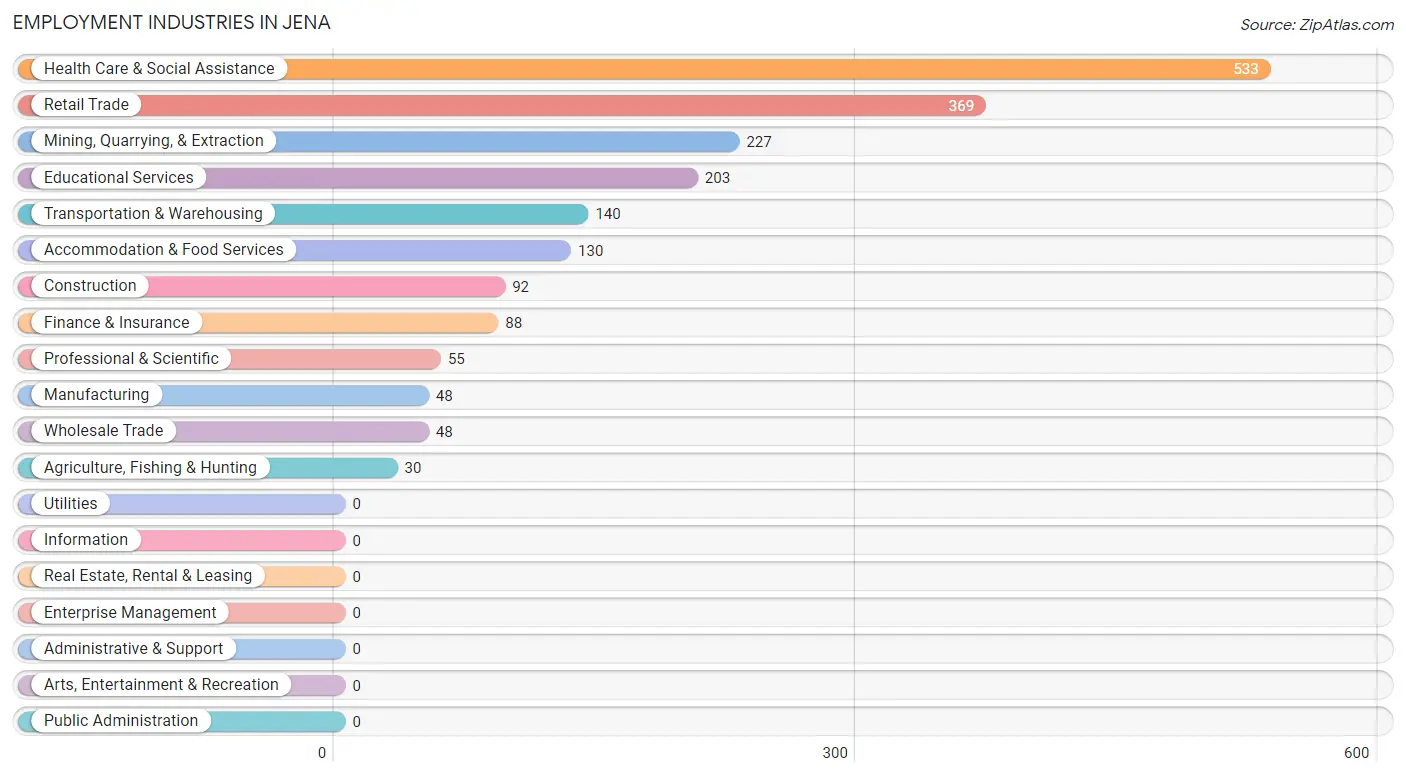
The major employment industries in Jena include Health Care & Social Assistance (533 | 26.1%), Retail Trade (369 | 18.0%), Mining, Quarrying, & Extraction (227 | 11.1%), Educational Services (203 | 9.9%), and Transportation & Warehousing (140 | 6.8%).
Employment Industries by Sex in Jena
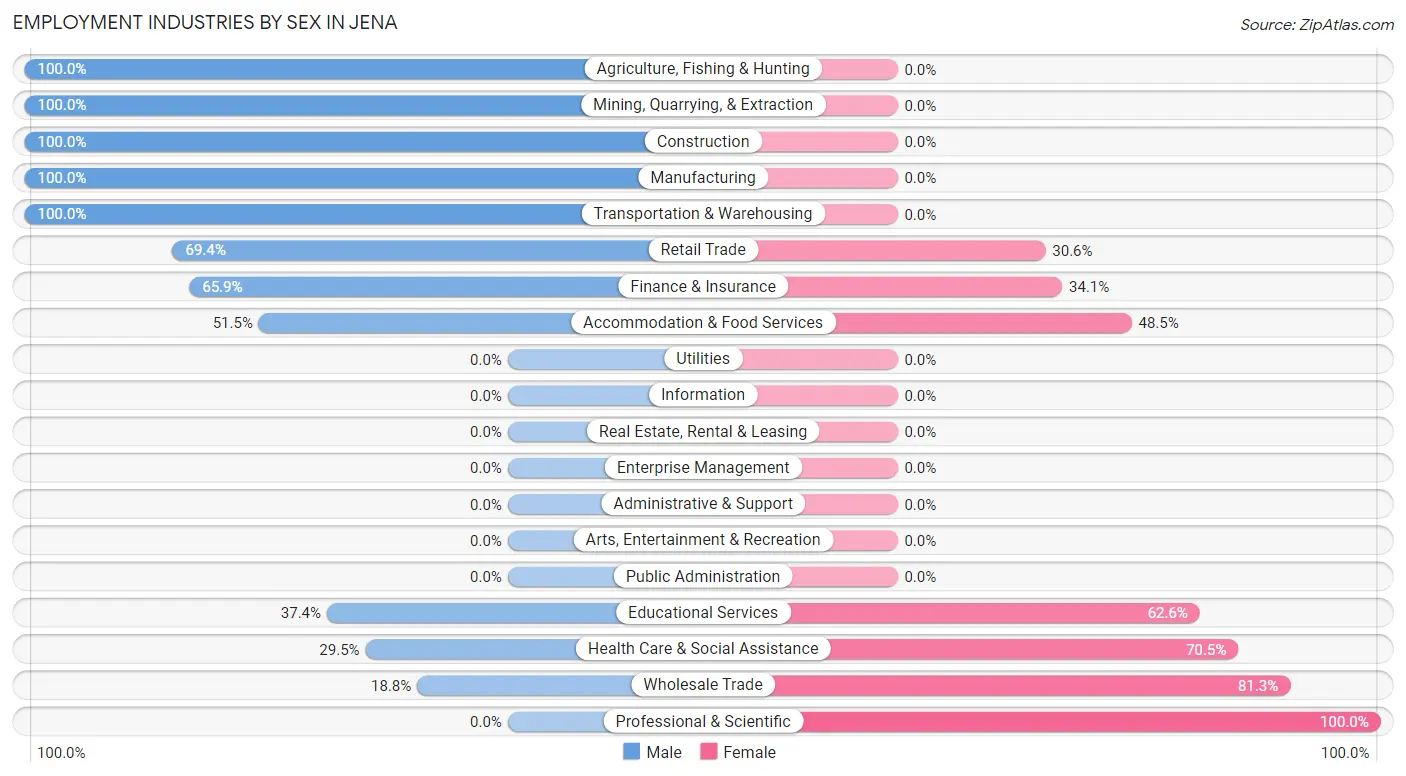
The Jena industries that see more men than women are Agriculture, Fishing & Hunting (100.0%), Mining, Quarrying, & Extraction (100.0%), and Construction (100.0%), whereas the industries that tend to have a higher number of women are Professional & Scientific (100.0%), Wholesale Trade (81.2%), and Health Care & Social Assistance (70.5%).
| Industry | Male | Female |
| Agriculture, Fishing & Hunting | 30 (100.0%) | 0 (0.0%) |
| Mining, Quarrying, & Extraction | 227 (100.0%) | 0 (0.0%) |
| Construction | 92 (100.0%) | 0 (0.0%) |
| Manufacturing | 48 (100.0%) | 0 (0.0%) |
| Wholesale Trade | 9 (18.8%) | 39 (81.2%) |
| Retail Trade | 256 (69.4%) | 113 (30.6%) |
| Transportation & Warehousing | 140 (100.0%) | 0 (0.0%) |
| Utilities | 0 (0.0%) | 0 (0.0%) |
| Information | 0 (0.0%) | 0 (0.0%) |
| Finance & Insurance | 58 (65.9%) | 30 (34.1%) |
| Real Estate, Rental & Leasing | 0 (0.0%) | 0 (0.0%) |
| Professional & Scientific | 0 (0.0%) | 55 (100.0%) |
| Enterprise Management | 0 (0.0%) | 0 (0.0%) |
| Administrative & Support | 0 (0.0%) | 0 (0.0%) |
| Educational Services | 76 (37.4%) | 127 (62.6%) |
| Health Care & Social Assistance | 157 (29.5%) | 376 (70.5%) |
| Arts, Entertainment & Recreation | 0 (0.0%) | 0 (0.0%) |
| Accommodation & Food Services | 67 (51.5%) | 63 (48.5%) |
| Public Administration | 0 (0.0%) | 0 (0.0%) |
| Total | 1,176 (57.5%) | 870 (42.5%) |
Education in Jena
School Enrollment in Jena
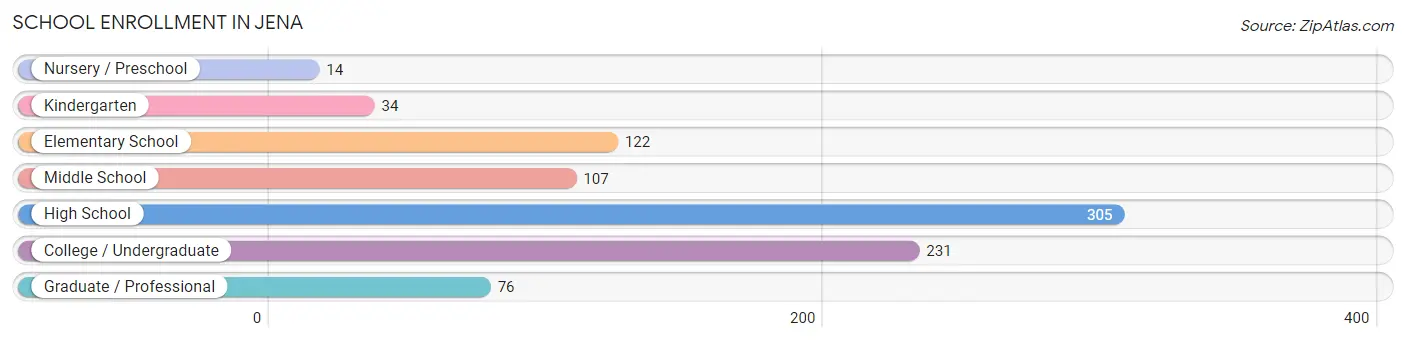
The most common levels of schooling among the 889 students in Jena are high school (305 | 34.3%), college / undergraduate (231 | 26.0%), and elementary school (122 | 13.7%).
| School Level | # Students | % Students |
| Nursery / Preschool | 14 | 1.6% |
| Kindergarten | 34 | 3.8% |
| Elementary School | 122 | 13.7% |
| Middle School | 107 | 12.0% |
| High School | 305 | 34.3% |
| College / Undergraduate | 231 | 26.0% |
| Graduate / Professional | 76 | 8.6% |
| Total | 889 | 100.0% |
School Enrollment by Age by Funding Source in Jena
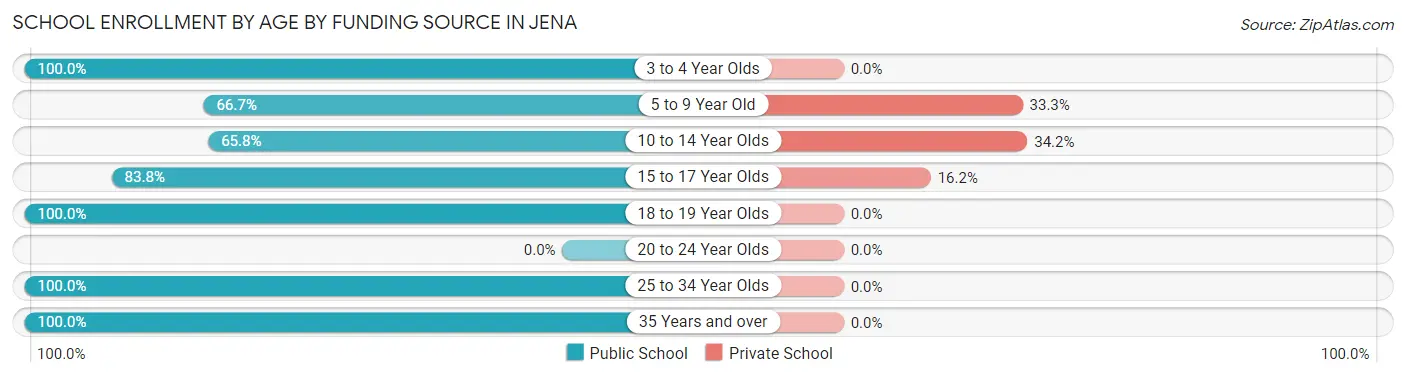
Out of a total of 889 students who are enrolled in schools in Jena, 152 (17.1%) attend a private institution, while the remaining 737 (82.9%) are enrolled in public schools. The age group of 10 to 14 year olds has the highest likelihood of being enrolled in private schools, with 65 (34.2% in the age bracket) enrolled. Conversely, the age group of 3 to 4 year olds has the lowest likelihood of being enrolled in a private school, with 17 (100.0% in the age bracket) attending a public institution.
| Age Bracket | Public School | Private School |
| 3 to 4 Year Olds | 17 (100.0%) | 0 (0.0%) |
| 5 to 9 Year Old | 102 (66.7%) | 51 (33.3%) |
| 10 to 14 Year Olds | 125 (65.8%) | 65 (34.2%) |
| 15 to 17 Year Olds | 186 (83.8%) | 36 (16.2%) |
| 18 to 19 Year Olds | 35 (100.0%) | 0 (0.0%) |
| 20 to 24 Year Olds | 0 (0.0%) | 0 (0.0%) |
| 25 to 34 Year Olds | 122 (100.0%) | 0 (0.0%) |
| 35 Years and over | 150 (100.0%) | 0 (0.0%) |
| Total | 737 (82.9%) | 152 (17.1%) |
Educational Attainment by Field of Study in Jena
Education (174 | 19.3%), liberal arts & history (162 | 18.0%), engineering (156 | 17.3%), science & technology (138 | 15.3%), and physical & health sciences (57 | 6.3%) are the most common fields of study among 900 individuals in Jena who have obtained a bachelor's degree or higher.
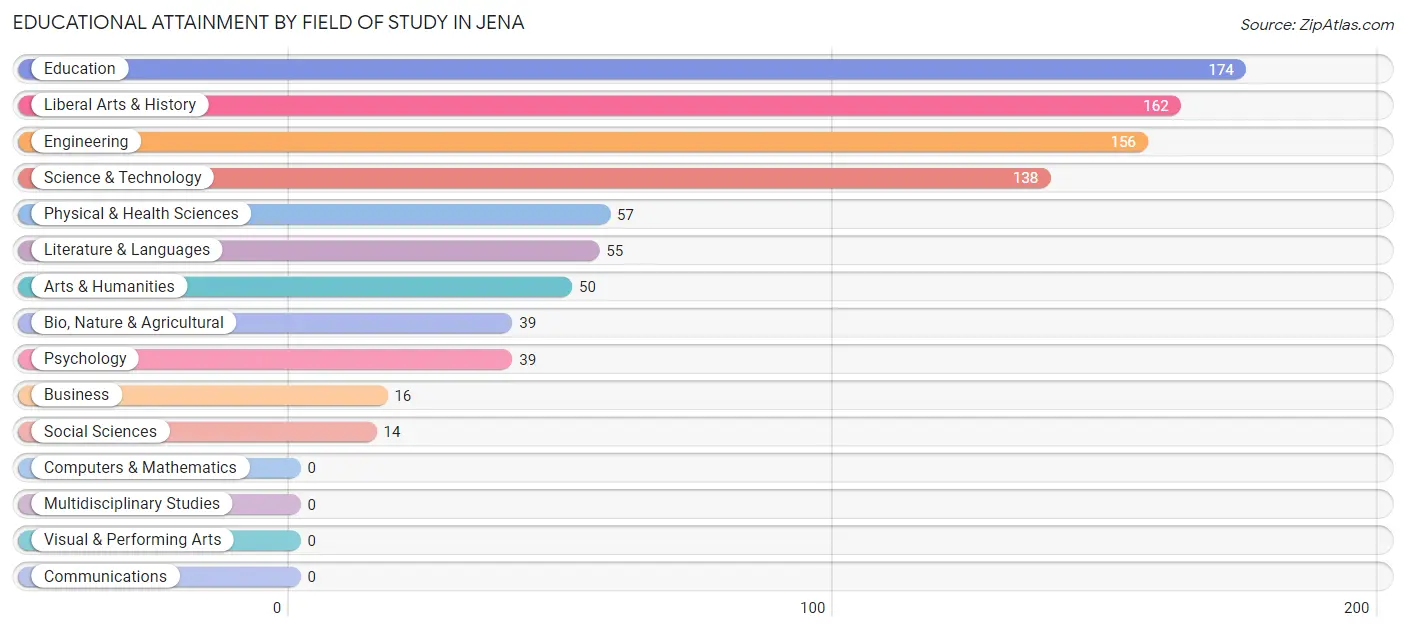
| Field of Study | # Graduates | % Graduates |
| Computers & Mathematics | 0 | 0.0% |
| Bio, Nature & Agricultural | 39 | 4.3% |
| Physical & Health Sciences | 57 | 6.3% |
| Psychology | 39 | 4.3% |
| Social Sciences | 14 | 1.6% |
| Engineering | 156 | 17.3% |
| Multidisciplinary Studies | 0 | 0.0% |
| Science & Technology | 138 | 15.3% |
| Business | 16 | 1.8% |
| Education | 174 | 19.3% |
| Literature & Languages | 55 | 6.1% |
| Liberal Arts & History | 162 | 18.0% |
| Visual & Performing Arts | 0 | 0.0% |
| Communications | 0 | 0.0% |
| Arts & Humanities | 50 | 5.6% |
| Total | 900 | 100.0% |
Transportation & Commute in Jena
Vehicle Availability by Sex in Jena
The most prevalent vehicle ownership categories in Jena are males with 2 vehicles (811, accounting for 69.0%) and females with 2 vehicles (430, making up 93.2%).
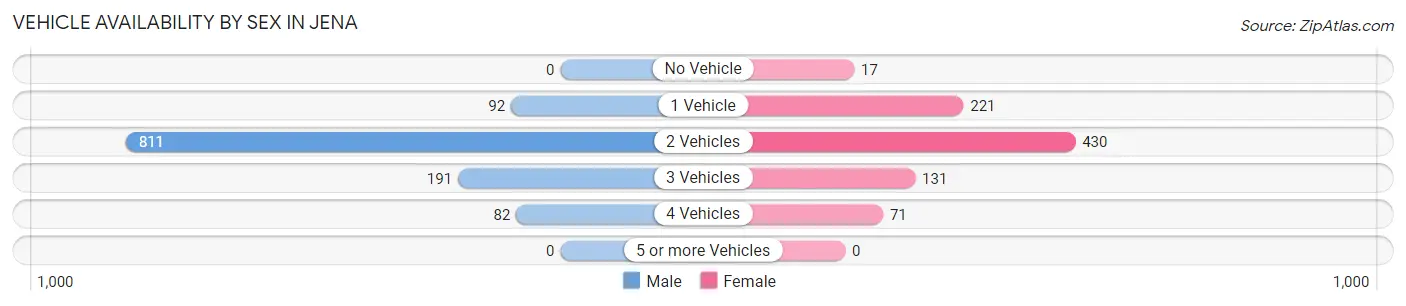
| Vehicles Available | Male | Female |
| No Vehicle | 0 (0.0%) | 17 (1.9%) |
| 1 Vehicle | 92 (7.8%) | 221 (25.4%) |
| 2 Vehicles | 811 (69.0%) | 430 (49.4%) |
| 3 Vehicles | 191 (16.2%) | 131 (15.1%) |
| 4 Vehicles | 82 (7.0%) | 71 (8.2%) |
| 5 or more Vehicles | 0 (0.0%) | 0 (0.0%) |
| Total | 1,176 (100.0%) | 870 (100.0%) |
Commute Time in Jena
The most frequently occuring commute durations in Jena are 5 to 9 minutes (595 commuters, 30.4%), 45 to 59 minutes (366 commuters, 18.7%), and 10 to 14 minutes (351 commuters, 18.0%).
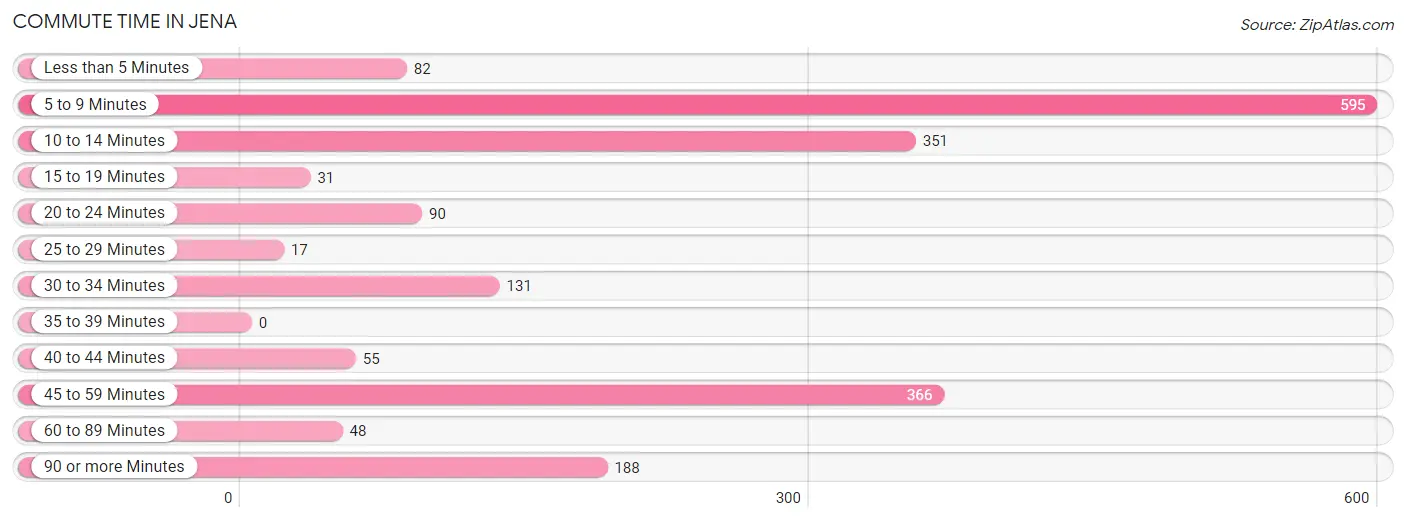
| Commute Time | # Commuters | % Commuters |
| Less than 5 Minutes | 82 | 4.2% |
| 5 to 9 Minutes | 595 | 30.4% |
| 10 to 14 Minutes | 351 | 18.0% |
| 15 to 19 Minutes | 31 | 1.6% |
| 20 to 24 Minutes | 90 | 4.6% |
| 25 to 29 Minutes | 17 | 0.9% |
| 30 to 34 Minutes | 131 | 6.7% |
| 35 to 39 Minutes | 0 | 0.0% |
| 40 to 44 Minutes | 55 | 2.8% |
| 45 to 59 Minutes | 366 | 18.7% |
| 60 to 89 Minutes | 48 | 2.5% |
| 90 or more Minutes | 188 | 9.6% |
Commute Time by Sex in Jena
The most common commute times in Jena are 10 to 14 minutes (237 commuters, 20.6%) for males and 5 to 9 minutes (370 commuters, 46.0%) for females.
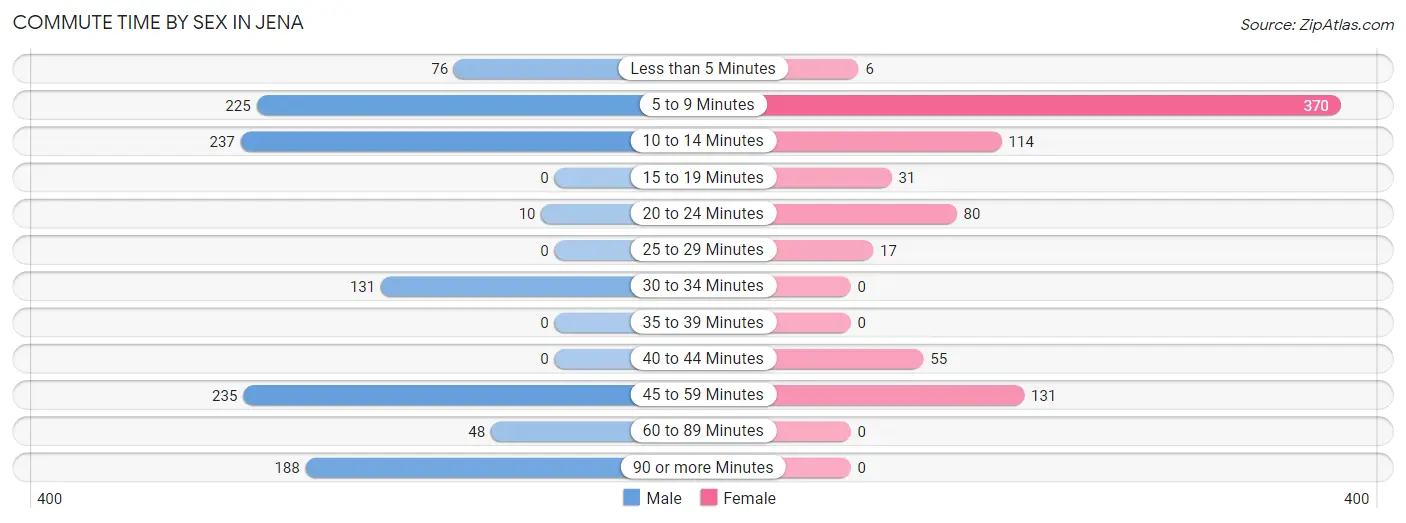
| Commute Time | Male | Female |
| Less than 5 Minutes | 76 (6.6%) | 6 (0.7%) |
| 5 to 9 Minutes | 225 (19.6%) | 370 (46.0%) |
| 10 to 14 Minutes | 237 (20.6%) | 114 (14.2%) |
| 15 to 19 Minutes | 0 (0.0%) | 31 (3.9%) |
| 20 to 24 Minutes | 10 (0.9%) | 80 (10.0%) |
| 25 to 29 Minutes | 0 (0.0%) | 17 (2.1%) |
| 30 to 34 Minutes | 131 (11.4%) | 0 (0.0%) |
| 35 to 39 Minutes | 0 (0.0%) | 0 (0.0%) |
| 40 to 44 Minutes | 0 (0.0%) | 55 (6.8%) |
| 45 to 59 Minutes | 235 (20.4%) | 131 (16.3%) |
| 60 to 89 Minutes | 48 (4.2%) | 0 (0.0%) |
| 90 or more Minutes | 188 (16.4%) | 0 (0.0%) |
Time of Departure to Work by Sex in Jena
The most frequent times of departure to work in Jena are 5:00 AM to 5:29 AM (252, 21.9%) for males and 7:00 AM to 7:29 AM (216, 26.9%) for females.
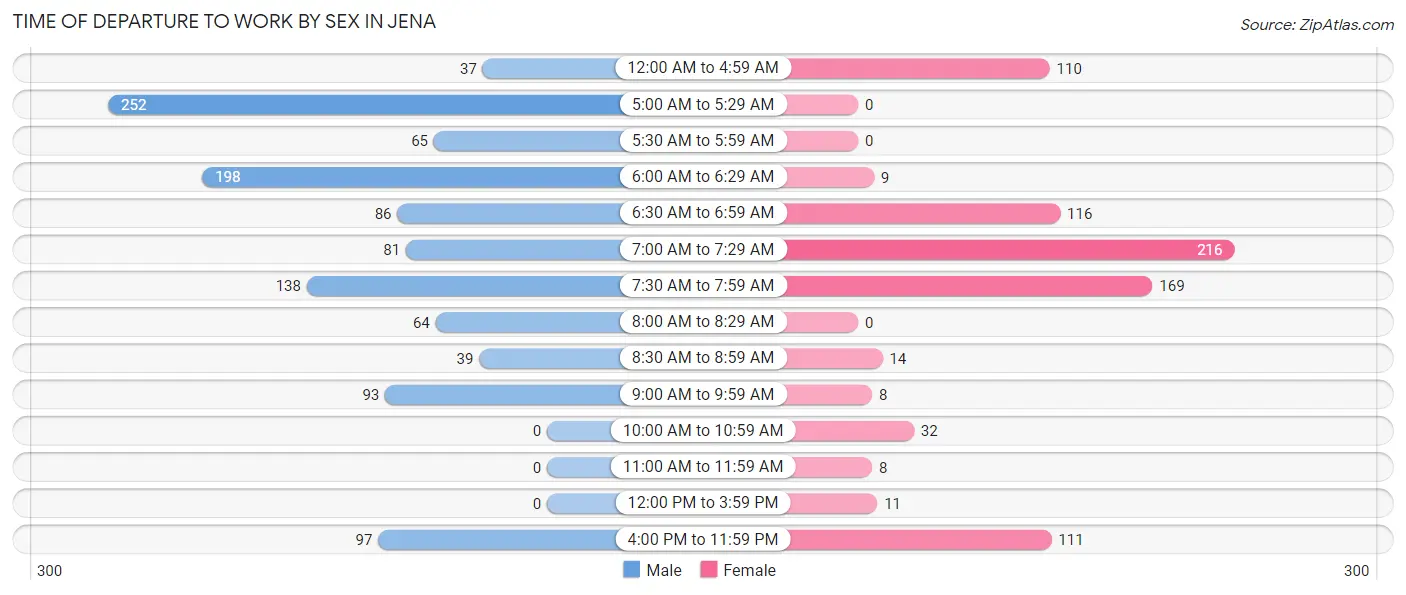
| Time of Departure | Male | Female |
| 12:00 AM to 4:59 AM | 37 (3.2%) | 110 (13.7%) |
| 5:00 AM to 5:29 AM | 252 (21.9%) | 0 (0.0%) |
| 5:30 AM to 5:59 AM | 65 (5.7%) | 0 (0.0%) |
| 6:00 AM to 6:29 AM | 198 (17.2%) | 9 (1.1%) |
| 6:30 AM to 6:59 AM | 86 (7.5%) | 116 (14.4%) |
| 7:00 AM to 7:29 AM | 81 (7.0%) | 216 (26.9%) |
| 7:30 AM to 7:59 AM | 138 (12.0%) | 169 (21.0%) |
| 8:00 AM to 8:29 AM | 64 (5.6%) | 0 (0.0%) |
| 8:30 AM to 8:59 AM | 39 (3.4%) | 14 (1.7%) |
| 9:00 AM to 9:59 AM | 93 (8.1%) | 8 (1.0%) |
| 10:00 AM to 10:59 AM | 0 (0.0%) | 32 (4.0%) |
| 11:00 AM to 11:59 AM | 0 (0.0%) | 8 (1.0%) |
| 12:00 PM to 3:59 PM | 0 (0.0%) | 11 (1.4%) |
| 4:00 PM to 11:59 PM | 97 (8.4%) | 111 (13.8%) |
| Total | 1,150 (100.0%) | 804 (100.0%) |
Housing Occupancy in Jena
Occupancy by Ownership in Jena
Of the total 1,500 dwellings in Jena, owner-occupied units account for 1,360 (90.7%), while renter-occupied units make up 140 (9.3%).
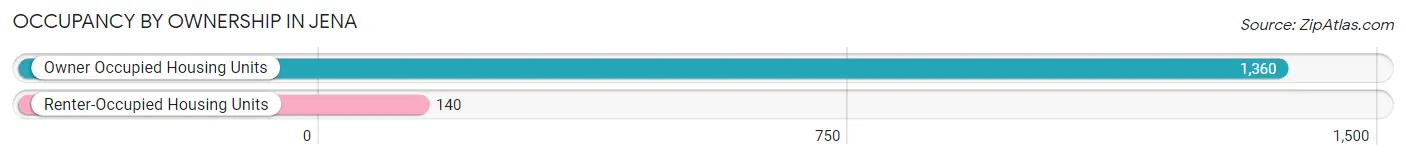
| Occupancy | # Housing Units | % Housing Units |
| Owner Occupied Housing Units | 1,360 | 90.7% |
| Renter-Occupied Housing Units | 140 | 9.3% |
| Total Occupied Housing Units | 1,500 | 100.0% |
Occupancy by Household Size in Jena
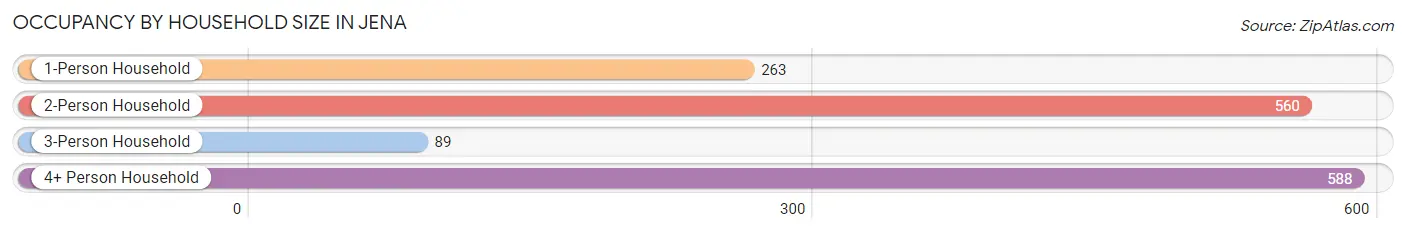
| Household Size | # Housing Units | % Housing Units |
| 1-Person Household | 263 | 17.5% |
| 2-Person Household | 560 | 37.3% |
| 3-Person Household | 89 | 5.9% |
| 4+ Person Household | 588 | 39.2% |
| Total Housing Units | 1,500 | 100.0% |
Occupancy by Ownership by Household Size in Jena
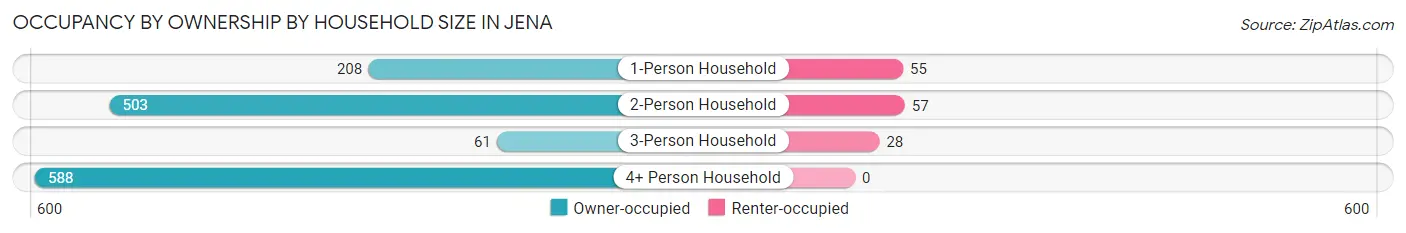
| Household Size | Owner-occupied | Renter-occupied |
| 1-Person Household | 208 (79.1%) | 55 (20.9%) |
| 2-Person Household | 503 (89.8%) | 57 (10.2%) |
| 3-Person Household | 61 (68.5%) | 28 (31.5%) |
| 4+ Person Household | 588 (100.0%) | 0 (0.0%) |
| Total Housing Units | 1,360 (90.7%) | 140 (9.3%) |
Occupancy by Educational Attainment in Jena
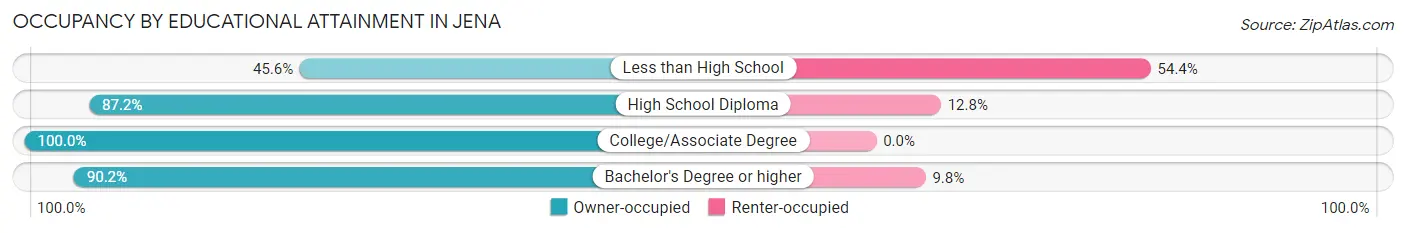
| Household Size | Owner-occupied | Renter-occupied |
| Less than High School | 31 (45.6%) | 37 (54.4%) |
| High School Diploma | 327 (87.2%) | 48 (12.8%) |
| College/Associate Degree | 494 (100.0%) | 0 (0.0%) |
| Bachelor's Degree or higher | 508 (90.2%) | 55 (9.8%) |
Occupancy by Age of Householder in Jena
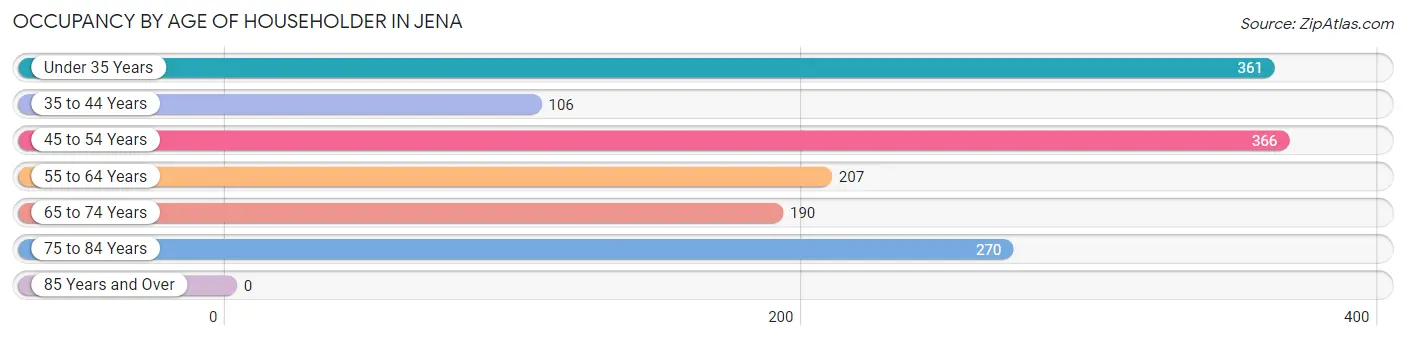
| Age Bracket | # Households | % Households |
| Under 35 Years | 361 | 24.1% |
| 35 to 44 Years | 106 | 7.1% |
| 45 to 54 Years | 366 | 24.4% |
| 55 to 64 Years | 207 | 13.8% |
| 65 to 74 Years | 190 | 12.7% |
| 75 to 84 Years | 270 | 18.0% |
| 85 Years and Over | 0 | 0.0% |
| Total | 1,500 | 100.0% |
Housing Finances in Jena
Median Income by Occupancy in Jena
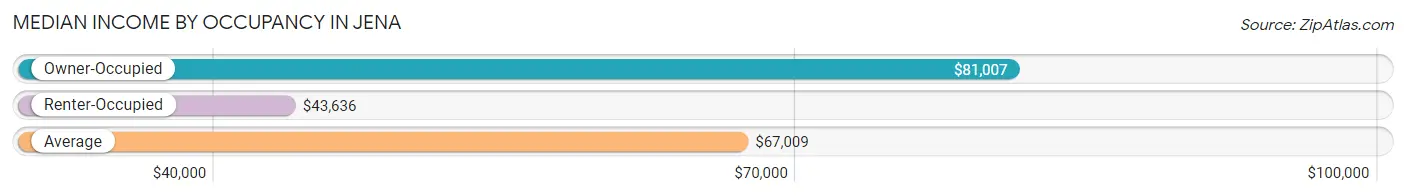
| Occupancy Type | # Households | Median Income |
| Owner-Occupied | 1,360 (90.7%) | $81,007 |
| Renter-Occupied | 140 (9.3%) | $43,636 |
| Average | 1,500 (100.0%) | $67,009 |
Occupancy by Householder Income Bracket in Jena
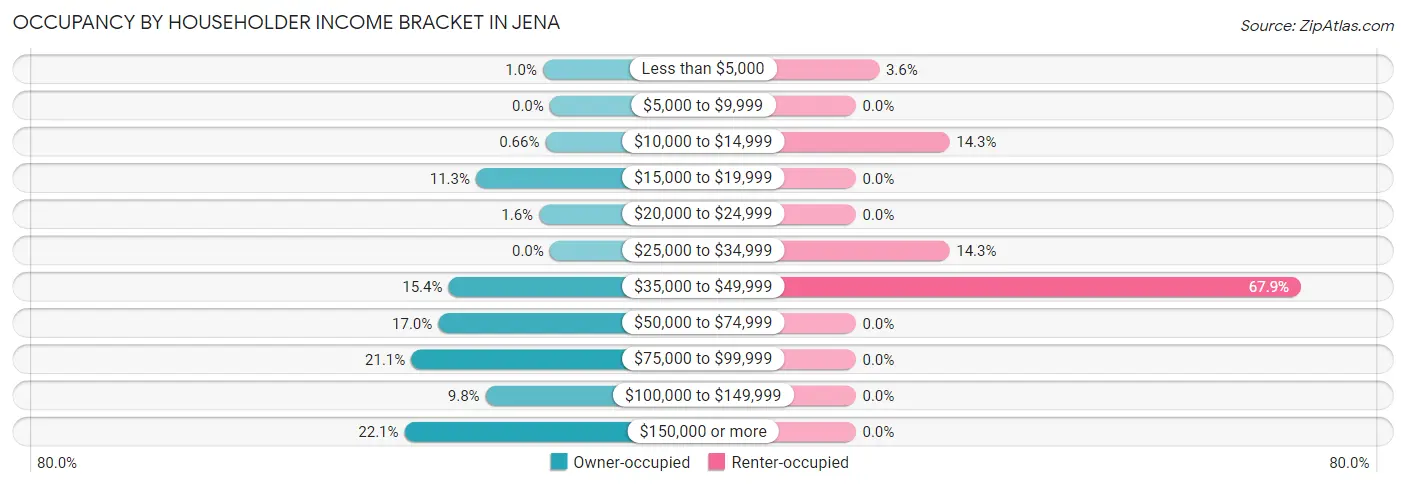
| Income Bracket | Owner-occupied | Renter-occupied |
| Less than $5,000 | 14 (1.0%) | 5 (3.6%) |
| $5,000 to $9,999 | 0 (0.0%) | 0 (0.0%) |
| $10,000 to $14,999 | 9 (0.7%) | 20 (14.3%) |
| $15,000 to $19,999 | 153 (11.3%) | 0 (0.0%) |
| $20,000 to $24,999 | 22 (1.6%) | 0 (0.0%) |
| $25,000 to $34,999 | 0 (0.0%) | 20 (14.3%) |
| $35,000 to $49,999 | 210 (15.4%) | 95 (67.9%) |
| $50,000 to $74,999 | 231 (17.0%) | 0 (0.0%) |
| $75,000 to $99,999 | 287 (21.1%) | 0 (0.0%) |
| $100,000 to $149,999 | 133 (9.8%) | 0 (0.0%) |
| $150,000 or more | 301 (22.1%) | 0 (0.0%) |
| Total | 1,360 (100.0%) | 140 (100.0%) |
Monthly Housing Cost Tiers in Jena
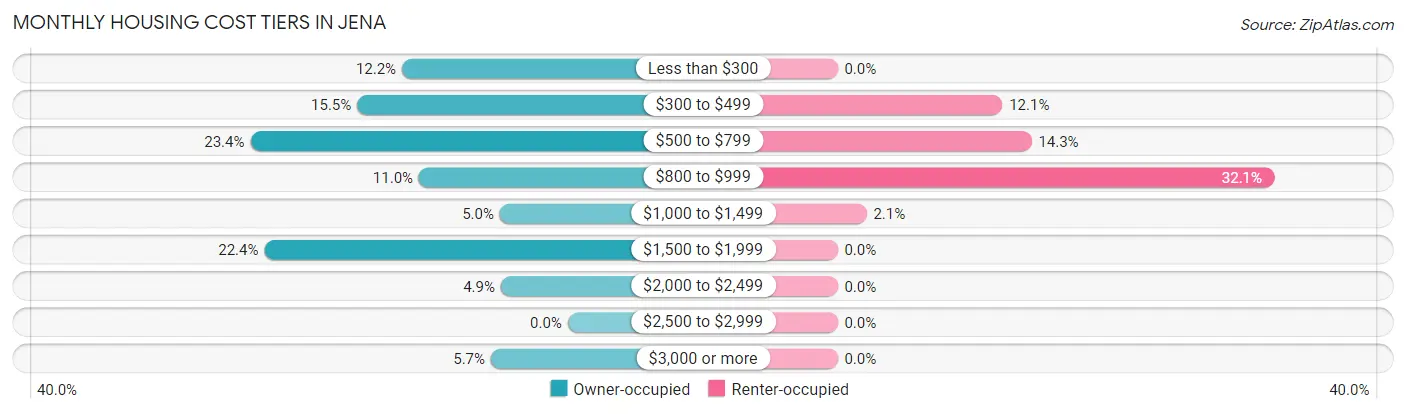
| Monthly Cost | Owner-occupied | Renter-occupied |
| Less than $300 | 166 (12.2%) | 0 (0.0%) |
| $300 to $499 | 211 (15.5%) | 17 (12.1%) |
| $500 to $799 | 318 (23.4%) | 20 (14.3%) |
| $800 to $999 | 149 (11.0%) | 45 (32.1%) |
| $1,000 to $1,499 | 68 (5.0%) | 3 (2.1%) |
| $1,500 to $1,999 | 304 (22.4%) | 0 (0.0%) |
| $2,000 to $2,499 | 67 (4.9%) | 0 (0.0%) |
| $2,500 to $2,999 | 0 (0.0%) | 0 (0.0%) |
| $3,000 or more | 77 (5.7%) | 0 (0.0%) |
| Total | 1,360 (100.0%) | 140 (100.0%) |
Physical Housing Characteristics in Jena
Housing Structures in Jena
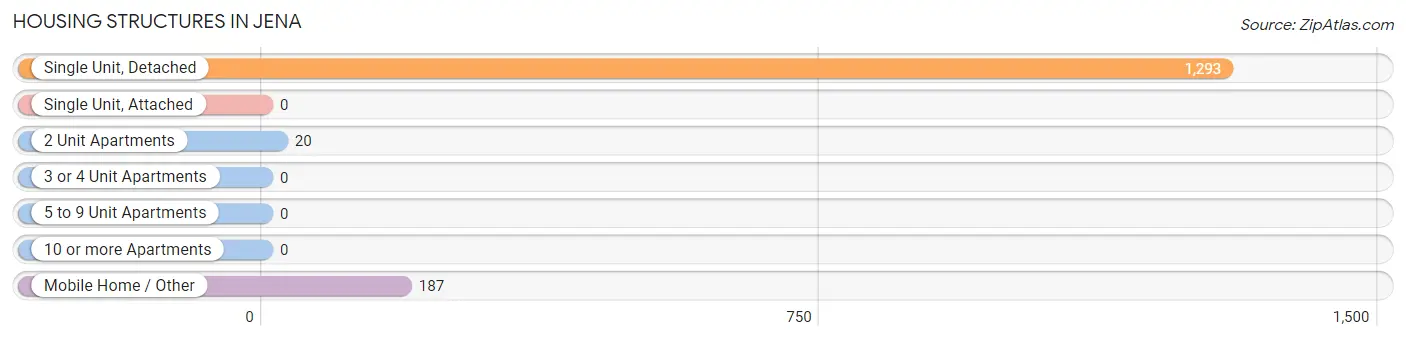
| Structure Type | # Housing Units | % Housing Units |
| Single Unit, Detached | 1,293 | 86.2% |
| Single Unit, Attached | 0 | 0.0% |
| 2 Unit Apartments | 20 | 1.3% |
| 3 or 4 Unit Apartments | 0 | 0.0% |
| 5 to 9 Unit Apartments | 0 | 0.0% |
| 10 or more Apartments | 0 | 0.0% |
| Mobile Home / Other | 187 | 12.5% |
| Total | 1,500 | 100.0% |
Housing Structures by Occupancy in Jena
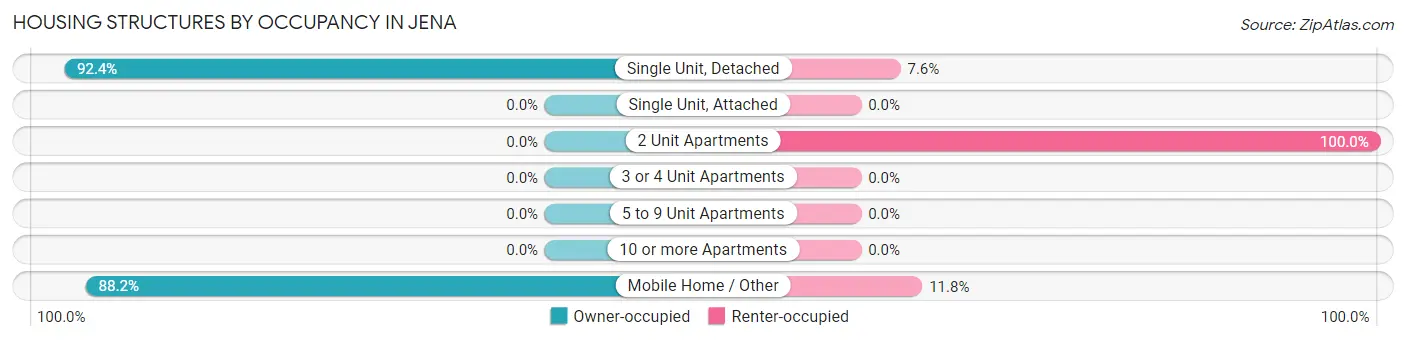
| Structure Type | Owner-occupied | Renter-occupied |
| Single Unit, Detached | 1,195 (92.4%) | 98 (7.6%) |
| Single Unit, Attached | 0 (0.0%) | 0 (0.0%) |
| 2 Unit Apartments | 0 (0.0%) | 20 (100.0%) |
| 3 or 4 Unit Apartments | 0 (0.0%) | 0 (0.0%) |
| 5 to 9 Unit Apartments | 0 (0.0%) | 0 (0.0%) |
| 10 or more Apartments | 0 (0.0%) | 0 (0.0%) |
| Mobile Home / Other | 165 (88.2%) | 22 (11.8%) |
| Total | 1,360 (90.7%) | 140 (9.3%) |
Housing Structures by Number of Rooms in Jena
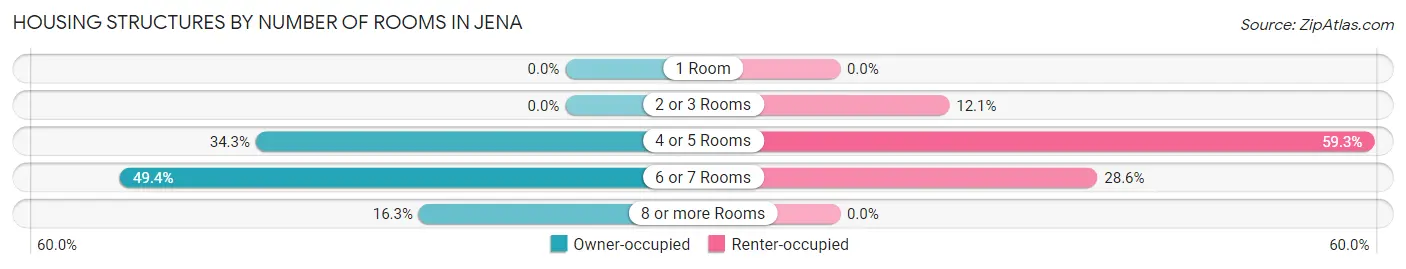
| Number of Rooms | Owner-occupied | Renter-occupied |
| 1 Room | 0 (0.0%) | 0 (0.0%) |
| 2 or 3 Rooms | 0 (0.0%) | 17 (12.1%) |
| 4 or 5 Rooms | 467 (34.3%) | 83 (59.3%) |
| 6 or 7 Rooms | 672 (49.4%) | 40 (28.6%) |
| 8 or more Rooms | 221 (16.3%) | 0 (0.0%) |
| Total | 1,360 (100.0%) | 140 (100.0%) |
Housing Structure by Heating Type in Jena
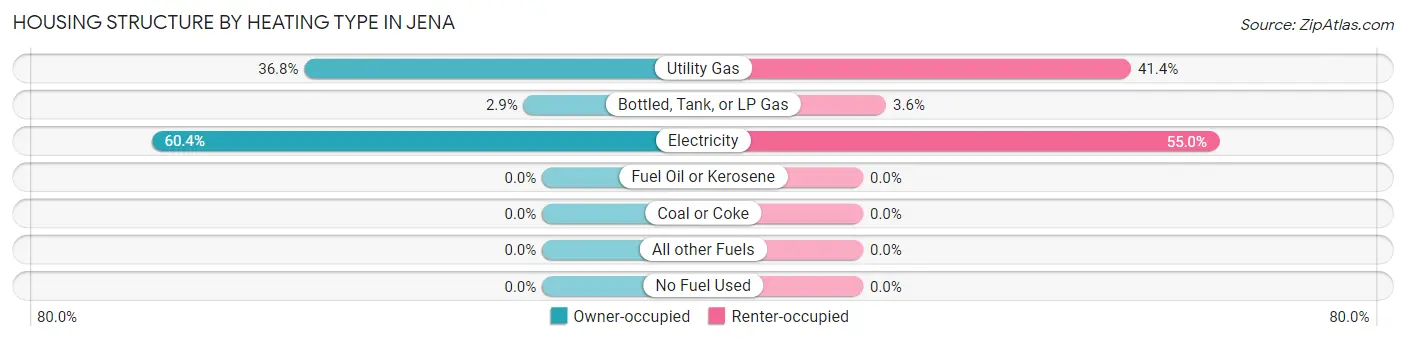
| Heating Type | Owner-occupied | Renter-occupied |
| Utility Gas | 500 (36.8%) | 58 (41.4%) |
| Bottled, Tank, or LP Gas | 39 (2.9%) | 5 (3.6%) |
| Electricity | 821 (60.4%) | 77 (55.0%) |
| Fuel Oil or Kerosene | 0 (0.0%) | 0 (0.0%) |
| Coal or Coke | 0 (0.0%) | 0 (0.0%) |
| All other Fuels | 0 (0.0%) | 0 (0.0%) |
| No Fuel Used | 0 (0.0%) | 0 (0.0%) |
| Total | 1,360 (100.0%) | 140 (100.0%) |
Household Vehicle Usage in Jena
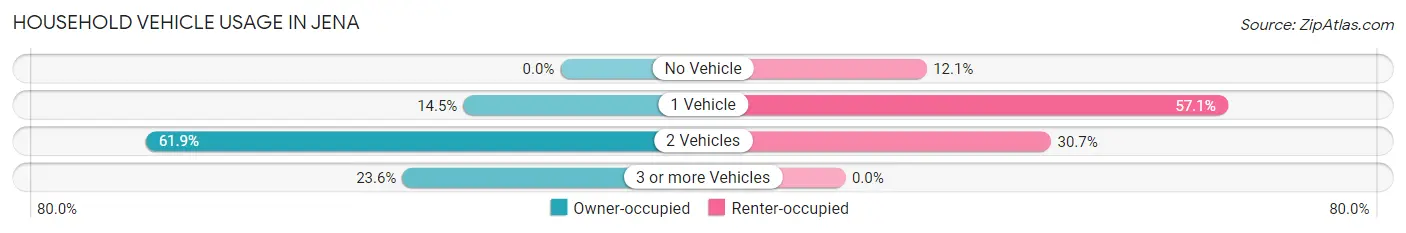
| Vehicles per Household | Owner-occupied | Renter-occupied |
| No Vehicle | 0 (0.0%) | 17 (12.1%) |
| 1 Vehicle | 197 (14.5%) | 80 (57.1%) |
| 2 Vehicles | 842 (61.9%) | 43 (30.7%) |
| 3 or more Vehicles | 321 (23.6%) | 0 (0.0%) |
| Total | 1,360 (100.0%) | 140 (100.0%) |
Real Estate & Mortgages in Jena
Real Estate and Mortgage Overview in Jena
| Characteristic | Without Mortgage | With Mortgage |
| Housing Units | 516 | 844 |
| Median Property Value | $108,200 | $183,000 |
| Median Household Income | $48,252 | $230 |
| Monthly Housing Costs | $376 | $77 |
| Real Estate Taxes | $1,205 | $215 |
Property Value by Mortgage Status in Jena
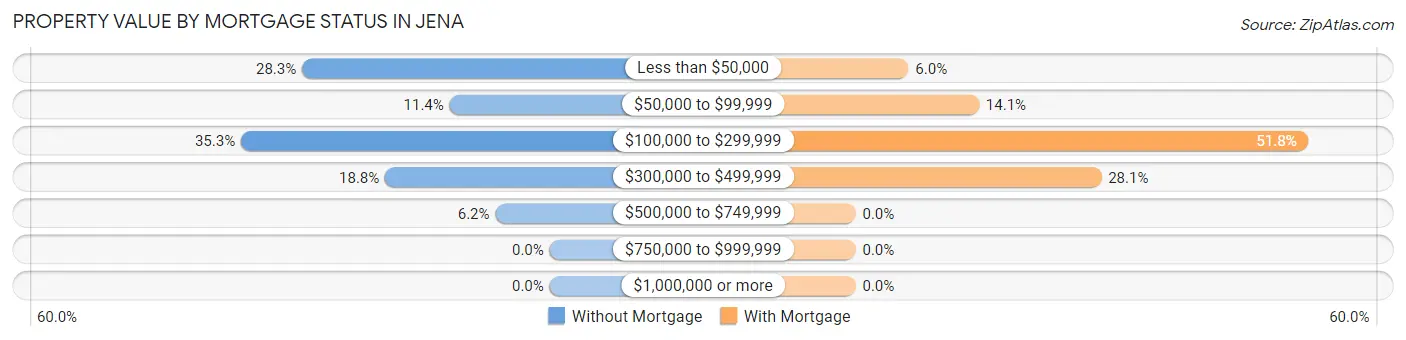
| Property Value | Without Mortgage | With Mortgage |
| Less than $50,000 | 146 (28.3%) | 51 (6.0%) |
| $50,000 to $99,999 | 59 (11.4%) | 119 (14.1%) |
| $100,000 to $299,999 | 182 (35.3%) | 437 (51.8%) |
| $300,000 to $499,999 | 97 (18.8%) | 237 (28.1%) |
| $500,000 to $749,999 | 32 (6.2%) | 0 (0.0%) |
| $750,000 to $999,999 | 0 (0.0%) | 0 (0.0%) |
| $1,000,000 or more | 0 (0.0%) | 0 (0.0%) |
| Total | 516 (100.0%) | 844 (100.0%) |
Household Income by Mortgage Status in Jena
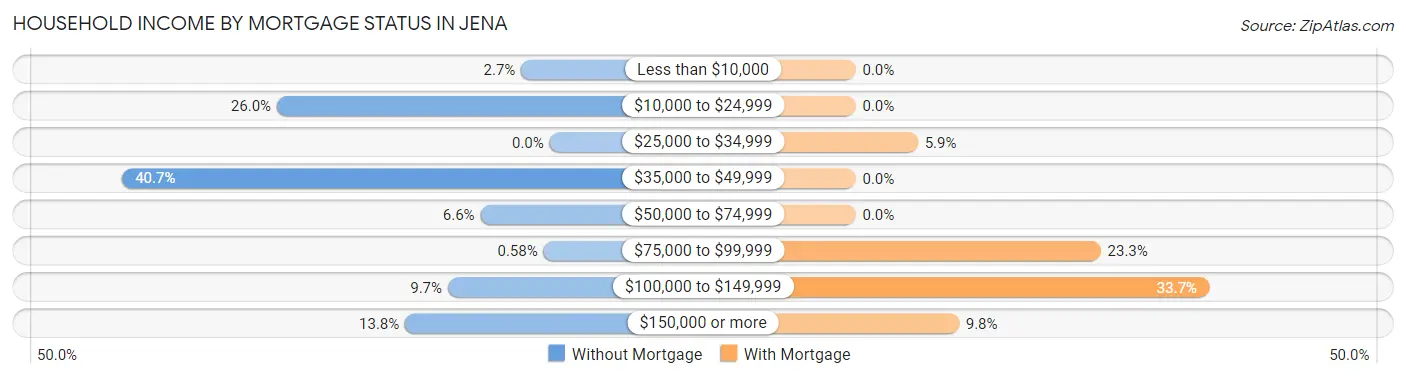
| Household Income | Without Mortgage | With Mortgage |
| Less than $10,000 | 14 (2.7%) | 0 (0.0%) |
| $10,000 to $24,999 | 134 (26.0%) | 0 (0.0%) |
| $25,000 to $34,999 | 0 (0.0%) | 50 (5.9%) |
| $35,000 to $49,999 | 210 (40.7%) | 0 (0.0%) |
| $50,000 to $74,999 | 34 (6.6%) | 0 (0.0%) |
| $75,000 to $99,999 | 3 (0.6%) | 197 (23.3%) |
| $100,000 to $149,999 | 50 (9.7%) | 284 (33.7%) |
| $150,000 or more | 71 (13.8%) | 83 (9.8%) |
| Total | 516 (100.0%) | 844 (100.0%) |
Property Value to Household Income Ratio in Jena
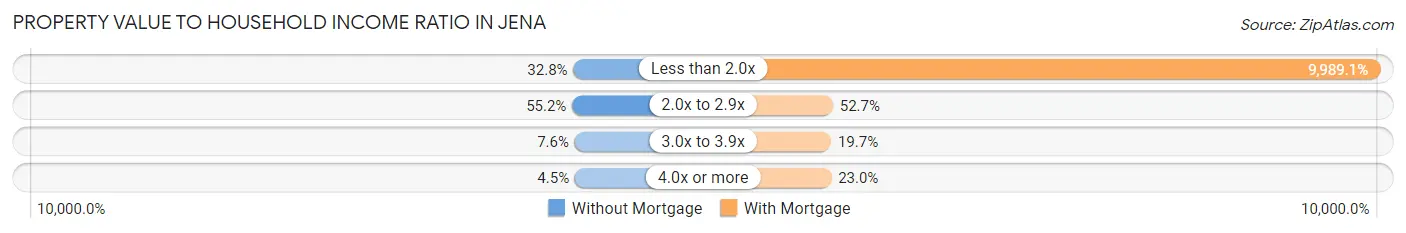
| Value-to-Income Ratio | Without Mortgage | With Mortgage |
| Less than 2.0x | 169 (32.8%) | 84,308 (9,989.1%) |
| 2.0x to 2.9x | 285 (55.2%) | 445 (52.7%) |
| 3.0x to 3.9x | 39 (7.6%) | 166 (19.7%) |
| 4.0x or more | 23 (4.5%) | 194 (23.0%) |
| Total | 516 (100.0%) | 844 (100.0%) |
Real Estate Taxes by Mortgage Status in Jena
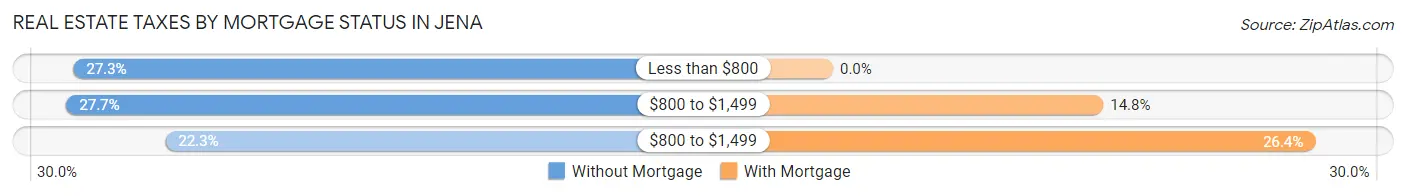
| Property Taxes | Without Mortgage | With Mortgage |
| Less than $800 | 141 (27.3%) | 0 (0.0%) |
| $800 to $1,499 | 143 (27.7%) | 125 (14.8%) |
| $800 to $1,499 | 115 (22.3%) | 223 (26.4%) |
| Total | 516 (100.0%) | 844 (100.0%) |
Health & Disability in Jena
Health Insurance Coverage by Age in Jena
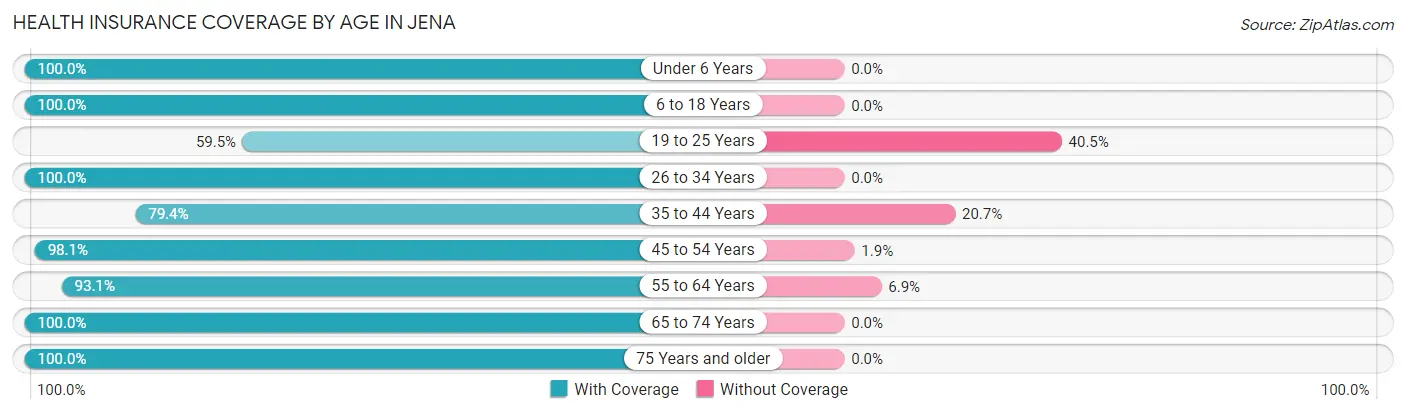
| Age Bracket | With Coverage | Without Coverage |
| Under 6 Years | 310 (100.0%) | 0 (0.0%) |
| 6 to 18 Years | 609 (100.0%) | 0 (0.0%) |
| 19 to 25 Years | 135 (59.5%) | 92 (40.5%) |
| 26 to 34 Years | 676 (100.0%) | 0 (0.0%) |
| 35 to 44 Years | 319 (79.3%) | 83 (20.6%) |
| 45 to 54 Years | 623 (98.1%) | 12 (1.9%) |
| 55 to 64 Years | 283 (93.1%) | 21 (6.9%) |
| 65 to 74 Years | 342 (100.0%) | 0 (0.0%) |
| 75 Years and older | 286 (100.0%) | 0 (0.0%) |
| Total | 3,583 (94.5%) | 208 (5.5%) |
Health Insurance Coverage by Citizenship Status in Jena

| Citizenship Status | With Coverage | Without Coverage |
| Native Born | 310 (100.0%) | 0 (0.0%) |
| Foreign Born, Citizen | 609 (100.0%) | 0 (0.0%) |
| Foreign Born, not a Citizen | 135 (59.5%) | 92 (40.5%) |
Health Insurance Coverage by Household Income in Jena
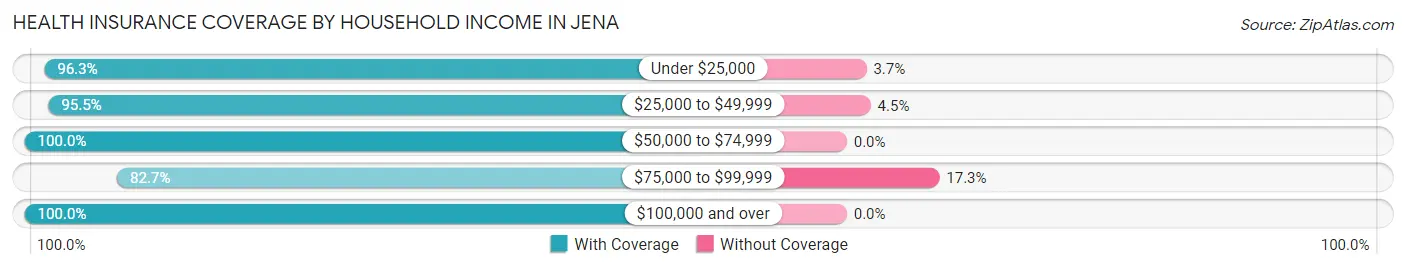
| Household Income | With Coverage | Without Coverage |
| Under $25,000 | 313 (96.3%) | 12 (3.7%) |
| $25,000 to $49,999 | 449 (95.5%) | 21 (4.5%) |
| $50,000 to $74,999 | 517 (100.0%) | 0 (0.0%) |
| $75,000 to $99,999 | 834 (82.7%) | 175 (17.3%) |
| $100,000 and over | 1,462 (100.0%) | 0 (0.0%) |
Public vs Private Health Insurance Coverage by Age in Jena
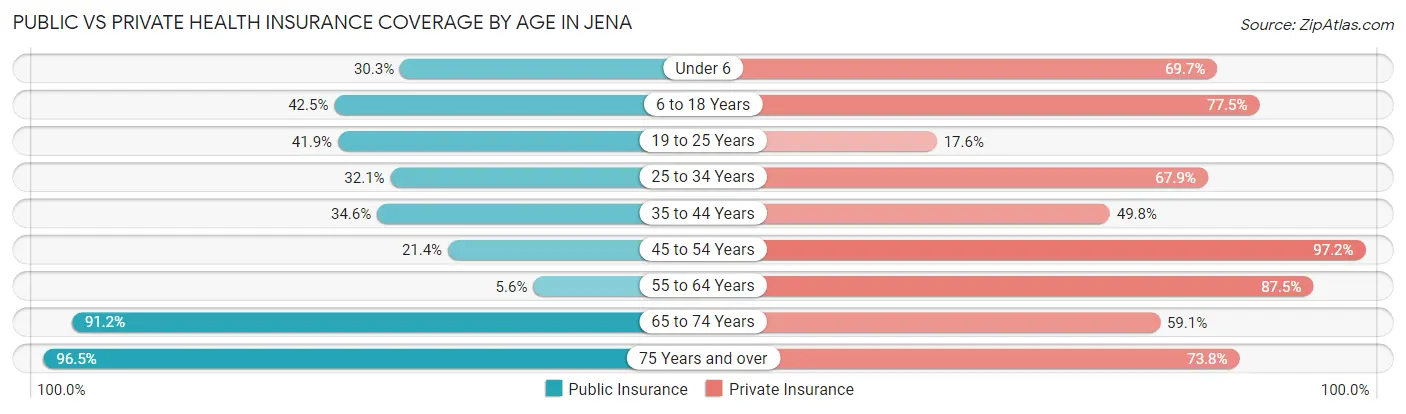
| Age Bracket | Public Insurance | Private Insurance |
| Under 6 | 94 (30.3%) | 216 (69.7%) |
| 6 to 18 Years | 259 (42.5%) | 472 (77.5%) |
| 19 to 25 Years | 95 (41.8%) | 40 (17.6%) |
| 25 to 34 Years | 217 (32.1%) | 459 (67.9%) |
| 35 to 44 Years | 139 (34.6%) | 200 (49.7%) |
| 45 to 54 Years | 136 (21.4%) | 617 (97.2%) |
| 55 to 64 Years | 17 (5.6%) | 266 (87.5%) |
| 65 to 74 Years | 312 (91.2%) | 202 (59.1%) |
| 75 Years and over | 276 (96.5%) | 211 (73.8%) |
| Total | 1,545 (40.7%) | 2,683 (70.8%) |
Disability Status by Sex by Age in Jena
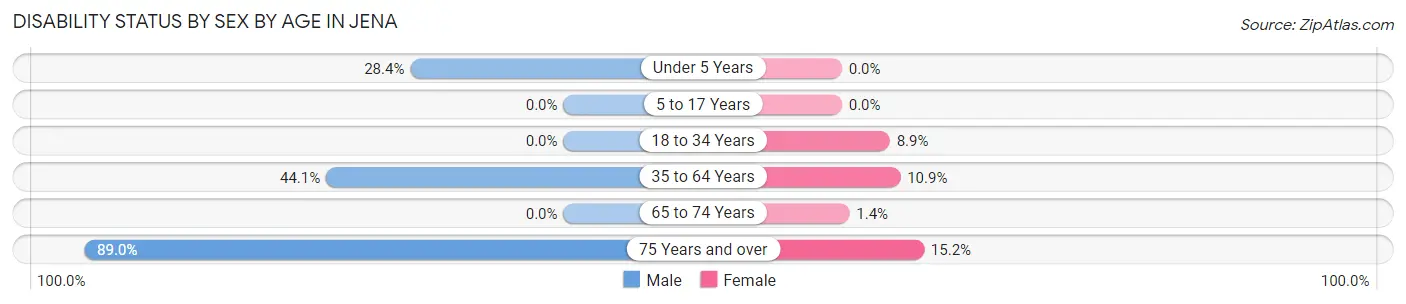
| Age Bracket | Male | Female |
| Under 5 Years | 54 (28.4%) | 0 (0.0%) |
| 5 to 17 Years | 0 (0.0%) | 0 (0.0%) |
| 18 to 34 Years | 0 (0.0%) | 33 (8.9%) |
| 35 to 64 Years | 274 (44.1%) | 78 (10.8%) |
| 65 to 74 Years | 0 (0.0%) | 3 (1.4%) |
| 75 Years and over | 161 (88.9%) | 16 (15.2%) |
Disability Class by Sex by Age in Jena
Disability Class: Hearing Difficulty
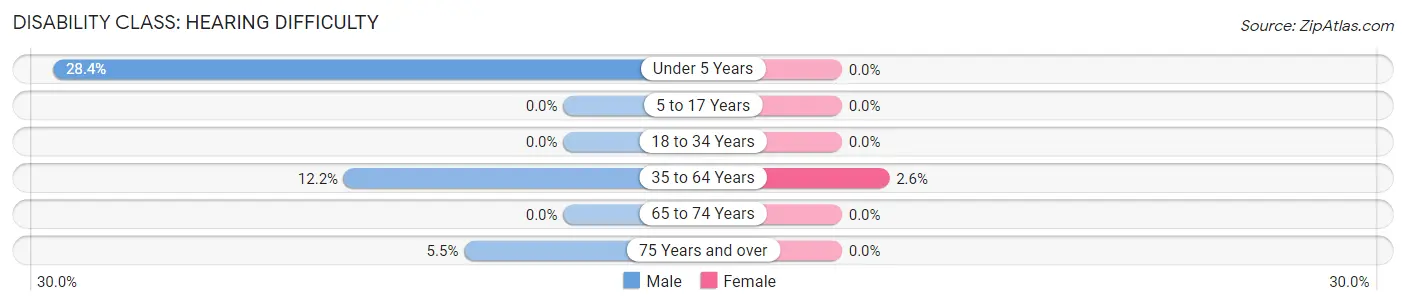
| Age Bracket | Male | Female |
| Under 5 Years | 54 (28.4%) | 0 (0.0%) |
| 5 to 17 Years | 0 (0.0%) | 0 (0.0%) |
| 18 to 34 Years | 0 (0.0%) | 0 (0.0%) |
| 35 to 64 Years | 76 (12.2%) | 19 (2.6%) |
| 65 to 74 Years | 0 (0.0%) | 0 (0.0%) |
| 75 Years and over | 10 (5.5%) | 0 (0.0%) |
Disability Class: Vision Difficulty
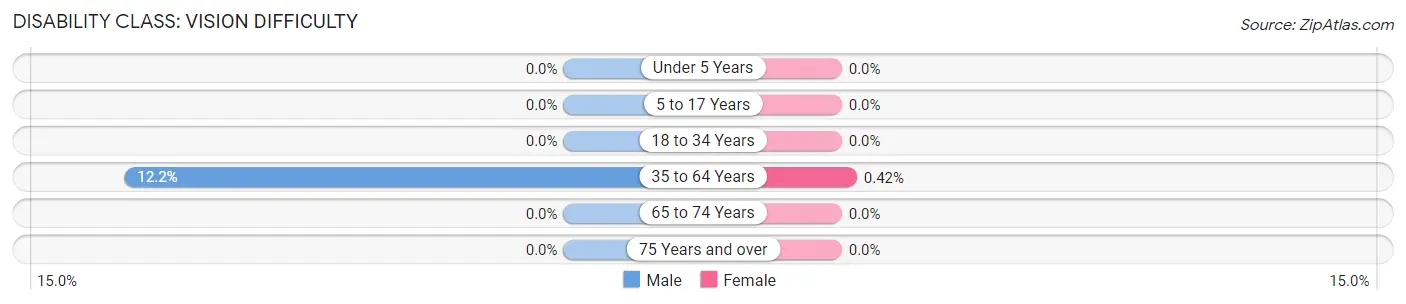
| Age Bracket | Male | Female |
| Under 5 Years | 0 (0.0%) | 0 (0.0%) |
| 5 to 17 Years | 0 (0.0%) | 0 (0.0%) |
| 18 to 34 Years | 0 (0.0%) | 0 (0.0%) |
| 35 to 64 Years | 76 (12.2%) | 3 (0.4%) |
| 65 to 74 Years | 0 (0.0%) | 0 (0.0%) |
| 75 Years and over | 0 (0.0%) | 0 (0.0%) |
Disability Class: Cognitive Difficulty
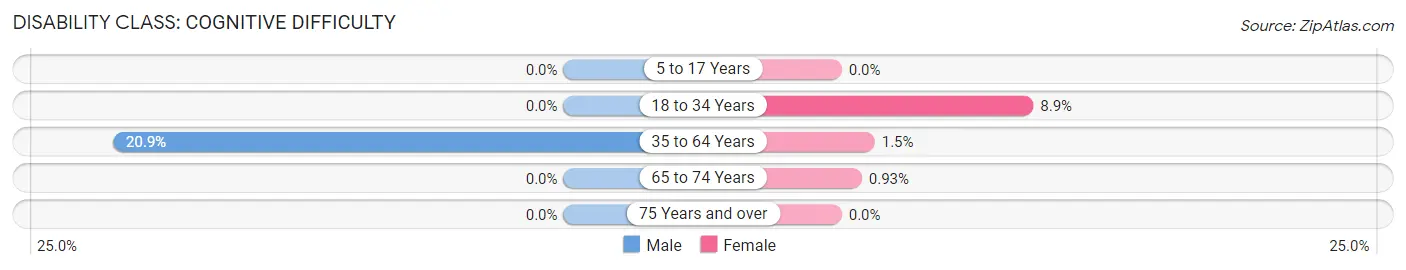
| Age Bracket | Male | Female |
| 5 to 17 Years | 0 (0.0%) | 0 (0.0%) |
| 18 to 34 Years | 0 (0.0%) | 33 (8.9%) |
| 35 to 64 Years | 130 (20.9%) | 11 (1.5%) |
| 65 to 74 Years | 0 (0.0%) | 2 (0.9%) |
| 75 Years and over | 0 (0.0%) | 0 (0.0%) |
Disability Class: Ambulatory Difficulty
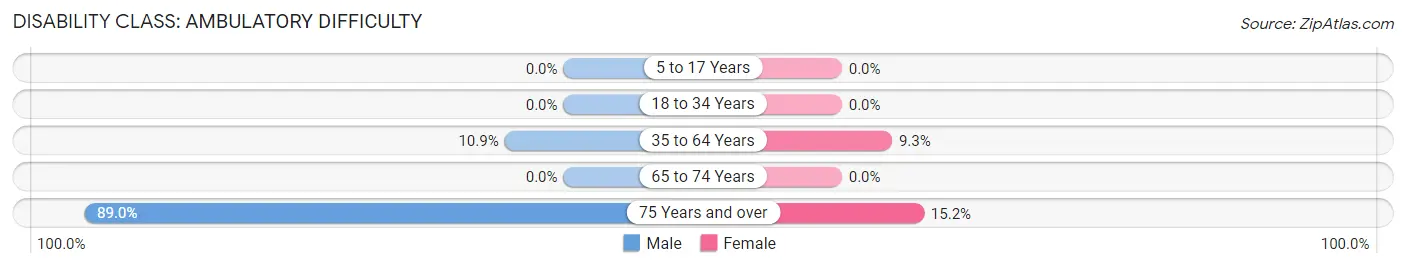
| Age Bracket | Male | Female |
| 5 to 17 Years | 0 (0.0%) | 0 (0.0%) |
| 18 to 34 Years | 0 (0.0%) | 0 (0.0%) |
| 35 to 64 Years | 68 (10.9%) | 67 (9.3%) |
| 65 to 74 Years | 0 (0.0%) | 0 (0.0%) |
| 75 Years and over | 161 (88.9%) | 16 (15.2%) |
Disability Class: Self-Care Difficulty

| Age Bracket | Male | Female |
| 5 to 17 Years | 0 (0.0%) | 0 (0.0%) |
| 18 to 34 Years | 0 (0.0%) | 0 (0.0%) |
| 35 to 64 Years | 0 (0.0%) | 3 (0.4%) |
| 65 to 74 Years | 0 (0.0%) | 0 (0.0%) |
| 75 Years and over | 151 (83.4%) | 0 (0.0%) |
Technology Access in Jena
Computing Device Access in Jena
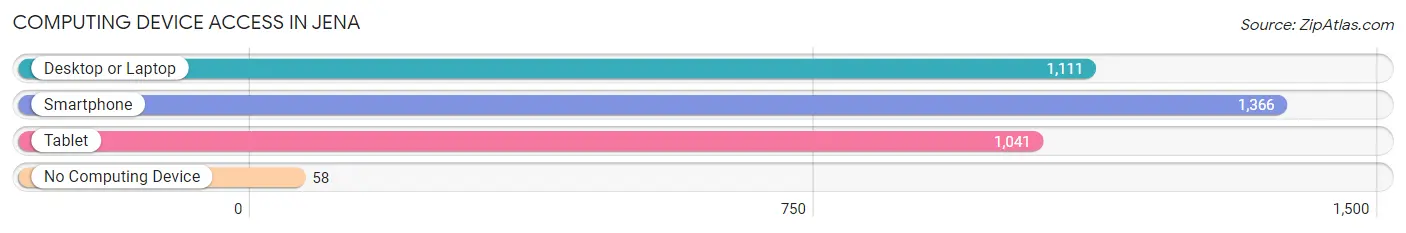
| Device Type | # Households | % Households |
| Desktop or Laptop | 1,111 | 74.1% |
| Smartphone | 1,366 | 91.1% |
| Tablet | 1,041 | 69.4% |
| No Computing Device | 58 | 3.9% |
| Total | 1,500 | 100.0% |
Internet Access in Jena
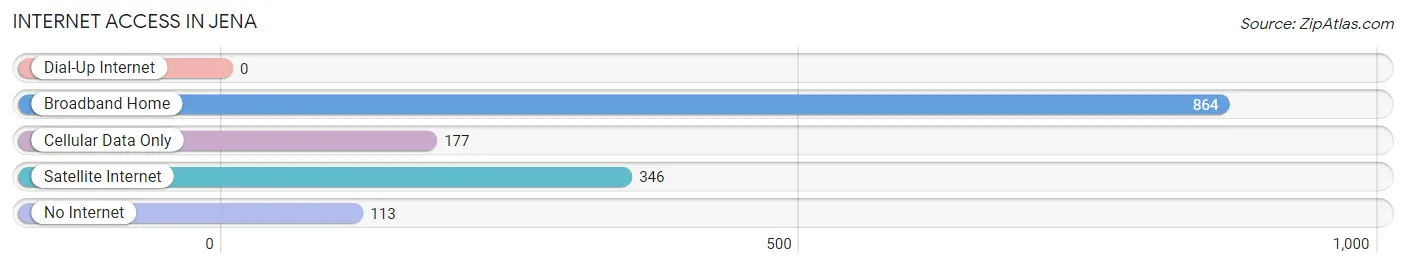
| Internet Type | # Households | % Households |
| Dial-Up Internet | 0 | 0.0% |
| Broadband Home | 864 | 57.6% |
| Cellular Data Only | 177 | 11.8% |
| Satellite Internet | 346 | 23.1% |
| No Internet | 113 | 7.5% |
| Total | 1,500 | 100.0% |
Jena Summary
Jena is a small town located in LaSalle Parish, Louisiana. It is situated in the heart of the state, approximately halfway between Alexandria and Monroe. The town is known for its rich history, diverse geography, and vibrant economy.
History
Jena was founded in 1836 by a group of settlers from the nearby town of Catahoula. The town was named after the nearby Jena Creek, which was named after the German city of Jena. The town quickly grew and became a center of commerce for the surrounding area. In 1845, the town was incorporated and the first mayor was elected.
During the Civil War, Jena was a major Confederate stronghold. The town was the site of several battles, including the Battle of Jena in 1863. After the war, the town was rebuilt and continued to grow. In the late 19th century, the town became a center of the lumber industry, with several sawmills and lumber yards.
Geography
Jena is located in the heart of Louisiana, approximately halfway between Alexandria and Monroe. The town is situated in the rolling hills of LaSalle Parish, with the Jena Creek running through the center of town. The town is surrounded by forests and farmland, with the Kisatchie National Forest located nearby.
The climate in Jena is humid subtropical, with hot summers and mild winters. The average annual temperature is around 70 degrees Fahrenheit, with temperatures reaching as high as 95 degrees in the summer and as low as 40 degrees in the winter.
Economy
Jena’s economy is largely based on agriculture and forestry. The town is home to several farms, as well as several sawmills and lumber yards. The town is also home to several small businesses, including restaurants, shops, and other services.
The town is also home to several manufacturing companies, including a paper mill and a furniture factory. The town is also home to several oil and gas companies, as well as a number of other industries.
Demographics
As of the 2010 census, the population of Jena was 2,945. The town is predominantly white, with African Americans making up approximately 25% of the population. The median household income is around $35,000, and the median home value is around $90,000.
Jena is a small town with a rich history, diverse geography, and vibrant economy. The town is home to a diverse population, with a variety of businesses and industries. The town is a great place to live, work, and raise a family.
Common Questions
What is Per Capita Income in Jena?
Per Capita income in Jena is $36,161.
What is the Median Family Income in Jena?
Median Family Income in Jena is $83,673.
What is the Median Household income in Jena?
Median Household Income in Jena is $67,009.
What is Income or Wage Gap in Jena?
Income or Wage Gap in Jena is 41.0%.
Women in Jena earn 59.0 cents for every dollar earned by a man.
What is Inequality or Gini Index in Jena?
Inequality or Gini Index in Jena is 0.39.
What is the Total Population of Jena?
Total Population of Jena is 4,099.
What is the Total Male Population of Jena?
Total Male Population of Jena is 2,234.
What is the Total Female Population of Jena?
Total Female Population of Jena is 1,865.
What is the Ratio of Males per 100 Females in Jena?
There are 119.79 Males per 100 Females in Jena.
What is the Ratio of Females per 100 Males in Jena?
There are 83.48 Females per 100 Males in Jena.
What is the Median Population Age in Jena?
Median Population Age in Jena is 37.5 Years.
What is the Average Family Size in Jena
Average Family Size in Jena is 2.8 People.
What is the Average Household Size in Jena
Average Household Size in Jena is 2.5 People.
How Large is the Labor Force in Jena?
There are 2,130 People in the Labor Forcein in Jena.
What is the Percentage of People in the Labor Force in Jena?
62.4% of People are in the Labor Force in Jena.
What is the Unemployment Rate in Jena?
Unemployment Rate in Jena is 3.9%.