Zip Codes with the Highest Percentage of Population Employed in Legal Services & Support in Denham Springs, LA
RELATED REPORTS & OPTIONS
Legal Services & Support
Denham Springs
Compare Zip Codes
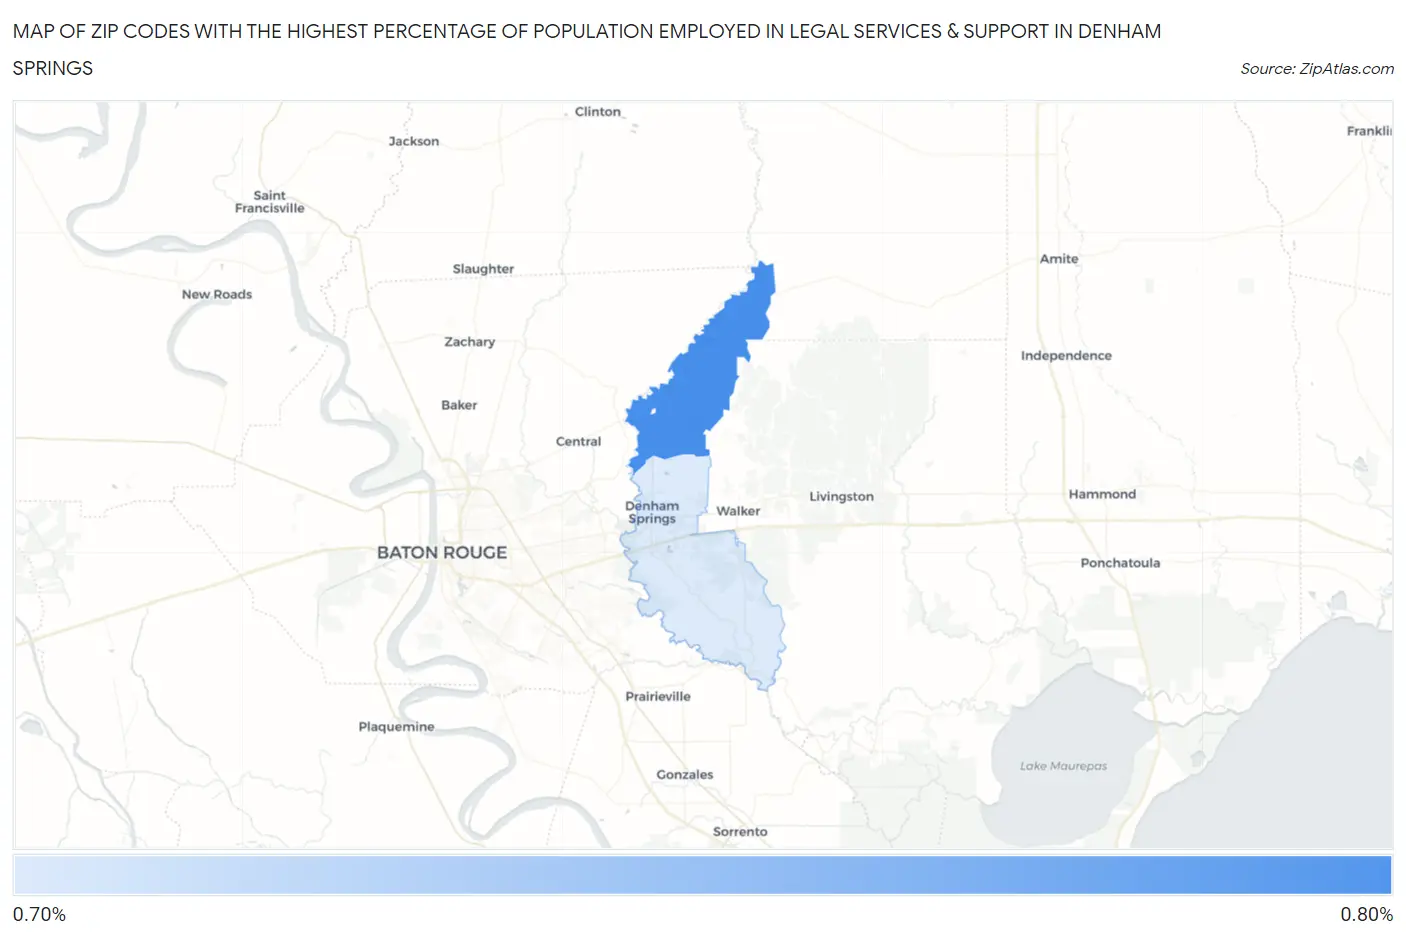
Map of Zip Codes with the Highest Percentage of Population Employed in Legal Services & Support in Denham Springs
0.77%
0.79%
Zip Codes with the Highest Percentage of Population Employed in Legal Services & Support in Denham Springs, LA
| Zip Code | % Employed | vs State | vs National | |
| 1. | 70706 | 0.79% | 1.3%(-0.541)#164 | 1.2%(-0.394)#9,556 |
| 2. | 70726 | 0.77% | 1.3%(-0.561)#167 | 1.2%(-0.414)#9,741 |
1
Common Questions
What are the Top Zip Codes with the Highest Percentage of Population Employed in Legal Services & Support in Denham Springs, LA?
Top Zip Codes with the Highest Percentage of Population Employed in Legal Services & Support in Denham Springs, LA are:
What zip code has the Highest Percentage of Population Employed in Legal Services & Support in Denham Springs, LA?
70706 has the Highest Percentage of Population Employed in Legal Services & Support in Denham Springs, LA with 0.79%.
What is the Percentage of Population Employed in Legal Services & Support in Louisiana?
Percentage of Population Employed in Legal Services & Support in Louisiana is 1.3%.
What is the Percentage of Population Employed in Legal Services & Support in the United States?
Percentage of Population Employed in Legal Services & Support in the United States is 1.2%.