Supreme, LA Map & Demographics
Supreme Map
Supreme Overview
$17,058
PER CAPITA INCOME
0.58
INEQUALITY / GINI INDEX
597
TOTAL POPULATION
347
MALE POPULATION
250
FEMALE POPULATION
138.80
MALES / 100 FEMALES
72.05
FEMALES / 100 MALES
63.8
MEDIAN AGE
3.6
AVG FAMILY SIZE
2.0
AVG HOUSEHOLD SIZE
236
LABOR FORCE [ PEOPLE ]
42.9%
PERCENT IN LABOR FORCE
2.1%
UNEMPLOYMENT RATE
Income in Supreme
Income Overview in Supreme
| Characteristic | Number | Measure |
| Per Capita Income | 597 | $17,058 |
| Median Family Income | 106 | $0 |
| Mean Family Income | 106 | $57,967 |
| Median Household Income | 301 | $0 |
| Mean Household Income | 301 | $30,537 |
| Income Deficit | 106 | $0 |
| Wage / Income Gap (%) | 597 | 0.00% |
| Wage / Income Gap ($) | 597 | 100.00¢ per $1 |
| Gini / Inequality Index | 597 | 0.58 |
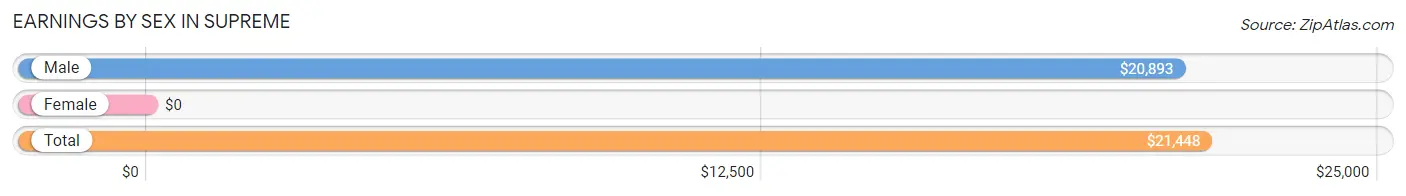
Earnings by Sex in Supreme
| Sex | Number | Average Earnings |
| Male | 127 (55.0%) | $20,893 |
| Female | 104 (45.0%) | $0 |
| Total | 231 (100.0%) | $21,448 |
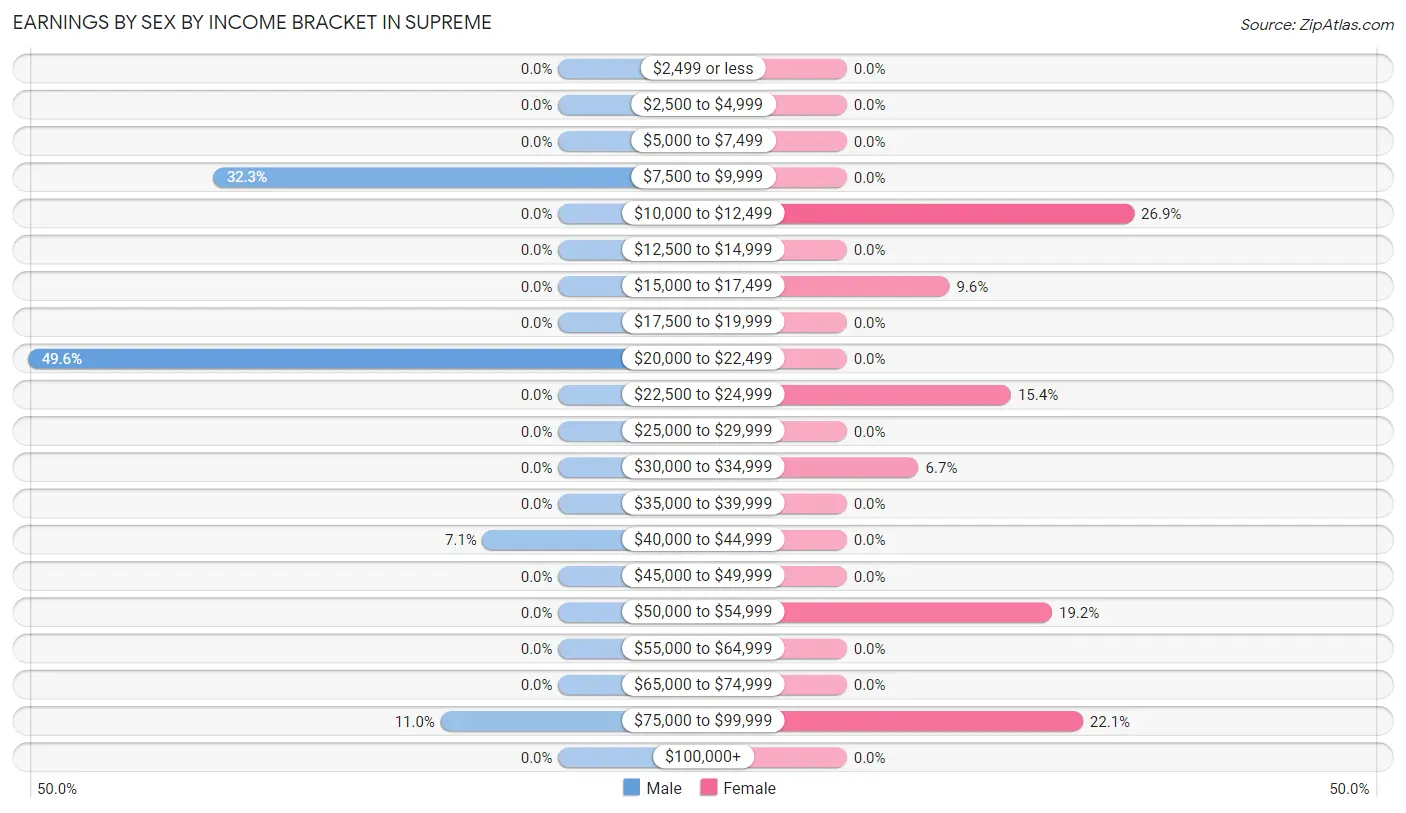
Earnings by Sex by Income Bracket in Supreme
The most common earnings brackets in Supreme are $20,000 to $22,499 for men (63 | 49.6%) and $10,000 to $12,499 for women (28 | 26.9%).
| Income | Male | Female |
| $2,499 or less | 0 (0.0%) | 0 (0.0%) |
| $2,500 to $4,999 | 0 (0.0%) | 0 (0.0%) |
| $5,000 to $7,499 | 0 (0.0%) | 0 (0.0%) |
| $7,500 to $9,999 | 41 (32.3%) | 0 (0.0%) |
| $10,000 to $12,499 | 0 (0.0%) | 28 (26.9%) |
| $12,500 to $14,999 | 0 (0.0%) | 0 (0.0%) |
| $15,000 to $17,499 | 0 (0.0%) | 10 (9.6%) |
| $17,500 to $19,999 | 0 (0.0%) | 0 (0.0%) |
| $20,000 to $22,499 | 63 (49.6%) | 0 (0.0%) |
| $22,500 to $24,999 | 0 (0.0%) | 16 (15.4%) |
| $25,000 to $29,999 | 0 (0.0%) | 0 (0.0%) |
| $30,000 to $34,999 | 0 (0.0%) | 7 (6.7%) |
| $35,000 to $39,999 | 0 (0.0%) | 0 (0.0%) |
| $40,000 to $44,999 | 9 (7.1%) | 0 (0.0%) |
| $45,000 to $49,999 | 0 (0.0%) | 0 (0.0%) |
| $50,000 to $54,999 | 0 (0.0%) | 20 (19.2%) |
| $55,000 to $64,999 | 0 (0.0%) | 0 (0.0%) |
| $65,000 to $74,999 | 0 (0.0%) | 0 (0.0%) |
| $75,000 to $99,999 | 14 (11.0%) | 23 (22.1%) |
| $100,000+ | 0 (0.0%) | 0 (0.0%) |
| Total | 127 (100.0%) | 104 (100.0%) |
Earnings by Sex by Educational Attainment in Supreme
| Educational Attainment | Male Income | Female Income |
| Less than High School | - | - |
| High School Diploma | - | - |
| College or Associate's Degree | - | - |
| Bachelor's Degree | - | - |
| Graduate Degree | - | - |
| Total | $20,893 | $0 |
Family Income in Supreme
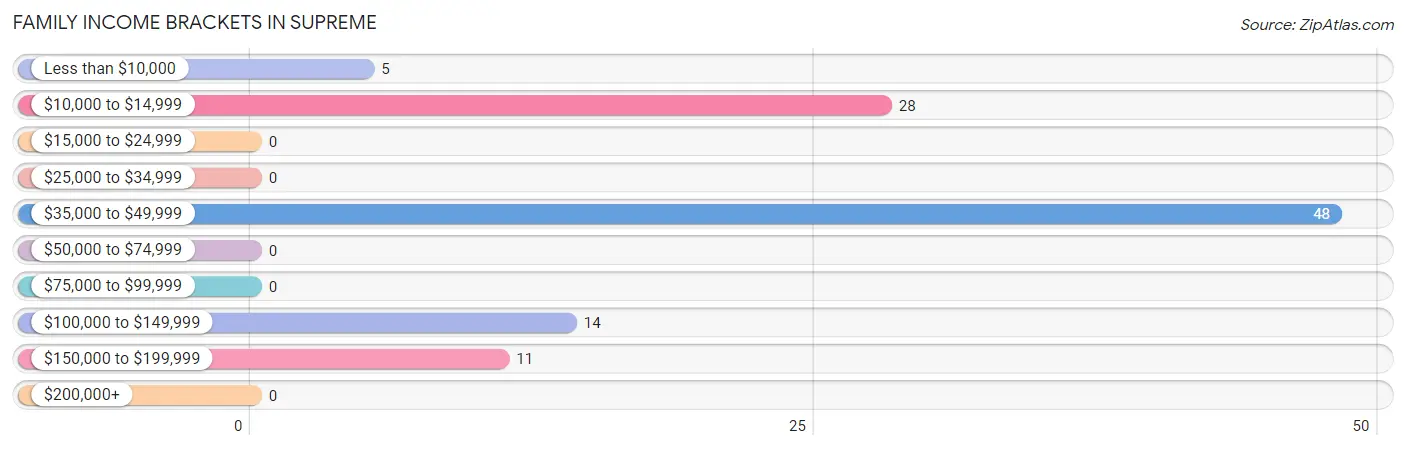
Family Income Brackets in Supreme
According to the Supreme family income data, there are 48 families falling into the $35,000 to $49,999 income range, which is the most common income bracket and makes up 45.3% of all families.
| Income Bracket | # Families | % Families |
| Less than $10,000 | 5 | 4.7% |
| $10,000 to $14,999 | 28 | 26.4% |
| $15,000 to $24,999 | 0 | 0.0% |
| $25,000 to $34,999 | 0 | 0.0% |
| $35,000 to $49,999 | 48 | 45.3% |
| $50,000 to $74,999 | 0 | 0.0% |
| $75,000 to $99,999 | 0 | 0.0% |
| $100,000 to $149,999 | 14 | 13.2% |
| $150,000 to $199,999 | 11 | 10.4% |
| $200,000+ | 0 | 0.0% |
Family Income by Famaliy Size in Supreme
| Income Bracket | # Families | Median Income |
| 2-Person Families | 32 (30.2%) | $0 |
| 3-Person Families | 44 (41.5%) | $0 |
| 4-Person Families | 30 (28.3%) | $0 |
| 5-Person Families | 0 (0.0%) | $0 |
| 6-Person Families | 0 (0.0%) | $0 |
| 7+ Person Families | 0 (0.0%) | $0 |
| Total | 106 (100.0%) | $0 |
Family Income by Number of Earners in Supreme
| Number of Earners | # Families | Median Income |
| No Earners | 23 (21.7%) | $0 |
| 1 Earner | 58 (54.7%) | $0 |
| 2 Earners | 25 (23.6%) | $0 |
| 3+ Earners | 0 (0.0%) | $0 |
| Total | 106 (100.0%) | $0 |
Household Income in Supreme
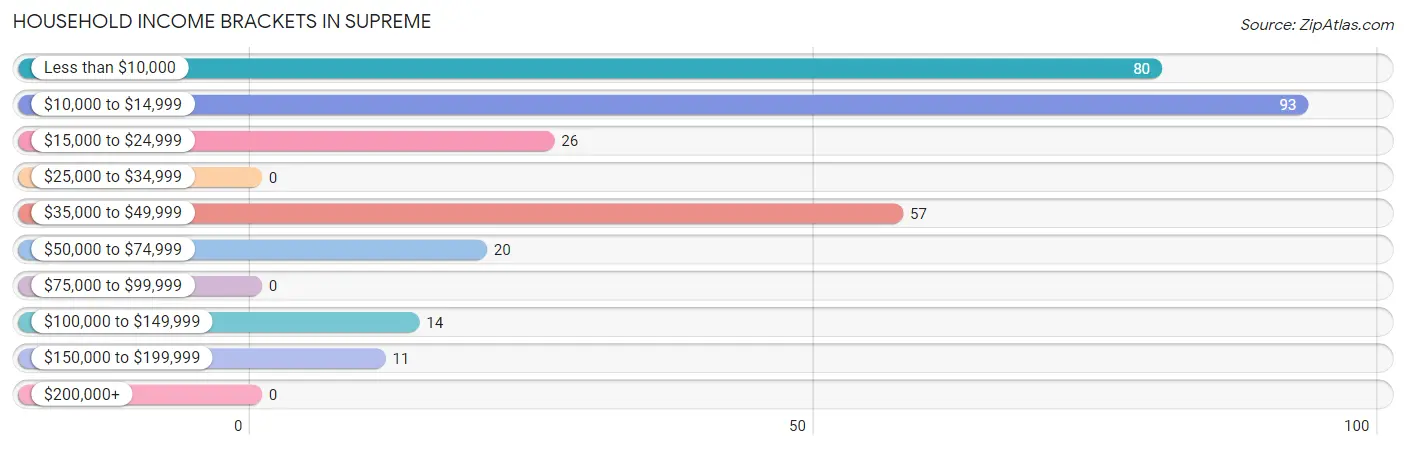
Household Income Brackets in Supreme
With 93 households falling in the category, the $10,000 to $14,999 income range is the most frequent in Supreme, accounting for 30.9% of all households.
| Income Bracket | # Households | % Households |
| Less than $10,000 | 80 | 26.6% |
| $10,000 to $14,999 | 93 | 30.9% |
| $15,000 to $24,999 | 26 | 8.6% |
| $25,000 to $34,999 | 0 | 0.0% |
| $35,000 to $49,999 | 57 | 18.9% |
| $50,000 to $74,999 | 20 | 6.6% |
| $75,000 to $99,999 | 0 | 0.0% |
| $100,000 to $149,999 | 14 | 4.7% |
| $150,000 to $199,999 | 11 | 3.7% |
| $200,000+ | 0 | 0.0% |
Household Income by Householder Age in Supreme
| Income Bracket | # Households | Median Income |
| 15 to 24 Years | 0 (0.0%) | $0 |
| 25 to 44 Years | 48 (16.0%) | $0 |
| 45 to 64 Years | 95 (31.6%) | $0 |
| 65+ Years | 158 (52.5%) | $0 |
| Total | 301 (100.0%) | $0 |
Poverty in Supreme
Income Below Poverty by Sex and Age in Supreme
With 38.0% poverty level for males and 50.4% for females among the residents of Supreme, 5 year old males and 6 to 11 year old females are the most vulnerable to poverty, with 22 males (100.0%) and 15 females (100.0%) in their respective age groups living below the poverty level.
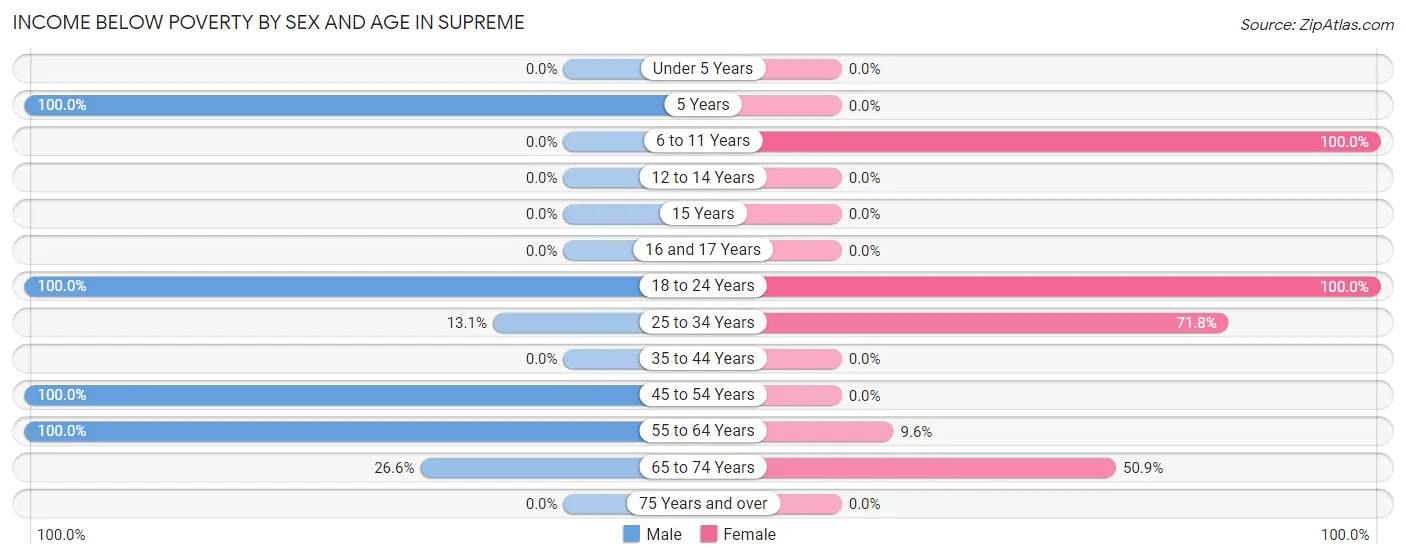
| Age Bracket | Male | Female |
| Under 5 Years | 0 (0.0%) | 0 (0.0%) |
| 5 Years | 22 (100.0%) | 0 (0.0%) |
| 6 to 11 Years | 0 (0.0%) | 15 (100.0%) |
| 12 to 14 Years | 0 (0.0%) | 0 (0.0%) |
| 15 Years | 0 (0.0%) | 0 (0.0%) |
| 16 and 17 Years | 0 (0.0%) | 0 (0.0%) |
| 18 to 24 Years | 18 (100.0%) | 22 (100.0%) |
| 25 to 34 Years | 8 (13.1%) | 28 (71.8%) |
| 35 to 44 Years | 0 (0.0%) | 0 (0.0%) |
| 45 to 54 Years | 9 (100.0%) | 0 (0.0%) |
| 55 to 64 Years | 41 (100.0%) | 5 (9.6%) |
| 65 to 74 Years | 34 (26.6%) | 56 (50.9%) |
| 75 Years and over | 0 (0.0%) | 0 (0.0%) |
| Total | 132 (38.0%) | 126 (50.4%) |
Income Above Poverty by Sex and Age in Supreme
According to the poverty statistics in Supreme, males aged under 5 years and females aged 35 to 44 years are the age groups that are most secure financially, with 100.0% of males and 100.0% of females in these age groups living above the poverty line.
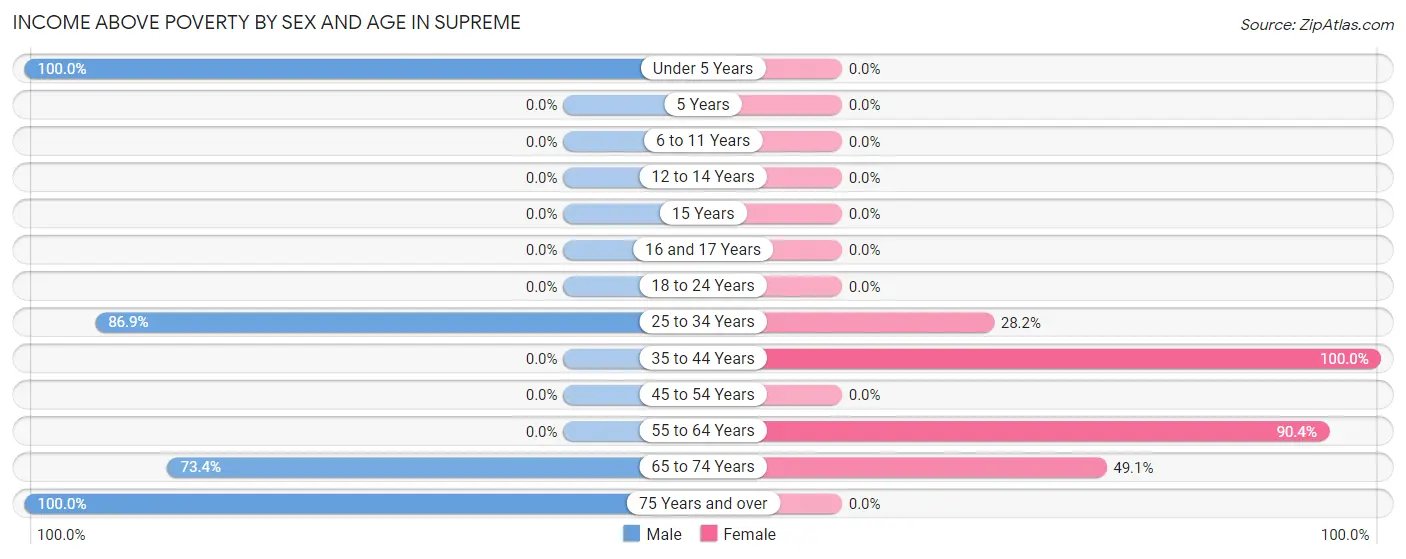
| Age Bracket | Male | Female |
| Under 5 Years | 10 (100.0%) | 0 (0.0%) |
| 5 Years | 0 (0.0%) | 0 (0.0%) |
| 6 to 11 Years | 0 (0.0%) | 0 (0.0%) |
| 12 to 14 Years | 0 (0.0%) | 0 (0.0%) |
| 15 Years | 0 (0.0%) | 0 (0.0%) |
| 16 and 17 Years | 0 (0.0%) | 0 (0.0%) |
| 18 to 24 Years | 0 (0.0%) | 0 (0.0%) |
| 25 to 34 Years | 53 (86.9%) | 11 (28.2%) |
| 35 to 44 Years | 0 (0.0%) | 12 (100.0%) |
| 45 to 54 Years | 0 (0.0%) | 0 (0.0%) |
| 55 to 64 Years | 0 (0.0%) | 47 (90.4%) |
| 65 to 74 Years | 94 (73.4%) | 54 (49.1%) |
| 75 Years and over | 58 (100.0%) | 0 (0.0%) |
| Total | 215 (62.0%) | 124 (49.6%) |
Income Below Poverty Among Married-Couple Families in Supreme
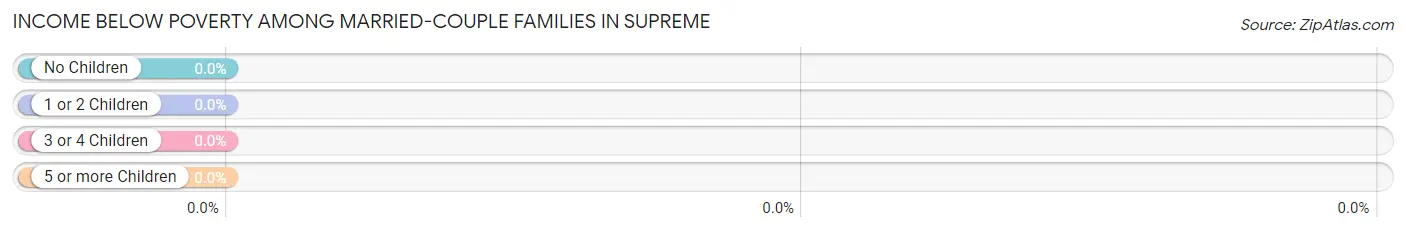
| Children | Above Poverty | Below Poverty |
| No Children | 62 (100.0%) | 0 (0.0%) |
| 1 or 2 Children | 11 (100.0%) | 0 (0.0%) |
| 3 or 4 Children | 0 (0.0%) | 0 (0.0%) |
| 5 or more Children | 0 (0.0%) | 0 (0.0%) |
| Total | 73 (100.0%) | 0 (0.0%) |
Income Below Poverty Among Single-Parent Households in Supreme
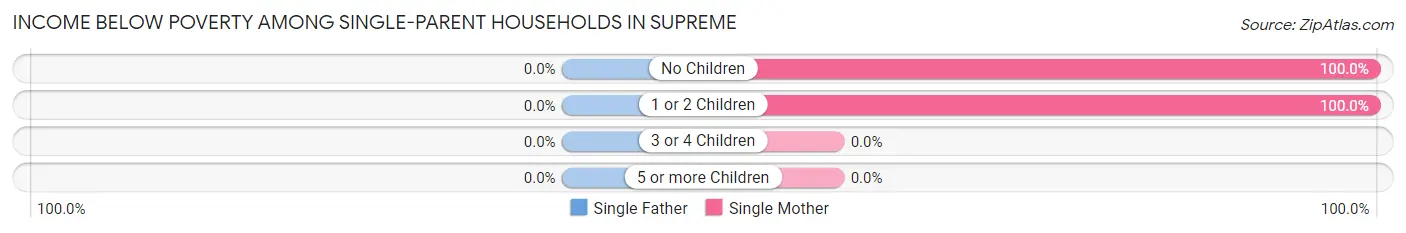
| Children | Single Father | Single Mother |
| No Children | 0 (0.0%) | 5 (100.0%) |
| 1 or 2 Children | 0 (0.0%) | 28 (100.0%) |
| 3 or 4 Children | 0 (0.0%) | 0 (0.0%) |
| 5 or more Children | 0 (0.0%) | 0 (0.0%) |
| Total | 0 (0.0%) | 33 (100.0%) |
Income Below Poverty Among Married-Couple vs Single-Parent Households in Supreme
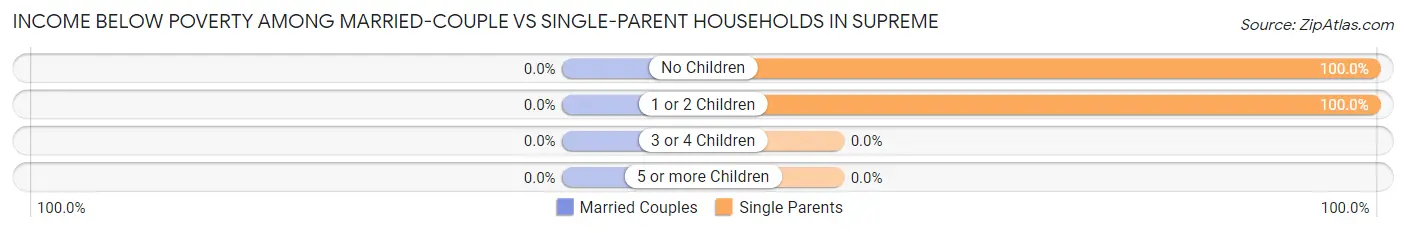
| Children | Married-Couple Families | Single-Parent Households |
| No Children | 0 (0.0%) | 5 (100.0%) |
| 1 or 2 Children | 0 (0.0%) | 28 (100.0%) |
| 3 or 4 Children | 0 (0.0%) | 0 (0.0%) |
| 5 or more Children | 0 (0.0%) | 0 (0.0%) |
| Total | 0 (0.0%) | 33 (100.0%) |
Race in Supreme
The most populous races in Supreme are Black / African American (535 | 89.6%), White / Caucasian (41 | 6.9%), and Two or more Races (21 | 3.5%).
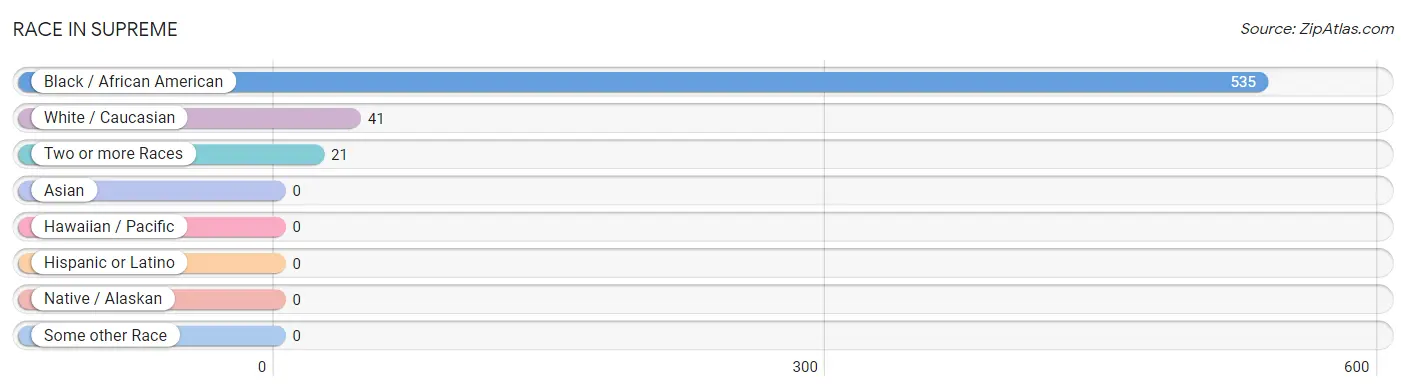
| Race | # Population | % Population |
| Asian | 0 | 0.0% |
| Black / African American | 535 | 89.6% |
| Hawaiian / Pacific | 0 | 0.0% |
| Hispanic or Latino | 0 | 0.0% |
| Native / Alaskan | 0 | 0.0% |
| White / Caucasian | 41 | 6.9% |
| Two or more Races | 21 | 3.5% |
| Some other Race | 0 | 0.0% |
| Total | 597 | 100.0% |
Ancestry in Supreme
The most populous ancestries reported in Supreme are American (29 | 4.9%), Cherokee (21 | 3.5%), English (21 | 3.5%), Irish (12 | 2.0%), and Italian (12 | 2.0%), together accounting for 15.9% of all Supreme residents.
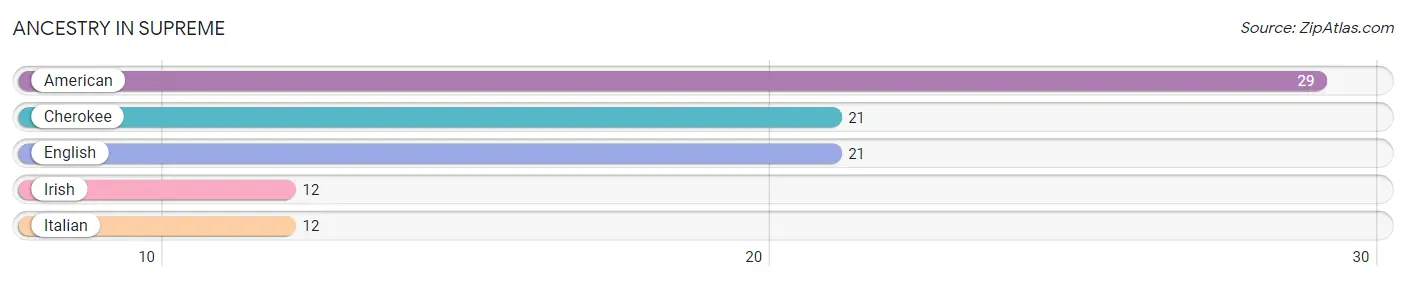
| Ancestry | # Population | % Population |
| American | 29 | 4.9% |
| Cherokee | 21 | 3.5% |
| English | 21 | 3.5% |
| Irish | 12 | 2.0% |
| Italian | 12 | 2.0% | View All 5 Rows |
Immigrants in Supreme

| Immigration Origin | # Population | % Population | View All 0 Rows |
Sex and Age in Supreme
Sex and Age in Supreme
The most populous age groups in Supreme are 65 to 69 Years (77 | 22.2%) for men and 70 to 74 Years (56 | 22.4%) for women.
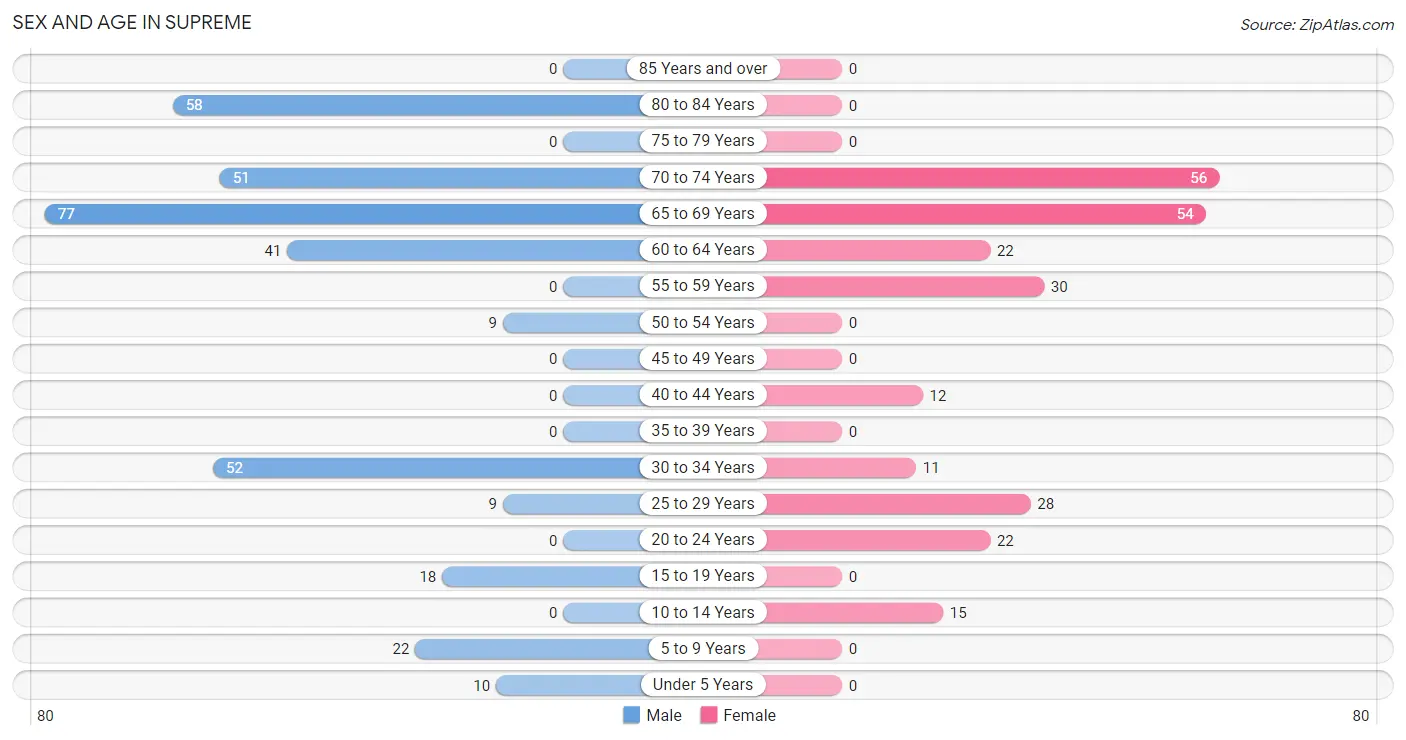
| Age Bracket | Male | Female |
| Under 5 Years | 10 (2.9%) | 0 (0.0%) |
| 5 to 9 Years | 22 (6.3%) | 0 (0.0%) |
| 10 to 14 Years | 0 (0.0%) | 15 (6.0%) |
| 15 to 19 Years | 18 (5.2%) | 0 (0.0%) |
| 20 to 24 Years | 0 (0.0%) | 22 (8.8%) |
| 25 to 29 Years | 9 (2.6%) | 28 (11.2%) |
| 30 to 34 Years | 52 (15.0%) | 11 (4.4%) |
| 35 to 39 Years | 0 (0.0%) | 0 (0.0%) |
| 40 to 44 Years | 0 (0.0%) | 12 (4.8%) |
| 45 to 49 Years | 0 (0.0%) | 0 (0.0%) |
| 50 to 54 Years | 9 (2.6%) | 0 (0.0%) |
| 55 to 59 Years | 0 (0.0%) | 30 (12.0%) |
| 60 to 64 Years | 41 (11.8%) | 22 (8.8%) |
| 65 to 69 Years | 77 (22.2%) | 54 (21.6%) |
| 70 to 74 Years | 51 (14.7%) | 56 (22.4%) |
| 75 to 79 Years | 0 (0.0%) | 0 (0.0%) |
| 80 to 84 Years | 58 (16.7%) | 0 (0.0%) |
| 85 Years and over | 0 (0.0%) | 0 (0.0%) |
| Total | 347 (100.0%) | 250 (100.0%) |
Families and Households in Supreme
Median Family Size in Supreme
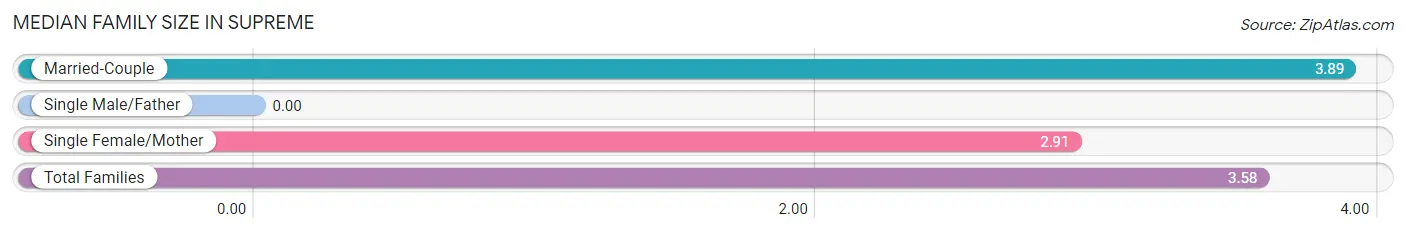
| Family Type | # Families | Family Size |
| Married-Couple | 73 (68.9%) | 3.89 |
| Single Male/Father | 0 (0.0%) | - |
| Single Female/Mother | 33 (31.1%) | 2.91 |
| Total Families | 106 (100.0%) | 3.58 |
Median Household Size in Supreme
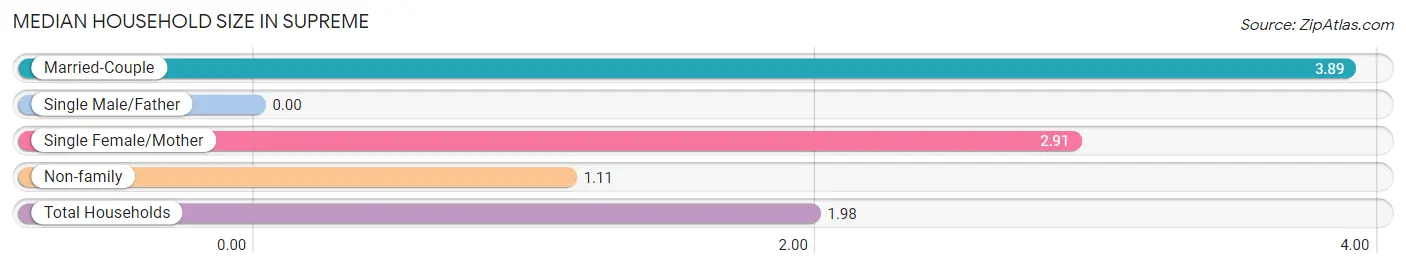
| Household Type | # Households | Household Size |
| Married-Couple | 73 (24.2%) | 3.89 |
| Single Male/Father | 0 (0.0%) | - |
| Single Female/Mother | 33 (11.0%) | 2.91 |
| Non-family | 195 (64.8%) | 1.11 |
| Total Households | 301 (100.0%) | 1.98 |
Household Size by Marriage Status in Supreme
Out of a total of 301 households in Supreme, 106 (35.2%) are family households, while 195 (64.8%) are nonfamily households. The most numerous type of family households are 3-person households, comprising 44, and the most common type of nonfamily households are 1-person households, comprising 186.
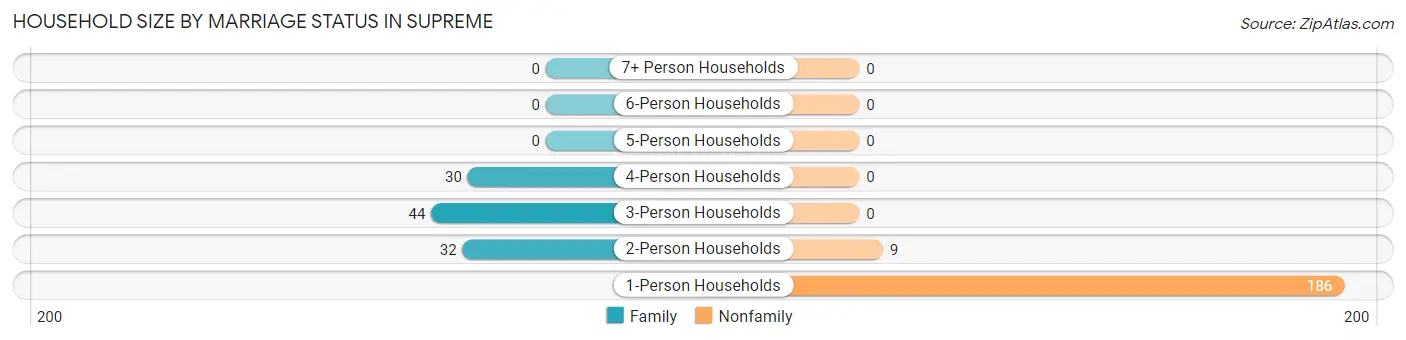
| Household Size | Family Households | Nonfamily Households |
| 1-Person Households | - | 186 (61.8%) |
| 2-Person Households | 32 (10.6%) | 9 (3.0%) |
| 3-Person Households | 44 (14.6%) | 0 (0.0%) |
| 4-Person Households | 30 (10.0%) | 0 (0.0%) |
| 5-Person Households | 0 (0.0%) | 0 (0.0%) |
| 6-Person Households | 0 (0.0%) | 0 (0.0%) |
| 7+ Person Households | 0 (0.0%) | 0 (0.0%) |
| Total | 106 (35.2%) | 195 (64.8%) |
Female Fertility in Supreme
Fertility by Age in Supreme
| Age Bracket | Women with Births | Births / 1,000 Women |
| 15 to 19 years | 0 (0.0%) | 0.0 |
| 20 to 34 years | 0 (0.0%) | 0.0 |
| 35 to 50 years | 0 (0.0%) | 0.0 |
| Total | 0 (0.0%) | 0.0 |
Fertility by Age by Marriage Status in Supreme
| Age Bracket | Married | Unmarried |
| 15 to 19 years | 0 (0.0%) | 0 (0.0%) |
| 20 to 34 years | 0 (0.0%) | 0 (0.0%) |
| 35 to 50 years | 0 (0.0%) | 0 (0.0%) |
| Total | 0 (0.0%) | 0 (0.0%) |
Fertility by Education in Supreme
| Educational Attainment | Women with Births | Births / 1,000 Women |
| Less than High School | 0 (0.0%) | 0.0 |
| High School Diploma | 0 (0.0%) | 0.0 |
| College or Associate's Degree | 0 (0.0%) | 0.0 |
| Bachelor's Degree | 0 (0.0%) | 0.0 |
| Graduate Degree | 0 (0.0%) | 0.0 |
| Total | 0 (0.0%) | 0.0 |
Fertility by Education by Marriage Status in Supreme
| Educational Attainment | Married | Unmarried |
| Less than High School | 0 (0.0%) | 0 (0.0%) |
| High School Diploma | 0 (0.0%) | 0 (0.0%) |
| College or Associate's Degree | 0 (0.0%) | 0 (0.0%) |
| Bachelor's Degree | 0 (0.0%) | 0 (0.0%) |
| Graduate Degree | 0 (0.0%) | 0 (0.0%) |
| Total | 0 (0.0%) | 0 (0.0%) |
Employment Characteristics in Supreme
Employment by Class of Employer in Supreme
Among the 203 employed individuals in Supreme, private company employees (178 | 87.7%), self-employed (incorporated) (16 | 7.9%), and federal government employees (9 | 4.4%) make up the most common classes of employment.
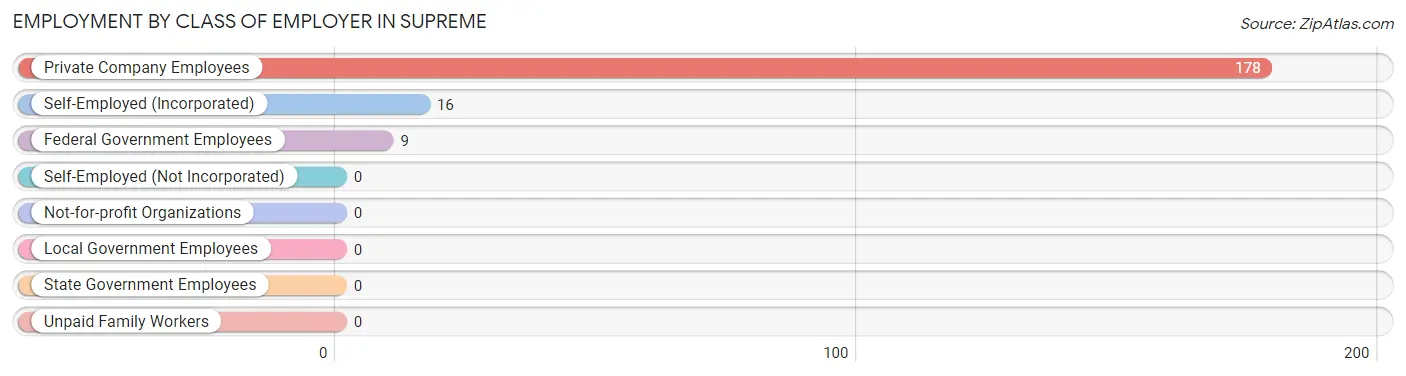
| Employer Class | # Employees | % Employees |
| Private Company Employees | 178 | 87.7% |
| Self-Employed (Incorporated) | 16 | 7.9% |
| Self-Employed (Not Incorporated) | 0 | 0.0% |
| Not-for-profit Organizations | 0 | 0.0% |
| Local Government Employees | 0 | 0.0% |
| State Government Employees | 0 | 0.0% |
| Federal Government Employees | 9 | 4.4% |
| Unpaid Family Workers | 0 | 0.0% |
| Total | 203 | 100.0% |
Employment Status by Age in Supreme
According to the labor force statistics for Supreme, out of the total population over 16 years of age (550), 42.9% or 236 individuals are in the labor force, with 2.1% or 5 of them unemployed. The age group with the highest labor force participation rate is 25 to 29 years, with 100.0% or 37 individuals in the labor force. Within the labor force, the 60 to 64 years age range has the highest percentage of unemployed individuals, with 7.9% or 5 of them being unemployed.
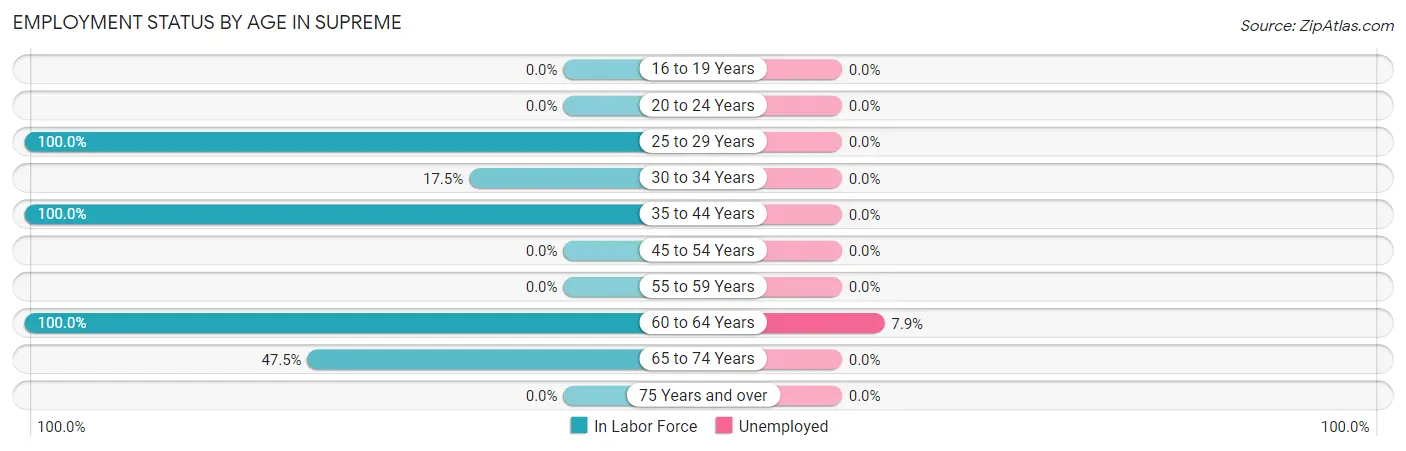
| Age Bracket | In Labor Force | Unemployed |
| 16 to 19 Years | 0 (0.0%) | 0 (0.0%) |
| 20 to 24 Years | 0 (0.0%) | 0 (0.0%) |
| 25 to 29 Years | 37 (100.0%) | 0 (0.0%) |
| 30 to 34 Years | 11 (17.5%) | 0 (0.0%) |
| 35 to 44 Years | 12 (100.0%) | 0 (0.0%) |
| 45 to 54 Years | 0 (0.0%) | 0 (0.0%) |
| 55 to 59 Years | 0 (0.0%) | 0 (0.0%) |
| 60 to 64 Years | 63 (100.0%) | 5 (7.9%) |
| 65 to 74 Years | 113 (47.5%) | 0 (0.0%) |
| 75 Years and over | 0 (0.0%) | 0 (0.0%) |
| Total | 236 (42.9%) | 5 (2.1%) |
Employment Status by Educational Attainment in Supreme
According to labor force statistics for Supreme, 57.5% of individuals (123) out of the total population between 25 and 64 years of age (214) are in the labor force, with 4.1% or 5 of them being unemployed. The group with the highest labor force participation rate are those with the educational attainment of bachelor's degree or higher, with 100.0% or 23 individuals in the labor force. Within the labor force, individuals with high school diploma education have the highest percentage of unemployment, with 9.1% or 5 of them being unemployed.
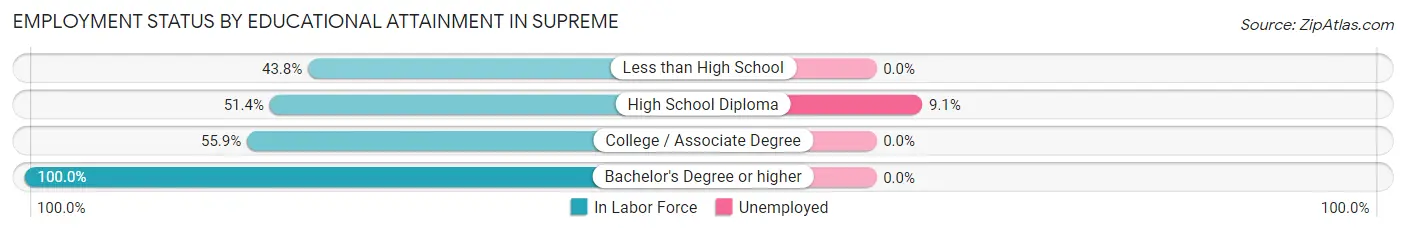
| Educational Attainment | In Labor Force | Unemployed |
| Less than High School | 7 (43.8%) | 0 (0.0%) |
| High School Diploma | 55 (51.4%) | 10 (9.1%) |
| College / Associate Degree | 38 (55.9%) | 0 (0.0%) |
| Bachelor's Degree or higher | 23 (100.0%) | 0 (0.0%) |
| Total | 123 (57.5%) | 9 (4.1%) |
Employment Occupations by Sex in Supreme
Management, Business, Science and Arts Occupations
The most common Management, Business, Science and Arts occupations in Supreme are Health Diagnosing & Treating (28 | 12.1%), Business & Financial (20 | 8.7%), Community & Social Service (12 | 5.2%), and Legal Services & Support (12 | 5.2%).
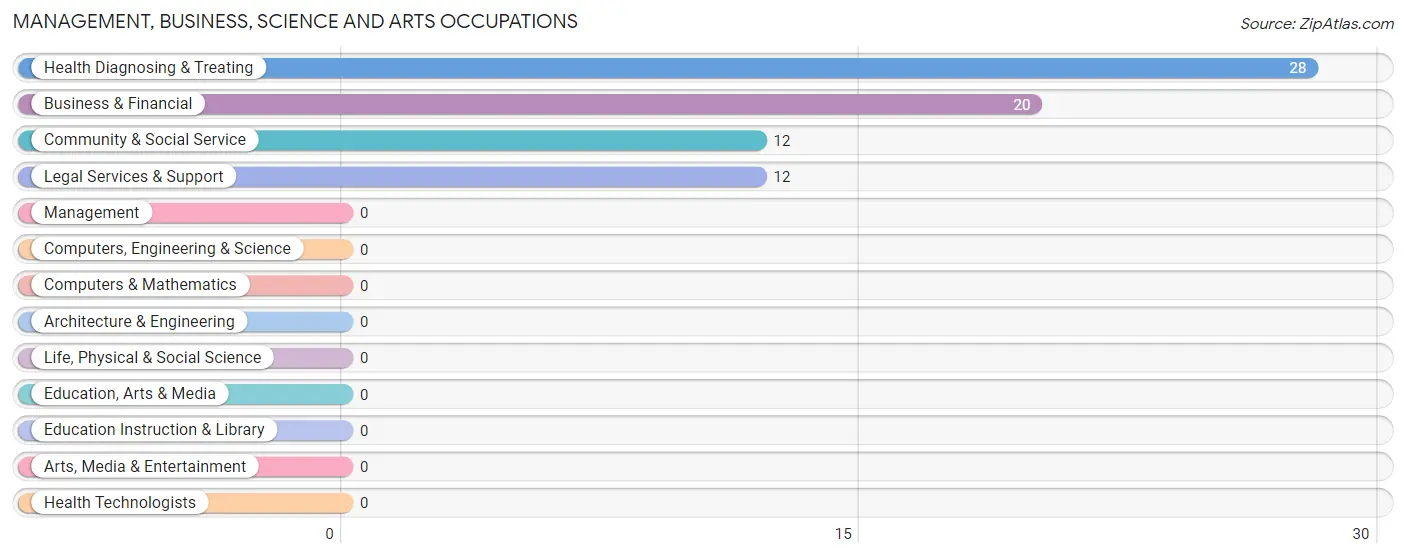
Management, Business, Science and Arts Occupations by Sex
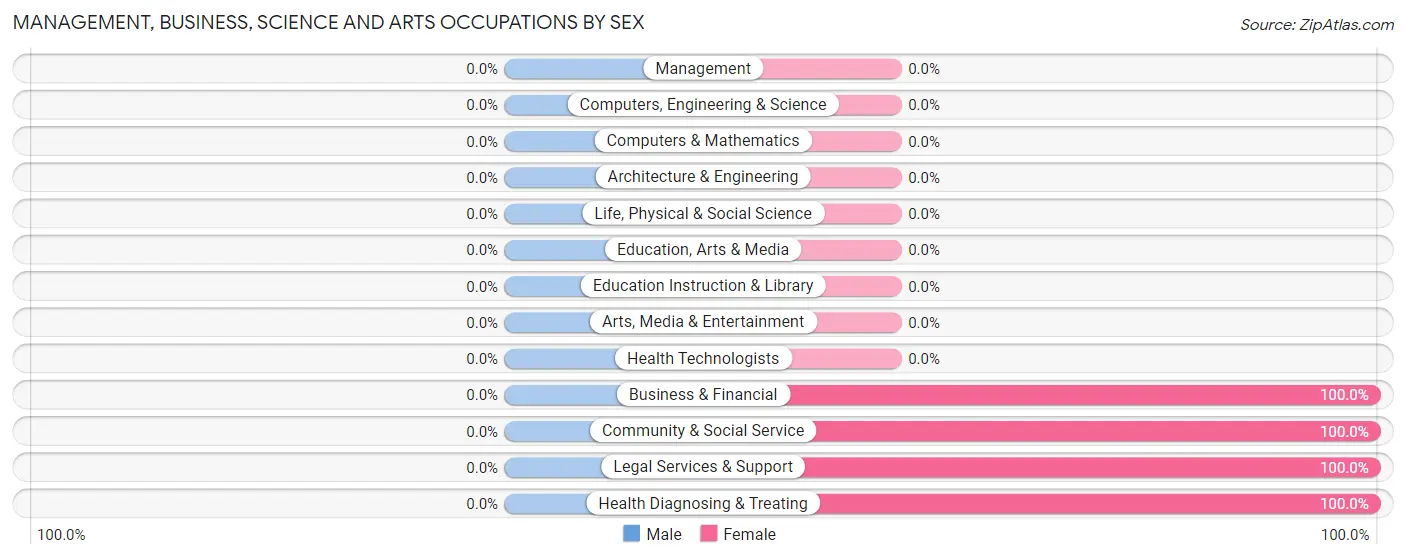
| Occupation | Male | Female |
| Management | 0 (0.0%) | 0 (0.0%) |
| Business & Financial | 0 (0.0%) | 20 (100.0%) |
| Computers, Engineering & Science | 0 (0.0%) | 0 (0.0%) |
| Computers & Mathematics | 0 (0.0%) | 0 (0.0%) |
| Architecture & Engineering | 0 (0.0%) | 0 (0.0%) |
| Life, Physical & Social Science | 0 (0.0%) | 0 (0.0%) |
| Community & Social Service | 0 (0.0%) | 12 (100.0%) |
| Education, Arts & Media | 0 (0.0%) | 0 (0.0%) |
| Legal Services & Support | 0 (0.0%) | 12 (100.0%) |
| Education Instruction & Library | 0 (0.0%) | 0 (0.0%) |
| Arts, Media & Entertainment | 0 (0.0%) | 0 (0.0%) |
| Health Diagnosing & Treating | 0 (0.0%) | 28 (100.0%) |
| Health Technologists | 0 (0.0%) | 0 (0.0%) |
| Total (Category) | 0 (0.0%) | 60 (100.0%) |
| Total (Overall) | 127 (55.0%) | 104 (45.0%) |
Services Occupations
The most common Services occupations in Supreme are , and Cleaning & Maintenance (7 | 3.0%).
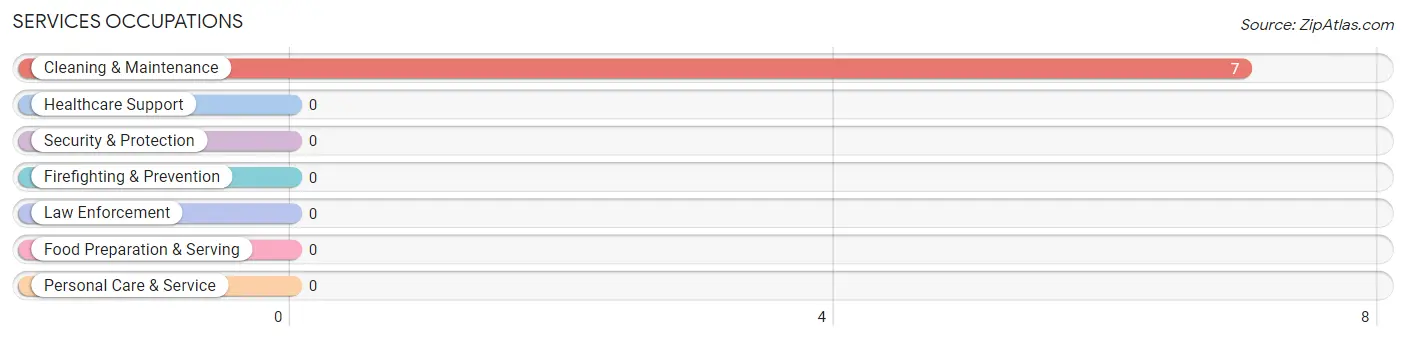
Services Occupations by Sex
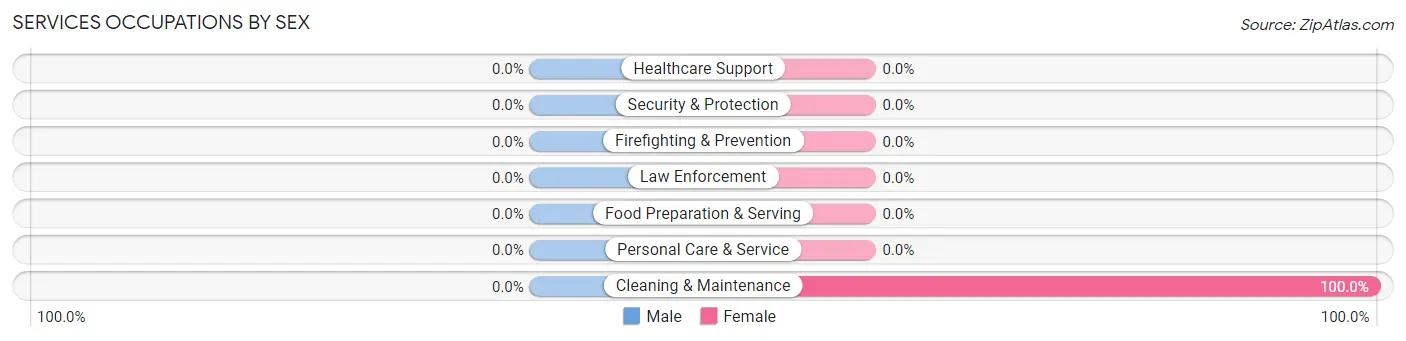
| Occupation | Male | Female |
| Healthcare Support | 0 (0.0%) | 0 (0.0%) |
| Security & Protection | 0 (0.0%) | 0 (0.0%) |
| Firefighting & Prevention | 0 (0.0%) | 0 (0.0%) |
| Law Enforcement | 0 (0.0%) | 0 (0.0%) |
| Food Preparation & Serving | 0 (0.0%) | 0 (0.0%) |
| Cleaning & Maintenance | 0 (0.0%) | 7 (100.0%) |
| Personal Care & Service | 0 (0.0%) | 0 (0.0%) |
| Total (Category) | 0 (0.0%) | 7 (100.0%) |
| Total (Overall) | 127 (55.0%) | 104 (45.0%) |
Sales and Office Occupations
The most common Sales and Office occupations in Supreme are , and Office & Administration (11 | 4.8%).
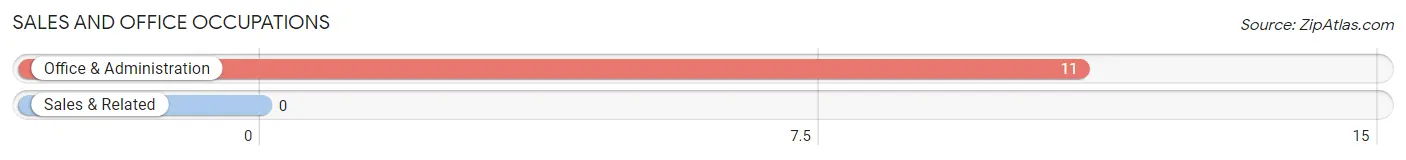
Sales and Office Occupations by Sex
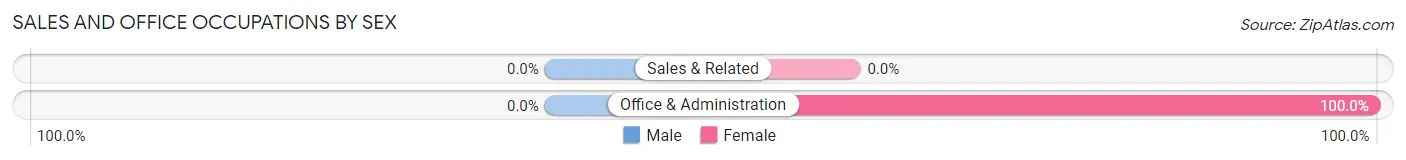
| Occupation | Male | Female |
| Sales & Related | 0 (0.0%) | 0 (0.0%) |
| Office & Administration | 0 (0.0%) | 11 (100.0%) |
| Total (Category) | 0 (0.0%) | 11 (100.0%) |
| Total (Overall) | 127 (55.0%) | 104 (45.0%) |
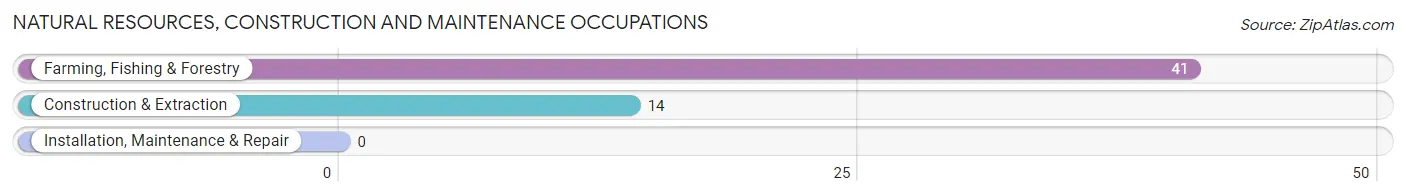
Natural Resources, Construction and Maintenance Occupations
The most common Natural Resources, Construction and Maintenance occupations in Supreme are Farming, Fishing & Forestry (41 | 17.7%), and Construction & Extraction (14 | 6.1%).
Natural Resources, Construction and Maintenance Occupations by Sex
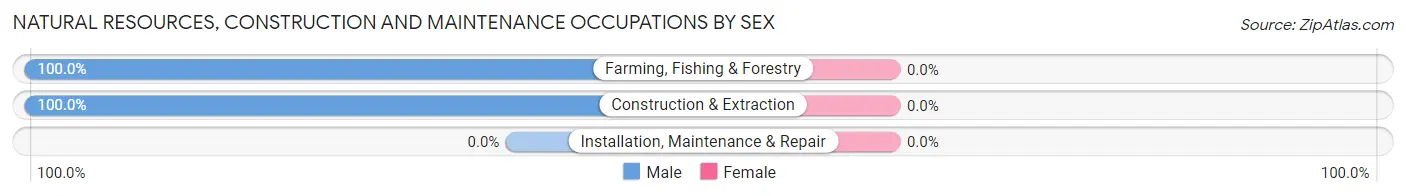
| Occupation | Male | Female |
| Farming, Fishing & Forestry | 41 (100.0%) | 0 (0.0%) |
| Construction & Extraction | 14 (100.0%) | 0 (0.0%) |
| Installation, Maintenance & Repair | 0 (0.0%) | 0 (0.0%) |
| Total (Category) | 55 (100.0%) | 0 (0.0%) |
| Total (Overall) | 127 (55.0%) | 104 (45.0%) |
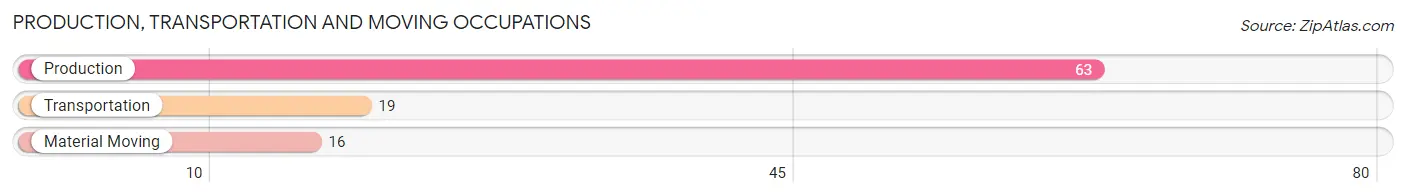
Production, Transportation and Moving Occupations
The most common Production, Transportation and Moving occupations in Supreme are Production (63 | 27.3%), Transportation (19 | 8.2%), and Material Moving (16 | 6.9%).
Production, Transportation and Moving Occupations by Sex
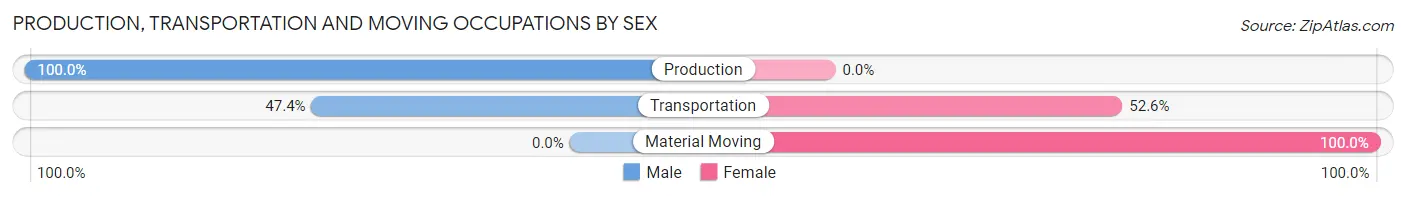
| Occupation | Male | Female |
| Production | 63 (100.0%) | 0 (0.0%) |
| Transportation | 9 (47.4%) | 10 (52.6%) |
| Material Moving | 0 (0.0%) | 16 (100.0%) |
| Total (Category) | 72 (73.5%) | 26 (26.5%) |
| Total (Overall) | 127 (55.0%) | 104 (45.0%) |
Employment Industries by Sex in Supreme
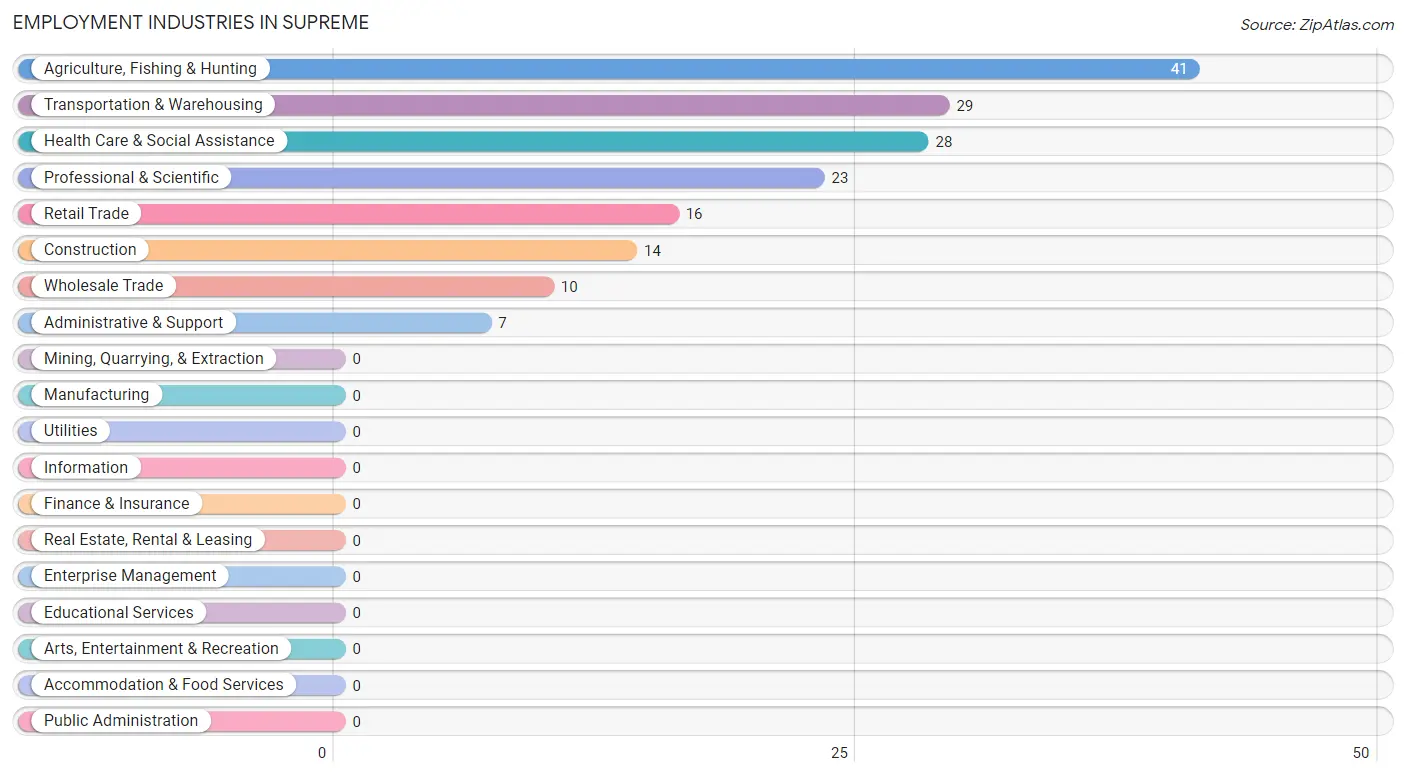
Employment Industries in Supreme
The major employment industries in Supreme include Agriculture, Fishing & Hunting (41 | 17.7%), Transportation & Warehousing (29 | 12.6%), Health Care & Social Assistance (28 | 12.1%), Professional & Scientific (23 | 10.0%), and Retail Trade (16 | 6.9%).
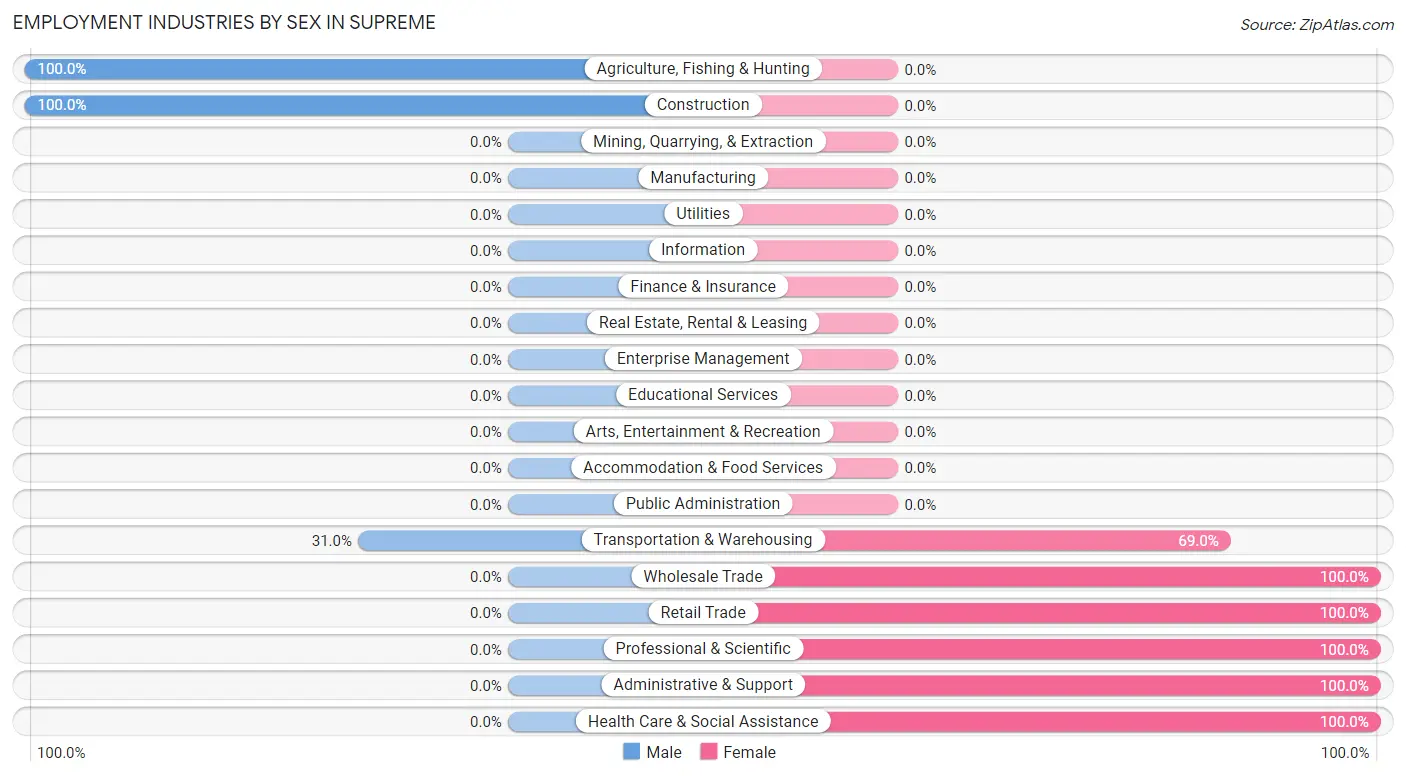
Employment Industries by Sex in Supreme
The Supreme industries that see more men than women are Agriculture, Fishing & Hunting (100.0%), Construction (100.0%), and Transportation & Warehousing (31.0%), whereas the industries that tend to have a higher number of women are Wholesale Trade (100.0%), Retail Trade (100.0%), and Professional & Scientific (100.0%).
| Industry | Male | Female |
| Agriculture, Fishing & Hunting | 41 (100.0%) | 0 (0.0%) |
| Mining, Quarrying, & Extraction | 0 (0.0%) | 0 (0.0%) |
| Construction | 14 (100.0%) | 0 (0.0%) |
| Manufacturing | 0 (0.0%) | 0 (0.0%) |
| Wholesale Trade | 0 (0.0%) | 10 (100.0%) |
| Retail Trade | 0 (0.0%) | 16 (100.0%) |
| Transportation & Warehousing | 9 (31.0%) | 20 (69.0%) |
| Utilities | 0 (0.0%) | 0 (0.0%) |
| Information | 0 (0.0%) | 0 (0.0%) |
| Finance & Insurance | 0 (0.0%) | 0 (0.0%) |
| Real Estate, Rental & Leasing | 0 (0.0%) | 0 (0.0%) |
| Professional & Scientific | 0 (0.0%) | 23 (100.0%) |
| Enterprise Management | 0 (0.0%) | 0 (0.0%) |
| Administrative & Support | 0 (0.0%) | 7 (100.0%) |
| Educational Services | 0 (0.0%) | 0 (0.0%) |
| Health Care & Social Assistance | 0 (0.0%) | 28 (100.0%) |
| Arts, Entertainment & Recreation | 0 (0.0%) | 0 (0.0%) |
| Accommodation & Food Services | 0 (0.0%) | 0 (0.0%) |
| Public Administration | 0 (0.0%) | 0 (0.0%) |
| Total | 127 (55.0%) | 104 (45.0%) |
Education in Supreme
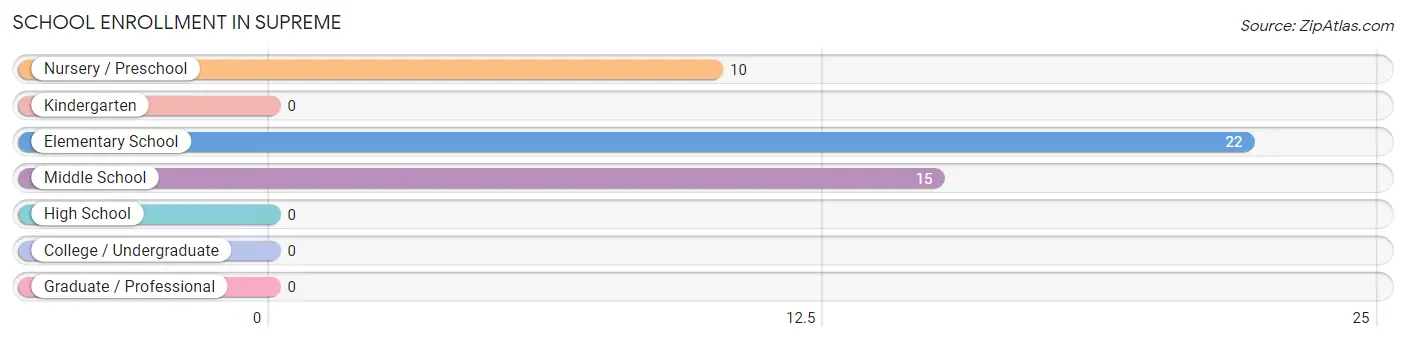
School Enrollment in Supreme
The most common levels of schooling among the 47 students in Supreme are elementary school (22 | 46.8%), middle school (15 | 31.9%), and nursery / preschool (10 | 21.3%).
| School Level | # Students | % Students |
| Nursery / Preschool | 10 | 21.3% |
| Kindergarten | 0 | 0.0% |
| Elementary School | 22 | 46.8% |
| Middle School | 15 | 31.9% |
| High School | 0 | 0.0% |
| College / Undergraduate | 0 | 0.0% |
| Graduate / Professional | 0 | 0.0% |
| Total | 47 | 100.0% |
School Enrollment by Age by Funding Source in Supreme
Out of a total of 47 students who are enrolled in schools in Supreme, 10 (21.3%) attend a private institution, while the remaining 37 (78.7%) are enrolled in public schools. The age group of 3 to 4 year olds has the highest likelihood of being enrolled in private schools, with 10 (100.0% in the age bracket) enrolled. Conversely, the age group of 5 to 9 year old has the lowest likelihood of being enrolled in a private school, with 22 (100.0% in the age bracket) attending a public institution.
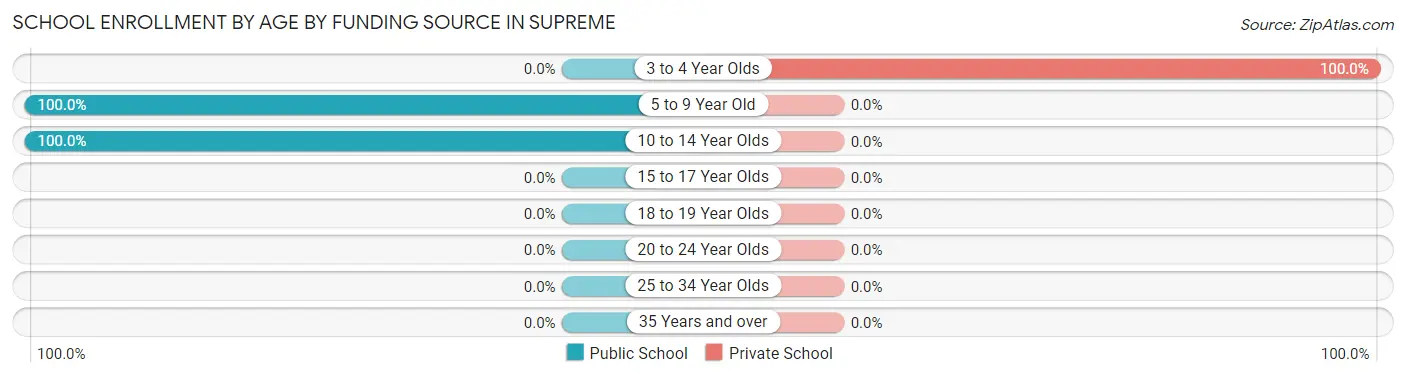
| Age Bracket | Public School | Private School |
| 3 to 4 Year Olds | 0 (0.0%) | 10 (100.0%) |
| 5 to 9 Year Old | 22 (100.0%) | 0 (0.0%) |
| 10 to 14 Year Olds | 15 (100.0%) | 0 (0.0%) |
| 15 to 17 Year Olds | 0 (0.0%) | 0 (0.0%) |
| 18 to 19 Year Olds | 0 (0.0%) | 0 (0.0%) |
| 20 to 24 Year Olds | 0 (0.0%) | 0 (0.0%) |
| 25 to 34 Year Olds | 0 (0.0%) | 0 (0.0%) |
| 35 Years and over | 0 (0.0%) | 0 (0.0%) |
| Total | 37 (78.7%) | 10 (21.3%) |
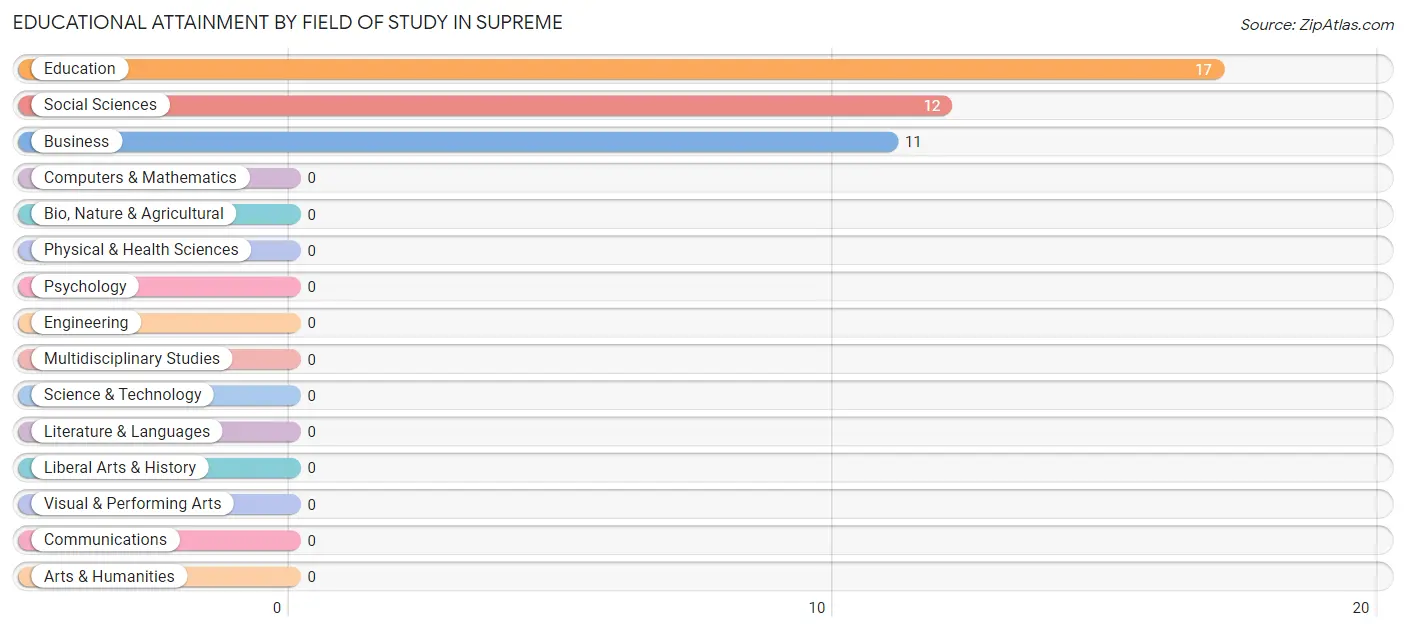
Educational Attainment by Field of Study in Supreme
Education (17 | 42.5%), social sciences (12 | 30.0%), and business (11 | 27.5%) are the most common fields of study among 40 individuals in Supreme who have obtained a bachelor's degree or higher.
| Field of Study | # Graduates | % Graduates |
| Computers & Mathematics | 0 | 0.0% |
| Bio, Nature & Agricultural | 0 | 0.0% |
| Physical & Health Sciences | 0 | 0.0% |
| Psychology | 0 | 0.0% |
| Social Sciences | 12 | 30.0% |
| Engineering | 0 | 0.0% |
| Multidisciplinary Studies | 0 | 0.0% |
| Science & Technology | 0 | 0.0% |
| Business | 11 | 27.5% |
| Education | 17 | 42.5% |
| Literature & Languages | 0 | 0.0% |
| Liberal Arts & History | 0 | 0.0% |
| Visual & Performing Arts | 0 | 0.0% |
| Communications | 0 | 0.0% |
| Arts & Humanities | 0 | 0.0% |
| Total | 40 | 100.0% |
Transportation & Commute in Supreme
Vehicle Availability by Sex in Supreme
The most prevalent vehicle ownership categories in Supreme are males with 3 vehicles (63, accounting for 49.6%) and females with 3 vehicles (0, making up 82.9%).
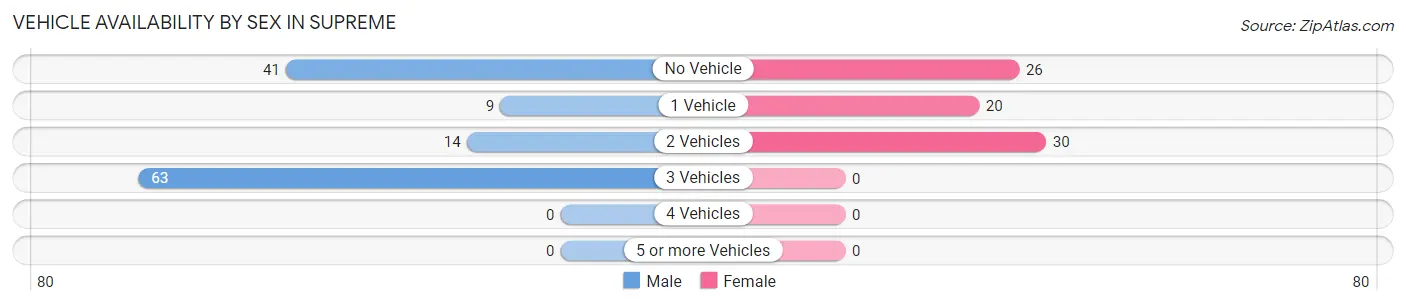
| Vehicles Available | Male | Female |
| No Vehicle | 41 (32.3%) | 26 (34.2%) |
| 1 Vehicle | 9 (7.1%) | 20 (26.3%) |
| 2 Vehicles | 14 (11.0%) | 30 (39.5%) |
| 3 Vehicles | 63 (49.6%) | 0 (0.0%) |
| 4 Vehicles | 0 (0.0%) | 0 (0.0%) |
| 5 or more Vehicles | 0 (0.0%) | 0 (0.0%) |
| Total | 127 (100.0%) | 76 (100.0%) |
Commute Time in Supreme
The most frequently occuring commute durations in Supreme are 20 to 24 minutes (73 commuters, 39.9%), 10 to 14 minutes (66 commuters, 36.1%), and 30 to 34 minutes (23 commuters, 12.6%).
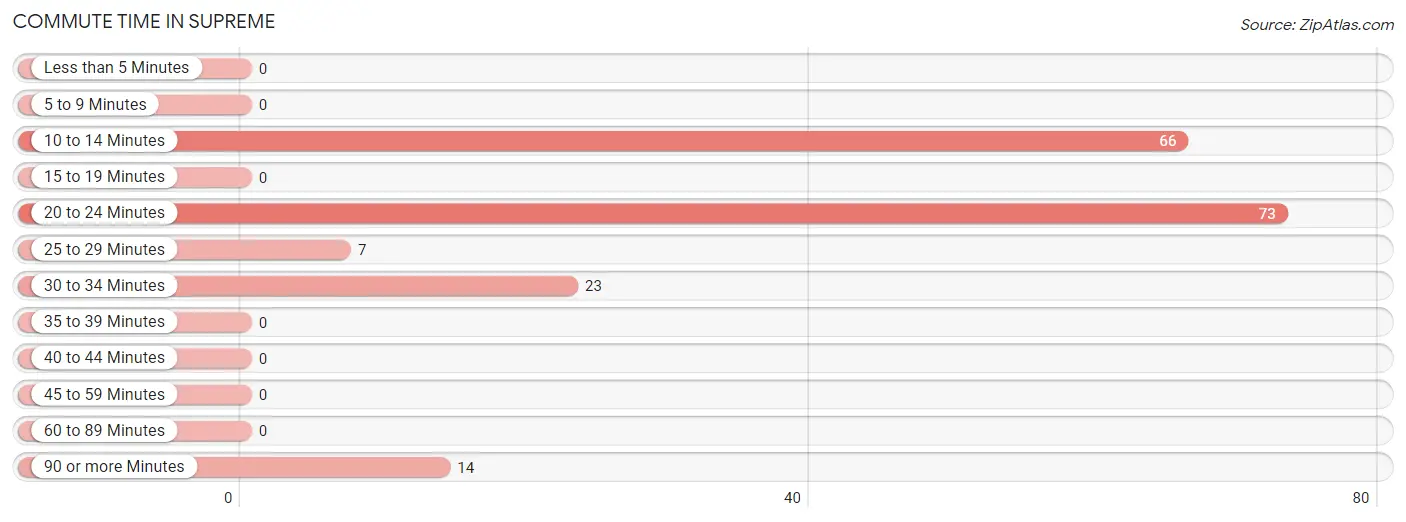
| Commute Time | # Commuters | % Commuters |
| Less than 5 Minutes | 0 | 0.0% |
| 5 to 9 Minutes | 0 | 0.0% |
| 10 to 14 Minutes | 66 | 36.1% |
| 15 to 19 Minutes | 0 | 0.0% |
| 20 to 24 Minutes | 73 | 39.9% |
| 25 to 29 Minutes | 7 | 3.8% |
| 30 to 34 Minutes | 23 | 12.6% |
| 35 to 39 Minutes | 0 | 0.0% |
| 40 to 44 Minutes | 0 | 0.0% |
| 45 to 59 Minutes | 0 | 0.0% |
| 60 to 89 Minutes | 0 | 0.0% |
| 90 or more Minutes | 14 | 7.6% |
Commute Time by Sex in Supreme
The most common commute times in Supreme are 20 to 24 minutes (63 commuters, 49.6%) for males and 30 to 34 minutes (23 commuters, 41.1%) for females.
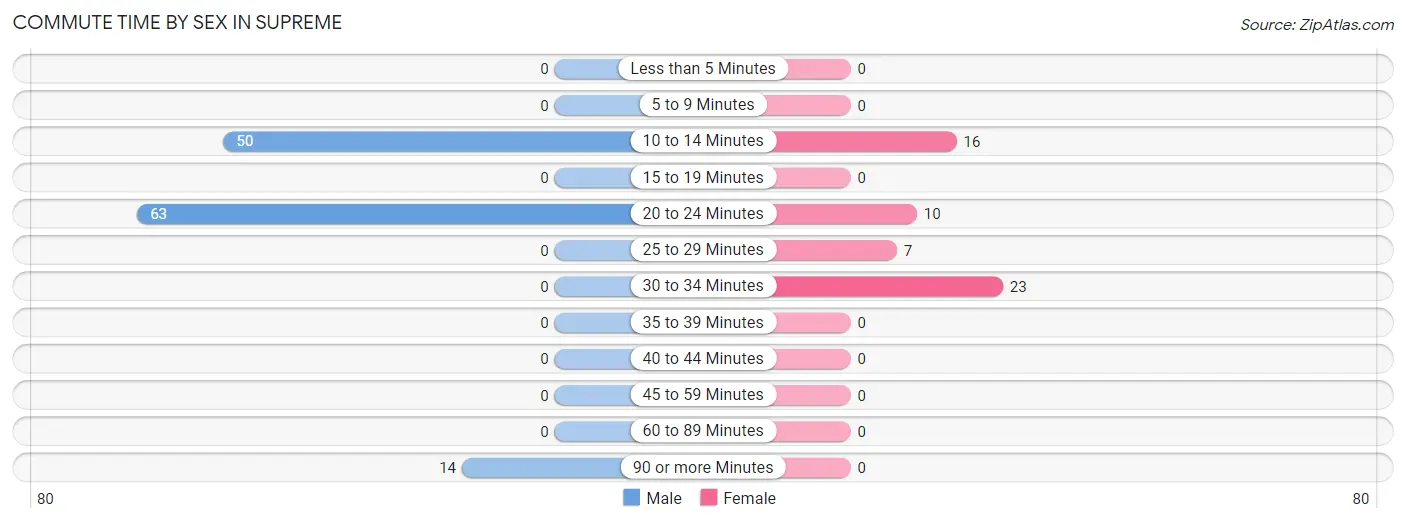
| Commute Time | Male | Female |
| Less than 5 Minutes | 0 (0.0%) | 0 (0.0%) |
| 5 to 9 Minutes | 0 (0.0%) | 0 (0.0%) |
| 10 to 14 Minutes | 50 (39.4%) | 16 (28.6%) |
| 15 to 19 Minutes | 0 (0.0%) | 0 (0.0%) |
| 20 to 24 Minutes | 63 (49.6%) | 10 (17.9%) |
| 25 to 29 Minutes | 0 (0.0%) | 7 (12.5%) |
| 30 to 34 Minutes | 0 (0.0%) | 23 (41.1%) |
| 35 to 39 Minutes | 0 (0.0%) | 0 (0.0%) |
| 40 to 44 Minutes | 0 (0.0%) | 0 (0.0%) |
| 45 to 59 Minutes | 0 (0.0%) | 0 (0.0%) |
| 60 to 89 Minutes | 0 (0.0%) | 0 (0.0%) |
| 90 or more Minutes | 14 (11.0%) | 0 (0.0%) |
Time of Departure to Work by Sex in Supreme
The most frequent times of departure to work in Supreme are 6:00 AM to 6:29 AM (63, 49.6%) for males and 7:30 AM to 7:59 AM (22, 39.3%) for females.
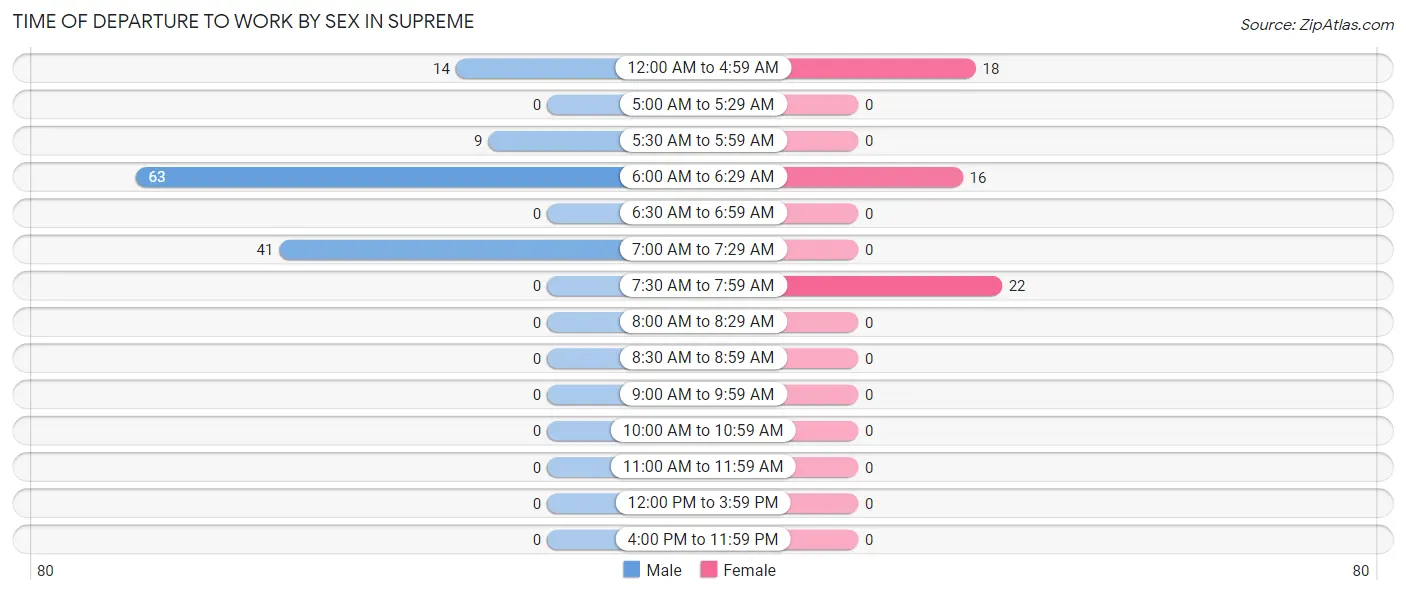
| Time of Departure | Male | Female |
| 12:00 AM to 4:59 AM | 14 (11.0%) | 18 (32.1%) |
| 5:00 AM to 5:29 AM | 0 (0.0%) | 0 (0.0%) |
| 5:30 AM to 5:59 AM | 9 (7.1%) | 0 (0.0%) |
| 6:00 AM to 6:29 AM | 63 (49.6%) | 16 (28.6%) |
| 6:30 AM to 6:59 AM | 0 (0.0%) | 0 (0.0%) |
| 7:00 AM to 7:29 AM | 41 (32.3%) | 0 (0.0%) |
| 7:30 AM to 7:59 AM | 0 (0.0%) | 22 (39.3%) |
| 8:00 AM to 8:29 AM | 0 (0.0%) | 0 (0.0%) |
| 8:30 AM to 8:59 AM | 0 (0.0%) | 0 (0.0%) |
| 9:00 AM to 9:59 AM | 0 (0.0%) | 0 (0.0%) |
| 10:00 AM to 10:59 AM | 0 (0.0%) | 0 (0.0%) |
| 11:00 AM to 11:59 AM | 0 (0.0%) | 0 (0.0%) |
| 12:00 PM to 3:59 PM | 0 (0.0%) | 0 (0.0%) |
| 4:00 PM to 11:59 PM | 0 (0.0%) | 0 (0.0%) |
| Total | 127 (100.0%) | 56 (100.0%) |
Housing Occupancy in Supreme
Occupancy by Ownership in Supreme
Of the total 301 dwellings in Supreme, owner-occupied units account for 220 (73.1%), while renter-occupied units make up 81 (26.9%).
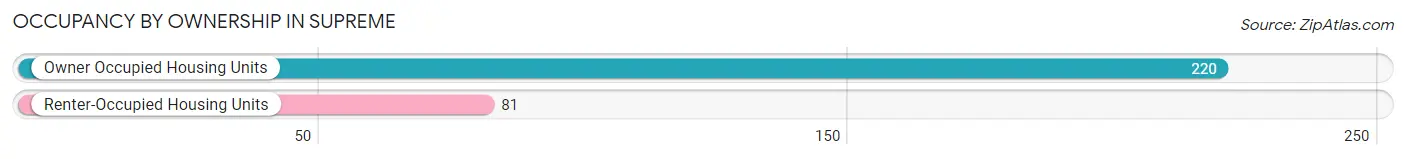
| Occupancy | # Housing Units | % Housing Units |
| Owner Occupied Housing Units | 220 | 73.1% |
| Renter-Occupied Housing Units | 81 | 26.9% |
| Total Occupied Housing Units | 301 | 100.0% |
Occupancy by Household Size in Supreme
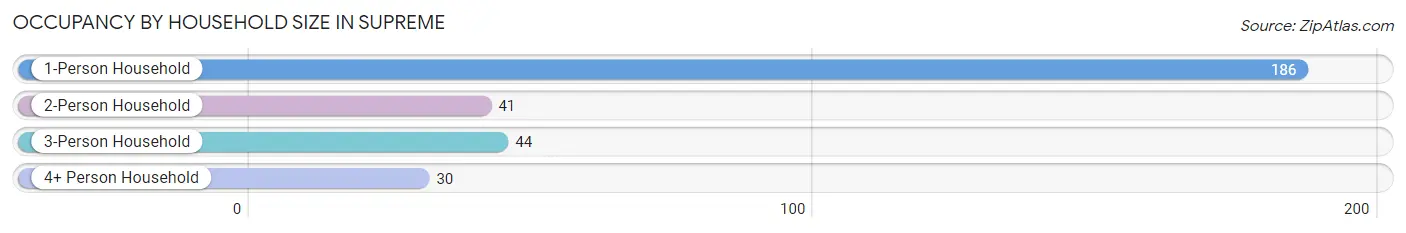
| Household Size | # Housing Units | % Housing Units |
| 1-Person Household | 186 | 61.8% |
| 2-Person Household | 41 | 13.6% |
| 3-Person Household | 44 | 14.6% |
| 4+ Person Household | 30 | 10.0% |
| Total Housing Units | 301 | 100.0% |
Occupancy by Ownership by Household Size in Supreme
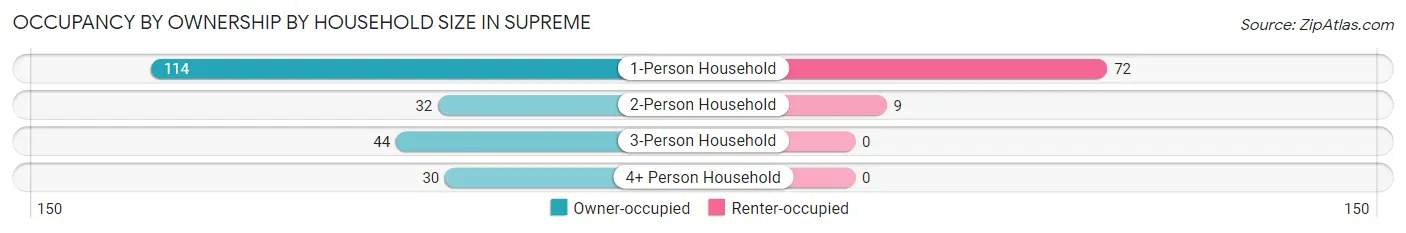
| Household Size | Owner-occupied | Renter-occupied |
| 1-Person Household | 114 (61.3%) | 72 (38.7%) |
| 2-Person Household | 32 (78.0%) | 9 (22.0%) |
| 3-Person Household | 44 (100.0%) | 0 (0.0%) |
| 4+ Person Household | 30 (100.0%) | 0 (0.0%) |
| Total Housing Units | 220 (73.1%) | 81 (26.9%) |
Occupancy by Educational Attainment in Supreme
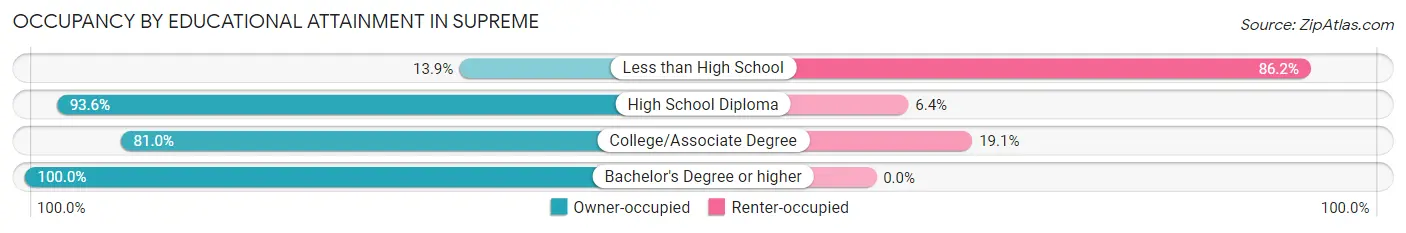
| Household Size | Owner-occupied | Renter-occupied |
| Less than High School | 9 (13.9%) | 56 (86.2%) |
| High School Diploma | 132 (93.6%) | 9 (6.4%) |
| College/Associate Degree | 68 (80.9%) | 16 (19.1%) |
| Bachelor's Degree or higher | 11 (100.0%) | 0 (0.0%) |
Occupancy by Age of Householder in Supreme
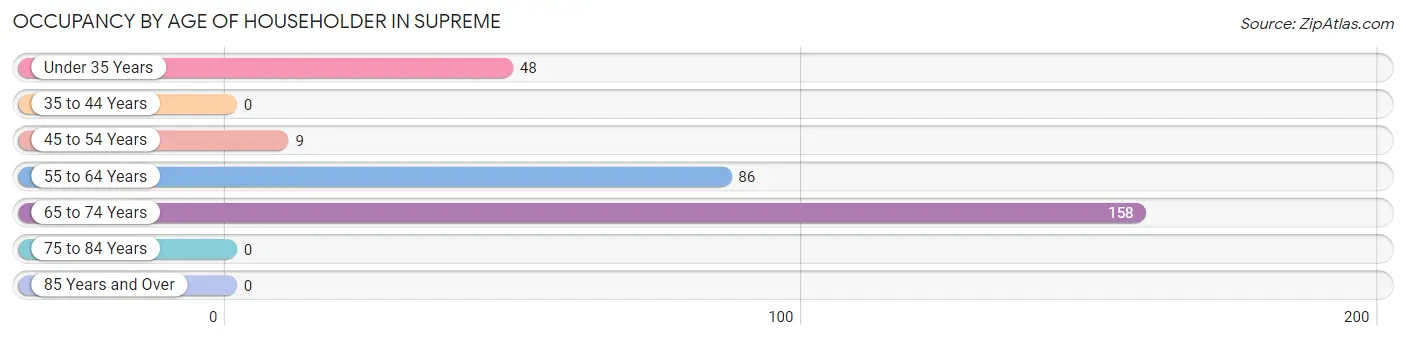
| Age Bracket | # Households | % Households |
| Under 35 Years | 48 | 16.0% |
| 35 to 44 Years | 0 | 0.0% |
| 45 to 54 Years | 9 | 3.0% |
| 55 to 64 Years | 86 | 28.6% |
| 65 to 74 Years | 158 | 52.5% |
| 75 to 84 Years | 0 | 0.0% |
| 85 Years and Over | 0 | 0.0% |
| Total | 301 | 100.0% |
Housing Finances in Supreme
Median Income by Occupancy in Supreme
| Occupancy Type | # Households | Median Income |
| Owner-Occupied | 220 (73.1%) | $0 |
| Renter-Occupied | 81 (26.9%) | $0 |
| Average | 301 (100.0%) | $0 |
Occupancy by Householder Income Bracket in Supreme
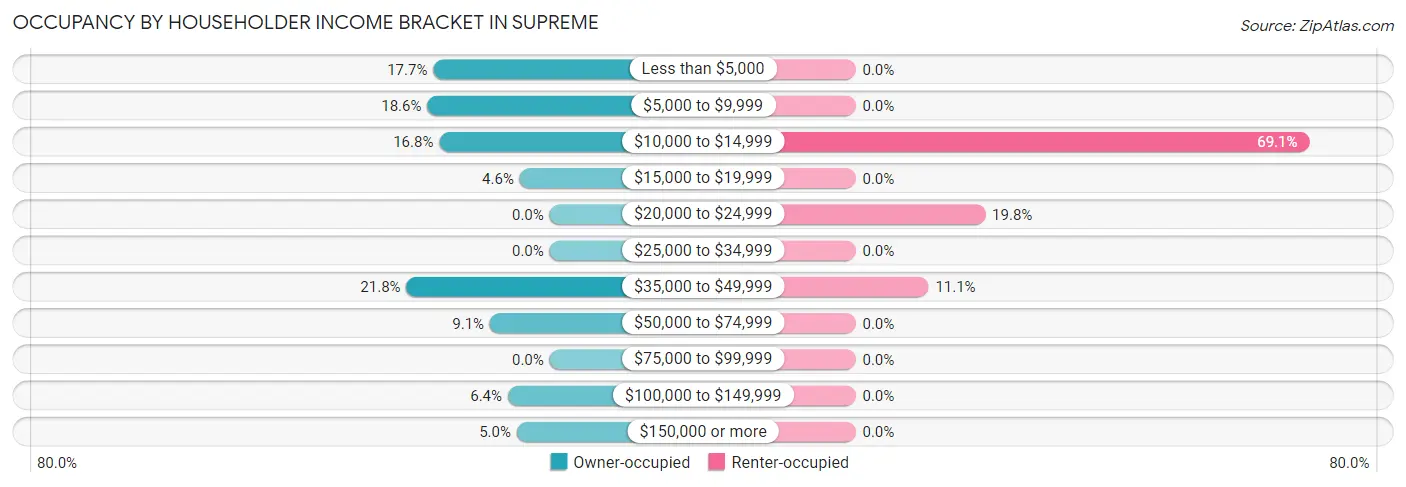
| Income Bracket | Owner-occupied | Renter-occupied |
| Less than $5,000 | 39 (17.7%) | 0 (0.0%) |
| $5,000 to $9,999 | 41 (18.6%) | 0 (0.0%) |
| $10,000 to $14,999 | 37 (16.8%) | 56 (69.1%) |
| $15,000 to $19,999 | 10 (4.5%) | 0 (0.0%) |
| $20,000 to $24,999 | 0 (0.0%) | 16 (19.8%) |
| $25,000 to $34,999 | 0 (0.0%) | 0 (0.0%) |
| $35,000 to $49,999 | 48 (21.8%) | 9 (11.1%) |
| $50,000 to $74,999 | 20 (9.1%) | 0 (0.0%) |
| $75,000 to $99,999 | 0 (0.0%) | 0 (0.0%) |
| $100,000 to $149,999 | 14 (6.4%) | 0 (0.0%) |
| $150,000 or more | 11 (5.0%) | 0 (0.0%) |
| Total | 220 (100.0%) | 81 (100.0%) |
Monthly Housing Cost Tiers in Supreme
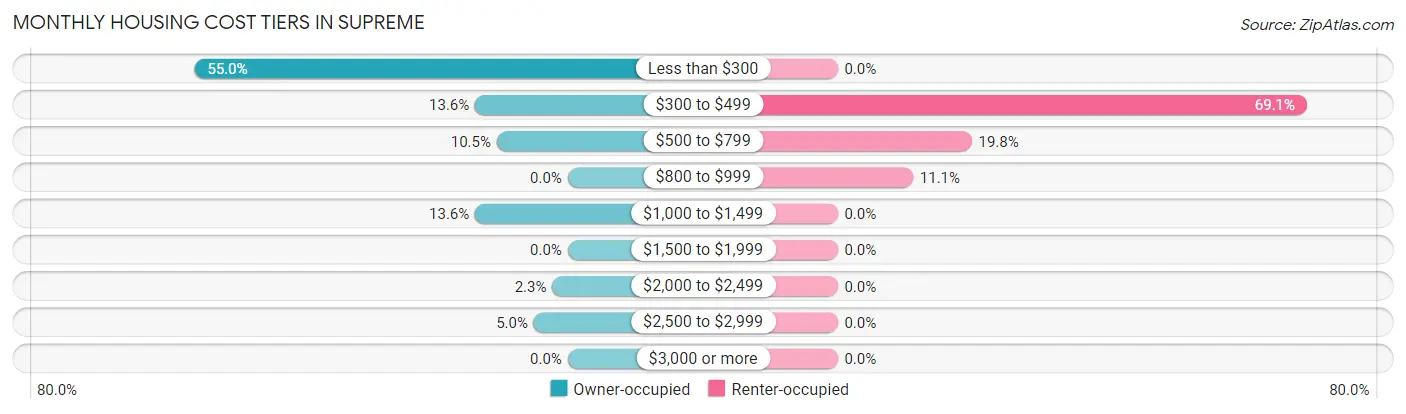
| Monthly Cost | Owner-occupied | Renter-occupied |
| Less than $300 | 121 (55.0%) | 0 (0.0%) |
| $300 to $499 | 30 (13.6%) | 56 (69.1%) |
| $500 to $799 | 23 (10.4%) | 16 (19.8%) |
| $800 to $999 | 0 (0.0%) | 9 (11.1%) |
| $1,000 to $1,499 | 30 (13.6%) | 0 (0.0%) |
| $1,500 to $1,999 | 0 (0.0%) | 0 (0.0%) |
| $2,000 to $2,499 | 5 (2.3%) | 0 (0.0%) |
| $2,500 to $2,999 | 11 (5.0%) | 0 (0.0%) |
| $3,000 or more | 0 (0.0%) | 0 (0.0%) |
| Total | 220 (100.0%) | 81 (100.0%) |
Physical Housing Characteristics in Supreme
Housing Structures in Supreme
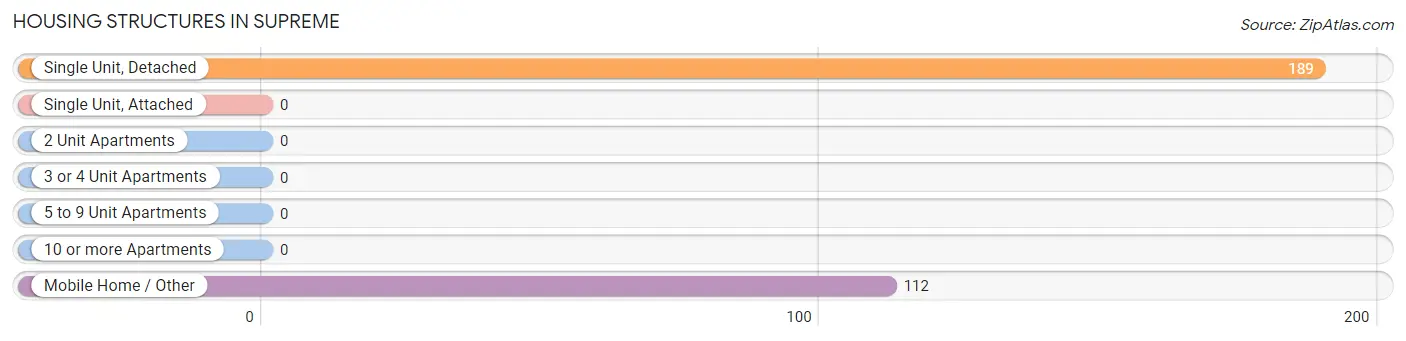
| Structure Type | # Housing Units | % Housing Units |
| Single Unit, Detached | 189 | 62.8% |
| Single Unit, Attached | 0 | 0.0% |
| 2 Unit Apartments | 0 | 0.0% |
| 3 or 4 Unit Apartments | 0 | 0.0% |
| 5 to 9 Unit Apartments | 0 | 0.0% |
| 10 or more Apartments | 0 | 0.0% |
| Mobile Home / Other | 112 | 37.2% |
| Total | 301 | 100.0% |
Housing Structures by Occupancy in Supreme
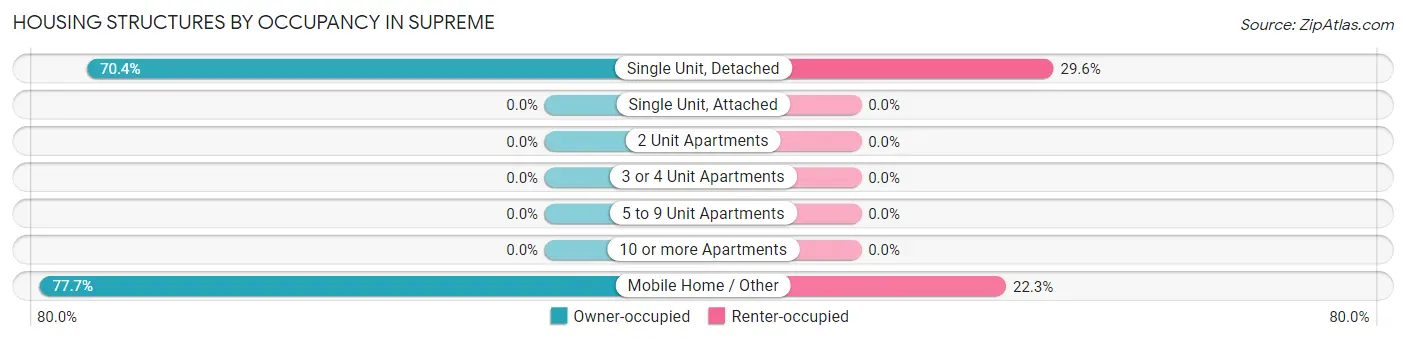
| Structure Type | Owner-occupied | Renter-occupied |
| Single Unit, Detached | 133 (70.4%) | 56 (29.6%) |
| Single Unit, Attached | 0 (0.0%) | 0 (0.0%) |
| 2 Unit Apartments | 0 (0.0%) | 0 (0.0%) |
| 3 or 4 Unit Apartments | 0 (0.0%) | 0 (0.0%) |
| 5 to 9 Unit Apartments | 0 (0.0%) | 0 (0.0%) |
| 10 or more Apartments | 0 (0.0%) | 0 (0.0%) |
| Mobile Home / Other | 87 (77.7%) | 25 (22.3%) |
| Total | 220 (73.1%) | 81 (26.9%) |
Housing Structures by Number of Rooms in Supreme
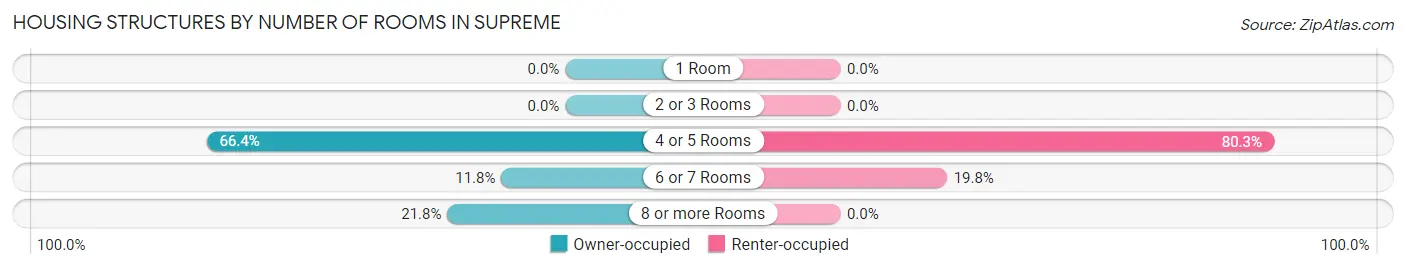
| Number of Rooms | Owner-occupied | Renter-occupied |
| 1 Room | 0 (0.0%) | 0 (0.0%) |
| 2 or 3 Rooms | 0 (0.0%) | 0 (0.0%) |
| 4 or 5 Rooms | 146 (66.4%) | 65 (80.2%) |
| 6 or 7 Rooms | 26 (11.8%) | 16 (19.8%) |
| 8 or more Rooms | 48 (21.8%) | 0 (0.0%) |
| Total | 220 (100.0%) | 81 (100.0%) |
Housing Structure by Heating Type in Supreme
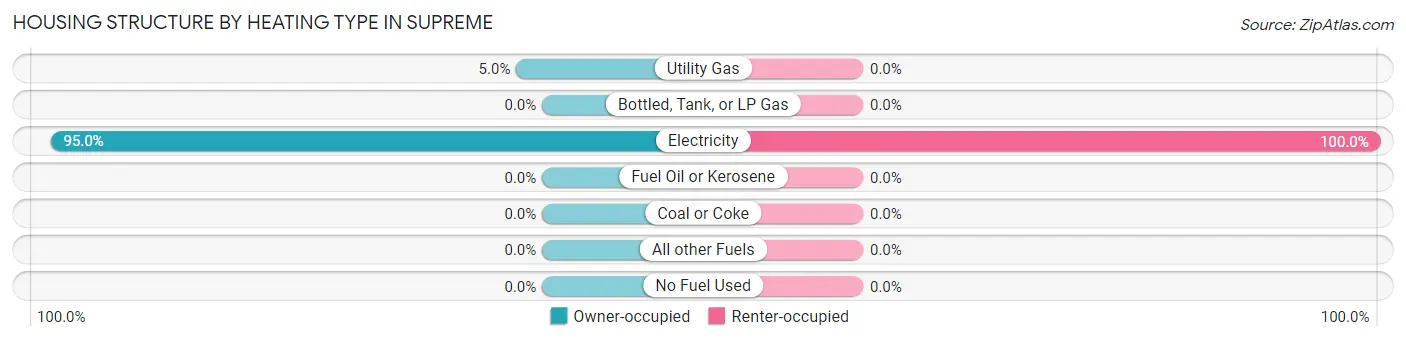
| Heating Type | Owner-occupied | Renter-occupied |
| Utility Gas | 11 (5.0%) | 0 (0.0%) |
| Bottled, Tank, or LP Gas | 0 (0.0%) | 0 (0.0%) |
| Electricity | 209 (95.0%) | 81 (100.0%) |
| Fuel Oil or Kerosene | 0 (0.0%) | 0 (0.0%) |
| Coal or Coke | 0 (0.0%) | 0 (0.0%) |
| All other Fuels | 0 (0.0%) | 0 (0.0%) |
| No Fuel Used | 0 (0.0%) | 0 (0.0%) |
| Total | 220 (100.0%) | 81 (100.0%) |
Household Vehicle Usage in Supreme
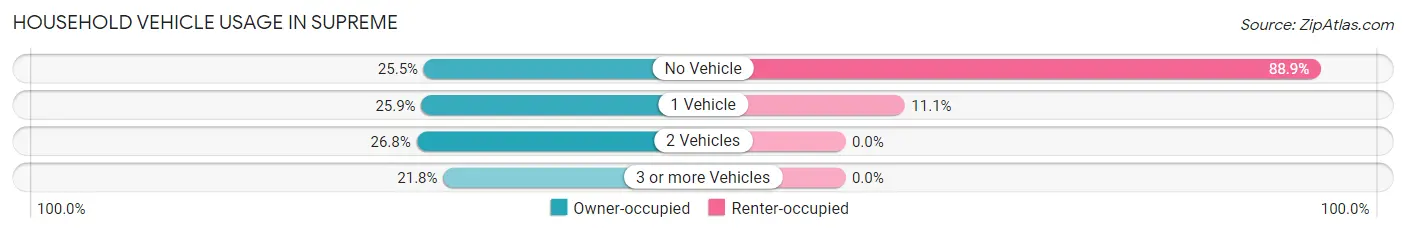
| Vehicles per Household | Owner-occupied | Renter-occupied |
| No Vehicle | 56 (25.5%) | 72 (88.9%) |
| 1 Vehicle | 57 (25.9%) | 9 (11.1%) |
| 2 Vehicles | 59 (26.8%) | 0 (0.0%) |
| 3 or more Vehicles | 48 (21.8%) | 0 (0.0%) |
| Total | 220 (100.0%) | 81 (100.0%) |
Real Estate & Mortgages in Supreme
Real Estate and Mortgage Overview in Supreme
| Characteristic | Without Mortgage | With Mortgage |
| Housing Units | 151 | 69 |
| Median Property Value | - | - |
| Median Household Income | - | - |
| Monthly Housing Costs | $263 | $0 |
| Real Estate Taxes | $199 | $14 |
Property Value by Mortgage Status in Supreme
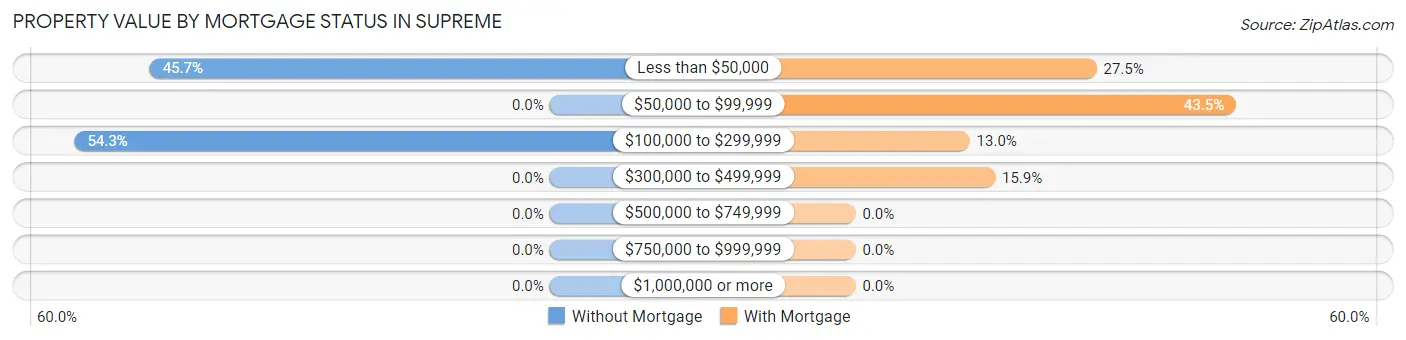
| Property Value | Without Mortgage | With Mortgage |
| Less than $50,000 | 69 (45.7%) | 19 (27.5%) |
| $50,000 to $99,999 | 0 (0.0%) | 30 (43.5%) |
| $100,000 to $299,999 | 82 (54.3%) | 9 (13.0%) |
| $300,000 to $499,999 | 0 (0.0%) | 11 (15.9%) |
| $500,000 to $749,999 | 0 (0.0%) | 0 (0.0%) |
| $750,000 to $999,999 | 0 (0.0%) | 0 (0.0%) |
| $1,000,000 or more | 0 (0.0%) | 0 (0.0%) |
| Total | 151 (100.0%) | 69 (100.0%) |
Household Income by Mortgage Status in Supreme
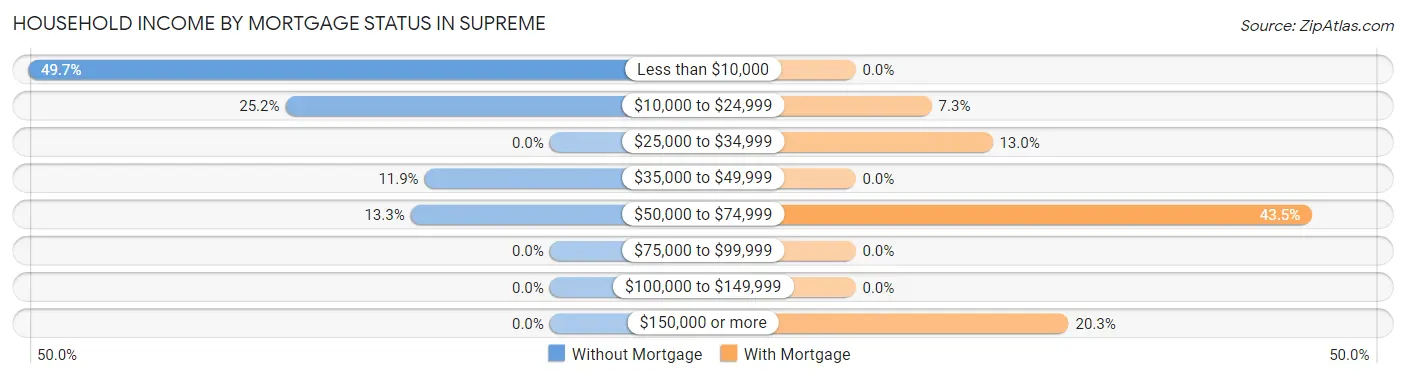
| Household Income | Without Mortgage | With Mortgage |
| Less than $10,000 | 75 (49.7%) | 0 (0.0%) |
| $10,000 to $24,999 | 38 (25.2%) | 5 (7.2%) |
| $25,000 to $34,999 | 0 (0.0%) | 9 (13.0%) |
| $35,000 to $49,999 | 18 (11.9%) | 0 (0.0%) |
| $50,000 to $74,999 | 20 (13.3%) | 30 (43.5%) |
| $75,000 to $99,999 | 0 (0.0%) | 0 (0.0%) |
| $100,000 to $149,999 | 0 (0.0%) | 0 (0.0%) |
| $150,000 or more | 0 (0.0%) | 14 (20.3%) |
| Total | 151 (100.0%) | 69 (100.0%) |
Property Value to Household Income Ratio in Supreme
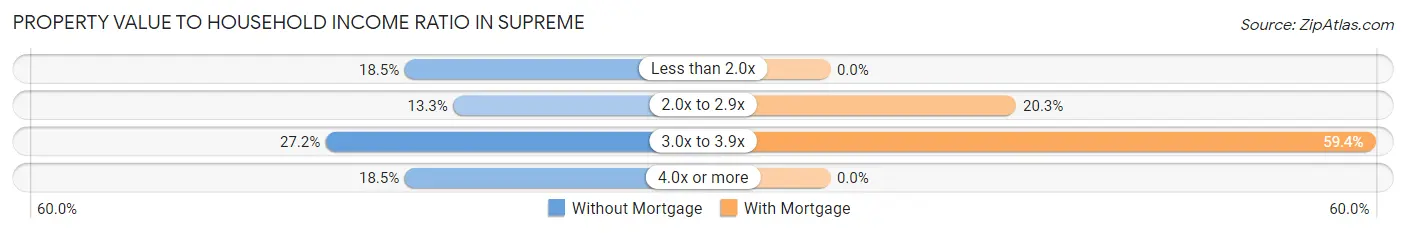
| Value-to-Income Ratio | Without Mortgage | With Mortgage |
| Less than 2.0x | 28 (18.5%) | 0 (0.0%) |
| 2.0x to 2.9x | 20 (13.3%) | 14 (20.3%) |
| 3.0x to 3.9x | 41 (27.2%) | 41 (59.4%) |
| 4.0x or more | 28 (18.5%) | 0 (0.0%) |
| Total | 151 (100.0%) | 69 (100.0%) |
Real Estate Taxes by Mortgage Status in Supreme
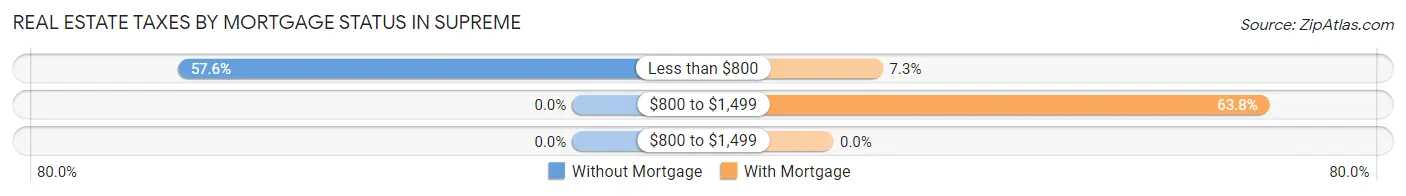
| Property Taxes | Without Mortgage | With Mortgage |
| Less than $800 | 87 (57.6%) | 5 (7.2%) |
| $800 to $1,499 | 0 (0.0%) | 44 (63.8%) |
| $800 to $1,499 | 0 (0.0%) | 0 (0.0%) |
| Total | 151 (100.0%) | 69 (100.0%) |
Health & Disability in Supreme
Health Insurance Coverage by Age in Supreme
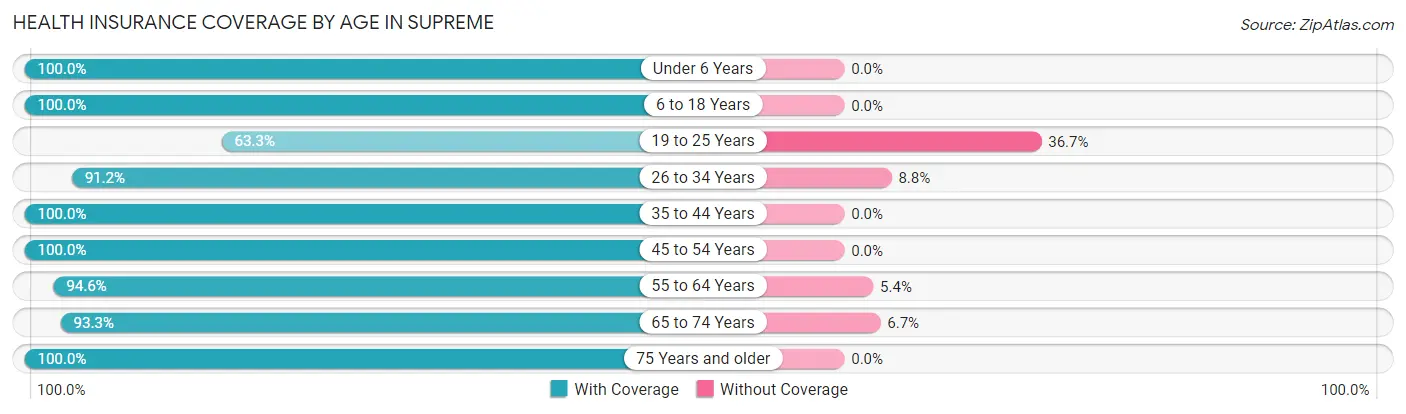
| Age Bracket | With Coverage | Without Coverage |
| Under 6 Years | 32 (100.0%) | 0 (0.0%) |
| 6 to 18 Years | 15 (100.0%) | 0 (0.0%) |
| 19 to 25 Years | 31 (63.3%) | 18 (36.7%) |
| 26 to 34 Years | 83 (91.2%) | 8 (8.8%) |
| 35 to 44 Years | 12 (100.0%) | 0 (0.0%) |
| 45 to 54 Years | 9 (100.0%) | 0 (0.0%) |
| 55 to 64 Years | 88 (94.6%) | 5 (5.4%) |
| 65 to 74 Years | 222 (93.3%) | 16 (6.7%) |
| 75 Years and older | 58 (100.0%) | 0 (0.0%) |
| Total | 550 (92.1%) | 47 (7.9%) |
Health Insurance Coverage by Citizenship Status in Supreme
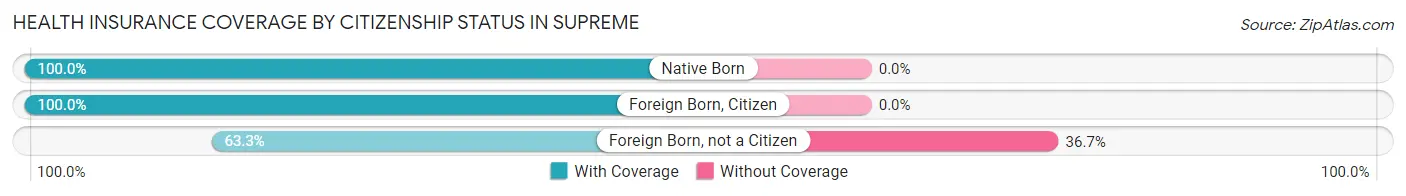
| Citizenship Status | With Coverage | Without Coverage |
| Native Born | 32 (100.0%) | 0 (0.0%) |
| Foreign Born, Citizen | 15 (100.0%) | 0 (0.0%) |
| Foreign Born, not a Citizen | 31 (63.3%) | 18 (36.7%) |
Health Insurance Coverage by Household Income in Supreme
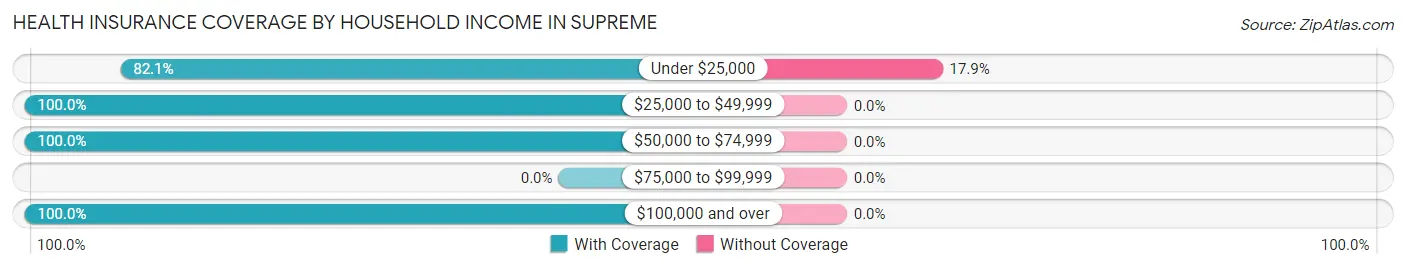
| Household Income | With Coverage | Without Coverage |
| Under $25,000 | 215 (82.1%) | 47 (17.9%) |
| $25,000 to $49,999 | 261 (100.0%) | 0 (0.0%) |
| $50,000 to $74,999 | 20 (100.0%) | 0 (0.0%) |
| $75,000 to $99,999 | 0 (0.0%) | 0 (0.0%) |
| $100,000 and over | 54 (100.0%) | 0 (0.0%) |
Public vs Private Health Insurance Coverage by Age in Supreme
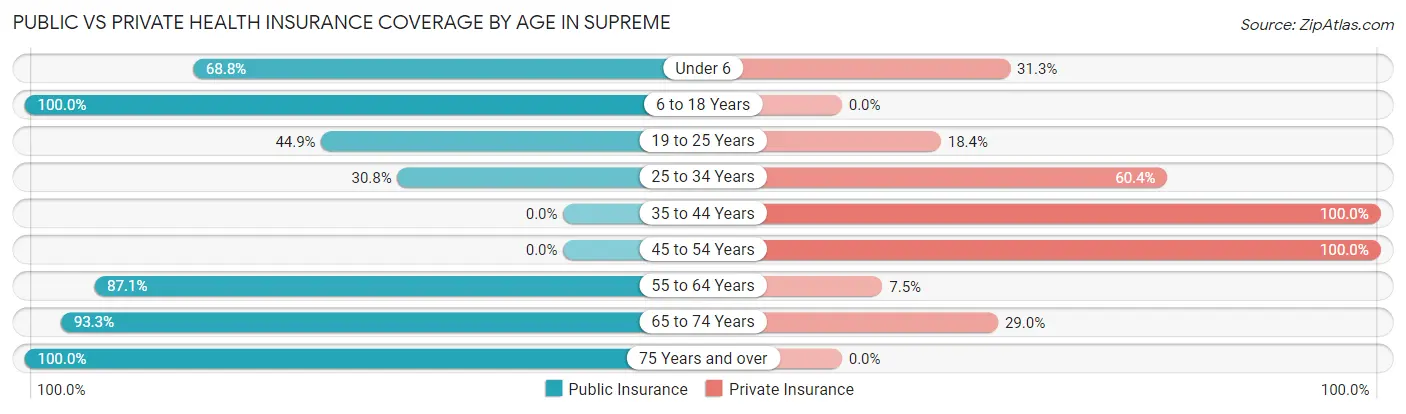
| Age Bracket | Public Insurance | Private Insurance |
| Under 6 | 22 (68.8%) | 10 (31.2%) |
| 6 to 18 Years | 15 (100.0%) | 0 (0.0%) |
| 19 to 25 Years | 22 (44.9%) | 9 (18.4%) |
| 25 to 34 Years | 28 (30.8%) | 55 (60.4%) |
| 35 to 44 Years | 0 (0.0%) | 12 (100.0%) |
| 45 to 54 Years | 0 (0.0%) | 9 (100.0%) |
| 55 to 64 Years | 81 (87.1%) | 7 (7.5%) |
| 65 to 74 Years | 222 (93.3%) | 69 (29.0%) |
| 75 Years and over | 58 (100.0%) | 0 (0.0%) |
| Total | 448 (75.0%) | 171 (28.6%) |
Disability Status by Sex by Age in Supreme
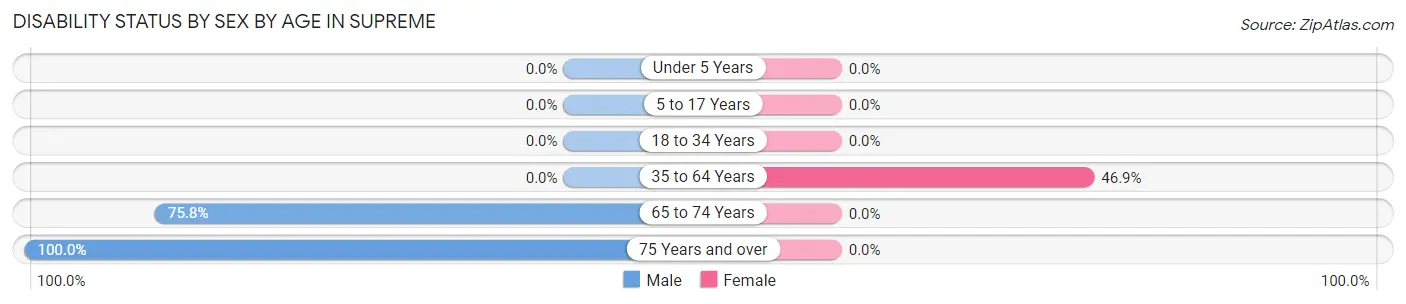
| Age Bracket | Male | Female |
| Under 5 Years | 0 (0.0%) | 0 (0.0%) |
| 5 to 17 Years | 0 (0.0%) | 0 (0.0%) |
| 18 to 34 Years | 0 (0.0%) | 0 (0.0%) |
| 35 to 64 Years | 0 (0.0%) | 30 (46.9%) |
| 65 to 74 Years | 97 (75.8%) | 0 (0.0%) |
| 75 Years and over | 58 (100.0%) | 0 (0.0%) |
Disability Class by Sex by Age in Supreme
Disability Class: Hearing Difficulty
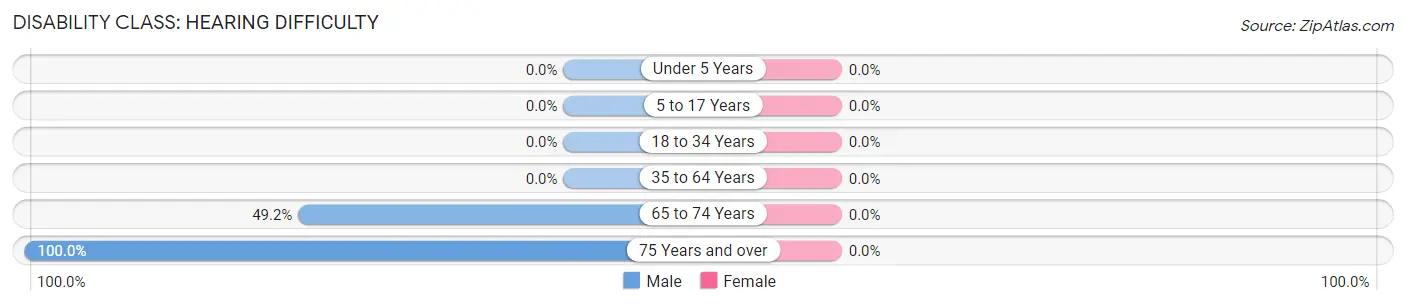
| Age Bracket | Male | Female |
| Under 5 Years | 0 (0.0%) | 0 (0.0%) |
| 5 to 17 Years | 0 (0.0%) | 0 (0.0%) |
| 18 to 34 Years | 0 (0.0%) | 0 (0.0%) |
| 35 to 64 Years | 0 (0.0%) | 0 (0.0%) |
| 65 to 74 Years | 63 (49.2%) | 0 (0.0%) |
| 75 Years and over | 58 (100.0%) | 0 (0.0%) |
Disability Class: Vision Difficulty
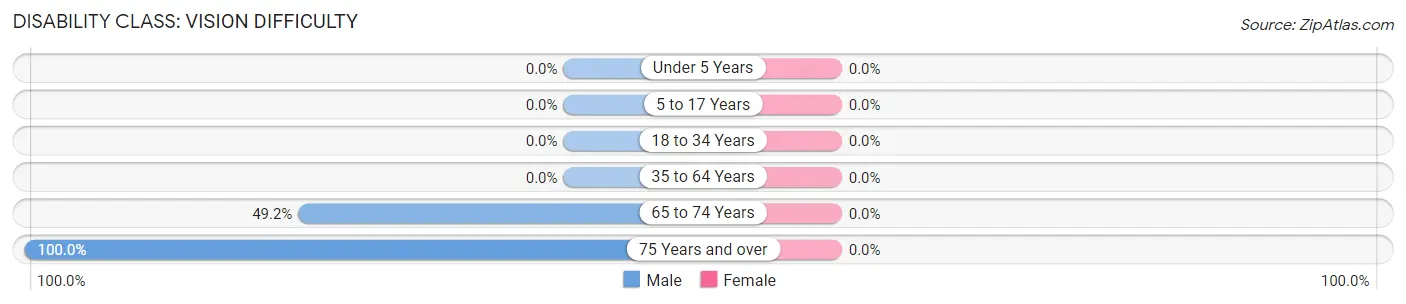
| Age Bracket | Male | Female |
| Under 5 Years | 0 (0.0%) | 0 (0.0%) |
| 5 to 17 Years | 0 (0.0%) | 0 (0.0%) |
| 18 to 34 Years | 0 (0.0%) | 0 (0.0%) |
| 35 to 64 Years | 0 (0.0%) | 0 (0.0%) |
| 65 to 74 Years | 63 (49.2%) | 0 (0.0%) |
| 75 Years and over | 58 (100.0%) | 0 (0.0%) |
Disability Class: Cognitive Difficulty
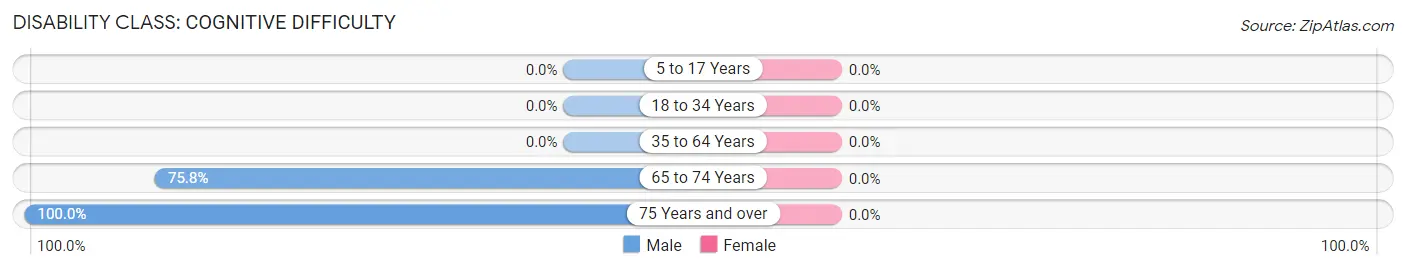
| Age Bracket | Male | Female |
| 5 to 17 Years | 0 (0.0%) | 0 (0.0%) |
| 18 to 34 Years | 0 (0.0%) | 0 (0.0%) |
| 35 to 64 Years | 0 (0.0%) | 0 (0.0%) |
| 65 to 74 Years | 97 (75.8%) | 0 (0.0%) |
| 75 Years and over | 58 (100.0%) | 0 (0.0%) |
Disability Class: Ambulatory Difficulty
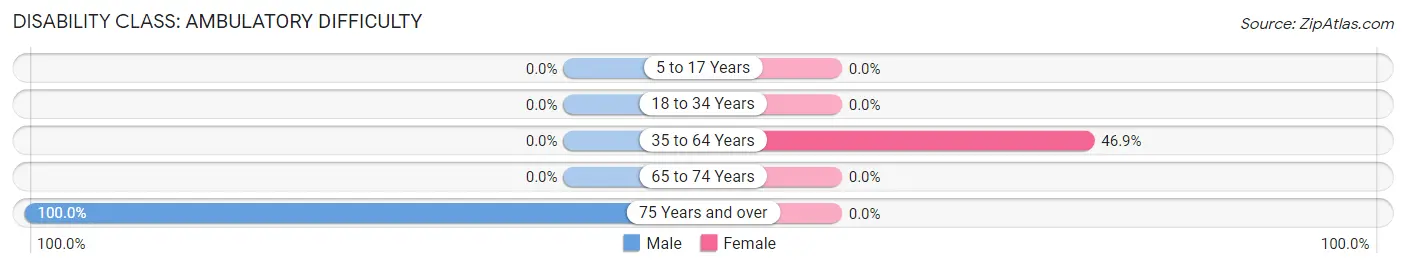
| Age Bracket | Male | Female |
| 5 to 17 Years | 0 (0.0%) | 0 (0.0%) |
| 18 to 34 Years | 0 (0.0%) | 0 (0.0%) |
| 35 to 64 Years | 0 (0.0%) | 30 (46.9%) |
| 65 to 74 Years | 0 (0.0%) | 0 (0.0%) |
| 75 Years and over | 58 (100.0%) | 0 (0.0%) |
Disability Class: Self-Care Difficulty
| Age Bracket | Male | Female |
| 5 to 17 Years | 0 (0.0%) | 0 (0.0%) |
| 18 to 34 Years | 0 (0.0%) | 0 (0.0%) |
| 35 to 64 Years | 0 (0.0%) | 0 (0.0%) |
| 65 to 74 Years | 0 (0.0%) | 0 (0.0%) |
| 75 Years and over | 0 (0.0%) | 0 (0.0%) |
Technology Access in Supreme
Computing Device Access in Supreme
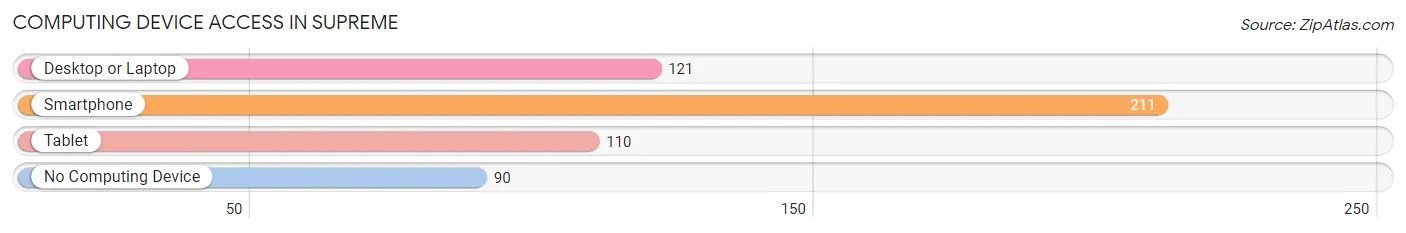
| Device Type | # Households | % Households |
| Desktop or Laptop | 121 | 40.2% |
| Smartphone | 211 | 70.1% |
| Tablet | 110 | 36.5% |
| No Computing Device | 90 | 29.9% |
| Total | 301 | 100.0% |
Internet Access in Supreme
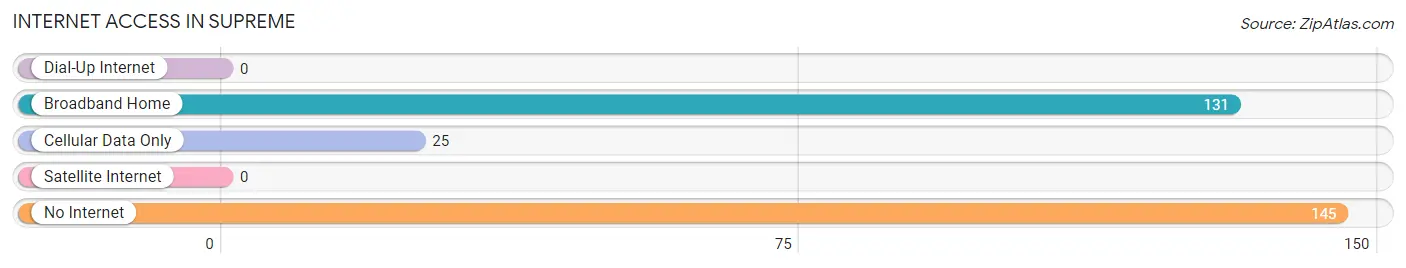
| Internet Type | # Households | % Households |
| Dial-Up Internet | 0 | 0.0% |
| Broadband Home | 131 | 43.5% |
| Cellular Data Only | 25 | 8.3% |
| Satellite Internet | 0 | 0.0% |
| No Internet | 145 | 48.2% |
| Total | 301 | 100.0% |
Supreme Summary
Supreme is a small city located in Los Angeles County, California. It is situated in the San Gabriel Valley, about 20 miles east of downtown Los Angeles. The city has a population of approximately 5,000 people and covers an area of 1.7 square miles.
History
The area that is now Supreme was originally inhabited by the Tongva people, who were the original inhabitants of the Los Angeles Basin. The area was later settled by Spanish colonists in the late 18th century. The area was known as Rancho San Antonio and was part of the Rancho San Antonio land grant. In the late 19th century, the area was subdivided and sold off to settlers. The area was then incorporated as the City of Supreme in 1913.
Geography
Supreme is located in the San Gabriel Valley, about 20 miles east of downtown Los Angeles. The city is situated at the base of the San Gabriel Mountains and is surrounded by the cities of El Monte, South El Monte, and Rosemead. The city has a total area of 1.7 square miles, all of which is land. The city is located at an elevation of approximately 500 feet above sea level.
Economy
The economy of Supreme is largely based on the service industry. The city is home to a variety of restaurants, retail stores, and other businesses. The city is also home to a number of manufacturing and industrial businesses. The city is also home to a number of government offices, including the Los Angeles County Sheriff's Department and the Los Angeles County Fire Department.
Demographics
As of the 2010 census, the population of Supreme was 5,000. The racial makeup of the city was 57.2% White, 1.2% African American, 0.7% Native American, 8.2% Asian, 0.2% Pacific Islander, 28.2% from other races, and 4.5% from two or more races. The median household income in Supreme was $45,000, and the median family income was $50,000. The per capita income in Supreme was $20,000.
Supreme is a small city with a diverse population and a vibrant economy. The city is home to a variety of businesses and government offices, and is a great place to live and work.
Common Questions
What is Per Capita Income in Supreme?
Per Capita income in Supreme is $17,058.
What is Inequality or Gini Index in Supreme?
Inequality or Gini Index in Supreme is 0.58.
What is the Total Population of Supreme?
Total Population of Supreme is 597.
What is the Total Male Population of Supreme?
Total Male Population of Supreme is 347.
What is the Total Female Population of Supreme?
Total Female Population of Supreme is 250.
What is the Ratio of Males per 100 Females in Supreme?
There are 138.80 Males per 100 Females in Supreme.
What is the Ratio of Females per 100 Males in Supreme?
There are 72.05 Females per 100 Males in Supreme.
What is the Median Population Age in Supreme?
Median Population Age in Supreme is 63.8 Years.
What is the Average Family Size in Supreme
Average Family Size in Supreme is 3.6 People.
What is the Average Household Size in Supreme
Average Household Size in Supreme is 2.0 People.
How Large is the Labor Force in Supreme?
There are 236 People in the Labor Forcein in Supreme.
What is the Percentage of People in the Labor Force in Supreme?
42.9% of People are in the Labor Force in Supreme.
What is the Unemployment Rate in Supreme?
Unemployment Rate in Supreme is 2.1%.