Crowley, LA Map & Demographics
Crowley Map
Crowley Overview
$22,340
PER CAPITA INCOME
$35,150
AVG FAMILY INCOME
$28,827
AVG HOUSEHOLD INCOME
48.4%
WAGE / INCOME GAP [ % ]
51.6¢/ $1
WAGE / INCOME GAP [ $ ]
$15,140
FAMILY INCOME DEFICIT
0.58
INEQUALITY / GINI INDEX
11,726
TOTAL POPULATION
5,972
MALE POPULATION
5,754
FEMALE POPULATION
103.79
MALES / 100 FEMALES
96.35
FEMALES / 100 MALES
40.3
MEDIAN AGE
3.1
AVG FAMILY SIZE
2.4
AVG HOUSEHOLD SIZE
3,902
LABOR FORCE [ PEOPLE ]
43.7%
PERCENT IN LABOR FORCE
14.8%
UNEMPLOYMENT RATE
Crowley Zip Codes
Crowley Area Codes
Income in Crowley
Income Overview in Crowley
Per Capita Income in Crowley is $22,340, while median incomes of families and households are $35,150 and $28,827 respectively.
| Characteristic | Number | Measure |
| Per Capita Income | 11,726 | $22,340 |
| Median Family Income | 2,865 | $35,150 |
| Mean Family Income | 2,865 | $65,234 |
| Median Household Income | 4,863 | $28,827 |
| Mean Household Income | 4,863 | $50,741 |
| Income Deficit | 2,865 | $15,140 |
| Wage / Income Gap (%) | 11,726 | 48.39% |
| Wage / Income Gap ($) | 11,726 | 51.61¢ per $1 |
| Gini / Inequality Index | 11,726 | 0.58 |
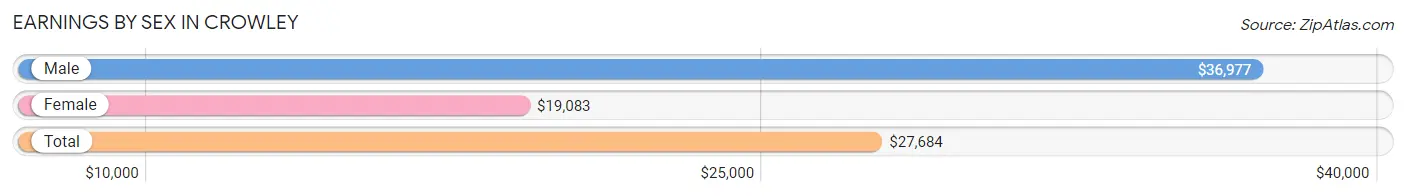
Earnings by Sex in Crowley
Average Earnings in Crowley are $27,684, $36,977 for men and $19,083 for women, a difference of 48.4%.
| Sex | Number | Average Earnings |
| Male | 1,941 (49.2%) | $36,977 |
| Female | 2,005 (50.8%) | $19,083 |
| Total | 3,946 (100.0%) | $27,684 |
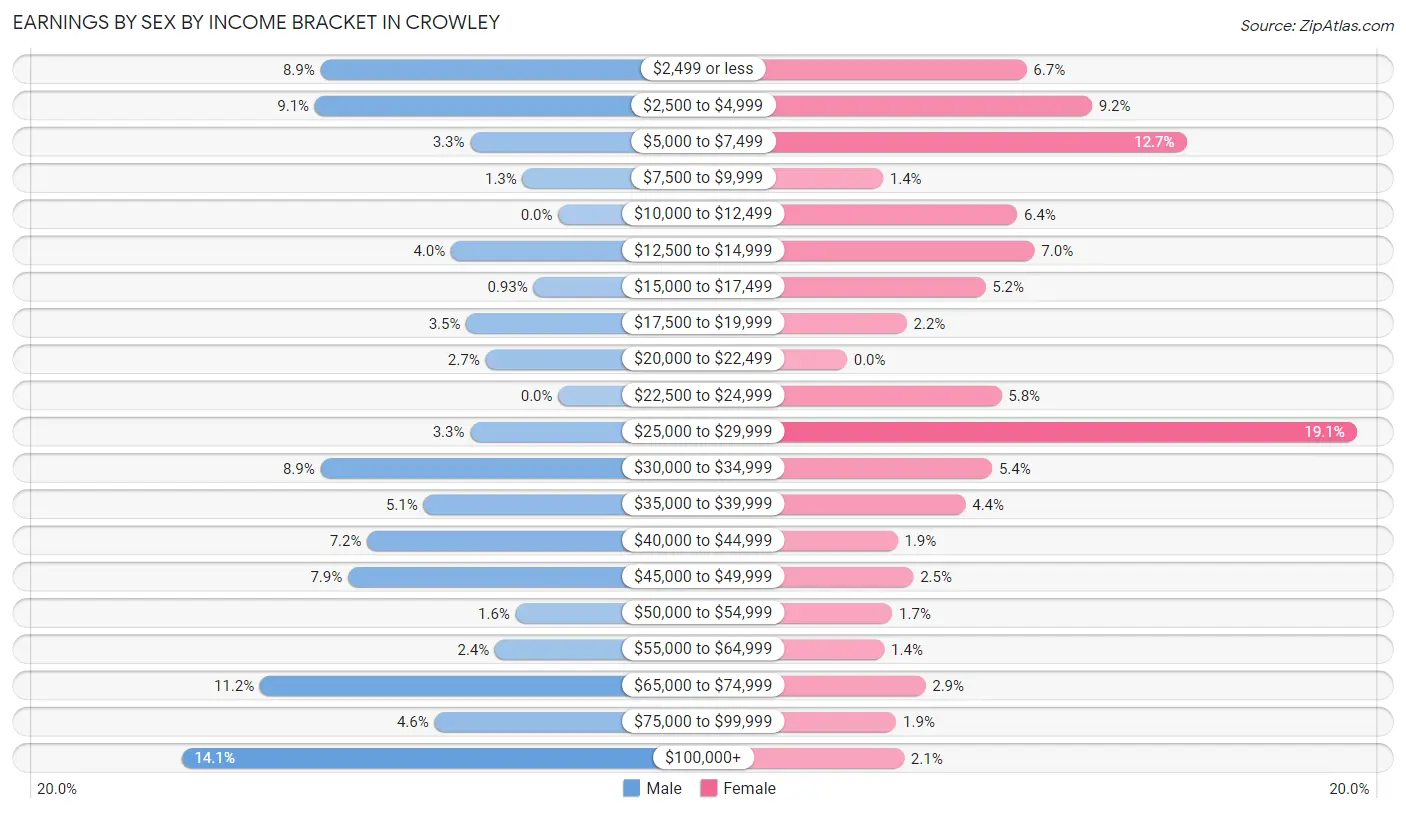
Earnings by Sex by Income Bracket in Crowley
The most common earnings brackets in Crowley are $100,000+ for men (274 | 14.1%) and $25,000 to $29,999 for women (383 | 19.1%).
| Income | Male | Female |
| $2,499 or less | 173 (8.9%) | 135 (6.7%) |
| $2,500 to $4,999 | 177 (9.1%) | 184 (9.2%) |
| $5,000 to $7,499 | 64 (3.3%) | 255 (12.7%) |
| $7,500 to $9,999 | 26 (1.3%) | 27 (1.3%) |
| $10,000 to $12,499 | 0 (0.0%) | 128 (6.4%) |
| $12,500 to $14,999 | 78 (4.0%) | 141 (7.0%) |
| $15,000 to $17,499 | 18 (0.9%) | 104 (5.2%) |
| $17,500 to $19,999 | 67 (3.5%) | 45 (2.2%) |
| $20,000 to $22,499 | 53 (2.7%) | 0 (0.0%) |
| $22,500 to $24,999 | 0 (0.0%) | 116 (5.8%) |
| $25,000 to $29,999 | 64 (3.3%) | 383 (19.1%) |
| $30,000 to $34,999 | 173 (8.9%) | 109 (5.4%) |
| $35,000 to $39,999 | 98 (5.1%) | 89 (4.4%) |
| $40,000 to $44,999 | 139 (7.2%) | 38 (1.9%) |
| $45,000 to $49,999 | 153 (7.9%) | 50 (2.5%) |
| $50,000 to $54,999 | 31 (1.6%) | 34 (1.7%) |
| $55,000 to $64,999 | 46 (2.4%) | 28 (1.4%) |
| $65,000 to $74,999 | 217 (11.2%) | 59 (2.9%) |
| $75,000 to $99,999 | 90 (4.6%) | 37 (1.8%) |
| $100,000+ | 274 (14.1%) | 43 (2.1%) |
| Total | 1,941 (100.0%) | 2,005 (100.0%) |
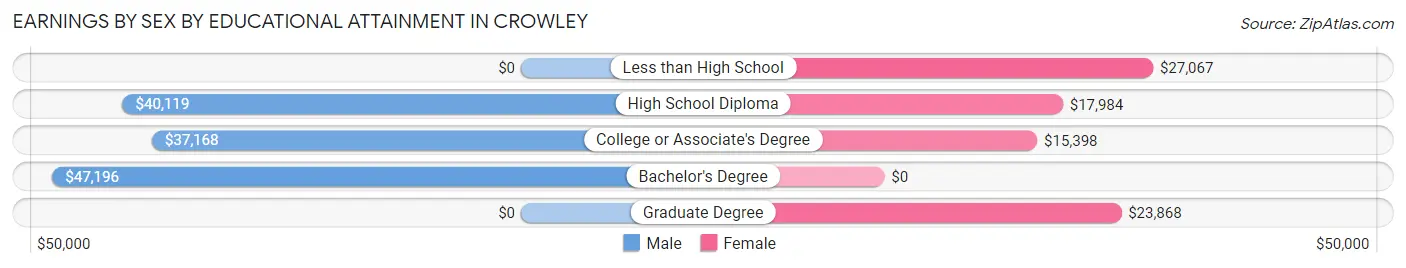
Earnings by Sex by Educational Attainment in Crowley
Average earnings in Crowley are $41,875 for men and $25,498 for women, a difference of 39.1%. Men with an educational attainment of bachelor's degree enjoy the highest average annual earnings of $47,196, while those with college or associate's degree education earn the least with $37,168. Women with an educational attainment of less than high school earn the most with the average annual earnings of $27,067, while those with college or associate's degree education have the smallest earnings of $15,398.
| Educational Attainment | Male Income | Female Income |
| Less than High School | - | - |
| High School Diploma | $40,119 | $17,984 |
| College or Associate's Degree | $37,168 | $15,398 |
| Bachelor's Degree | $47,196 | $0 |
| Graduate Degree | - | - |
| Total | $41,875 | $25,498 |
Family Income in Crowley
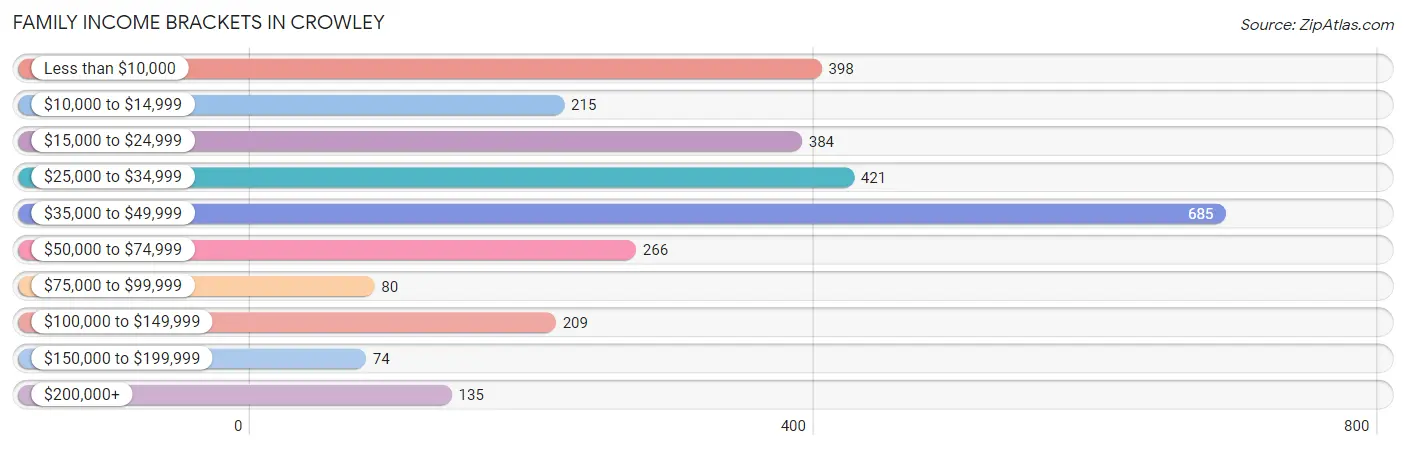
Family Income Brackets in Crowley
According to the Crowley family income data, there are 685 families falling into the $35,000 to $49,999 income range, which is the most common income bracket and makes up 23.9% of all families. Conversely, the $150,000 to $199,999 income bracket is the least frequent group with only 74 families (2.6%) belonging to this category.
| Income Bracket | # Families | % Families |
| Less than $10,000 | 398 | 13.9% |
| $10,000 to $14,999 | 215 | 7.5% |
| $15,000 to $24,999 | 384 | 13.4% |
| $25,000 to $34,999 | 421 | 14.7% |
| $35,000 to $49,999 | 685 | 23.9% |
| $50,000 to $74,999 | 266 | 9.3% |
| $75,000 to $99,999 | 80 | 2.8% |
| $100,000 to $149,999 | 209 | 7.3% |
| $150,000 to $199,999 | 74 | 2.6% |
| $200,000+ | 135 | 4.7% |
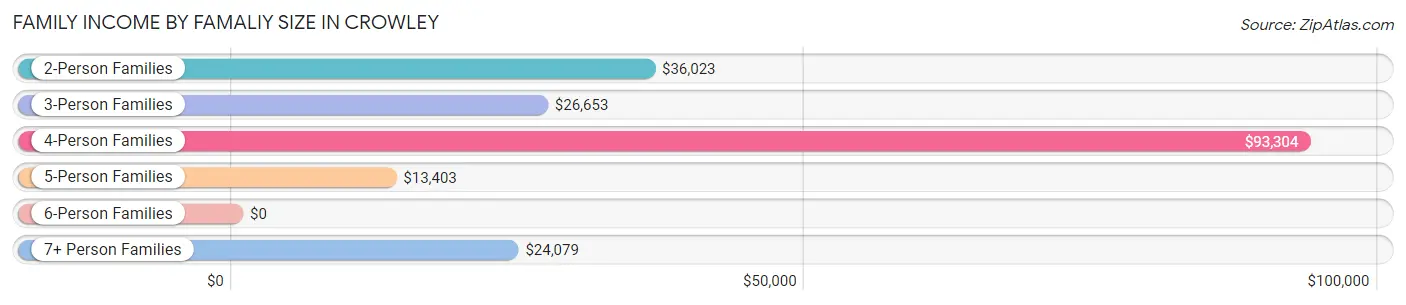
Family Income by Famaliy Size in Crowley
4-person families (286 | 10.0%) account for the highest median family income in Crowley with $93,304 per family, while 4-person families (286 | 10.0%) have the highest median income of $23,326 per family member.
| Income Bracket | # Families | Median Income |
| 2-Person Families | 1,530 (53.4%) | $36,023 |
| 3-Person Families | 751 (26.2%) | $26,653 |
| 4-Person Families | 286 (10.0%) | $93,304 |
| 5-Person Families | 120 (4.2%) | $13,403 |
| 6-Person Families | 8 (0.3%) | $0 |
| 7+ Person Families | 170 (5.9%) | $24,079 |
| Total | 2,865 (100.0%) | $35,150 |
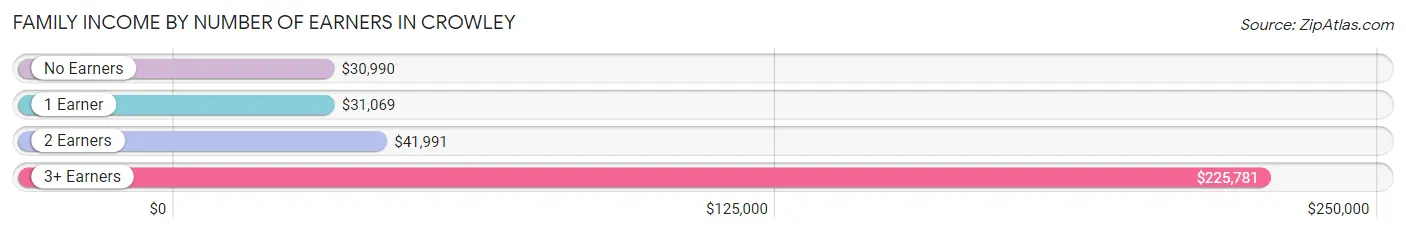
Family Income by Number of Earners in Crowley
The median family income in Crowley is $35,150, with families comprising 3+ earners (136) having the highest median family income of $225,781, while families with no earners (1,003) have the lowest median family income of $30,990, accounting for 4.8% and 35.0% of families, respectively.
| Number of Earners | # Families | Median Income |
| No Earners | 1,003 (35.0%) | $30,990 |
| 1 Earner | 1,013 (35.4%) | $31,069 |
| 2 Earners | 713 (24.9%) | $41,991 |
| 3+ Earners | 136 (4.8%) | $225,781 |
| Total | 2,865 (100.0%) | $35,150 |
Household Income in Crowley
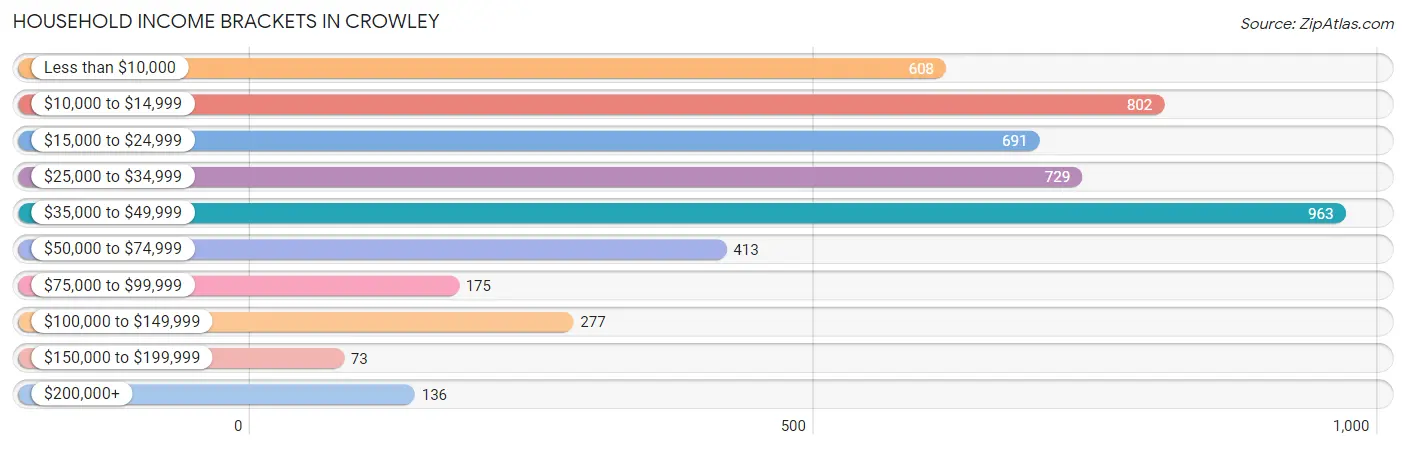
Household Income Brackets in Crowley
With 963 households falling in the category, the $35,000 to $49,999 income range is the most frequent in Crowley, accounting for 19.8% of all households. In contrast, only 73 households (1.5%) fall into the $150,000 to $199,999 income bracket, making it the least populous group.
| Income Bracket | # Households | % Households |
| Less than $10,000 | 608 | 12.5% |
| $10,000 to $14,999 | 802 | 16.5% |
| $15,000 to $24,999 | 691 | 14.2% |
| $25,000 to $34,999 | 729 | 15.0% |
| $35,000 to $49,999 | 963 | 19.8% |
| $50,000 to $74,999 | 413 | 8.5% |
| $75,000 to $99,999 | 175 | 3.6% |
| $100,000 to $149,999 | 277 | 5.7% |
| $150,000 to $199,999 | 73 | 1.5% |
| $200,000+ | 136 | 2.8% |
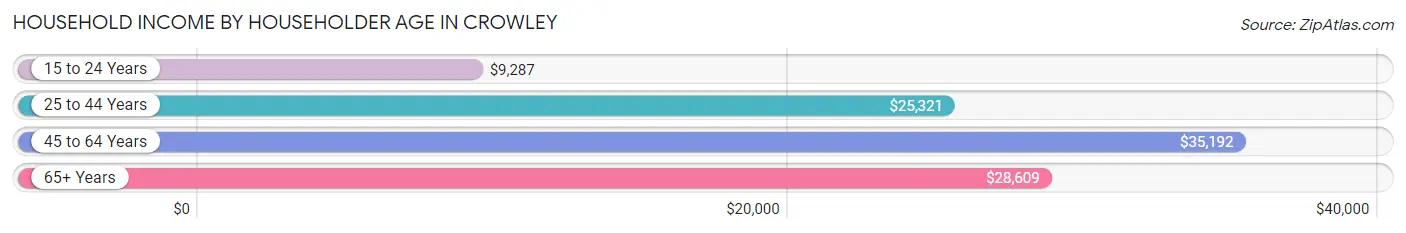
Household Income by Householder Age in Crowley
The median household income in Crowley is $28,827, with the highest median household income of $35,192 found in the 45 to 64 years age bracket for the primary householder. A total of 1,875 households (38.6%) fall into this category. Meanwhile, the 15 to 24 years age bracket for the primary householder has the lowest median household income of $9,287, with 209 households (4.3%) in this group.
| Income Bracket | # Households | Median Income |
| 15 to 24 Years | 209 (4.3%) | $9,287 |
| 25 to 44 Years | 1,200 (24.7%) | $25,321 |
| 45 to 64 Years | 1,875 (38.6%) | $35,192 |
| 65+ Years | 1,579 (32.5%) | $28,609 |
| Total | 4,863 (100.0%) | $28,827 |
Poverty in Crowley
Income Below Poverty by Sex and Age in Crowley
With 38.8% poverty level for males and 44.4% for females among the residents of Crowley, 5 year old males and 15 year old females are the most vulnerable to poverty, with 86 males (100.0%) and 29 females (100.0%) in their respective age groups living below the poverty level.
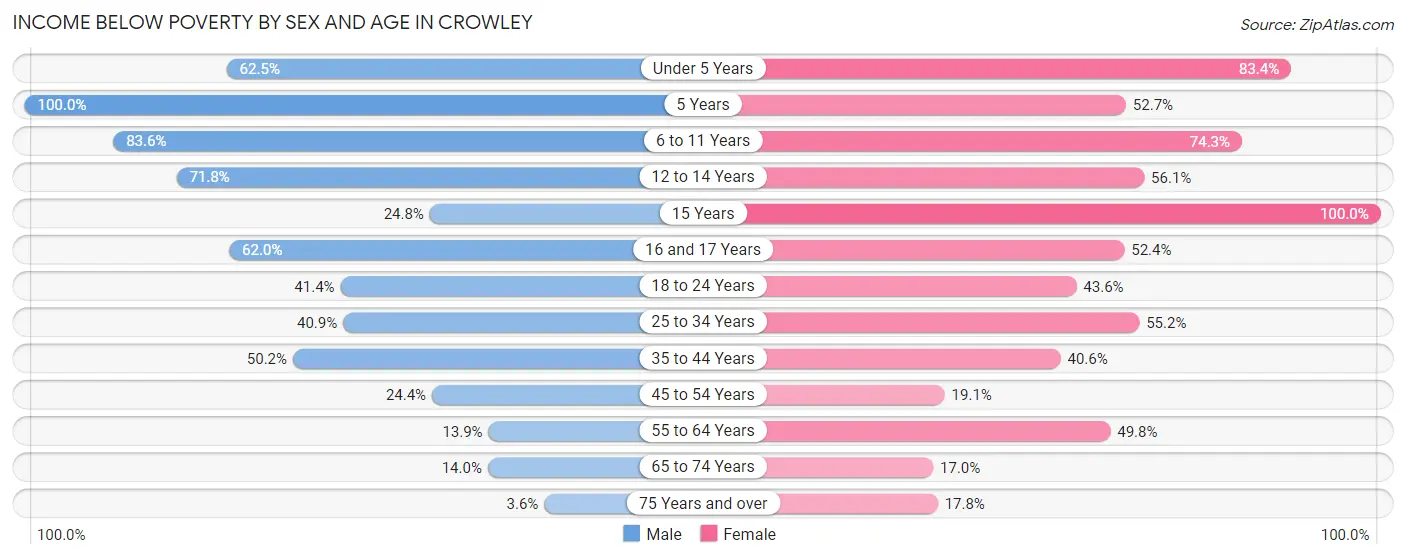
| Age Bracket | Male | Female |
| Under 5 Years | 360 (62.5%) | 331 (83.4%) |
| 5 Years | 86 (100.0%) | 29 (52.7%) |
| 6 to 11 Years | 391 (83.6%) | 418 (74.3%) |
| 12 to 14 Years | 163 (71.8%) | 110 (56.1%) |
| 15 Years | 33 (24.8%) | 29 (100.0%) |
| 16 and 17 Years | 165 (62.0%) | 43 (52.4%) |
| 18 to 24 Years | 168 (41.4%) | 206 (43.5%) |
| 25 to 34 Years | 249 (40.9%) | 334 (55.2%) |
| 35 to 44 Years | 235 (50.2%) | 238 (40.6%) |
| 45 to 54 Years | 190 (24.4%) | 105 (19.1%) |
| 55 to 64 Years | 114 (13.9%) | 449 (49.8%) |
| 65 to 74 Years | 63 (14.0%) | 120 (17.0%) |
| 75 Years and over | 17 (3.6%) | 84 (17.8%) |
| Total | 2,234 (38.8%) | 2,496 (44.4%) |
Income Above Poverty by Sex and Age in Crowley
According to the poverty statistics in Crowley, males aged 75 years and over and females aged 65 to 74 years are the age groups that are most secure financially, with 96.4% of males and 83.1% of females in these age groups living above the poverty line.
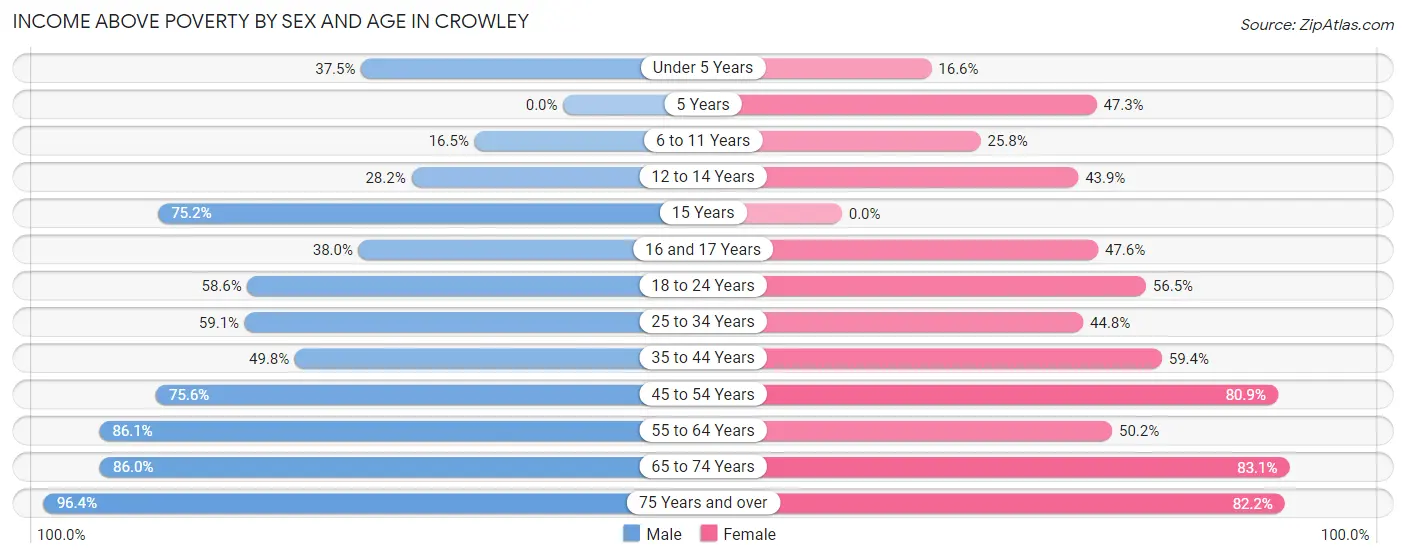
| Age Bracket | Male | Female |
| Under 5 Years | 216 (37.5%) | 66 (16.6%) |
| 5 Years | 0 (0.0%) | 26 (47.3%) |
| 6 to 11 Years | 77 (16.5%) | 145 (25.8%) |
| 12 to 14 Years | 64 (28.2%) | 86 (43.9%) |
| 15 Years | 100 (75.2%) | 0 (0.0%) |
| 16 and 17 Years | 101 (38.0%) | 39 (47.6%) |
| 18 to 24 Years | 238 (58.6%) | 267 (56.5%) |
| 25 to 34 Years | 360 (59.1%) | 271 (44.8%) |
| 35 to 44 Years | 233 (49.8%) | 348 (59.4%) |
| 45 to 54 Years | 589 (75.6%) | 445 (80.9%) |
| 55 to 64 Years | 706 (86.1%) | 452 (50.2%) |
| 65 to 74 Years | 386 (86.0%) | 588 (83.1%) |
| 75 Years and over | 461 (96.4%) | 388 (82.2%) |
| Total | 3,531 (61.3%) | 3,121 (55.6%) |
Income Below Poverty Among Married-Couple Families in Crowley
The poverty statistics for married-couple families in Crowley show that 18.3% or 318 of the total 1,733 families live below the poverty line. Families with 5 or more children have the highest poverty rate of 100.0%, comprising of 145 families. On the other hand, families with 3 or 4 children have the lowest poverty rate of 0.0%, which includes 0 families.
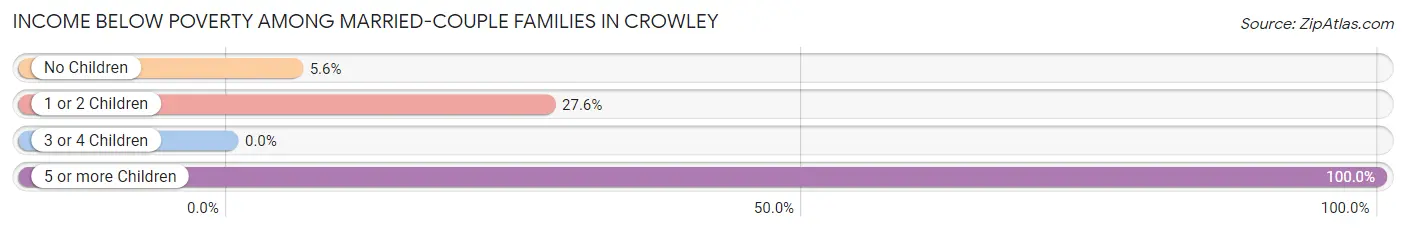
| Children | Above Poverty | Below Poverty |
| No Children | 1,124 (94.4%) | 67 (5.6%) |
| 1 or 2 Children | 278 (72.4%) | 106 (27.6%) |
| 3 or 4 Children | 13 (100.0%) | 0 (0.0%) |
| 5 or more Children | 0 (0.0%) | 145 (100.0%) |
| Total | 1,415 (81.7%) | 318 (18.3%) |
Income Below Poverty Among Single-Parent Households in Crowley
According to the poverty data in Crowley, 21.7% or 59 single-father households and 59.4% or 511 single-mother households are living below the poverty line. Among single-father households, those with no children have the highest poverty rate, with 33 households (38.8%) experiencing poverty. Likewise, among single-mother households, those with 3 or 4 children have the highest poverty rate, with 156 households (100.0%) falling below the poverty line.
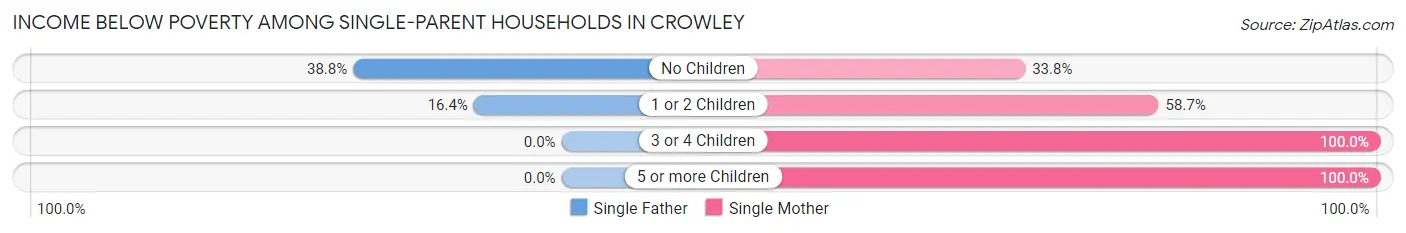
| Children | Single Father | Single Mother |
| No Children | 33 (38.8%) | 93 (33.8%) |
| 1 or 2 Children | 26 (16.4%) | 237 (58.7%) |
| 3 or 4 Children | 0 (0.0%) | 156 (100.0%) |
| 5 or more Children | 0 (0.0%) | 25 (100.0%) |
| Total | 59 (21.7%) | 511 (59.4%) |
Income Below Poverty Among Married-Couple vs Single-Parent Households in Crowley
The poverty data for Crowley shows that 318 of the married-couple family households (18.3%) and 570 of the single-parent households (50.3%) are living below the poverty level. Within the married-couple family households, those with 5 or more children have the highest poverty rate, with 145 households (100.0%) falling below the poverty line. Among the single-parent households, those with 5 or more children have the highest poverty rate, with 25 household (100.0%) living below poverty.
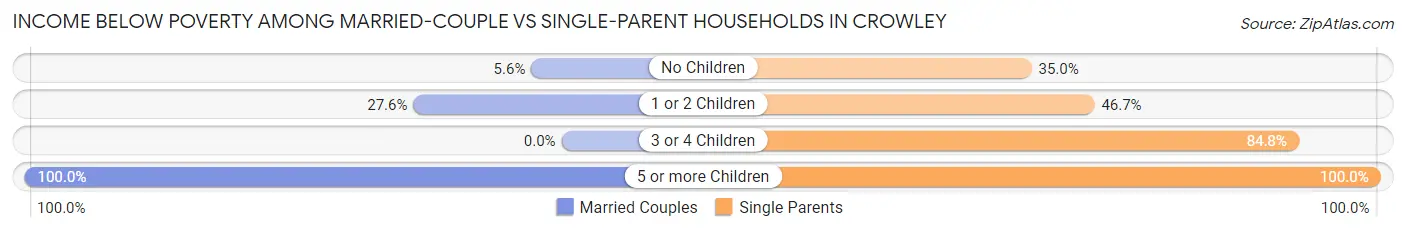
| Children | Married-Couple Families | Single-Parent Households |
| No Children | 67 (5.6%) | 126 (35.0%) |
| 1 or 2 Children | 106 (27.6%) | 263 (46.7%) |
| 3 or 4 Children | 0 (0.0%) | 156 (84.8%) |
| 5 or more Children | 145 (100.0%) | 25 (100.0%) |
| Total | 318 (18.3%) | 570 (50.3%) |
Race in Crowley
The most populous races in Crowley are White / Caucasian (7,680 | 65.5%), Black / African American (3,212 | 27.4%), and Two or more Races (808 | 6.9%).
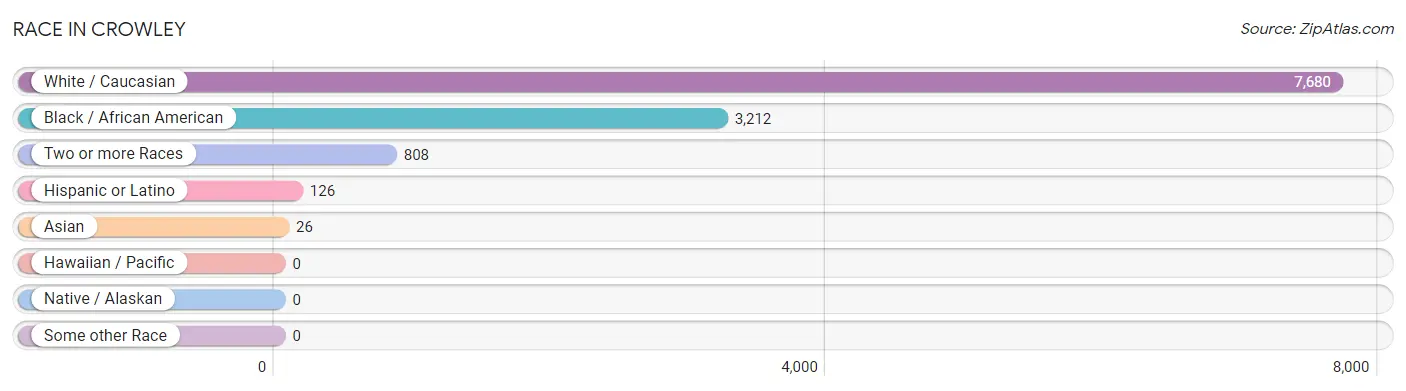
| Race | # Population | % Population |
| Asian | 26 | 0.2% |
| Black / African American | 3,212 | 27.4% |
| Hawaiian / Pacific | 0 | 0.0% |
| Hispanic or Latino | 126 | 1.1% |
| Native / Alaskan | 0 | 0.0% |
| White / Caucasian | 7,680 | 65.5% |
| Two or more Races | 808 | 6.9% |
| Some other Race | 0 | 0.0% |
| Total | 11,726 | 100.0% |
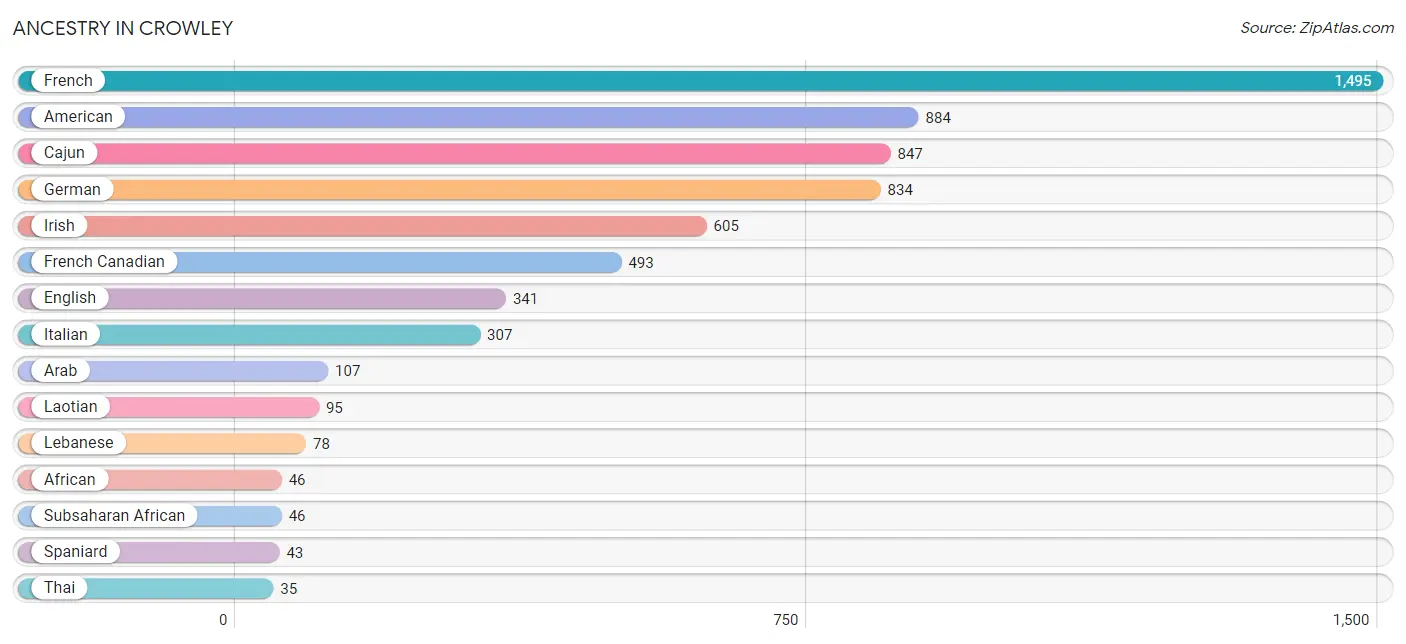
Ancestry in Crowley
The most populous ancestries reported in Crowley are French (1,495 | 12.8%), American (884 | 7.5%), Cajun (847 | 7.2%), German (834 | 7.1%), and Irish (605 | 5.2%), together accounting for 39.8% of all Crowley residents.
| Ancestry | # Population | % Population |
| African | 46 | 0.4% |
| Alsatian | 9 | 0.1% |
| American | 884 | 7.5% |
| Arab | 107 | 0.9% |
| Bhutanese | 12 | 0.1% |
| Cajun | 847 | 7.2% |
| Canadian | 11 | 0.1% |
| Central American | 29 | 0.3% |
| Choctaw | 26 | 0.2% |
| English | 341 | 2.9% |
| French | 1,495 | 12.8% |
| French Canadian | 493 | 4.2% |
| German | 834 | 7.1% |
| Greek | 8 | 0.1% |
| Indian (Asian) | 9 | 0.1% |
| Irish | 605 | 5.2% |
| Italian | 307 | 2.6% |
| Korean | 9 | 0.1% |
| Laotian | 95 | 0.8% |
| Lebanese | 78 | 0.7% |
| Mexican | 25 | 0.2% |
| Native Hawaiian | 9 | 0.1% |
| Puerto Rican | 29 | 0.3% |
| Salvadoran | 29 | 0.3% |
| Scotch-Irish | 10 | 0.1% |
| Scottish | 9 | 0.1% |
| Spaniard | 43 | 0.4% |
| Subsaharan African | 46 | 0.4% |
| Thai | 35 | 0.3% |
| Welsh | 5 | 0.0% | View All 30 Rows |
Immigrants in Crowley
The most numerous immigrant groups reported in Crowley came from Central America (34 | 0.3%), Latin America (34 | 0.3%), Panama (34 | 0.3%), Asia (26 | 0.2%), and India (26 | 0.2%), together accounting for 1.3% of all Crowley residents.
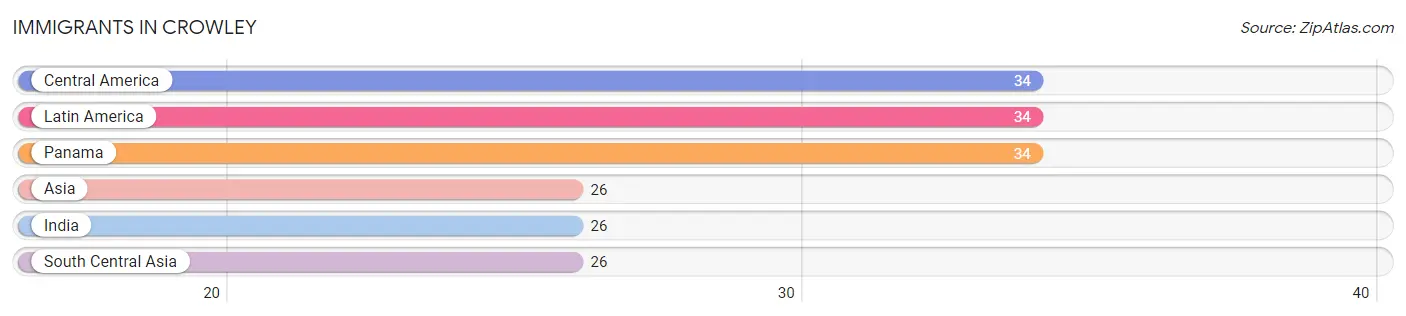
| Immigration Origin | # Population | % Population |
| Asia | 26 | 0.2% |
| Central America | 34 | 0.3% |
| India | 26 | 0.2% |
| Latin America | 34 | 0.3% |
| Panama | 34 | 0.3% |
| South Central Asia | 26 | 0.2% | View All 6 Rows |
Sex and Age in Crowley
Sex and Age in Crowley
The most populous age groups in Crowley are Under 5 Years (576 | 9.7%) for men and 60 to 64 Years (653 | 11.4%) for women.
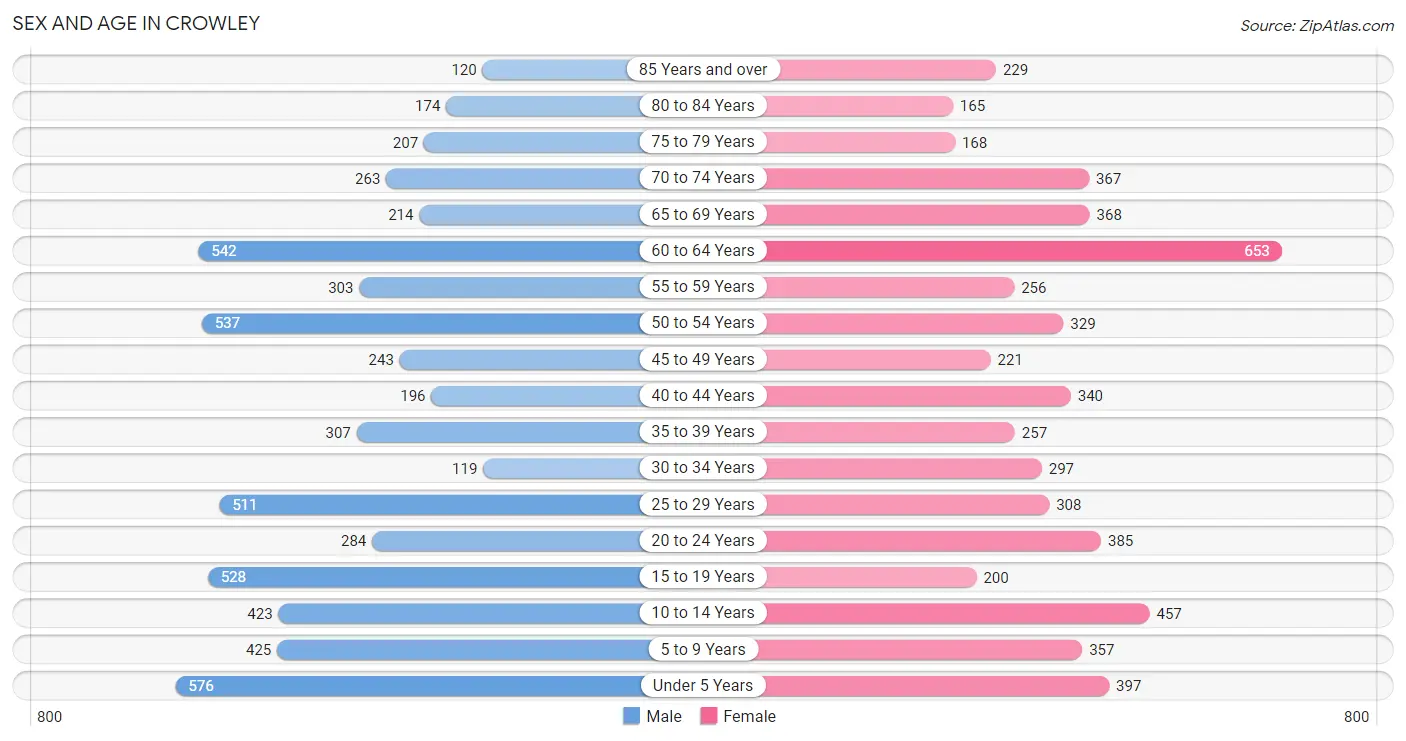
| Age Bracket | Male | Female |
| Under 5 Years | 576 (9.7%) | 397 (6.9%) |
| 5 to 9 Years | 425 (7.1%) | 357 (6.2%) |
| 10 to 14 Years | 423 (7.1%) | 457 (7.9%) |
| 15 to 19 Years | 528 (8.8%) | 200 (3.5%) |
| 20 to 24 Years | 284 (4.8%) | 385 (6.7%) |
| 25 to 29 Years | 511 (8.6%) | 308 (5.3%) |
| 30 to 34 Years | 119 (2.0%) | 297 (5.2%) |
| 35 to 39 Years | 307 (5.1%) | 257 (4.5%) |
| 40 to 44 Years | 196 (3.3%) | 340 (5.9%) |
| 45 to 49 Years | 243 (4.1%) | 221 (3.8%) |
| 50 to 54 Years | 537 (9.0%) | 329 (5.7%) |
| 55 to 59 Years | 303 (5.1%) | 256 (4.4%) |
| 60 to 64 Years | 542 (9.1%) | 653 (11.4%) |
| 65 to 69 Years | 214 (3.6%) | 368 (6.4%) |
| 70 to 74 Years | 263 (4.4%) | 367 (6.4%) |
| 75 to 79 Years | 207 (3.5%) | 168 (2.9%) |
| 80 to 84 Years | 174 (2.9%) | 165 (2.9%) |
| 85 Years and over | 120 (2.0%) | 229 (4.0%) |
| Total | 5,972 (100.0%) | 5,754 (100.0%) |
Families and Households in Crowley
Median Family Size in Crowley
The median family size in Crowley is 3.14 persons per family, with single female/mother families (860 | 30.0%) accounting for the largest median family size of 3.58 persons per family. On the other hand, single male/father families (272 | 9.5%) represent the smallest median family size with 2.87 persons per family.
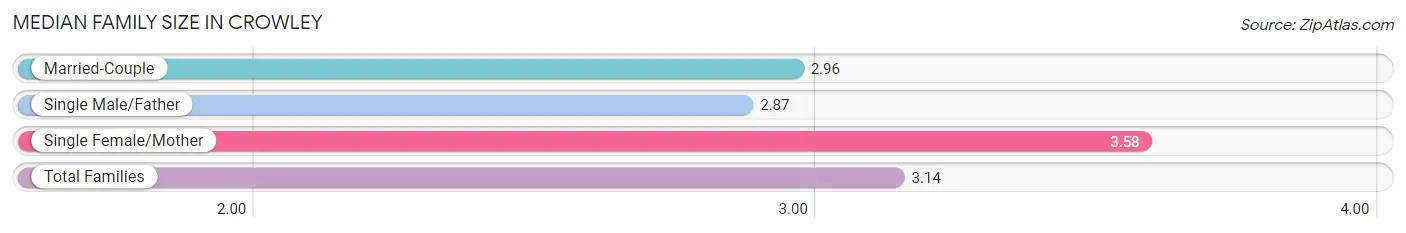
| Family Type | # Families | Family Size |
| Married-Couple | 1,733 (60.5%) | 2.96 |
| Single Male/Father | 272 (9.5%) | 2.87 |
| Single Female/Mother | 860 (30.0%) | 3.58 |
| Total Families | 2,865 (100.0%) | 3.14 |
Median Household Size in Crowley
The median household size in Crowley is 2.35 persons per household, with single female/mother households (860 | 17.7%) accounting for the largest median household size of 3.81 persons per household. non-family households (1,998 | 41.1%) represent the smallest median household size with 1.07 persons per household.
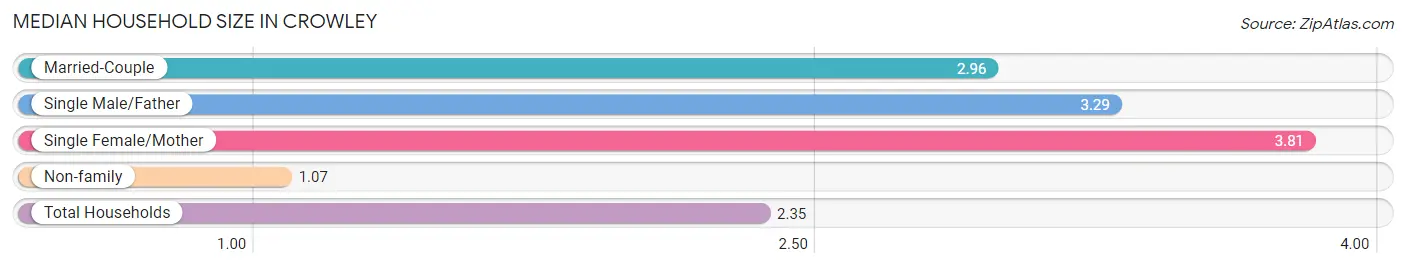
| Household Type | # Households | Household Size |
| Married-Couple | 1,733 (35.6%) | 2.96 |
| Single Male/Father | 272 (5.6%) | 3.29 |
| Single Female/Mother | 860 (17.7%) | 3.81 |
| Non-family | 1,998 (41.1%) | 1.07 |
| Total Households | 4,863 (100.0%) | 2.35 |
Household Size by Marriage Status in Crowley
Out of a total of 4,863 households in Crowley, 2,865 (58.9%) are family households, while 1,998 (41.1%) are nonfamily households. The most numerous type of family households are 2-person households, comprising 1,340, and the most common type of nonfamily households are 1-person households, comprising 1,852.
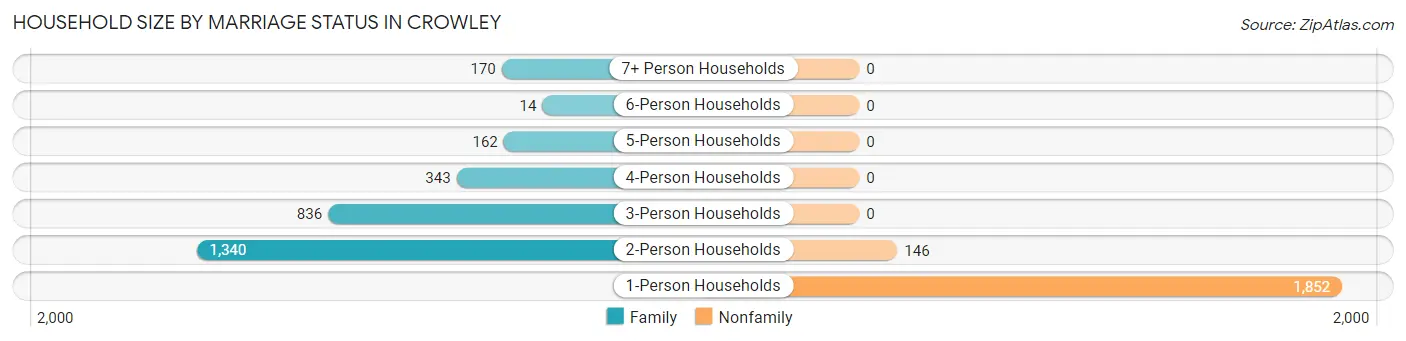
| Household Size | Family Households | Nonfamily Households |
| 1-Person Households | - | 1,852 (38.1%) |
| 2-Person Households | 1,340 (27.6%) | 146 (3.0%) |
| 3-Person Households | 836 (17.2%) | 0 (0.0%) |
| 4-Person Households | 343 (7.0%) | 0 (0.0%) |
| 5-Person Households | 162 (3.3%) | 0 (0.0%) |
| 6-Person Households | 14 (0.3%) | 0 (0.0%) |
| 7+ Person Households | 170 (3.5%) | 0 (0.0%) |
| Total | 2,865 (58.9%) | 1,998 (41.1%) |
Female Fertility in Crowley
Fertility by Age in Crowley
Average fertility rate in Crowley is 109.0 births per 1,000 women. Women in the age bracket of 20 to 34 years have the highest fertility rate with 130.0 births per 1,000 women. Women in the age bracket of 20 to 34 years acount for 58.6% of all women with births.
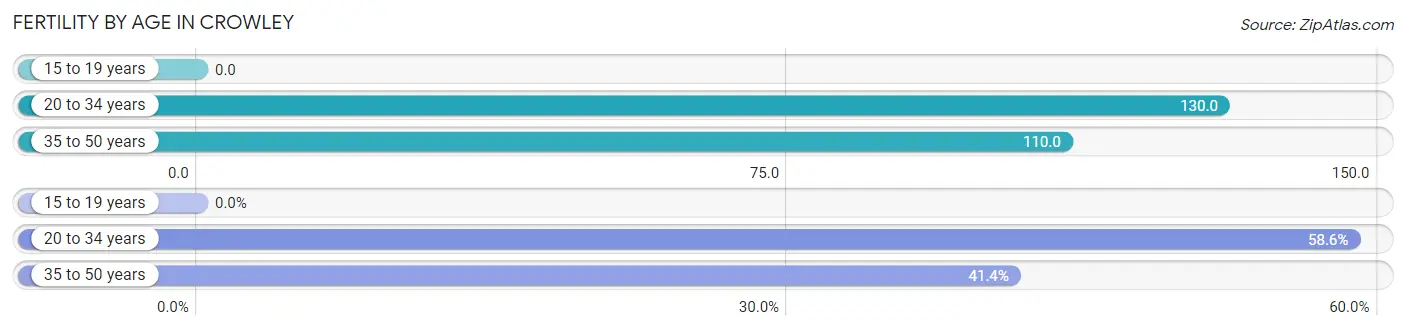
| Age Bracket | Women with Births | Births / 1,000 Women |
| 15 to 19 years | 0 (0.0%) | 0.0 |
| 20 to 34 years | 129 (58.6%) | 130.0 |
| 35 to 50 years | 91 (41.4%) | 110.0 |
| Total | 220 (100.0%) | 109.0 |
Fertility by Age by Marriage Status in Crowley
7.3% of women with births (220) in Crowley are married. The highest percentage of unmarried women with births falls into 35 to 50 years age bracket with 100.0% of them unmarried at the time of birth, while the lowest percentage of unmarried women with births belong to 20 to 34 years age bracket with 87.6% of them unmarried.
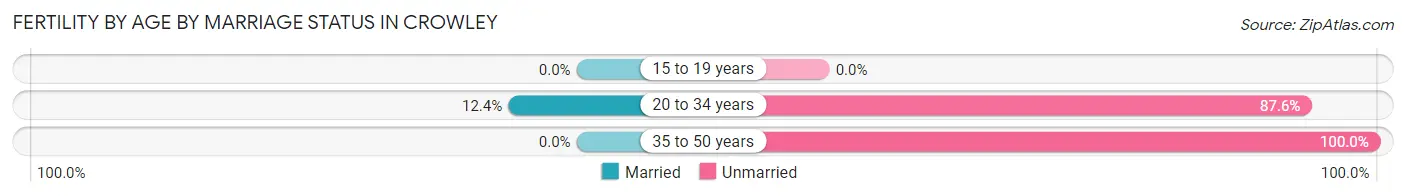
| Age Bracket | Married | Unmarried |
| 15 to 19 years | 0 (0.0%) | 0 (0.0%) |
| 20 to 34 years | 16 (12.4%) | 113 (87.6%) |
| 35 to 50 years | 0 (0.0%) | 91 (100.0%) |
| Total | 16 (7.3%) | 204 (92.7%) |
Fertility by Education in Crowley
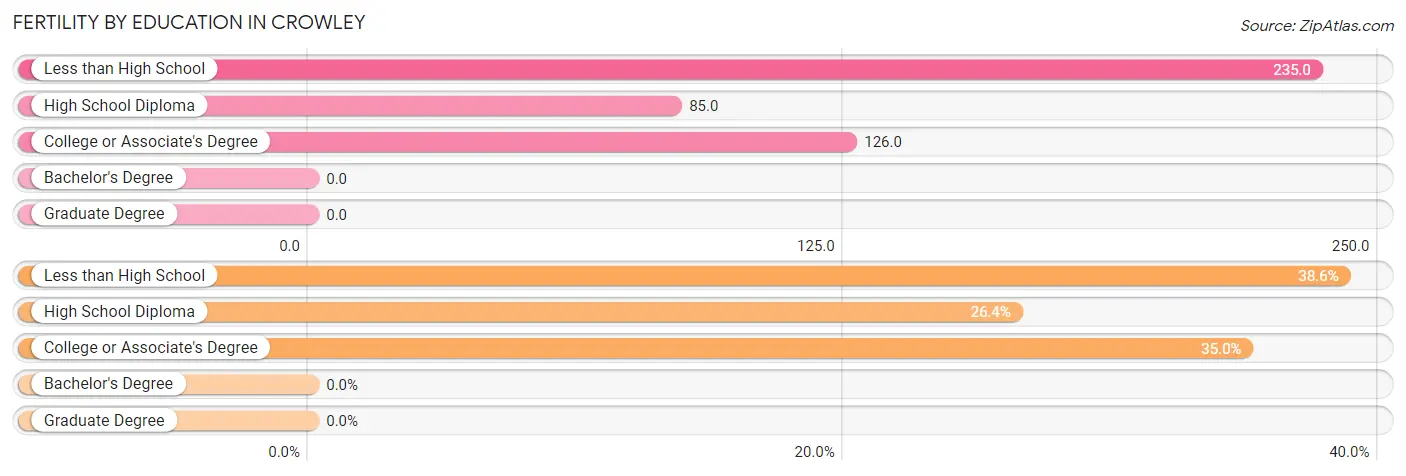
| Educational Attainment | Women with Births | Births / 1,000 Women |
| Less than High School | 85 (38.6%) | 235.0 |
| High School Diploma | 58 (26.4%) | 85.0 |
| College or Associate's Degree | 77 (35.0%) | 126.0 |
| Bachelor's Degree | 0 (0.0%) | 0.0 |
| Graduate Degree | 0 (0.0%) | 0.0 |
| Total | 220 (100.0%) | 109.0 |
Fertility by Education by Marriage Status in Crowley
92.7% of women with births in Crowley are unmarried. Women with the educational attainment of high school diploma are most likely to be married with 27.6% of them married at childbirth, while women with the educational attainment of less than high school are least likely to be married with 100.0% of them unmarried at childbirth.
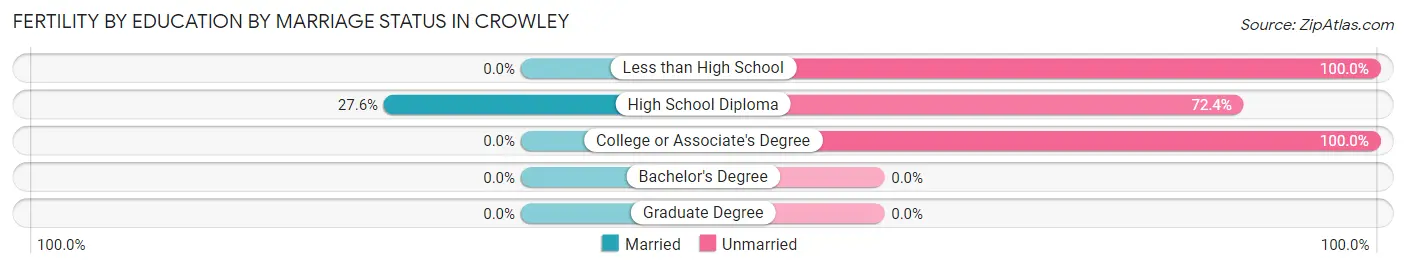
| Educational Attainment | Married | Unmarried |
| Less than High School | 0 (0.0%) | 85 (100.0%) |
| High School Diploma | 16 (27.6%) | 42 (72.4%) |
| College or Associate's Degree | 0 (0.0%) | 77 (100.0%) |
| Bachelor's Degree | 0 (0.0%) | 0 (0.0%) |
| Graduate Degree | 0 (0.0%) | 0 (0.0%) |
| Total | 16 (7.3%) | 204 (92.7%) |
Employment Characteristics in Crowley
Employment by Class of Employer in Crowley
Among the 3,308 employed individuals in Crowley, private company employees (2,428 | 73.4%), self-employed (incorporated) (285 | 8.6%), and self-employed (not incorporated) (240 | 7.3%) make up the most common classes of employment.
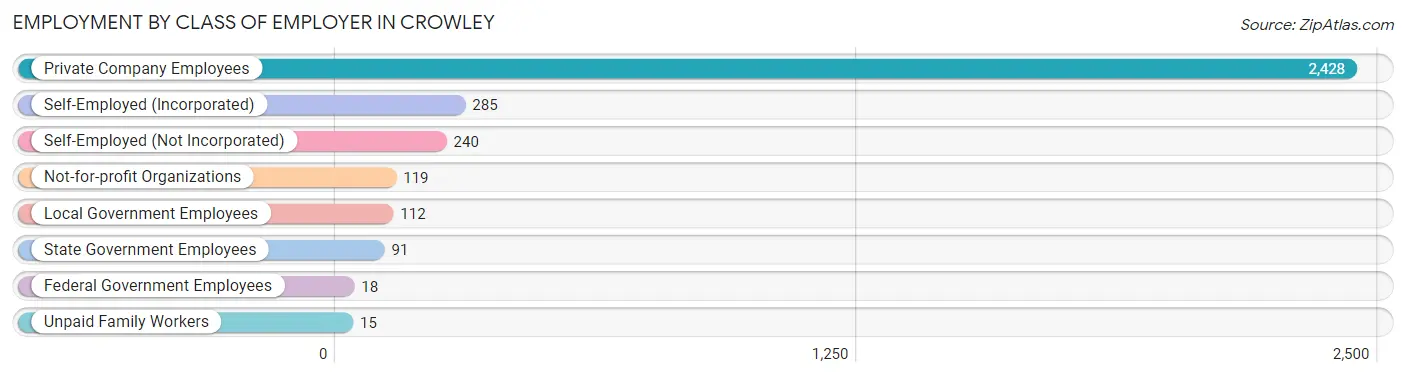
| Employer Class | # Employees | % Employees |
| Private Company Employees | 2,428 | 73.4% |
| Self-Employed (Incorporated) | 285 | 8.6% |
| Self-Employed (Not Incorporated) | 240 | 7.3% |
| Not-for-profit Organizations | 119 | 3.6% |
| Local Government Employees | 112 | 3.4% |
| State Government Employees | 91 | 2.8% |
| Federal Government Employees | 18 | 0.5% |
| Unpaid Family Workers | 15 | 0.4% |
| Total | 3,308 | 100.0% |
Employment Status by Age in Crowley
According to the labor force statistics for Crowley, out of the total population over 16 years of age (8,929), 43.7% or 3,902 individuals are in the labor force, with 14.8% or 577 of them unemployed. The age group with the highest labor force participation rate is 25 to 29 years, with 88.9% or 728 individuals in the labor force. Within the labor force, the 16 to 19 years age range has the highest percentage of unemployed individuals, with 40.1% or 55 of them being unemployed.
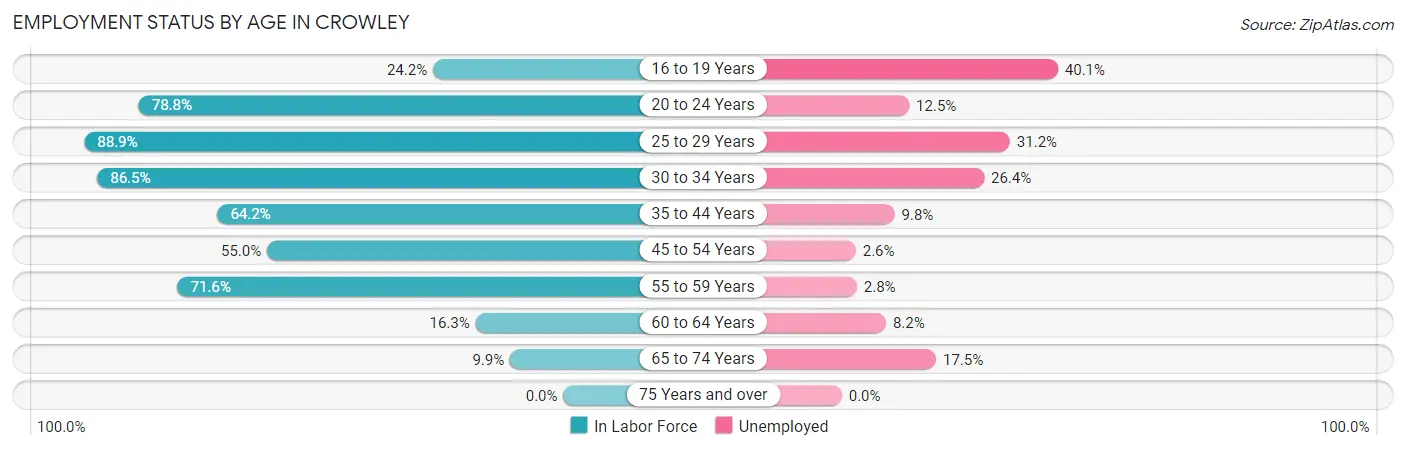
| Age Bracket | In Labor Force | Unemployed |
| 16 to 19 Years | 137 (24.2%) | 55 (40.1%) |
| 20 to 24 Years | 527 (78.8%) | 66 (12.5%) |
| 25 to 29 Years | 728 (88.9%) | 227 (31.2%) |
| 30 to 34 Years | 360 (86.5%) | 95 (26.4%) |
| 35 to 44 Years | 706 (64.2%) | 69 (9.8%) |
| 45 to 54 Years | 732 (55.0%) | 19 (2.6%) |
| 55 to 59 Years | 400 (71.6%) | 11 (2.8%) |
| 60 to 64 Years | 195 (16.3%) | 16 (8.2%) |
| 65 to 74 Years | 120 (9.9%) | 21 (17.5%) |
| 75 Years and over | 0 (0.0%) | 0 (0.0%) |
| Total | 3,902 (43.7%) | 577 (14.8%) |
Employment Status by Educational Attainment in Crowley
According to labor force statistics for Crowley, 57.6% of individuals (3,121) out of the total population between 25 and 64 years of age (5,419) are in the labor force, with 14.0% or 437 of them being unemployed. The group with the highest labor force participation rate are those with the educational attainment of college / associate degree, with 85.5% or 942 individuals in the labor force. Within the labor force, individuals with college / associate degree education have the highest percentage of unemployment, with 35.8% or 337 of them being unemployed.
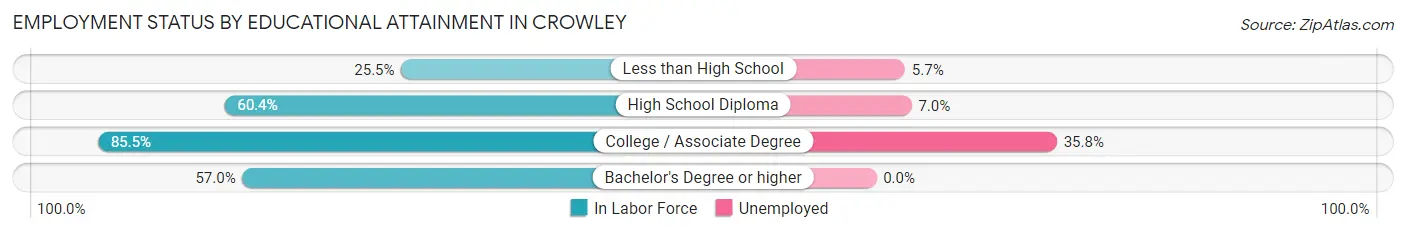
| Educational Attainment | In Labor Force | Unemployed |
| Less than High School | 283 (25.5%) | 63 (5.7%) |
| High School Diploma | 1,207 (60.4%) | 140 (7.0%) |
| College / Associate Degree | 942 (85.5%) | 395 (35.8%) |
| Bachelor's Degree or higher | 688 (57.0%) | 0 (0.0%) |
| Total | 3,121 (57.6%) | 759 (14.0%) |
Employment Occupations by Sex in Crowley
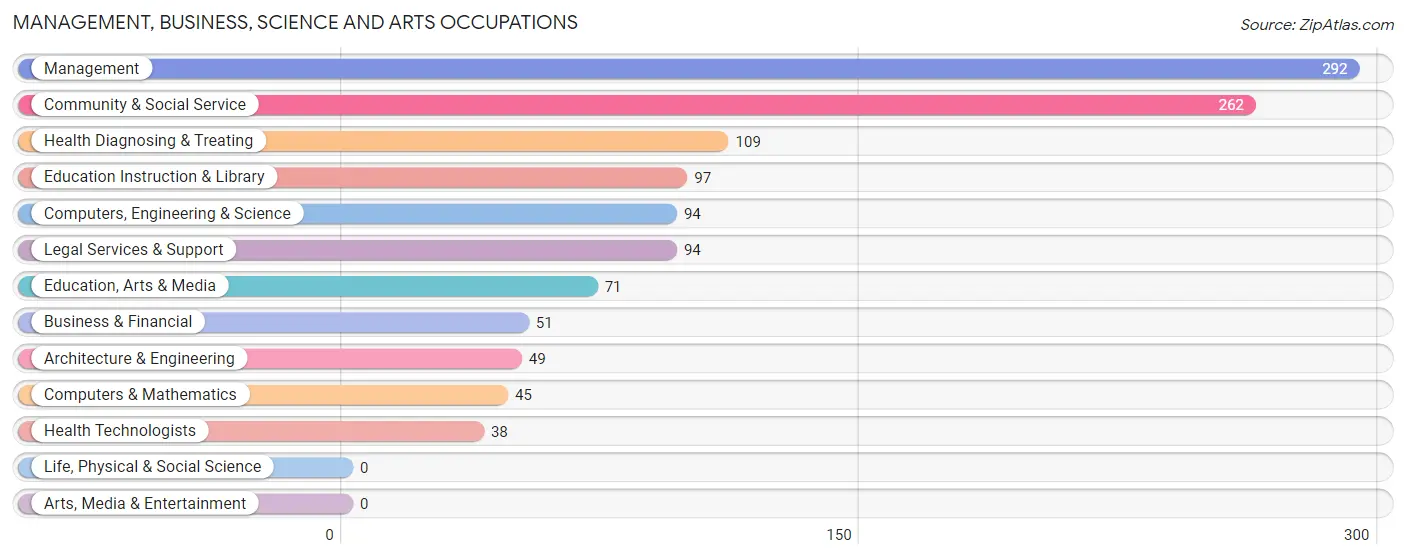
Management, Business, Science and Arts Occupations
The most common Management, Business, Science and Arts occupations in Crowley are Management (292 | 8.8%), Community & Social Service (262 | 7.9%), Health Diagnosing & Treating (109 | 3.3%), Education Instruction & Library (97 | 2.9%), and Computers, Engineering & Science (94 | 2.8%).
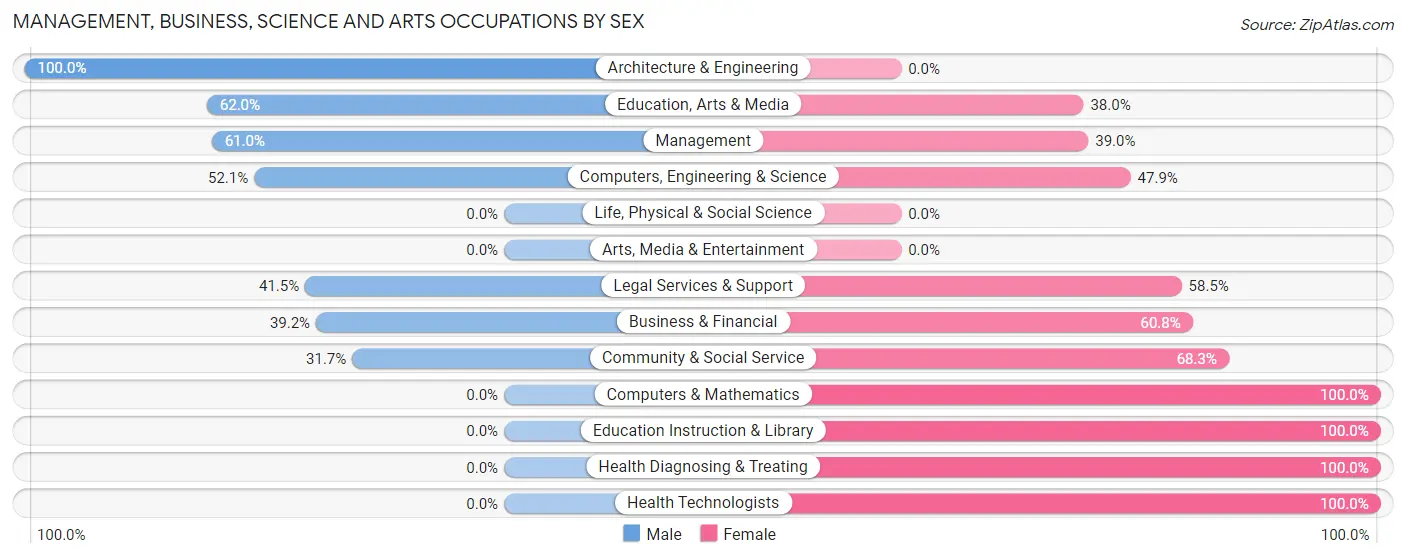
Management, Business, Science and Arts Occupations by Sex
Within the Management, Business, Science and Arts occupations in Crowley, the most male-oriented occupations are Architecture & Engineering (100.0%), Education, Arts & Media (62.0%), and Management (61.0%), while the most female-oriented occupations are Computers & Mathematics (100.0%), Education Instruction & Library (100.0%), and Health Diagnosing & Treating (100.0%).
| Occupation | Male | Female |
| Management | 178 (61.0%) | 114 (39.0%) |
| Business & Financial | 20 (39.2%) | 31 (60.8%) |
| Computers, Engineering & Science | 49 (52.1%) | 45 (47.9%) |
| Computers & Mathematics | 0 (0.0%) | 45 (100.0%) |
| Architecture & Engineering | 49 (100.0%) | 0 (0.0%) |
| Life, Physical & Social Science | 0 (0.0%) | 0 (0.0%) |
| Community & Social Service | 83 (31.7%) | 179 (68.3%) |
| Education, Arts & Media | 44 (62.0%) | 27 (38.0%) |
| Legal Services & Support | 39 (41.5%) | 55 (58.5%) |
| Education Instruction & Library | 0 (0.0%) | 97 (100.0%) |
| Arts, Media & Entertainment | 0 (0.0%) | 0 (0.0%) |
| Health Diagnosing & Treating | 0 (0.0%) | 109 (100.0%) |
| Health Technologists | 0 (0.0%) | 38 (100.0%) |
| Total (Category) | 330 (40.8%) | 478 (59.2%) |
| Total (Overall) | 1,624 (48.8%) | 1,701 (51.2%) |
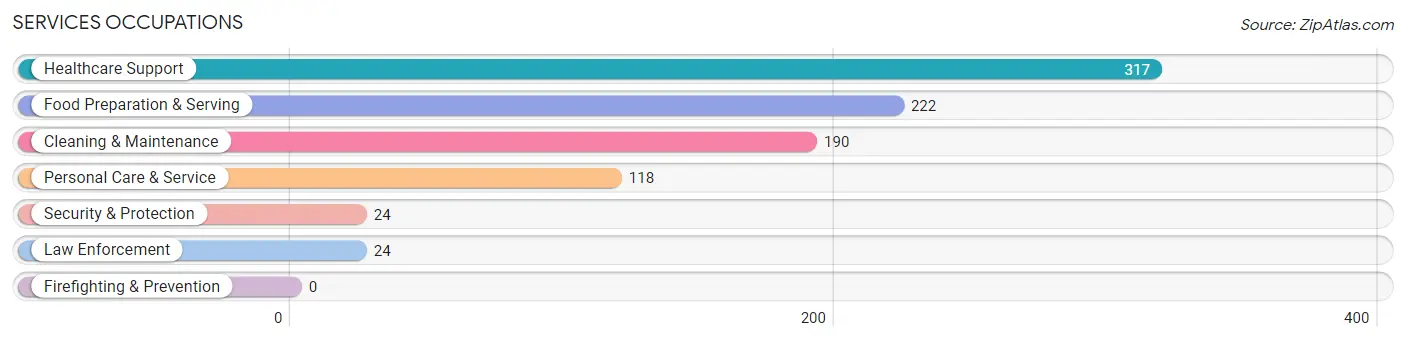
Services Occupations
The most common Services occupations in Crowley are Healthcare Support (317 | 9.5%), Food Preparation & Serving (222 | 6.7%), Cleaning & Maintenance (190 | 5.7%), Personal Care & Service (118 | 3.5%), and Security & Protection (24 | 0.7%).
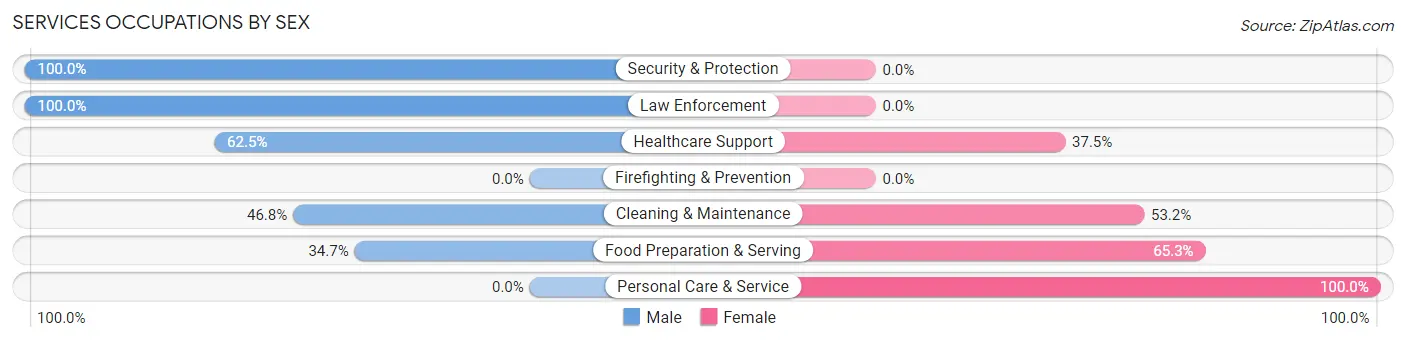
Services Occupations by Sex
Within the Services occupations in Crowley, the most male-oriented occupations are Security & Protection (100.0%), Law Enforcement (100.0%), and Healthcare Support (62.5%), while the most female-oriented occupations are Personal Care & Service (100.0%), Food Preparation & Serving (65.3%), and Cleaning & Maintenance (53.2%).
| Occupation | Male | Female |
| Healthcare Support | 198 (62.5%) | 119 (37.5%) |
| Security & Protection | 24 (100.0%) | 0 (0.0%) |
| Firefighting & Prevention | 0 (0.0%) | 0 (0.0%) |
| Law Enforcement | 24 (100.0%) | 0 (0.0%) |
| Food Preparation & Serving | 77 (34.7%) | 145 (65.3%) |
| Cleaning & Maintenance | 89 (46.8%) | 101 (53.2%) |
| Personal Care & Service | 0 (0.0%) | 118 (100.0%) |
| Total (Category) | 388 (44.6%) | 483 (55.4%) |
| Total (Overall) | 1,624 (48.8%) | 1,701 (51.2%) |
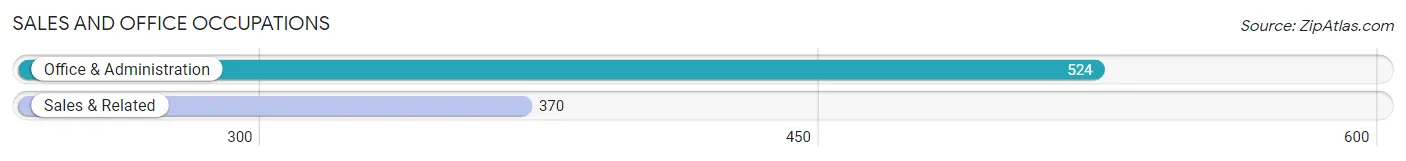
Sales and Office Occupations
The most common Sales and Office occupations in Crowley are Office & Administration (524 | 15.8%), and Sales & Related (370 | 11.1%).
Sales and Office Occupations by Sex
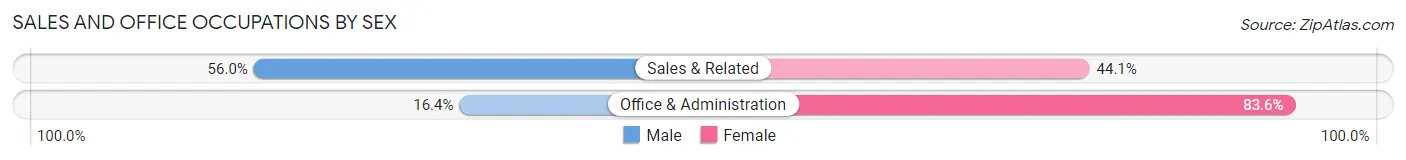
| Occupation | Male | Female |
| Sales & Related | 207 (55.9%) | 163 (44.1%) |
| Office & Administration | 86 (16.4%) | 438 (83.6%) |
| Total (Category) | 293 (32.8%) | 601 (67.2%) |
| Total (Overall) | 1,624 (48.8%) | 1,701 (51.2%) |
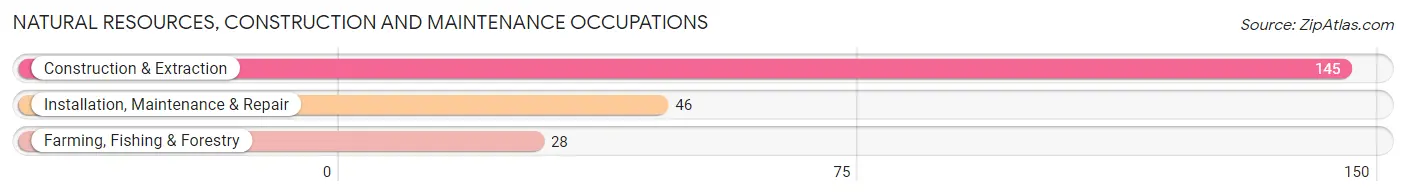
Natural Resources, Construction and Maintenance Occupations
The most common Natural Resources, Construction and Maintenance occupations in Crowley are Construction & Extraction (145 | 4.4%), Installation, Maintenance & Repair (46 | 1.4%), and Farming, Fishing & Forestry (28 | 0.8%).
Natural Resources, Construction and Maintenance Occupations by Sex
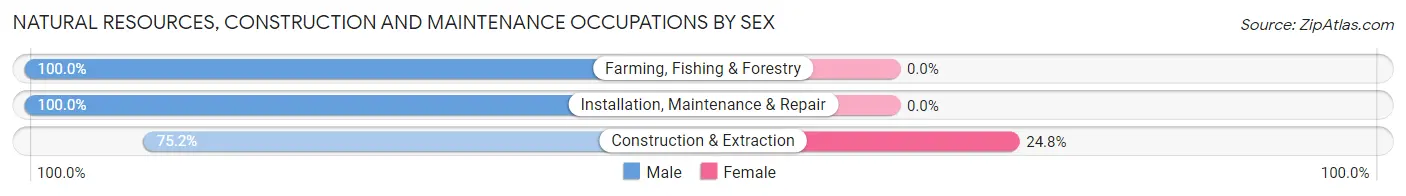
| Occupation | Male | Female |
| Farming, Fishing & Forestry | 28 (100.0%) | 0 (0.0%) |
| Construction & Extraction | 109 (75.2%) | 36 (24.8%) |
| Installation, Maintenance & Repair | 46 (100.0%) | 0 (0.0%) |
| Total (Category) | 183 (83.6%) | 36 (16.4%) |
| Total (Overall) | 1,624 (48.8%) | 1,701 (51.2%) |
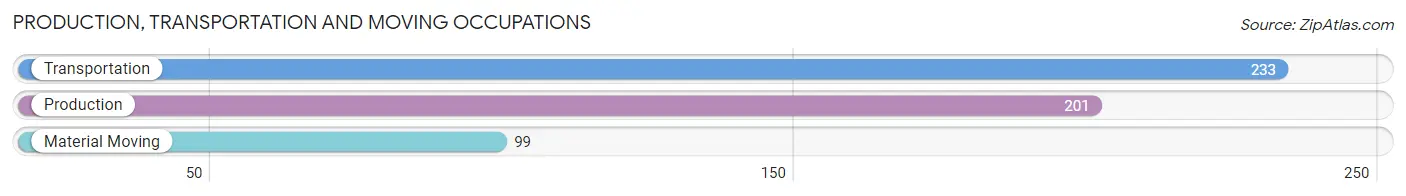
Production, Transportation and Moving Occupations
The most common Production, Transportation and Moving occupations in Crowley are Transportation (233 | 7.0%), Production (201 | 6.0%), and Material Moving (99 | 3.0%).
Production, Transportation and Moving Occupations by Sex
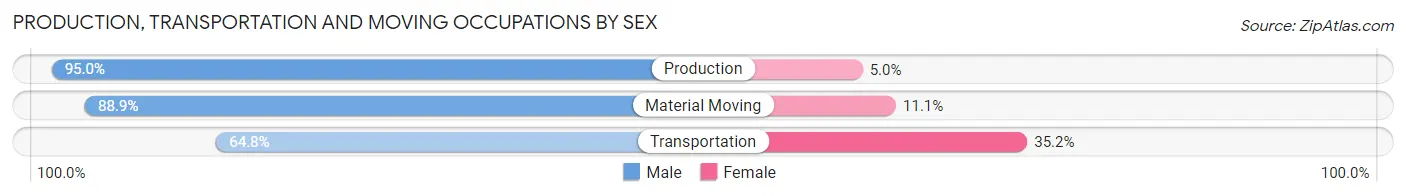
| Occupation | Male | Female |
| Production | 191 (95.0%) | 10 (5.0%) |
| Transportation | 151 (64.8%) | 82 (35.2%) |
| Material Moving | 88 (88.9%) | 11 (11.1%) |
| Total (Category) | 430 (80.7%) | 103 (19.3%) |
| Total (Overall) | 1,624 (48.8%) | 1,701 (51.2%) |
Employment Industries by Sex in Crowley
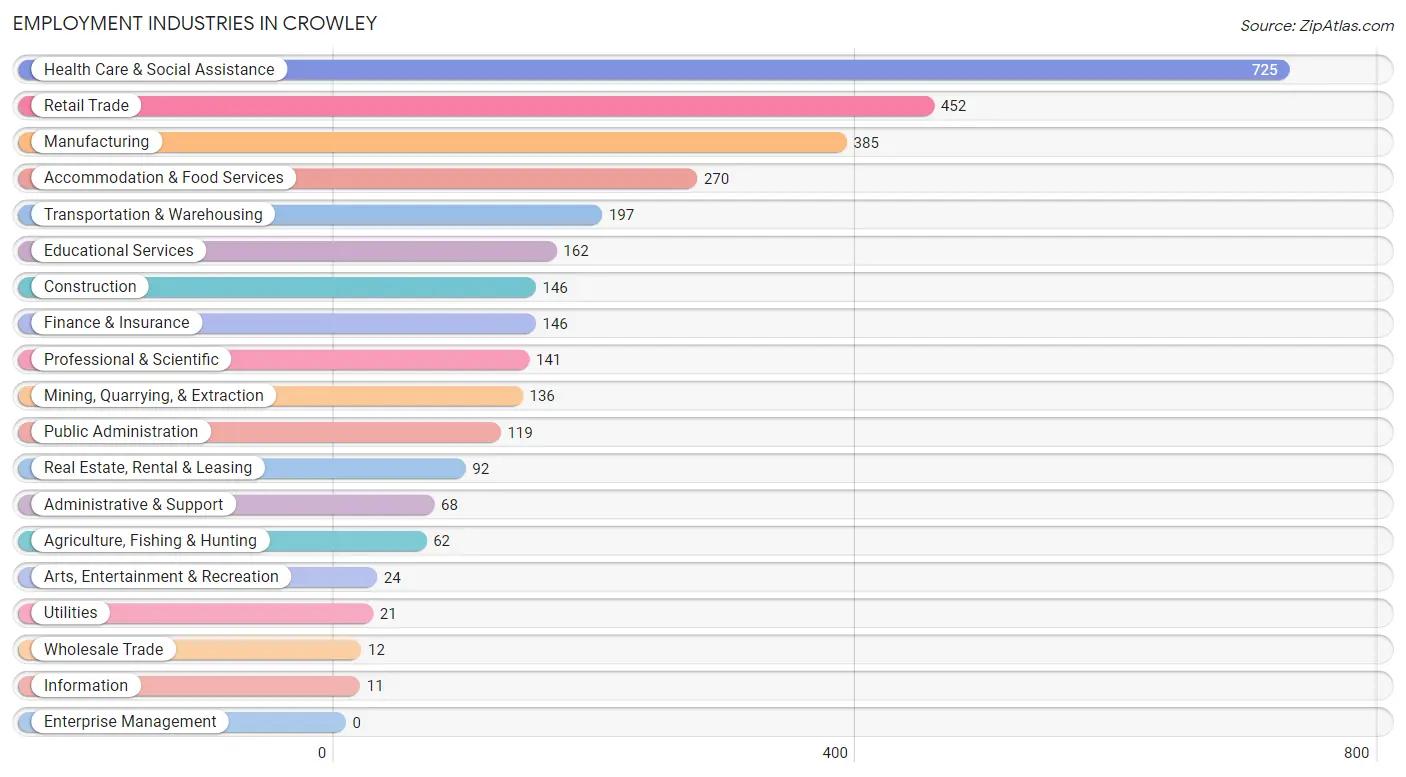
Employment Industries in Crowley
The major employment industries in Crowley include Health Care & Social Assistance (725 | 21.8%), Retail Trade (452 | 13.6%), Manufacturing (385 | 11.6%), Accommodation & Food Services (270 | 8.1%), and Transportation & Warehousing (197 | 5.9%).
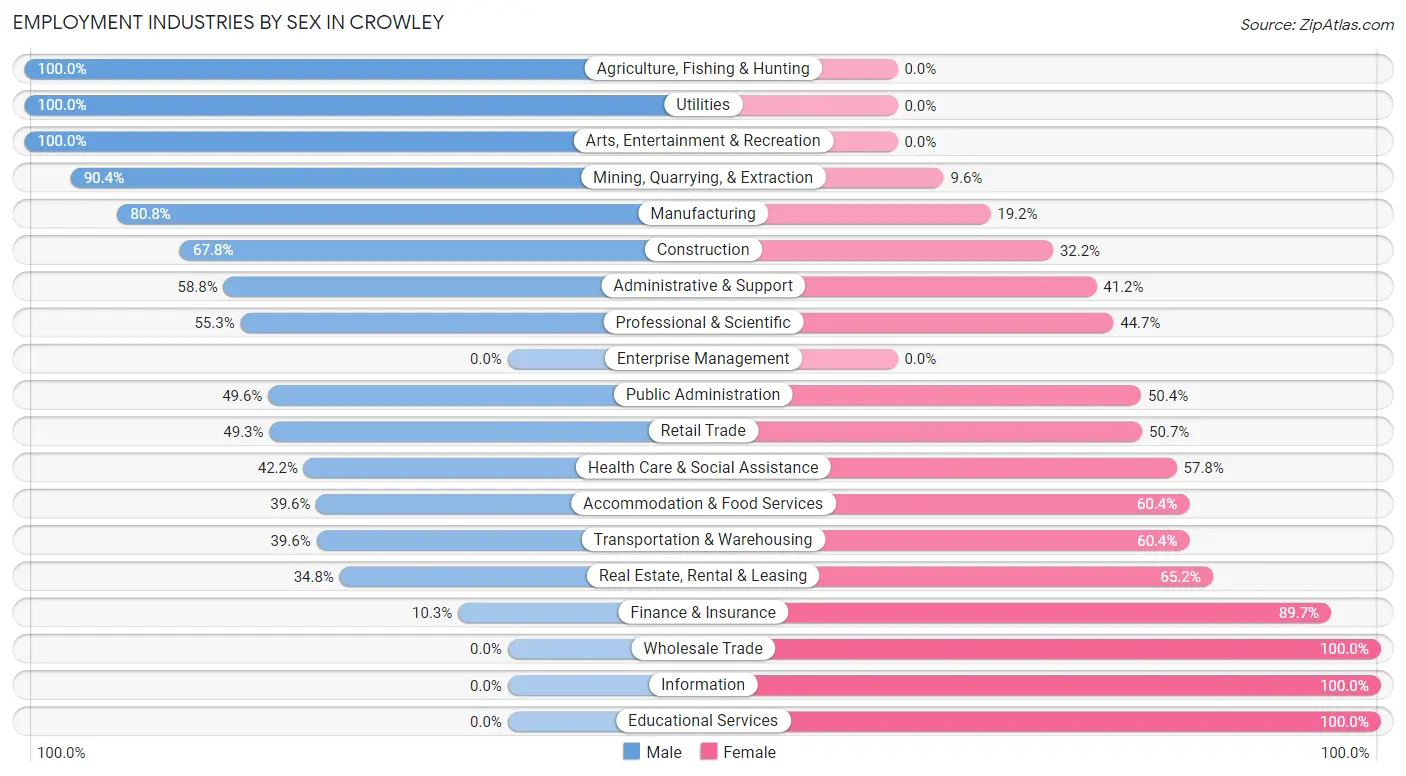
Employment Industries by Sex in Crowley
The Crowley industries that see more men than women are Agriculture, Fishing & Hunting (100.0%), Utilities (100.0%), and Arts, Entertainment & Recreation (100.0%), whereas the industries that tend to have a higher number of women are Wholesale Trade (100.0%), Information (100.0%), and Educational Services (100.0%).
| Industry | Male | Female |
| Agriculture, Fishing & Hunting | 62 (100.0%) | 0 (0.0%) |
| Mining, Quarrying, & Extraction | 123 (90.4%) | 13 (9.6%) |
| Construction | 99 (67.8%) | 47 (32.2%) |
| Manufacturing | 311 (80.8%) | 74 (19.2%) |
| Wholesale Trade | 0 (0.0%) | 12 (100.0%) |
| Retail Trade | 223 (49.3%) | 229 (50.7%) |
| Transportation & Warehousing | 78 (39.6%) | 119 (60.4%) |
| Utilities | 21 (100.0%) | 0 (0.0%) |
| Information | 0 (0.0%) | 11 (100.0%) |
| Finance & Insurance | 15 (10.3%) | 131 (89.7%) |
| Real Estate, Rental & Leasing | 32 (34.8%) | 60 (65.2%) |
| Professional & Scientific | 78 (55.3%) | 63 (44.7%) |
| Enterprise Management | 0 (0.0%) | 0 (0.0%) |
| Administrative & Support | 40 (58.8%) | 28 (41.2%) |
| Educational Services | 0 (0.0%) | 162 (100.0%) |
| Health Care & Social Assistance | 306 (42.2%) | 419 (57.8%) |
| Arts, Entertainment & Recreation | 24 (100.0%) | 0 (0.0%) |
| Accommodation & Food Services | 107 (39.6%) | 163 (60.4%) |
| Public Administration | 59 (49.6%) | 60 (50.4%) |
| Total | 1,624 (48.8%) | 1,701 (51.2%) |
Education in Crowley
School Enrollment in Crowley
The most common levels of schooling among the 2,844 students in Crowley are middle school (694 | 24.4%), elementary school (682 | 24.0%), and high school (553 | 19.4%).
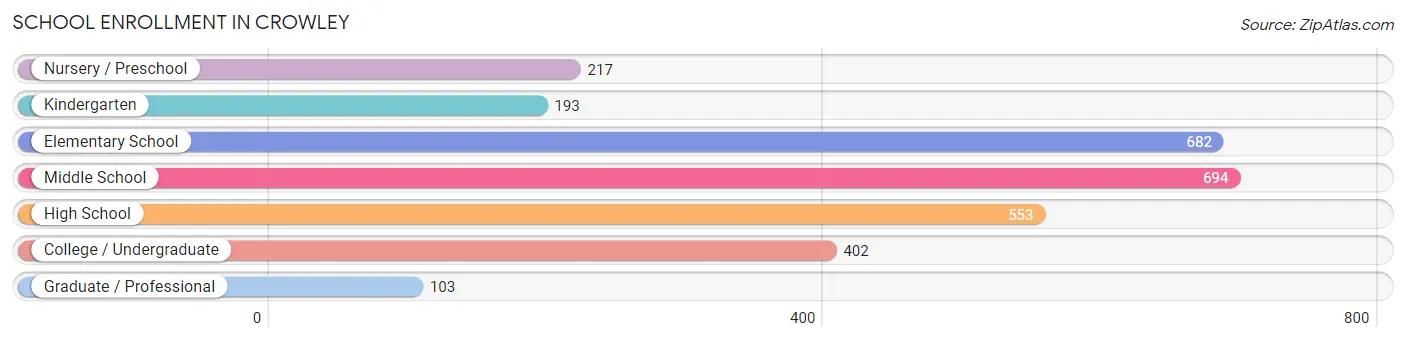
| School Level | # Students | % Students |
| Nursery / Preschool | 217 | 7.6% |
| Kindergarten | 193 | 6.8% |
| Elementary School | 682 | 24.0% |
| Middle School | 694 | 24.4% |
| High School | 553 | 19.4% |
| College / Undergraduate | 402 | 14.1% |
| Graduate / Professional | 103 | 3.6% |
| Total | 2,844 | 100.0% |
School Enrollment by Age by Funding Source in Crowley
Out of a total of 2,844 students who are enrolled in schools in Crowley, 492 (17.3%) attend a private institution, while the remaining 2,352 (82.7%) are enrolled in public schools. The age group of 20 to 24 year olds has the highest likelihood of being enrolled in private schools, with 54 (25.5% in the age bracket) enrolled. Conversely, the age group of 18 to 19 year olds has the lowest likelihood of being enrolled in a private school, with 135 (100.0% in the age bracket) attending a public institution.
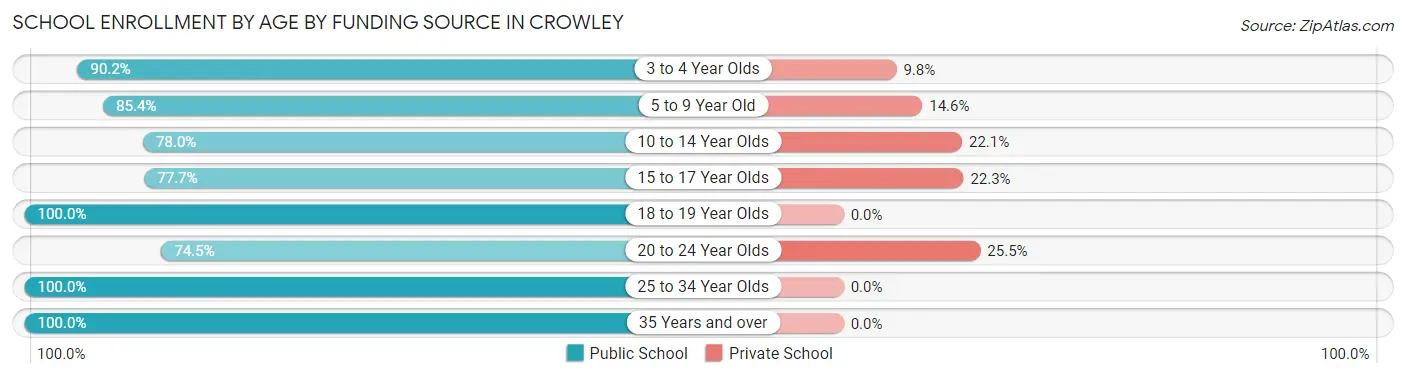
| Age Bracket | Public School | Private School |
| 3 to 4 Year Olds | 165 (90.2%) | 18 (9.8%) |
| 5 to 9 Year Old | 653 (85.4%) | 112 (14.6%) |
| 10 to 14 Year Olds | 686 (77.9%) | 194 (22.1%) |
| 15 to 17 Year Olds | 397 (77.7%) | 114 (22.3%) |
| 18 to 19 Year Olds | 135 (100.0%) | 0 (0.0%) |
| 20 to 24 Year Olds | 158 (74.5%) | 54 (25.5%) |
| 25 to 34 Year Olds | 136 (100.0%) | 0 (0.0%) |
| 35 Years and over | 22 (100.0%) | 0 (0.0%) |
| Total | 2,352 (82.7%) | 492 (17.3%) |
Educational Attainment by Field of Study in Crowley
Business (479 | 31.0%), science & technology (325 | 21.0%), liberal arts & history (153 | 9.9%), engineering (143 | 9.2%), and education (143 | 9.2%) are the most common fields of study among 1,547 individuals in Crowley who have obtained a bachelor's degree or higher.
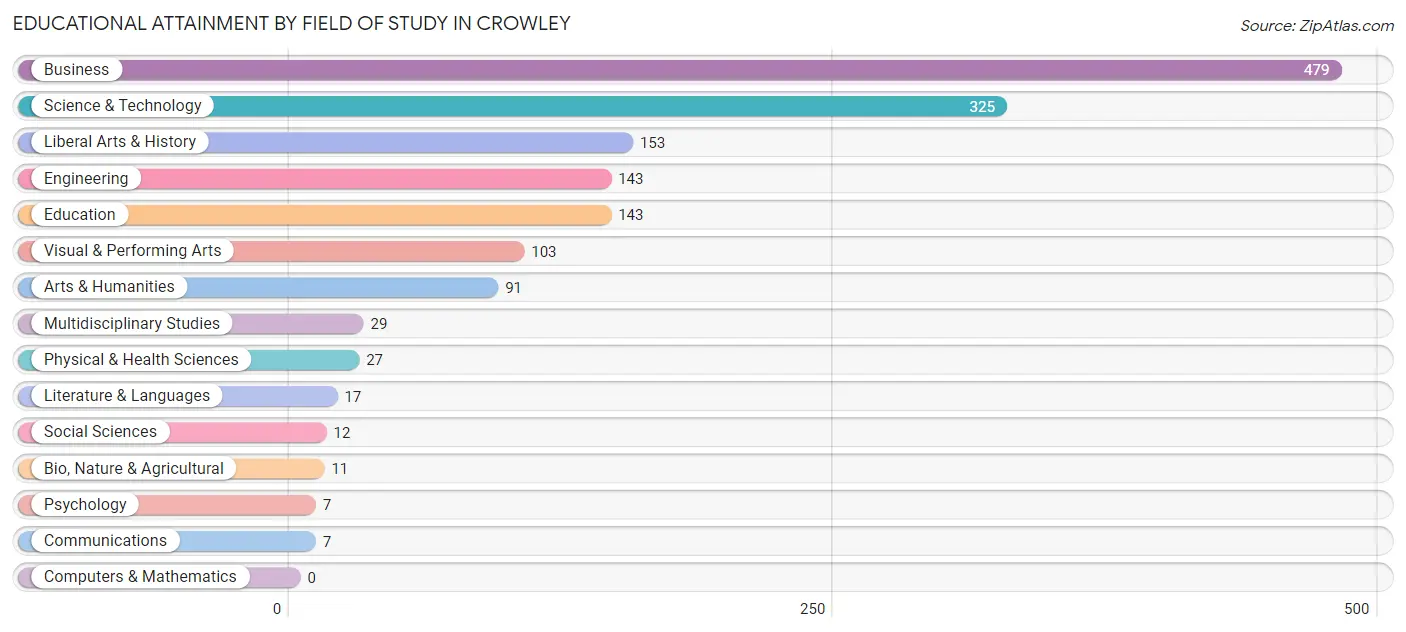
| Field of Study | # Graduates | % Graduates |
| Computers & Mathematics | 0 | 0.0% |
| Bio, Nature & Agricultural | 11 | 0.7% |
| Physical & Health Sciences | 27 | 1.8% |
| Psychology | 7 | 0.4% |
| Social Sciences | 12 | 0.8% |
| Engineering | 143 | 9.2% |
| Multidisciplinary Studies | 29 | 1.9% |
| Science & Technology | 325 | 21.0% |
| Business | 479 | 31.0% |
| Education | 143 | 9.2% |
| Literature & Languages | 17 | 1.1% |
| Liberal Arts & History | 153 | 9.9% |
| Visual & Performing Arts | 103 | 6.7% |
| Communications | 7 | 0.4% |
| Arts & Humanities | 91 | 5.9% |
| Total | 1,547 | 100.0% |
Transportation & Commute in Crowley
Vehicle Availability by Sex in Crowley
The most prevalent vehicle ownership categories in Crowley are males with 2 vehicles (718, accounting for 44.7%) and females with 2 vehicles (709, making up 42.2%).
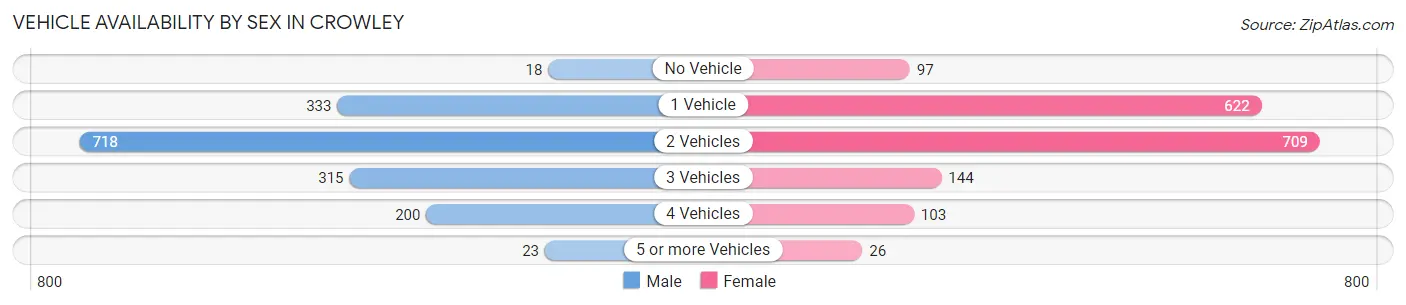
| Vehicles Available | Male | Female |
| No Vehicle | 18 (1.1%) | 97 (5.7%) |
| 1 Vehicle | 333 (20.7%) | 622 (36.6%) |
| 2 Vehicles | 718 (44.7%) | 709 (41.7%) |
| 3 Vehicles | 315 (19.6%) | 144 (8.5%) |
| 4 Vehicles | 200 (12.4%) | 103 (6.1%) |
| 5 or more Vehicles | 23 (1.4%) | 26 (1.5%) |
| Total | 1,607 (100.0%) | 1,701 (100.0%) |
Commute Time in Crowley
The most frequently occuring commute durations in Crowley are 10 to 14 minutes (627 commuters, 19.5%), 5 to 9 minutes (513 commuters, 16.0%), and 20 to 24 minutes (408 commuters, 12.7%).
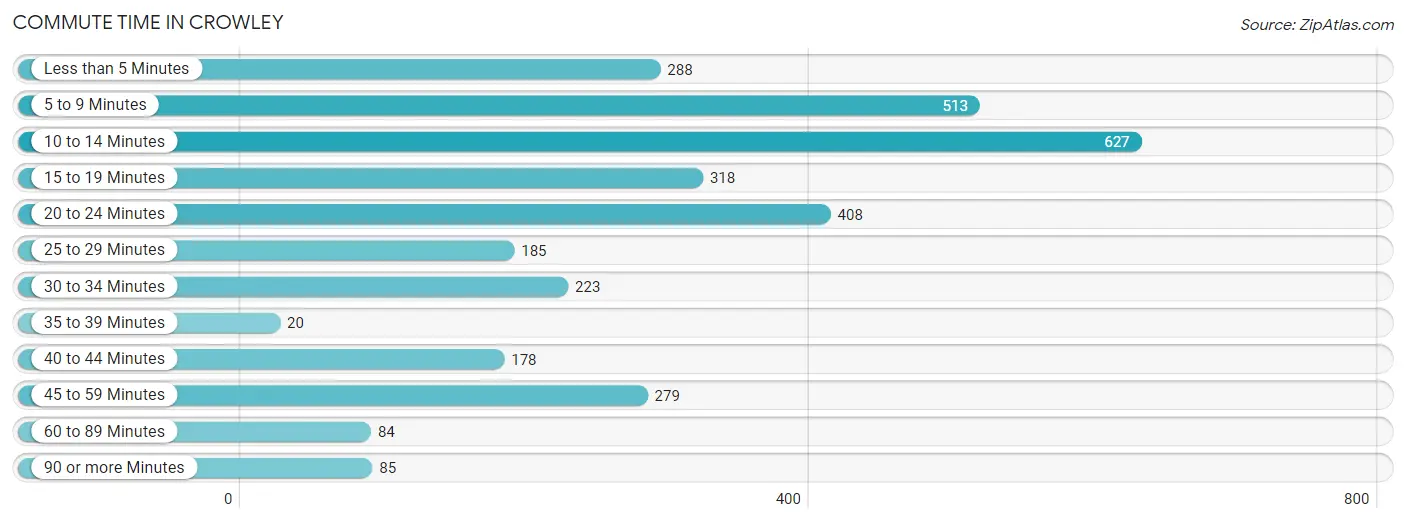
| Commute Time | # Commuters | % Commuters |
| Less than 5 Minutes | 288 | 9.0% |
| 5 to 9 Minutes | 513 | 16.0% |
| 10 to 14 Minutes | 627 | 19.5% |
| 15 to 19 Minutes | 318 | 9.9% |
| 20 to 24 Minutes | 408 | 12.7% |
| 25 to 29 Minutes | 185 | 5.8% |
| 30 to 34 Minutes | 223 | 7.0% |
| 35 to 39 Minutes | 20 | 0.6% |
| 40 to 44 Minutes | 178 | 5.6% |
| 45 to 59 Minutes | 279 | 8.7% |
| 60 to 89 Minutes | 84 | 2.6% |
| 90 or more Minutes | 85 | 2.6% |
Commute Time by Sex in Crowley
The most common commute times in Crowley are 10 to 14 minutes (265 commuters, 17.1%) for males and 10 to 14 minutes (362 commuters, 21.9%) for females.
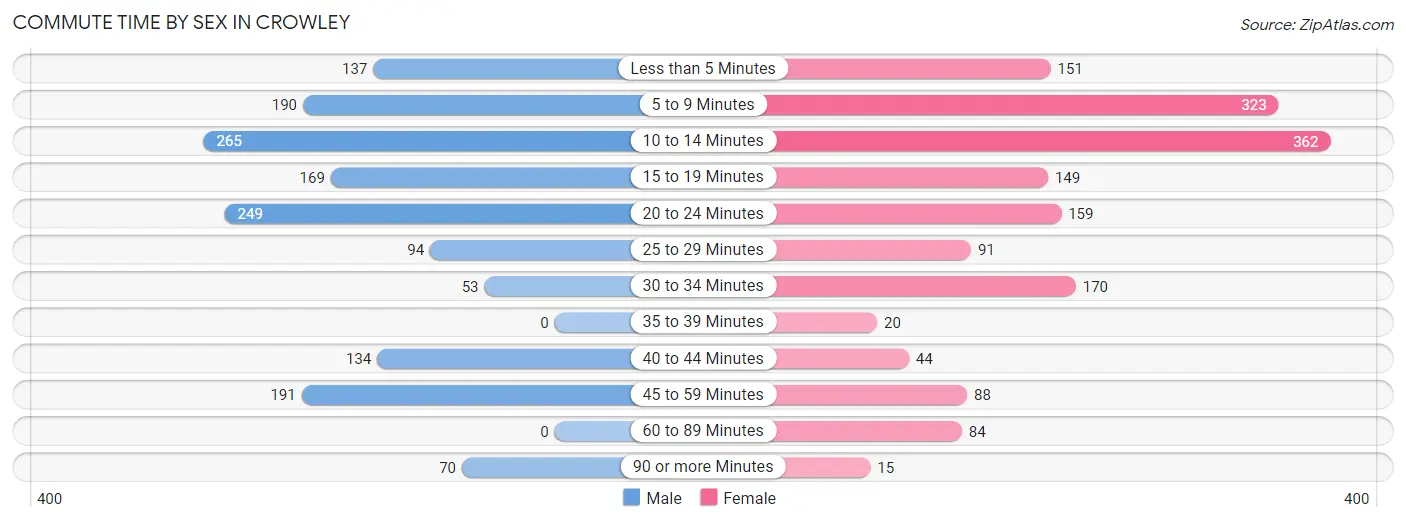
| Commute Time | Male | Female |
| Less than 5 Minutes | 137 (8.8%) | 151 (9.1%) |
| 5 to 9 Minutes | 190 (12.2%) | 323 (19.5%) |
| 10 to 14 Minutes | 265 (17.1%) | 362 (21.9%) |
| 15 to 19 Minutes | 169 (10.9%) | 149 (9.0%) |
| 20 to 24 Minutes | 249 (16.0%) | 159 (9.6%) |
| 25 to 29 Minutes | 94 (6.1%) | 91 (5.5%) |
| 30 to 34 Minutes | 53 (3.4%) | 170 (10.3%) |
| 35 to 39 Minutes | 0 (0.0%) | 20 (1.2%) |
| 40 to 44 Minutes | 134 (8.6%) | 44 (2.7%) |
| 45 to 59 Minutes | 191 (12.3%) | 88 (5.3%) |
| 60 to 89 Minutes | 0 (0.0%) | 84 (5.1%) |
| 90 or more Minutes | 70 (4.5%) | 15 (0.9%) |
Time of Departure to Work by Sex in Crowley
The most frequent times of departure to work in Crowley are 6:30 AM to 6:59 AM (267, 17.2%) for males and 6:30 AM to 6:59 AM (294, 17.7%) for females.
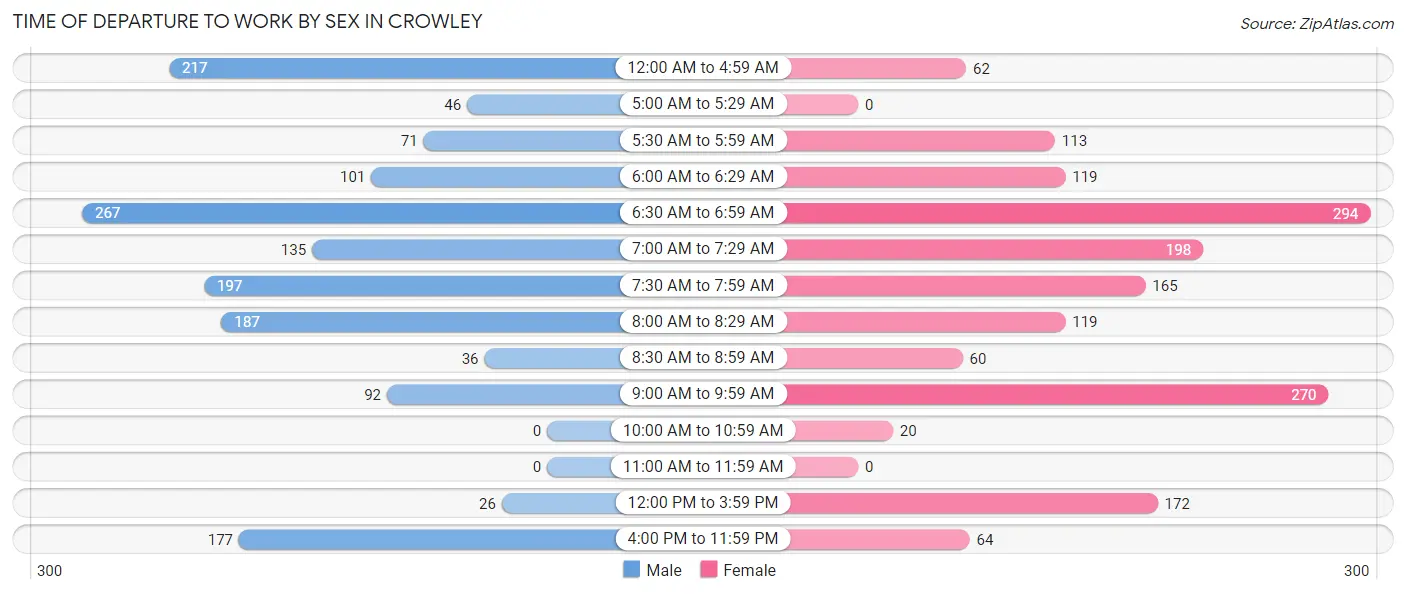
| Time of Departure | Male | Female |
| 12:00 AM to 4:59 AM | 217 (14.0%) | 62 (3.7%) |
| 5:00 AM to 5:29 AM | 46 (3.0%) | 0 (0.0%) |
| 5:30 AM to 5:59 AM | 71 (4.6%) | 113 (6.8%) |
| 6:00 AM to 6:29 AM | 101 (6.5%) | 119 (7.2%) |
| 6:30 AM to 6:59 AM | 267 (17.2%) | 294 (17.7%) |
| 7:00 AM to 7:29 AM | 135 (8.7%) | 198 (12.0%) |
| 7:30 AM to 7:59 AM | 197 (12.7%) | 165 (10.0%) |
| 8:00 AM to 8:29 AM | 187 (12.0%) | 119 (7.2%) |
| 8:30 AM to 8:59 AM | 36 (2.3%) | 60 (3.6%) |
| 9:00 AM to 9:59 AM | 92 (5.9%) | 270 (16.3%) |
| 10:00 AM to 10:59 AM | 0 (0.0%) | 20 (1.2%) |
| 11:00 AM to 11:59 AM | 0 (0.0%) | 0 (0.0%) |
| 12:00 PM to 3:59 PM | 26 (1.7%) | 172 (10.4%) |
| 4:00 PM to 11:59 PM | 177 (11.4%) | 64 (3.9%) |
| Total | 1,552 (100.0%) | 1,656 (100.0%) |
Housing Occupancy in Crowley
Occupancy by Ownership in Crowley
Of the total 4,863 dwellings in Crowley, owner-occupied units account for 2,367 (48.7%), while renter-occupied units make up 2,496 (51.3%).
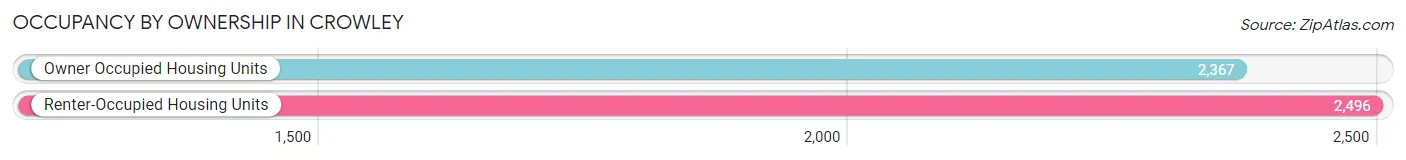
| Occupancy | # Housing Units | % Housing Units |
| Owner Occupied Housing Units | 2,367 | 48.7% |
| Renter-Occupied Housing Units | 2,496 | 51.3% |
| Total Occupied Housing Units | 4,863 | 100.0% |
Occupancy by Household Size in Crowley
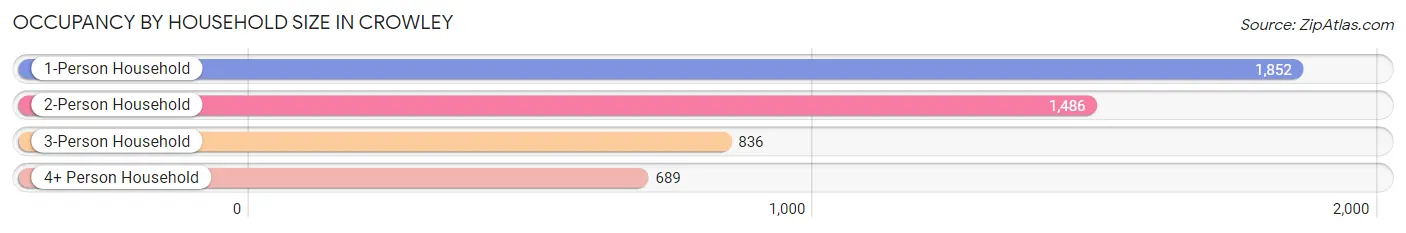
| Household Size | # Housing Units | % Housing Units |
| 1-Person Household | 1,852 | 38.1% |
| 2-Person Household | 1,486 | 30.6% |
| 3-Person Household | 836 | 17.2% |
| 4+ Person Household | 689 | 14.2% |
| Total Housing Units | 4,863 | 100.0% |
Occupancy by Ownership by Household Size in Crowley
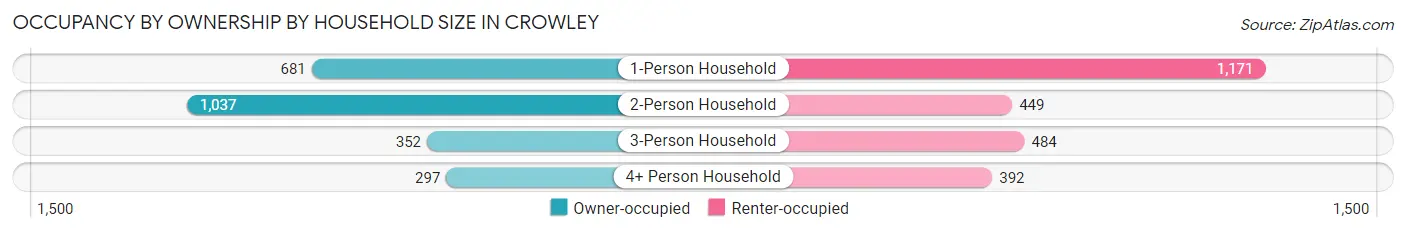
| Household Size | Owner-occupied | Renter-occupied |
| 1-Person Household | 681 (36.8%) | 1,171 (63.2%) |
| 2-Person Household | 1,037 (69.8%) | 449 (30.2%) |
| 3-Person Household | 352 (42.1%) | 484 (57.9%) |
| 4+ Person Household | 297 (43.1%) | 392 (56.9%) |
| Total Housing Units | 2,367 (48.7%) | 2,496 (51.3%) |
Occupancy by Educational Attainment in Crowley
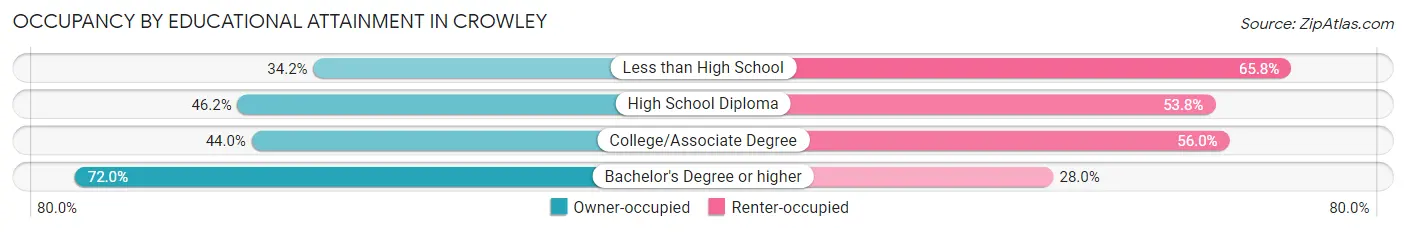
| Household Size | Owner-occupied | Renter-occupied |
| Less than High School | 411 (34.2%) | 791 (65.8%) |
| High School Diploma | 698 (46.2%) | 812 (53.8%) |
| College/Associate Degree | 457 (44.0%) | 582 (56.0%) |
| Bachelor's Degree or higher | 801 (72.0%) | 311 (28.0%) |
Occupancy by Age of Householder in Crowley
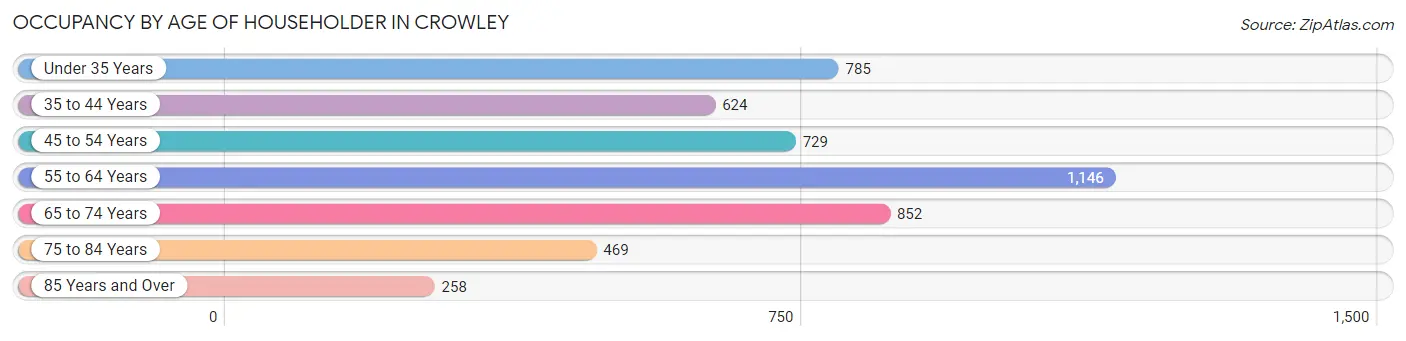
| Age Bracket | # Households | % Households |
| Under 35 Years | 785 | 16.1% |
| 35 to 44 Years | 624 | 12.8% |
| 45 to 54 Years | 729 | 15.0% |
| 55 to 64 Years | 1,146 | 23.6% |
| 65 to 74 Years | 852 | 17.5% |
| 75 to 84 Years | 469 | 9.6% |
| 85 Years and Over | 258 | 5.3% |
| Total | 4,863 | 100.0% |
Housing Finances in Crowley
Median Income by Occupancy in Crowley
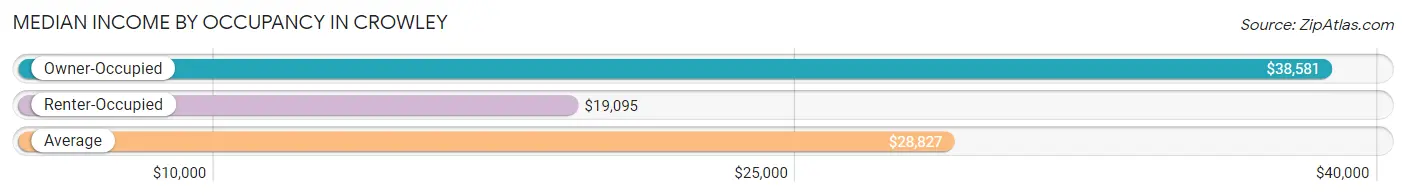
| Occupancy Type | # Households | Median Income |
| Owner-Occupied | 2,367 (48.7%) | $38,581 |
| Renter-Occupied | 2,496 (51.3%) | $19,095 |
| Average | 4,863 (100.0%) | $28,827 |
Occupancy by Householder Income Bracket in Crowley
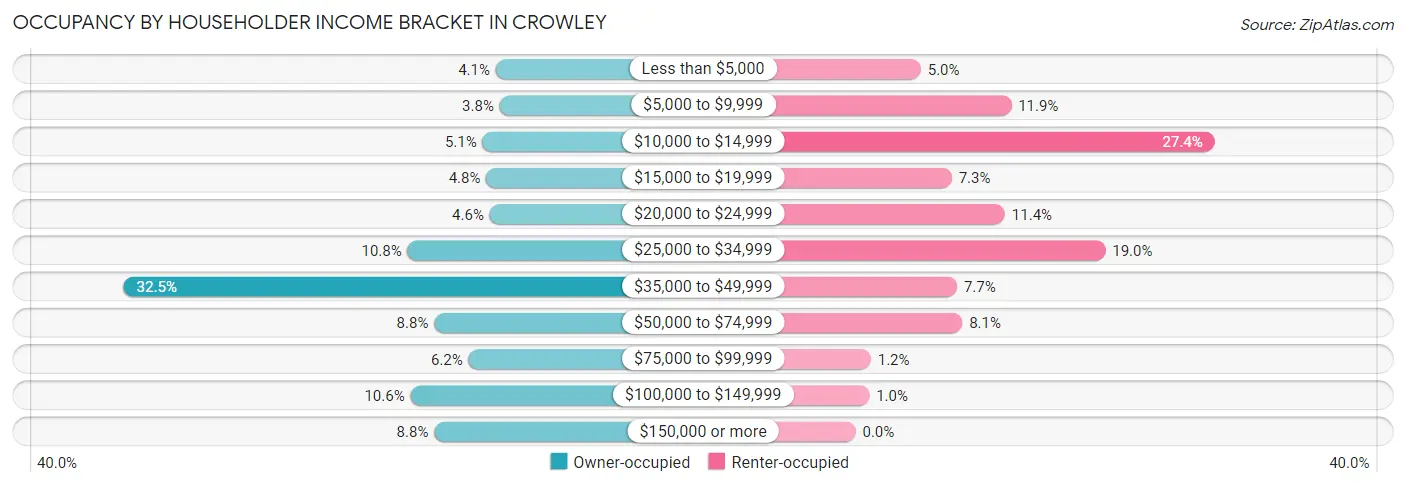
| Income Bracket | Owner-occupied | Renter-occupied |
| Less than $5,000 | 97 (4.1%) | 124 (5.0%) |
| $5,000 to $9,999 | 90 (3.8%) | 296 (11.9%) |
| $10,000 to $14,999 | 121 (5.1%) | 683 (27.4%) |
| $15,000 to $19,999 | 114 (4.8%) | 183 (7.3%) |
| $20,000 to $24,999 | 108 (4.6%) | 284 (11.4%) |
| $25,000 to $34,999 | 256 (10.8%) | 475 (19.0%) |
| $35,000 to $49,999 | 768 (32.5%) | 193 (7.7%) |
| $50,000 to $74,999 | 208 (8.8%) | 203 (8.1%) |
| $75,000 to $99,999 | 146 (6.2%) | 29 (1.2%) |
| $100,000 to $149,999 | 251 (10.6%) | 26 (1.0%) |
| $150,000 or more | 208 (8.8%) | 0 (0.0%) |
| Total | 2,367 (100.0%) | 2,496 (100.0%) |
Monthly Housing Cost Tiers in Crowley
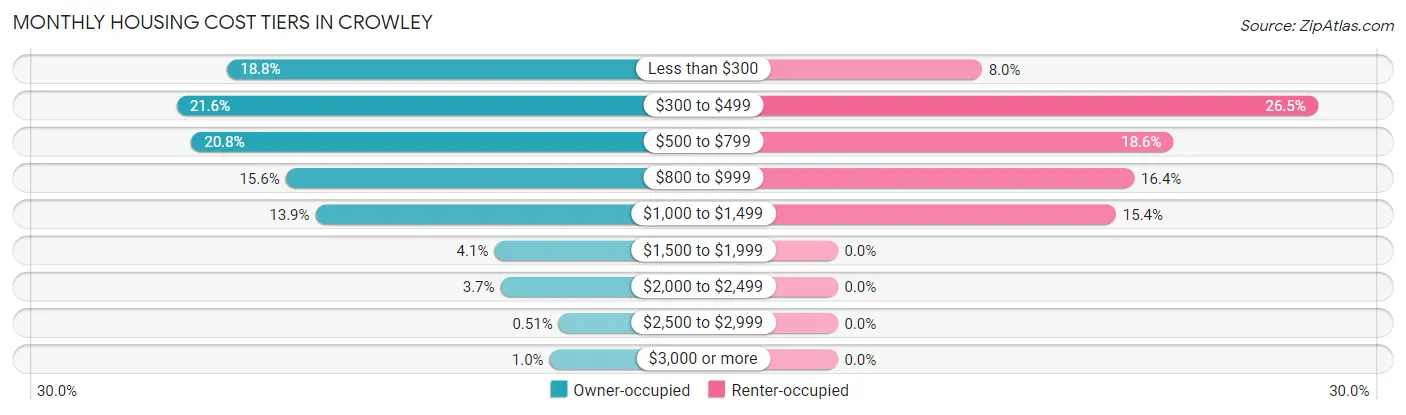
| Monthly Cost | Owner-occupied | Renter-occupied |
| Less than $300 | 445 (18.8%) | 199 (8.0%) |
| $300 to $499 | 511 (21.6%) | 662 (26.5%) |
| $500 to $799 | 492 (20.8%) | 463 (18.5%) |
| $800 to $999 | 369 (15.6%) | 409 (16.4%) |
| $1,000 to $1,499 | 330 (13.9%) | 384 (15.4%) |
| $1,500 to $1,999 | 96 (4.1%) | 0 (0.0%) |
| $2,000 to $2,499 | 88 (3.7%) | 0 (0.0%) |
| $2,500 to $2,999 | 12 (0.5%) | 0 (0.0%) |
| $3,000 or more | 24 (1.0%) | 0 (0.0%) |
| Total | 2,367 (100.0%) | 2,496 (100.0%) |
Physical Housing Characteristics in Crowley
Housing Structures in Crowley
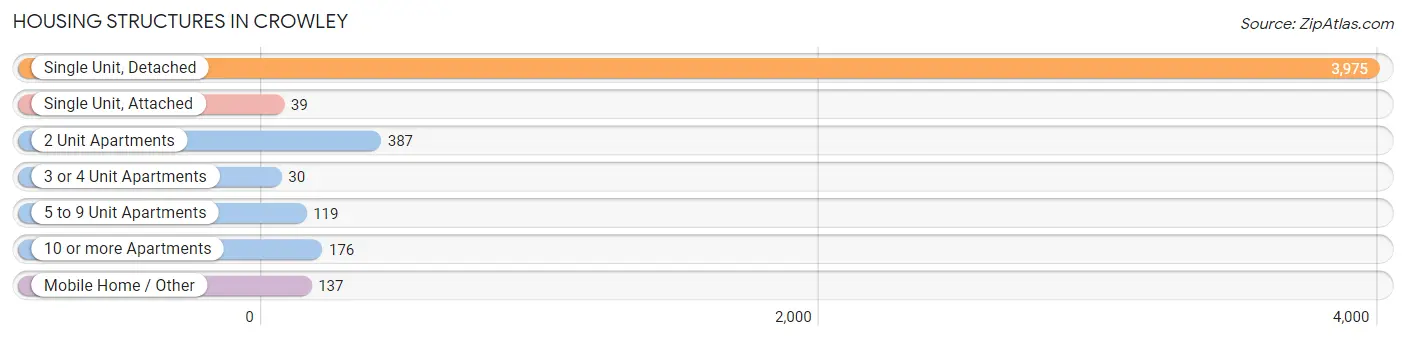
| Structure Type | # Housing Units | % Housing Units |
| Single Unit, Detached | 3,975 | 81.7% |
| Single Unit, Attached | 39 | 0.8% |
| 2 Unit Apartments | 387 | 8.0% |
| 3 or 4 Unit Apartments | 30 | 0.6% |
| 5 to 9 Unit Apartments | 119 | 2.5% |
| 10 or more Apartments | 176 | 3.6% |
| Mobile Home / Other | 137 | 2.8% |
| Total | 4,863 | 100.0% |
Housing Structures by Occupancy in Crowley
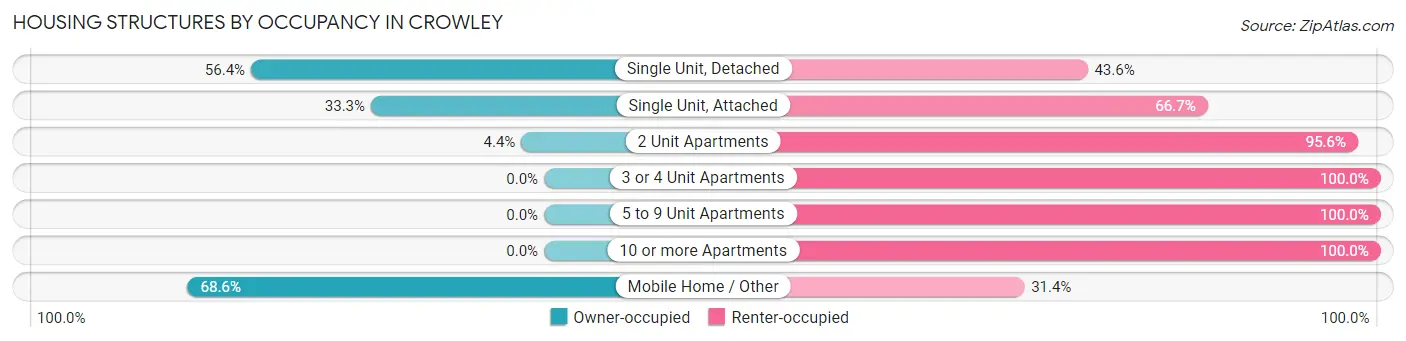
| Structure Type | Owner-occupied | Renter-occupied |
| Single Unit, Detached | 2,243 (56.4%) | 1,732 (43.6%) |
| Single Unit, Attached | 13 (33.3%) | 26 (66.7%) |
| 2 Unit Apartments | 17 (4.4%) | 370 (95.6%) |
| 3 or 4 Unit Apartments | 0 (0.0%) | 30 (100.0%) |
| 5 to 9 Unit Apartments | 0 (0.0%) | 119 (100.0%) |
| 10 or more Apartments | 0 (0.0%) | 176 (100.0%) |
| Mobile Home / Other | 94 (68.6%) | 43 (31.4%) |
| Total | 2,367 (48.7%) | 2,496 (51.3%) |
Housing Structures by Number of Rooms in Crowley
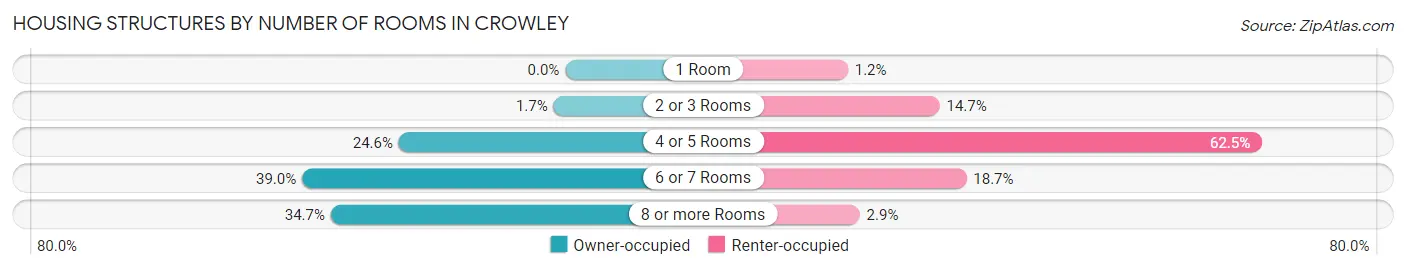
| Number of Rooms | Owner-occupied | Renter-occupied |
| 1 Room | 0 (0.0%) | 29 (1.2%) |
| 2 or 3 Rooms | 41 (1.7%) | 368 (14.7%) |
| 4 or 5 Rooms | 583 (24.6%) | 1,559 (62.5%) |
| 6 or 7 Rooms | 922 (39.0%) | 467 (18.7%) |
| 8 or more Rooms | 821 (34.7%) | 73 (2.9%) |
| Total | 2,367 (100.0%) | 2,496 (100.0%) |
Housing Structure by Heating Type in Crowley
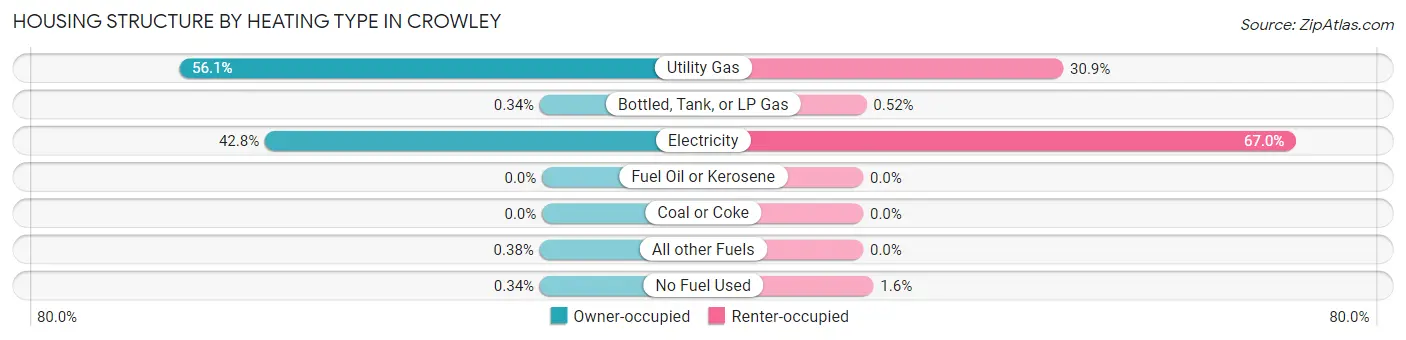
| Heating Type | Owner-occupied | Renter-occupied |
| Utility Gas | 1,328 (56.1%) | 772 (30.9%) |
| Bottled, Tank, or LP Gas | 8 (0.3%) | 13 (0.5%) |
| Electricity | 1,014 (42.8%) | 1,671 (66.9%) |
| Fuel Oil or Kerosene | 0 (0.0%) | 0 (0.0%) |
| Coal or Coke | 0 (0.0%) | 0 (0.0%) |
| All other Fuels | 9 (0.4%) | 0 (0.0%) |
| No Fuel Used | 8 (0.3%) | 40 (1.6%) |
| Total | 2,367 (100.0%) | 2,496 (100.0%) |
Household Vehicle Usage in Crowley
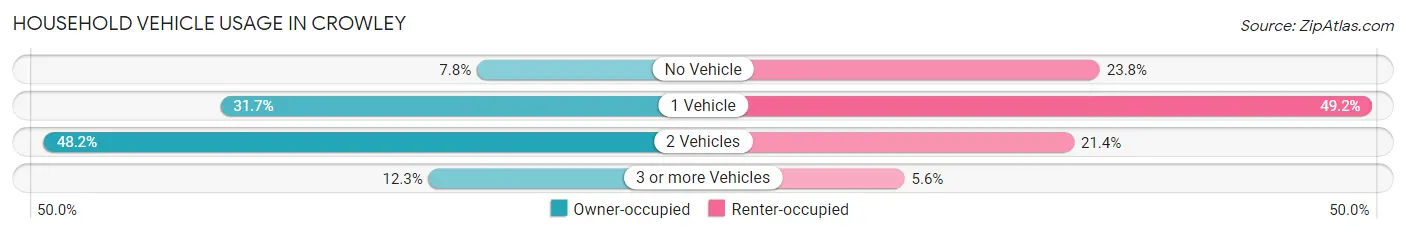
| Vehicles per Household | Owner-occupied | Renter-occupied |
| No Vehicle | 184 (7.8%) | 594 (23.8%) |
| 1 Vehicle | 751 (31.7%) | 1,229 (49.2%) |
| 2 Vehicles | 1,141 (48.2%) | 534 (21.4%) |
| 3 or more Vehicles | 291 (12.3%) | 139 (5.6%) |
| Total | 2,367 (100.0%) | 2,496 (100.0%) |
Real Estate & Mortgages in Crowley
Real Estate and Mortgage Overview in Crowley
| Characteristic | Without Mortgage | With Mortgage |
| Housing Units | 1,614 | 753 |
| Median Property Value | $124,300 | $140,800 |
| Median Household Income | $37,035 | $178 |
| Monthly Housing Costs | $418 | $24 |
| Real Estate Taxes | $338 | $28 |
Property Value by Mortgage Status in Crowley
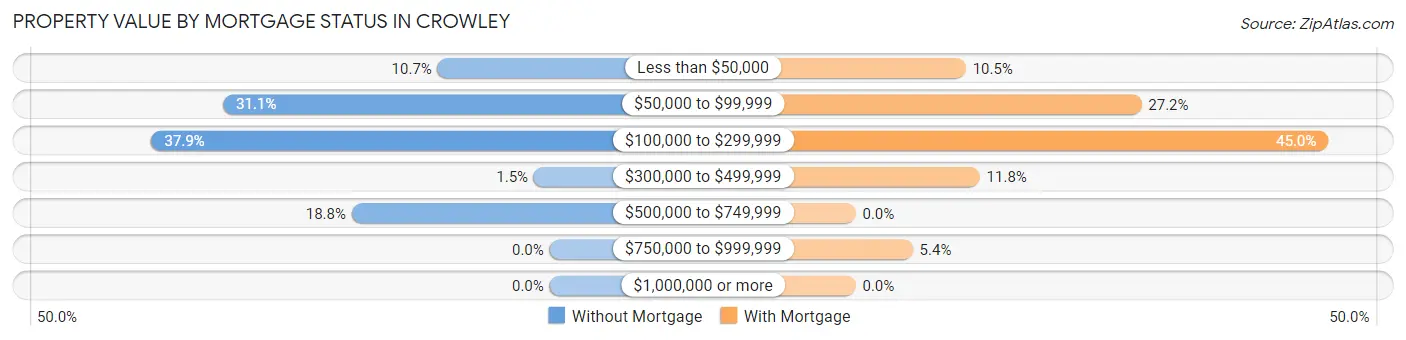
| Property Value | Without Mortgage | With Mortgage |
| Less than $50,000 | 172 (10.7%) | 79 (10.5%) |
| $50,000 to $99,999 | 502 (31.1%) | 205 (27.2%) |
| $100,000 to $299,999 | 612 (37.9%) | 339 (45.0%) |
| $300,000 to $499,999 | 24 (1.5%) | 89 (11.8%) |
| $500,000 to $749,999 | 304 (18.8%) | 0 (0.0%) |
| $750,000 to $999,999 | 0 (0.0%) | 41 (5.4%) |
| $1,000,000 or more | 0 (0.0%) | 0 (0.0%) |
| Total | 1,614 (100.0%) | 753 (100.0%) |
Household Income by Mortgage Status in Crowley
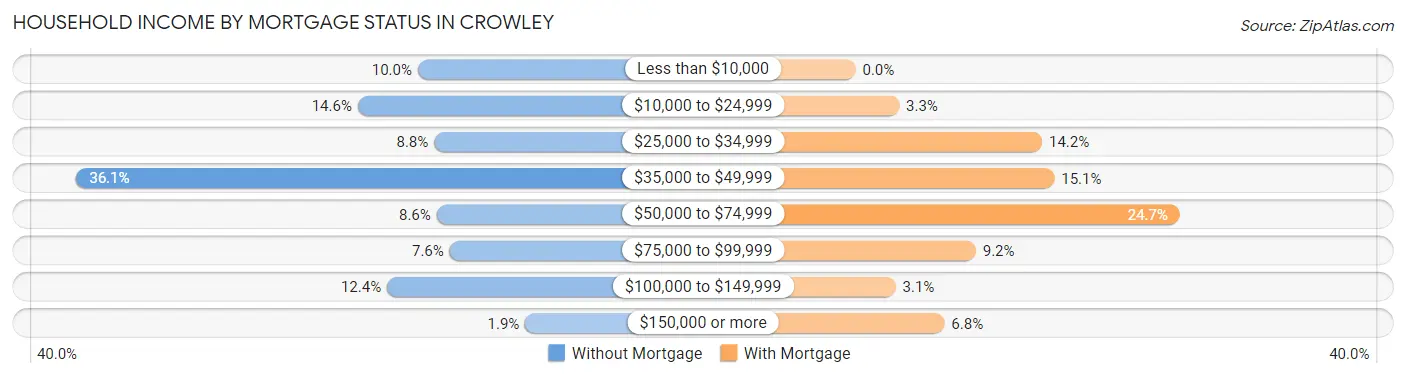
| Household Income | Without Mortgage | With Mortgage |
| Less than $10,000 | 162 (10.0%) | 0 (0.0%) |
| $10,000 to $24,999 | 236 (14.6%) | 25 (3.3%) |
| $25,000 to $34,999 | 142 (8.8%) | 107 (14.2%) |
| $35,000 to $49,999 | 582 (36.1%) | 114 (15.1%) |
| $50,000 to $74,999 | 139 (8.6%) | 186 (24.7%) |
| $75,000 to $99,999 | 123 (7.6%) | 69 (9.2%) |
| $100,000 to $149,999 | 200 (12.4%) | 23 (3.0%) |
| $150,000 or more | 30 (1.9%) | 51 (6.8%) |
| Total | 1,614 (100.0%) | 753 (100.0%) |
Property Value to Household Income Ratio in Crowley
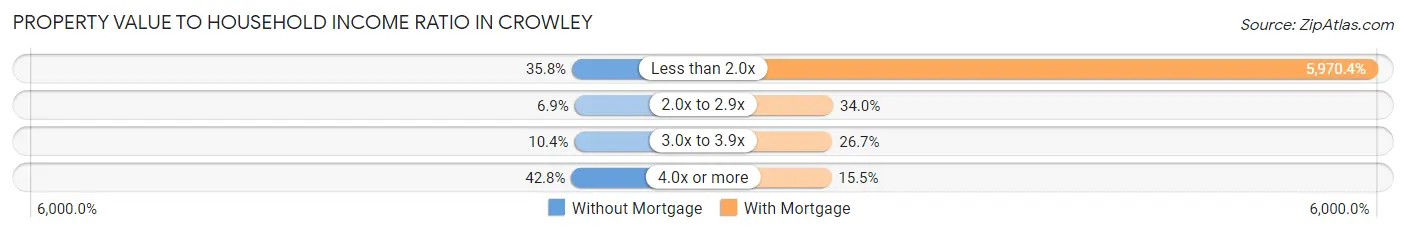
| Value-to-Income Ratio | Without Mortgage | With Mortgage |
| Less than 2.0x | 577 (35.7%) | 44,957 (5,970.4%) |
| 2.0x to 2.9x | 112 (6.9%) | 256 (34.0%) |
| 3.0x to 3.9x | 168 (10.4%) | 201 (26.7%) |
| 4.0x or more | 690 (42.7%) | 117 (15.5%) |
| Total | 1,614 (100.0%) | 753 (100.0%) |
Real Estate Taxes by Mortgage Status in Crowley
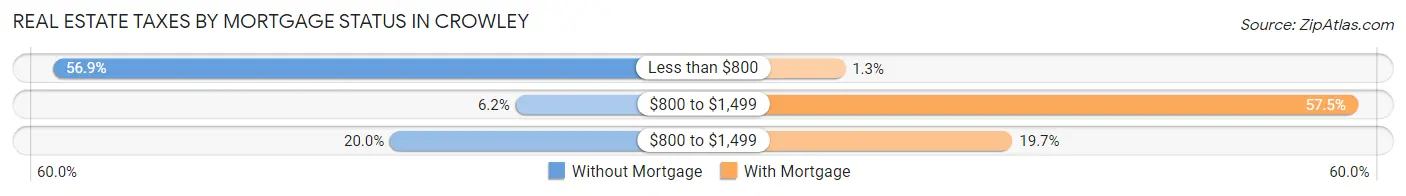
| Property Taxes | Without Mortgage | With Mortgage |
| Less than $800 | 918 (56.9%) | 10 (1.3%) |
| $800 to $1,499 | 100 (6.2%) | 433 (57.5%) |
| $800 to $1,499 | 322 (20.0%) | 148 (19.7%) |
| Total | 1,614 (100.0%) | 753 (100.0%) |
Health & Disability in Crowley
Health Insurance Coverage by Age in Crowley
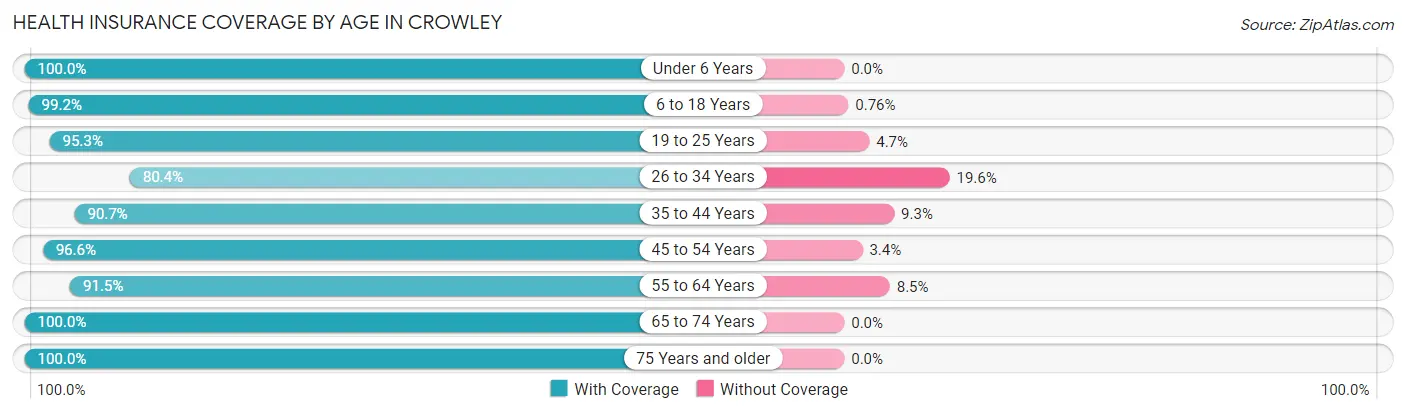
| Age Bracket | With Coverage | Without Coverage |
| Under 6 Years | 1,164 (100.0%) | 0 (0.0%) |
| 6 to 18 Years | 2,081 (99.2%) | 16 (0.8%) |
| 19 to 25 Years | 962 (95.3%) | 47 (4.7%) |
| 26 to 34 Years | 778 (80.4%) | 190 (19.6%) |
| 35 to 44 Years | 956 (90.7%) | 98 (9.3%) |
| 45 to 54 Years | 1,284 (96.6%) | 45 (3.4%) |
| 55 to 64 Years | 1,575 (91.5%) | 146 (8.5%) |
| 65 to 74 Years | 1,157 (100.0%) | 0 (0.0%) |
| 75 Years and older | 950 (100.0%) | 0 (0.0%) |
| Total | 10,907 (95.3%) | 542 (4.7%) |
Health Insurance Coverage by Citizenship Status in Crowley
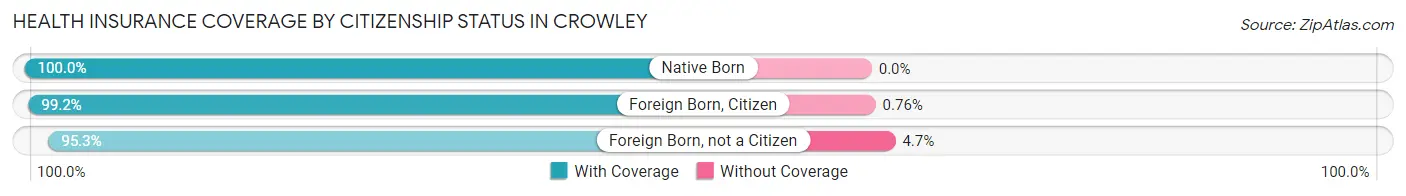
| Citizenship Status | With Coverage | Without Coverage |
| Native Born | 1,164 (100.0%) | 0 (0.0%) |
| Foreign Born, Citizen | 2,081 (99.2%) | 16 (0.8%) |
| Foreign Born, not a Citizen | 962 (95.3%) | 47 (4.7%) |
Health Insurance Coverage by Household Income in Crowley
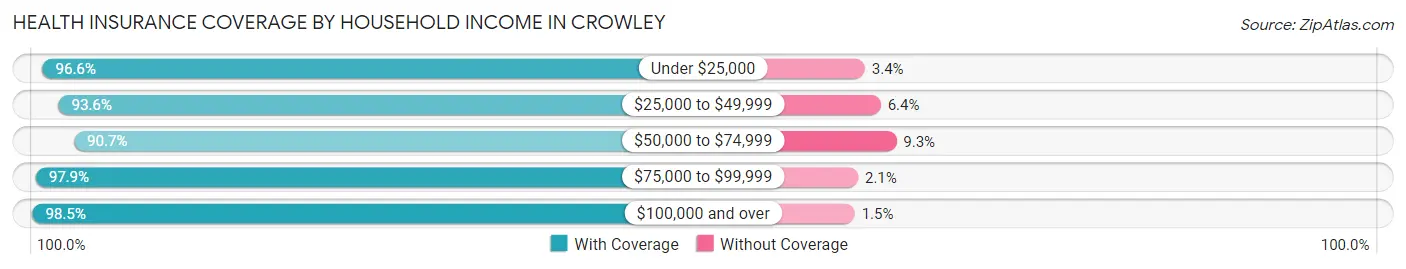
| Household Income | With Coverage | Without Coverage |
| Under $25,000 | 4,350 (96.6%) | 152 (3.4%) |
| $25,000 to $49,999 | 3,518 (93.6%) | 239 (6.4%) |
| $50,000 to $74,999 | 1,172 (90.7%) | 120 (9.3%) |
| $75,000 to $99,999 | 465 (97.9%) | 10 (2.1%) |
| $100,000 and over | 1,397 (98.5%) | 21 (1.5%) |
Public vs Private Health Insurance Coverage by Age in Crowley
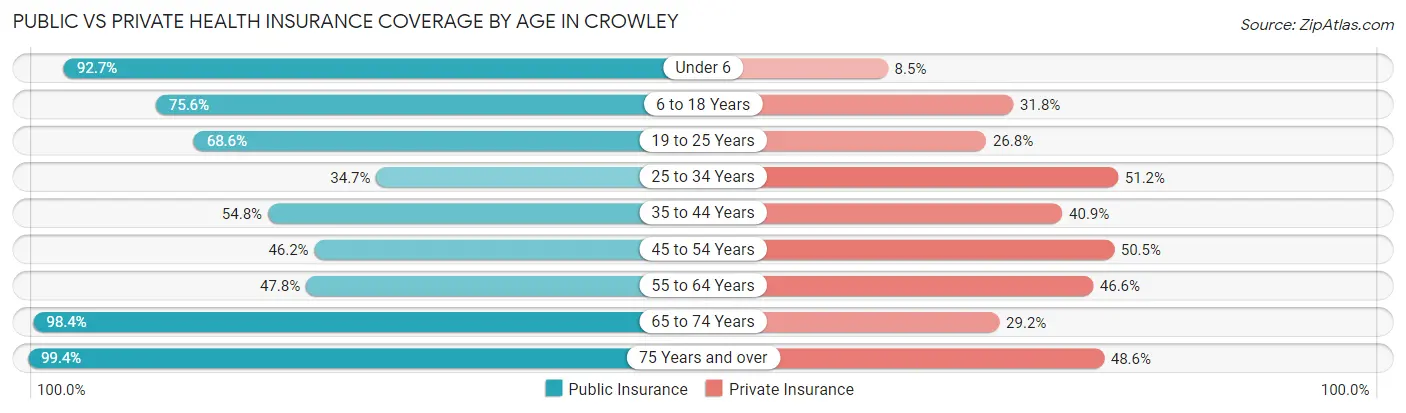
| Age Bracket | Public Insurance | Private Insurance |
| Under 6 | 1,079 (92.7%) | 99 (8.5%) |
| 6 to 18 Years | 1,586 (75.6%) | 667 (31.8%) |
| 19 to 25 Years | 692 (68.6%) | 270 (26.8%) |
| 25 to 34 Years | 336 (34.7%) | 496 (51.2%) |
| 35 to 44 Years | 578 (54.8%) | 431 (40.9%) |
| 45 to 54 Years | 614 (46.2%) | 671 (50.5%) |
| 55 to 64 Years | 822 (47.8%) | 802 (46.6%) |
| 65 to 74 Years | 1,138 (98.4%) | 338 (29.2%) |
| 75 Years and over | 944 (99.4%) | 462 (48.6%) |
| Total | 7,789 (68.0%) | 4,236 (37.0%) |
Disability Status by Sex by Age in Crowley
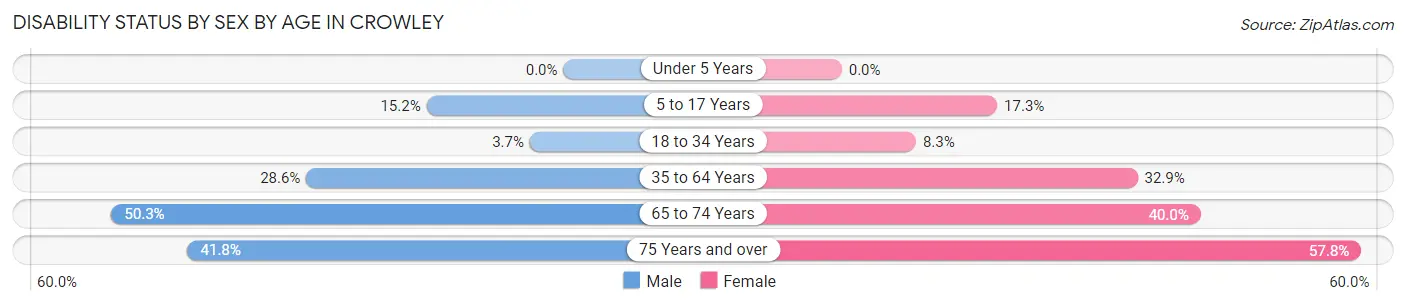
| Age Bracket | Male | Female |
| Under 5 Years | 0 (0.0%) | 0 (0.0%) |
| 5 to 17 Years | 190 (15.2%) | 160 (17.3%) |
| 18 to 34 Years | 38 (3.7%) | 89 (8.3%) |
| 35 to 64 Years | 592 (28.6%) | 671 (32.9%) |
| 65 to 74 Years | 226 (50.3%) | 283 (40.0%) |
| 75 Years and over | 200 (41.8%) | 273 (57.8%) |
Disability Class by Sex by Age in Crowley
Disability Class: Hearing Difficulty
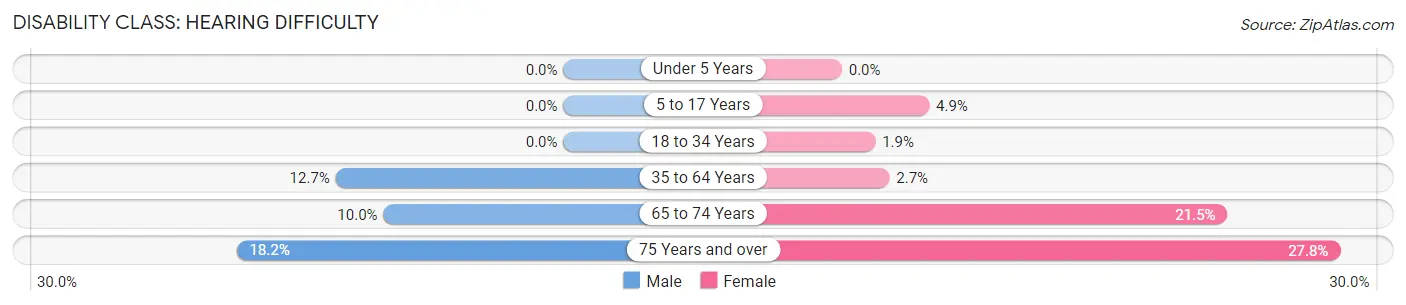
| Age Bracket | Male | Female |
| Under 5 Years | 0 (0.0%) | 0 (0.0%) |
| 5 to 17 Years | 0 (0.0%) | 45 (4.9%) |
| 18 to 34 Years | 0 (0.0%) | 20 (1.9%) |
| 35 to 64 Years | 262 (12.7%) | 54 (2.6%) |
| 65 to 74 Years | 45 (10.0%) | 152 (21.5%) |
| 75 Years and over | 87 (18.2%) | 131 (27.8%) |
Disability Class: Vision Difficulty
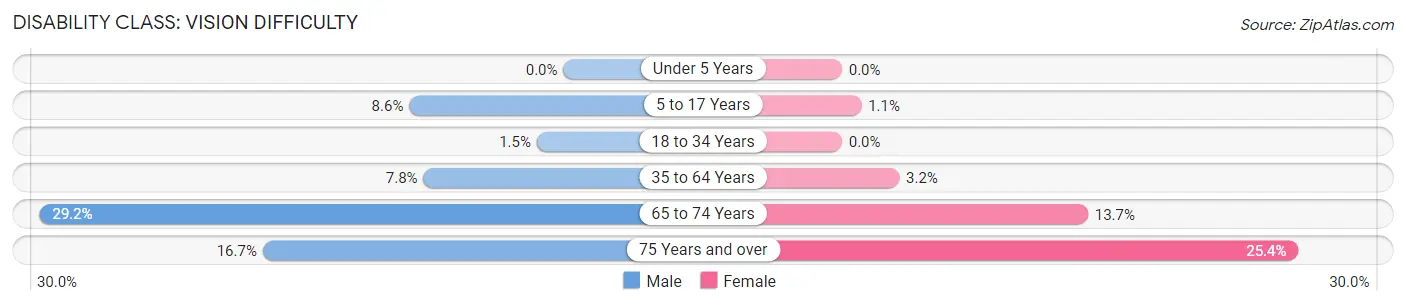
| Age Bracket | Male | Female |
| Under 5 Years | 0 (0.0%) | 0 (0.0%) |
| 5 to 17 Years | 107 (8.6%) | 10 (1.1%) |
| 18 to 34 Years | 15 (1.5%) | 0 (0.0%) |
| 35 to 64 Years | 161 (7.8%) | 65 (3.2%) |
| 65 to 74 Years | 131 (29.2%) | 97 (13.7%) |
| 75 Years and over | 80 (16.7%) | 120 (25.4%) |
Disability Class: Cognitive Difficulty
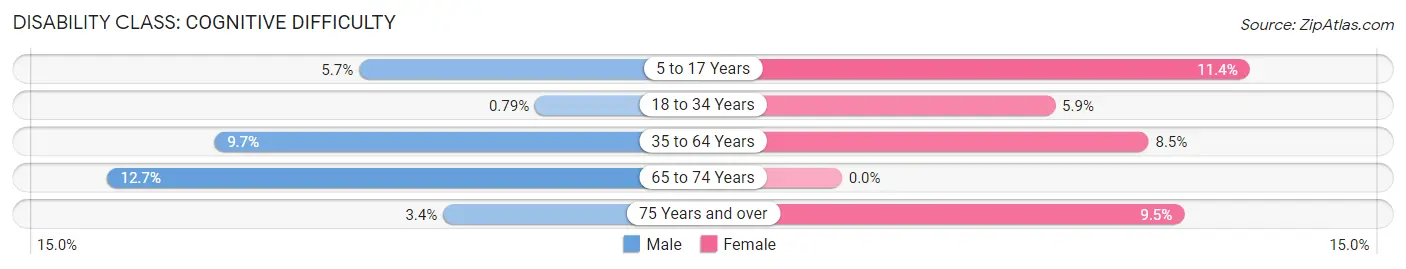
| Age Bracket | Male | Female |
| 5 to 17 Years | 71 (5.7%) | 105 (11.4%) |
| 18 to 34 Years | 8 (0.8%) | 64 (5.9%) |
| 35 to 64 Years | 201 (9.7%) | 174 (8.5%) |
| 65 to 74 Years | 57 (12.7%) | 0 (0.0%) |
| 75 Years and over | 16 (3.4%) | 45 (9.5%) |
Disability Class: Ambulatory Difficulty
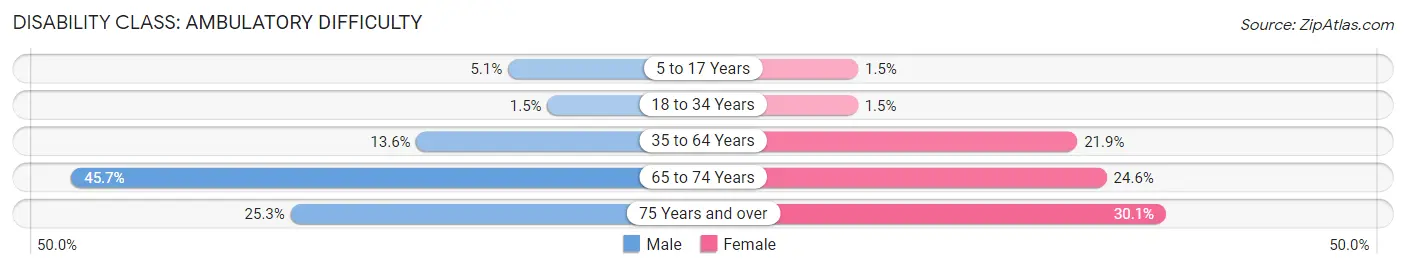
| Age Bracket | Male | Female |
| 5 to 17 Years | 64 (5.1%) | 14 (1.5%) |
| 18 to 34 Years | 15 (1.5%) | 16 (1.5%) |
| 35 to 64 Years | 282 (13.6%) | 445 (21.8%) |
| 65 to 74 Years | 205 (45.7%) | 174 (24.6%) |
| 75 Years and over | 121 (25.3%) | 142 (30.1%) |
Disability Class: Self-Care Difficulty
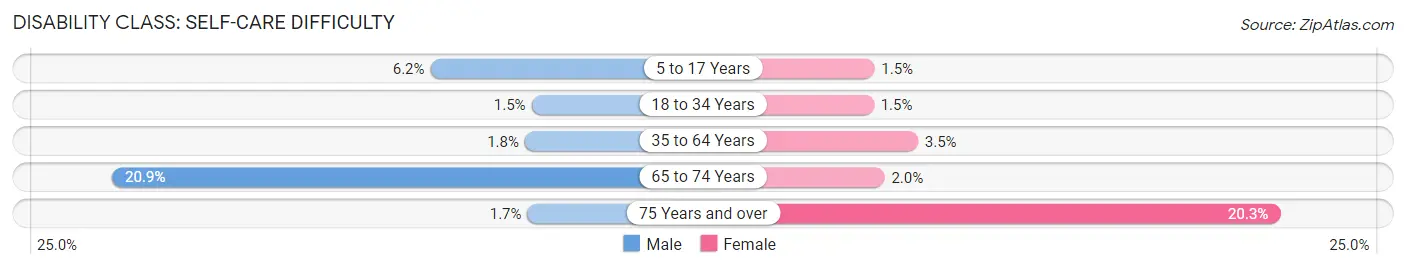
| Age Bracket | Male | Female |
| 5 to 17 Years | 77 (6.2%) | 14 (1.5%) |
| 18 to 34 Years | 15 (1.5%) | 16 (1.5%) |
| 35 to 64 Years | 37 (1.8%) | 72 (3.5%) |
| 65 to 74 Years | 94 (20.9%) | 14 (2.0%) |
| 75 Years and over | 8 (1.7%) | 96 (20.3%) |
Technology Access in Crowley
Computing Device Access in Crowley
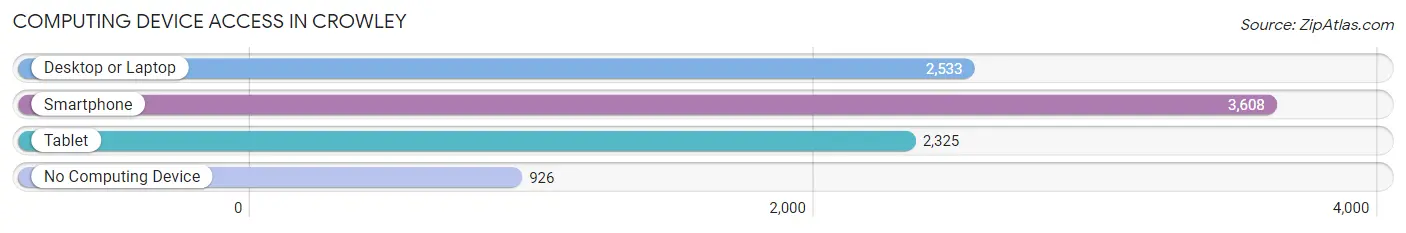
| Device Type | # Households | % Households |
| Desktop or Laptop | 2,533 | 52.1% |
| Smartphone | 3,608 | 74.2% |
| Tablet | 2,325 | 47.8% |
| No Computing Device | 926 | 19.0% |
| Total | 4,863 | 100.0% |
Internet Access in Crowley
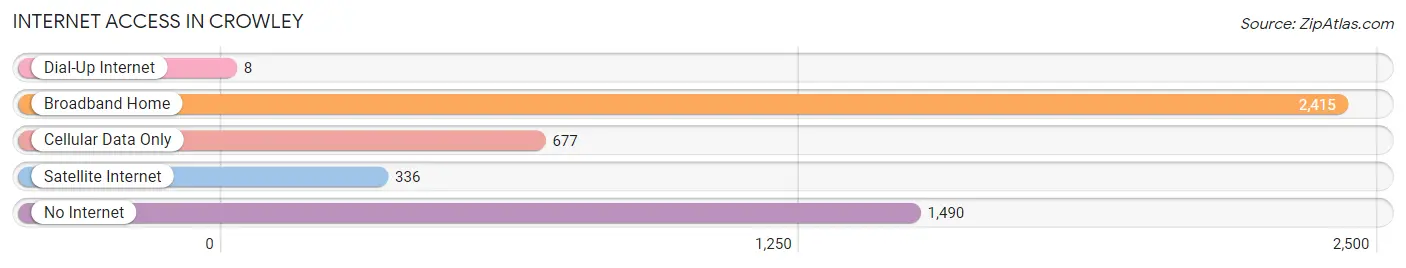
| Internet Type | # Households | % Households |
| Dial-Up Internet | 8 | 0.2% |
| Broadband Home | 2,415 | 49.7% |
| Cellular Data Only | 677 | 13.9% |
| Satellite Internet | 336 | 6.9% |
| No Internet | 1,490 | 30.6% |
| Total | 4,863 | 100.0% |
Crowley Summary
Crowley, Louisiana is a city located in Acadia Parish in the south-central region of the state. It is the parish seat and the largest city in the parish. Crowley is located about 30 miles south of Lafayette and about 60 miles west of Baton Rouge. The city has a population of 13,265 as of the 2010 census.
History
Crowley was founded in 1886 by C.C. Duson, a prominent local businessman. The city was named after Pat Crowley, a railroad official. The city was incorporated in 1887 and has since grown to become the largest city in Acadia Parish.
Geography
Crowley is located at 30°12'N 92°22'W. It is situated in the flat, low-lying coastal plain of south-central Louisiana. The city is bordered by the towns of Rayne, Church Point, and Iota. Crowley is located about 30 miles south of Lafayette and about 60 miles west of Baton Rouge.
The city has a total area of 8.2 square miles, all of which is land. Crowley is located in the humid subtropical climate zone, with hot, humid summers and mild winters. The average annual temperature is 68°F, and the average annual precipitation is 48.5 inches.
Economy
Crowley is a major agricultural center in the region. The city is home to several large rice mills, as well as a number of other agricultural-related businesses. The city is also home to several manufacturing companies, including a large paper mill and a large oil refinery.
The city is also home to several retail stores, restaurants, and other businesses. The city is served by the Crowley Municipal Airport, which provides general aviation services.
Demographics
As of the 2010 census, Crowley had a population of 13,265. The racial makeup of the city was 57.2% White, 37.3% African American, 0.5% Native American, 0.7% Asian, 0.1% Pacific Islander, 2.2% from other races, and 2.0% from two or more races. Hispanic or Latino of any race were 4.3% of the population.
The median income for a household in the city was $30,945, and the median income for a family was $37,945. The per capita income for the city was $17,845. About 19.2% of families and 22.3% of the population were below the poverty line, including 33.2% of those under age 18 and 16.2% of those age 65 or over.
Crowley is served by the Acadia Parish School District. The city is home to several public schools, including Crowley High School, Crowley Middle School, and Crowley Elementary School. The city is also home to several private schools, including Notre Dame High School and St. Michael's Catholic School.
Common Questions
What is Per Capita Income in Crowley?
Per Capita income in Crowley is $22,340.
What is the Median Family Income in Crowley?
Median Family Income in Crowley is $35,150.
What is the Median Household income in Crowley?
Median Household Income in Crowley is $28,827.
What is Income or Wage Gap in Crowley?
Income or Wage Gap in Crowley is 48.4%.
Women in Crowley earn 51.6 cents for every dollar earned by a man.
What is Family Income Deficit in Crowley?
Family Income Deficit in Crowley is $15,140.
Families that are below poverty line in Crowley earn $15,140 less on average than the poverty threshold level.
What is Inequality or Gini Index in Crowley?
Inequality or Gini Index in Crowley is 0.58.
What is the Total Population of Crowley?
Total Population of Crowley is 11,726.
What is the Total Male Population of Crowley?
Total Male Population of Crowley is 5,972.
What is the Total Female Population of Crowley?
Total Female Population of Crowley is 5,754.
What is the Ratio of Males per 100 Females in Crowley?
There are 103.79 Males per 100 Females in Crowley.
What is the Ratio of Females per 100 Males in Crowley?
There are 96.35 Females per 100 Males in Crowley.
What is the Median Population Age in Crowley?
Median Population Age in Crowley is 40.3 Years.
What is the Average Family Size in Crowley
Average Family Size in Crowley is 3.1 People.
What is the Average Household Size in Crowley
Average Household Size in Crowley is 2.4 People.
How Large is the Labor Force in Crowley?
There are 3,902 People in the Labor Forcein in Crowley.
What is the Percentage of People in the Labor Force in Crowley?
43.7% of People are in the Labor Force in Crowley.
What is the Unemployment Rate in Crowley?
Unemployment Rate in Crowley is 14.8%.