Waggaman, LA Map & Demographics
Waggaman Map
Waggaman Overview
$25,745
PER CAPITA INCOME
$48,684
AVG FAMILY INCOME
$45,286
AVG HOUSEHOLD INCOME
41.3%
WAGE / INCOME GAP [ % ]
58.7¢/ $1
WAGE / INCOME GAP [ $ ]
$9,894
FAMILY INCOME DEFICIT
0.47
INEQUALITY / GINI INDEX
10,706
TOTAL POPULATION
4,724
MALE POPULATION
5,982
FEMALE POPULATION
78.97
MALES / 100 FEMALES
126.63
FEMALES / 100 MALES
38.1
MEDIAN AGE
3.4
AVG FAMILY SIZE
2.9
AVG HOUSEHOLD SIZE
4,966
LABOR FORCE [ PEOPLE ]
58.9%
PERCENT IN LABOR FORCE
9.8%
UNEMPLOYMENT RATE
Income in Waggaman
Income Overview in Waggaman
Per Capita Income in Waggaman is $25,745, while median incomes of families and households are $48,684 and $45,286 respectively.
| Characteristic | Number | Measure |
| Per Capita Income | 10,706 | $25,745 |
| Median Family Income | 2,804 | $48,684 |
| Mean Family Income | 2,804 | $75,860 |
| Median Household Income | 3,651 | $45,286 |
| Mean Household Income | 3,651 | $69,970 |
| Income Deficit | 2,804 | $9,894 |
| Wage / Income Gap (%) | 10,706 | 41.33% |
| Wage / Income Gap ($) | 10,706 | 58.67¢ per $1 |
| Gini / Inequality Index | 10,706 | 0.47 |
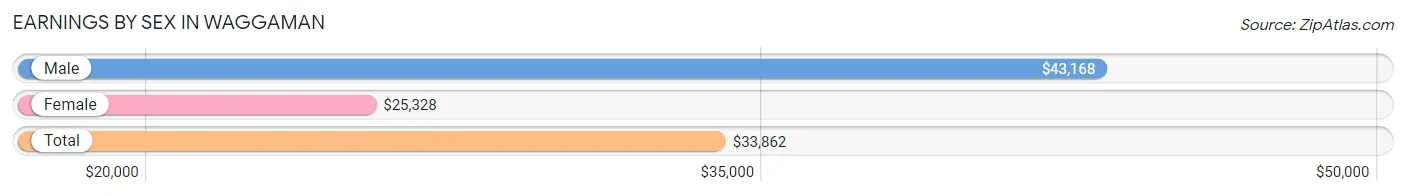
Earnings by Sex in Waggaman
Average Earnings in Waggaman are $33,862, $43,168 for men and $25,328 for women, a difference of 41.3%.
| Sex | Number | Average Earnings |
| Male | 2,162 (42.2%) | $43,168 |
| Female | 2,955 (57.8%) | $25,328 |
| Total | 5,117 (100.0%) | $33,862 |
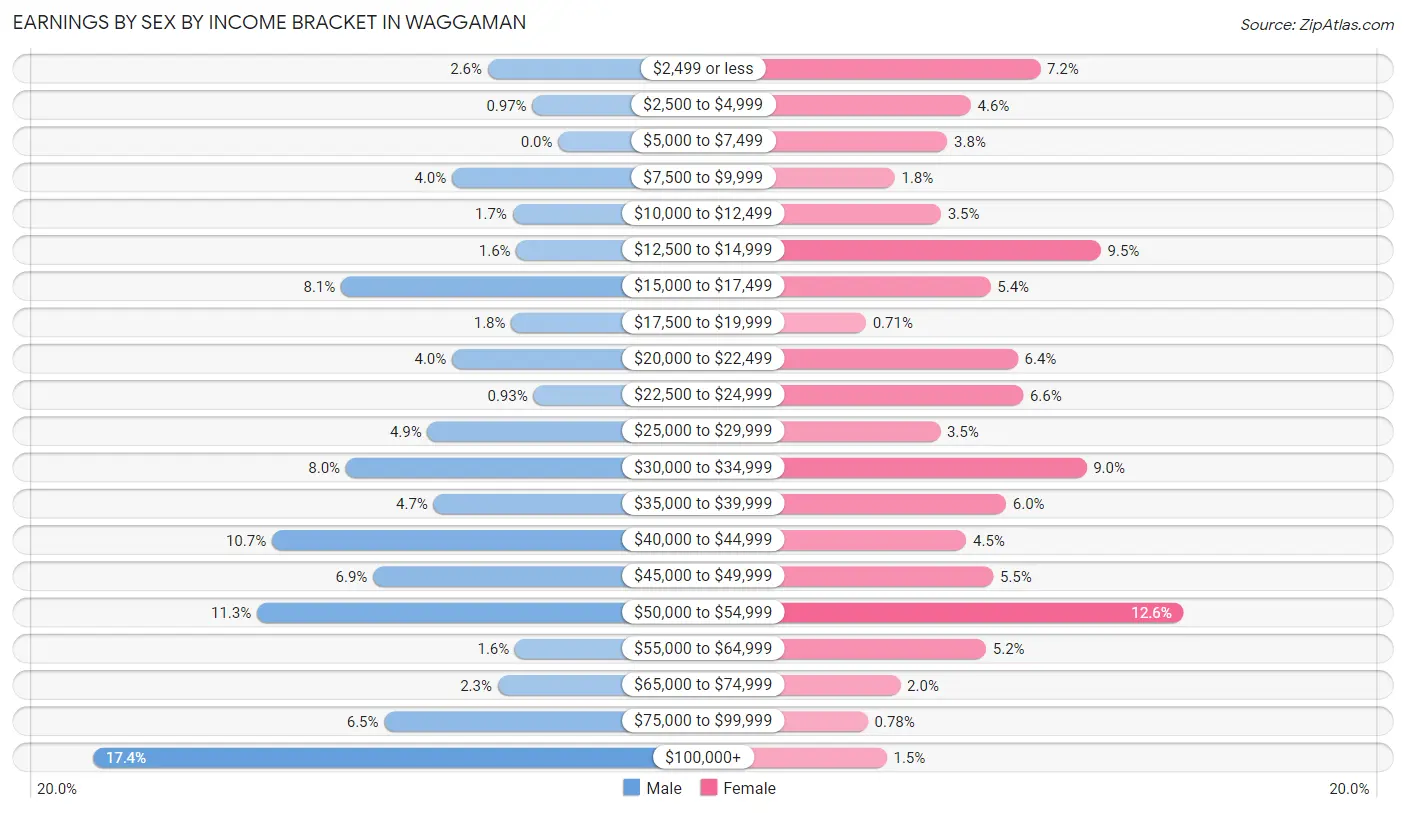
Earnings by Sex by Income Bracket in Waggaman
The most common earnings brackets in Waggaman are $100,000+ for men (377 | 17.4%) and $50,000 to $54,999 for women (373 | 12.6%).
| Income | Male | Female |
| $2,499 or less | 57 (2.6%) | 214 (7.2%) |
| $2,500 to $4,999 | 21 (1.0%) | 137 (4.6%) |
| $5,000 to $7,499 | 0 (0.0%) | 111 (3.8%) |
| $7,500 to $9,999 | 86 (4.0%) | 53 (1.8%) |
| $10,000 to $12,499 | 37 (1.7%) | 104 (3.5%) |
| $12,500 to $14,999 | 34 (1.6%) | 281 (9.5%) |
| $15,000 to $17,499 | 176 (8.1%) | 159 (5.4%) |
| $17,500 to $19,999 | 38 (1.8%) | 21 (0.7%) |
| $20,000 to $22,499 | 86 (4.0%) | 189 (6.4%) |
| $22,500 to $24,999 | 20 (0.9%) | 195 (6.6%) |
| $25,000 to $29,999 | 106 (4.9%) | 103 (3.5%) |
| $30,000 to $34,999 | 172 (8.0%) | 265 (9.0%) |
| $35,000 to $39,999 | 101 (4.7%) | 176 (6.0%) |
| $40,000 to $44,999 | 232 (10.7%) | 132 (4.5%) |
| $45,000 to $49,999 | 150 (6.9%) | 162 (5.5%) |
| $50,000 to $54,999 | 244 (11.3%) | 373 (12.6%) |
| $55,000 to $64,999 | 35 (1.6%) | 154 (5.2%) |
| $65,000 to $74,999 | 49 (2.3%) | 59 (2.0%) |
| $75,000 to $99,999 | 141 (6.5%) | 23 (0.8%) |
| $100,000+ | 377 (17.4%) | 44 (1.5%) |
| Total | 2,162 (100.0%) | 2,955 (100.0%) |
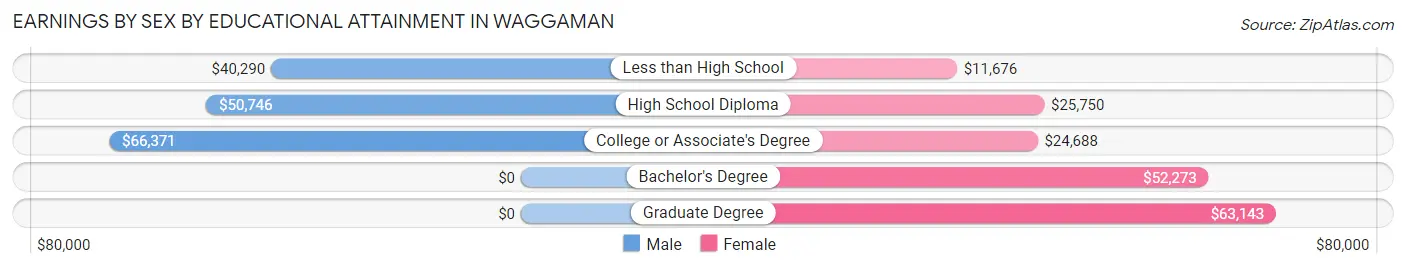
Earnings by Sex by Educational Attainment in Waggaman
Average earnings in Waggaman are $46,667 for men and $26,044 for women, a difference of 44.2%. Men with an educational attainment of college or associate's degree enjoy the highest average annual earnings of $66,371, while those with less than high school education earn the least with $40,290. Women with an educational attainment of graduate degree earn the most with the average annual earnings of $63,143, while those with less than high school education have the smallest earnings of $11,676.
| Educational Attainment | Male Income | Female Income |
| Less than High School | $40,290 | $11,676 |
| High School Diploma | $50,746 | $25,750 |
| College or Associate's Degree | $66,371 | $24,688 |
| Bachelor's Degree | - | - |
| Graduate Degree | - | - |
| Total | $46,667 | $26,044 |
Family Income in Waggaman
Family Income Brackets in Waggaman
According to the Waggaman family income data, there are 544 families falling into the $75,000 to $99,999 income range, which is the most common income bracket and makes up 19.4% of all families. Conversely, the $10,000 to $14,999 income bracket is the least frequent group with only 163 families (5.8%) belonging to this category.
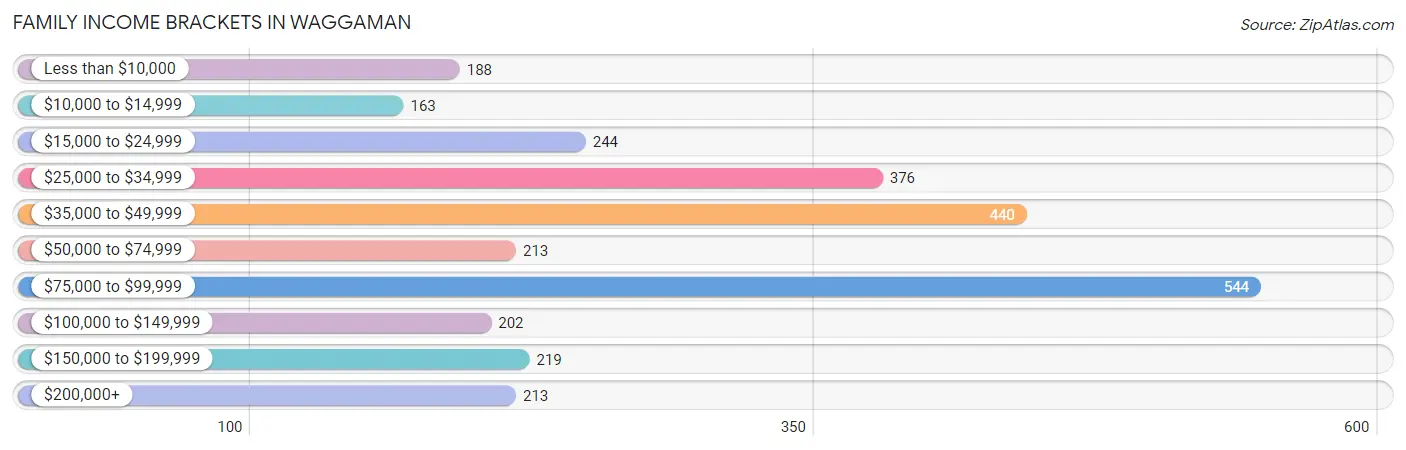
| Income Bracket | # Families | % Families |
| Less than $10,000 | 188 | 6.7% |
| $10,000 to $14,999 | 163 | 5.8% |
| $15,000 to $24,999 | 244 | 8.7% |
| $25,000 to $34,999 | 376 | 13.4% |
| $35,000 to $49,999 | 440 | 15.7% |
| $50,000 to $74,999 | 213 | 7.6% |
| $75,000 to $99,999 | 544 | 19.4% |
| $100,000 to $149,999 | 202 | 7.2% |
| $150,000 to $199,999 | 219 | 7.8% |
| $200,000+ | 213 | 7.6% |
Family Income by Famaliy Size in Waggaman
3-person families (663 | 23.6%) account for the highest median family income in Waggaman with $120,417 per family, while 3-person families (663 | 23.6%) have the highest median income of $40,139 per family member.
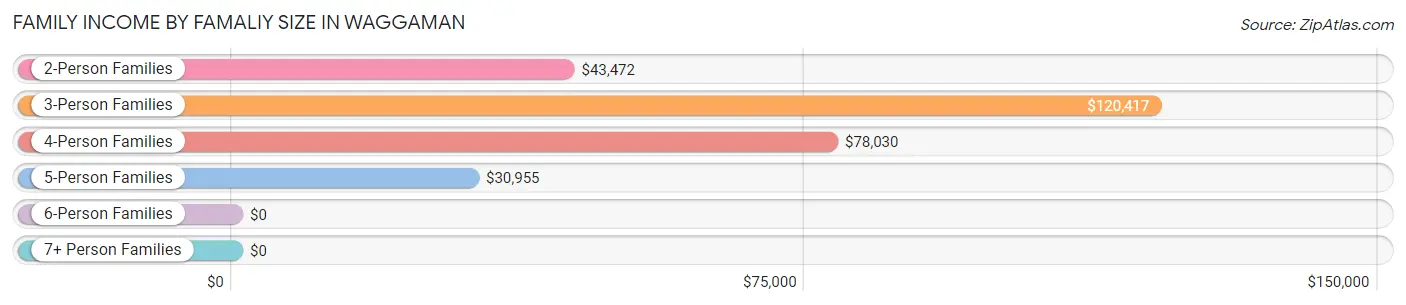
| Income Bracket | # Families | Median Income |
| 2-Person Families | 1,104 (39.4%) | $43,472 |
| 3-Person Families | 663 (23.6%) | $120,417 |
| 4-Person Families | 490 (17.5%) | $78,030 |
| 5-Person Families | 486 (17.3%) | $30,955 |
| 6-Person Families | 35 (1.3%) | $0 |
| 7+ Person Families | 26 (0.9%) | $0 |
| Total | 2,804 (100.0%) | $48,684 |
Family Income by Number of Earners in Waggaman
The median family income in Waggaman is $48,684, with families comprising 3+ earners (376) having the highest median family income of $185,453, while families with no earners (574) have the lowest median family income of $25,844, accounting for 13.4% and 20.5% of families, respectively.
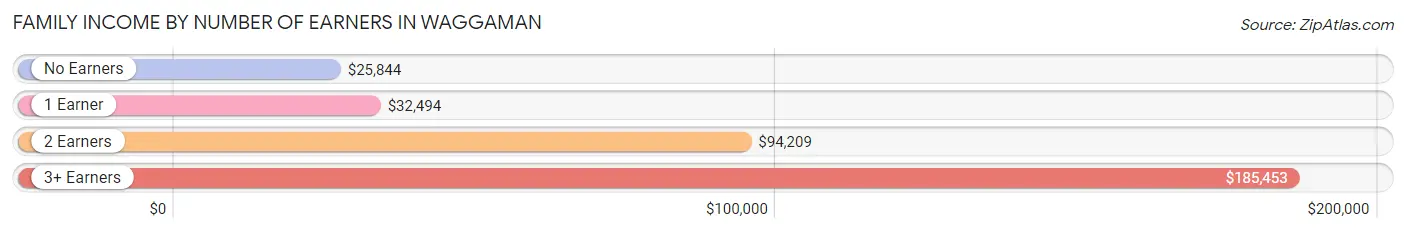
| Number of Earners | # Families | Median Income |
| No Earners | 574 (20.5%) | $25,844 |
| 1 Earner | 1,103 (39.3%) | $32,494 |
| 2 Earners | 751 (26.8%) | $94,209 |
| 3+ Earners | 376 (13.4%) | $185,453 |
| Total | 2,804 (100.0%) | $48,684 |
Household Income in Waggaman
Household Income Brackets in Waggaman
With 621 households falling in the category, the $35,000 to $49,999 income range is the most frequent in Waggaman, accounting for 17.0% of all households. In contrast, only 212 households (5.8%) fall into the $200,000+ income bracket, making it the least populous group.
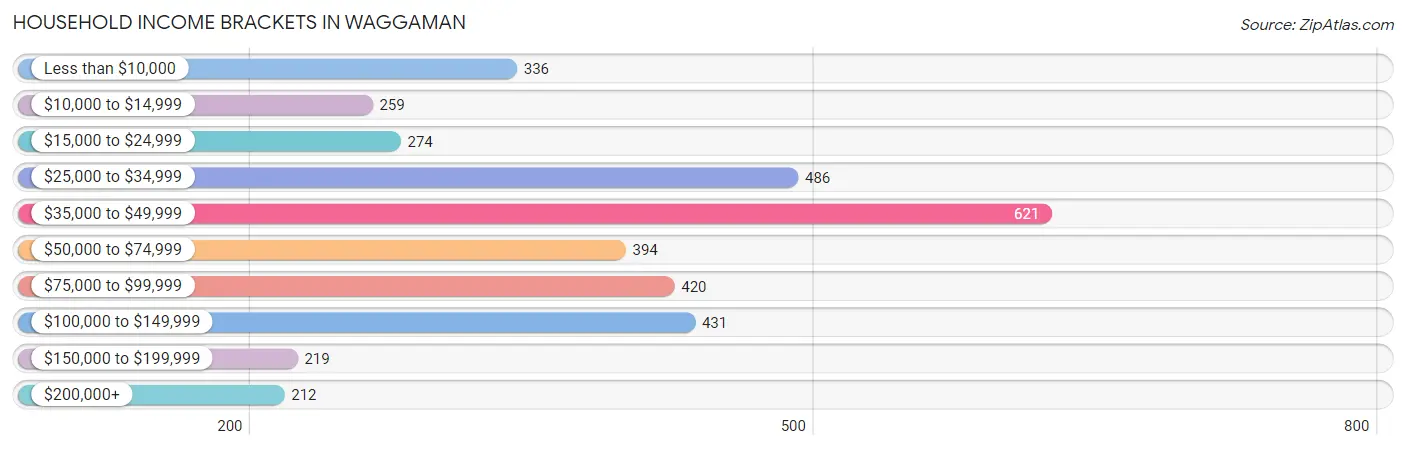
| Income Bracket | # Households | % Households |
| Less than $10,000 | 336 | 9.2% |
| $10,000 to $14,999 | 259 | 7.1% |
| $15,000 to $24,999 | 274 | 7.5% |
| $25,000 to $34,999 | 486 | 13.3% |
| $35,000 to $49,999 | 621 | 17.0% |
| $50,000 to $74,999 | 394 | 10.8% |
| $75,000 to $99,999 | 420 | 11.5% |
| $100,000 to $149,999 | 431 | 11.8% |
| $150,000 to $199,999 | 219 | 6.0% |
| $200,000+ | 212 | 5.8% |
Household Income by Householder Age in Waggaman
The median household income in Waggaman is $45,286, with the highest median household income of $76,061 found in the 45 to 64 years age bracket for the primary householder. A total of 1,757 households (48.1%) fall into this category. Meanwhile, the 15 to 24 years age bracket for the primary householder has the lowest median household income of $0, with 37 households (1.0%) in this group.
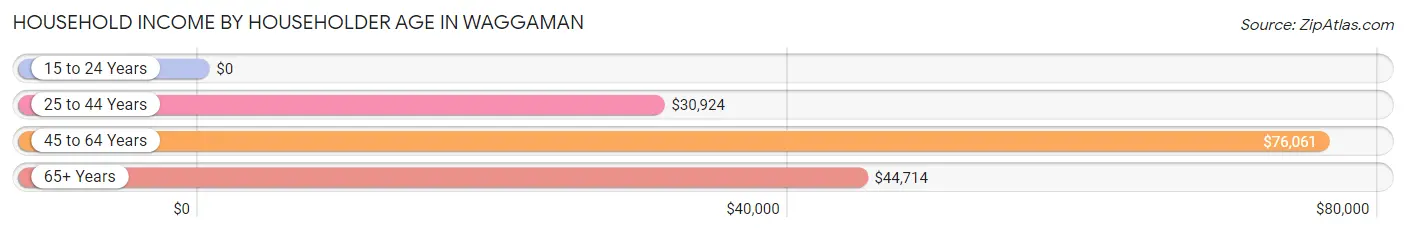
| Income Bracket | # Households | Median Income |
| 15 to 24 Years | 37 (1.0%) | $0 |
| 25 to 44 Years | 872 (23.9%) | $30,924 |
| 45 to 64 Years | 1,757 (48.1%) | $76,061 |
| 65+ Years | 985 (27.0%) | $44,714 |
| Total | 3,651 (100.0%) | $45,286 |
Poverty in Waggaman
Income Below Poverty by Sex and Age in Waggaman
With 21.1% poverty level for males and 31.9% for females among the residents of Waggaman, 5 year old males and 5 year old females are the most vulnerable to poverty, with 81 males (100.0%) and 55 females (100.0%) in their respective age groups living below the poverty level.
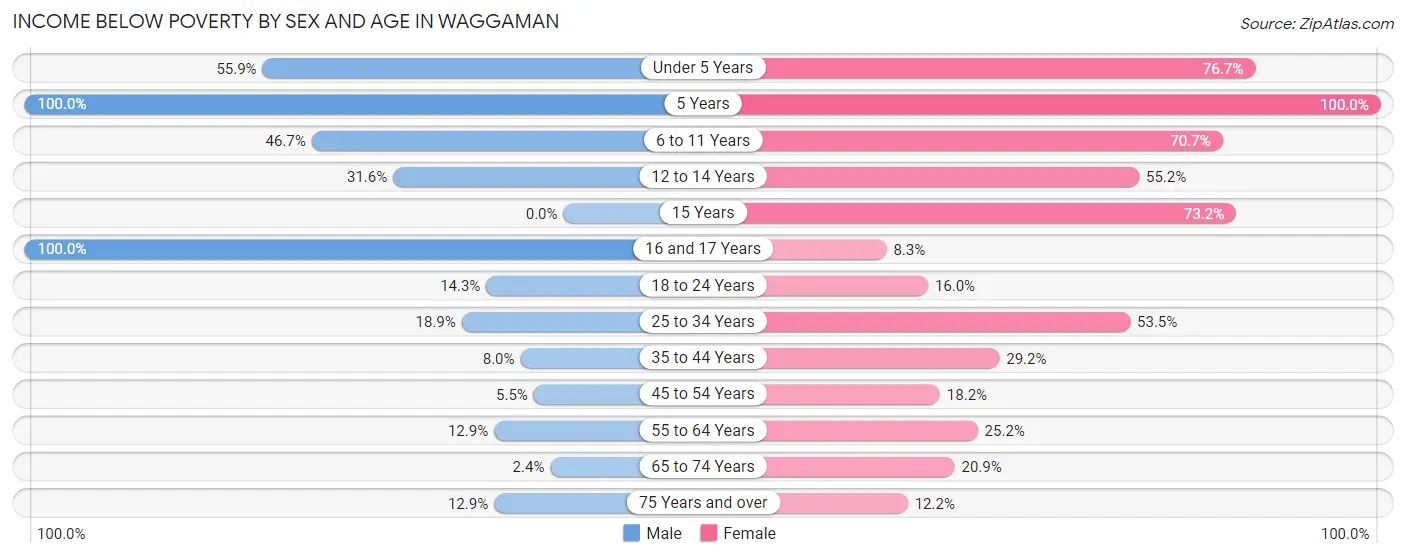
| Age Bracket | Male | Female |
| Under 5 Years | 148 (55.8%) | 112 (76.7%) |
| 5 Years | 81 (100.0%) | 55 (100.0%) |
| 6 to 11 Years | 179 (46.7%) | 378 (70.7%) |
| 12 to 14 Years | 141 (31.6%) | 80 (55.2%) |
| 15 Years | 0 (0.0%) | 131 (73.2%) |
| 16 and 17 Years | 64 (100.0%) | 34 (8.3%) |
| 18 to 24 Years | 61 (14.3%) | 141 (16.0%) |
| 25 to 34 Years | 100 (18.9%) | 350 (53.5%) |
| 35 to 44 Years | 26 (8.0%) | 119 (29.2%) |
| 45 to 54 Years | 28 (5.5%) | 197 (18.2%) |
| 55 to 64 Years | 114 (12.9%) | 143 (25.2%) |
| 65 to 74 Years | 11 (2.4%) | 131 (20.9%) |
| 75 Years and over | 42 (12.9%) | 35 (12.2%) |
| Total | 995 (21.1%) | 1,906 (31.9%) |
Income Above Poverty by Sex and Age in Waggaman
According to the poverty statistics in Waggaman, males aged 15 years and females aged 16 and 17 years are the age groups that are most secure financially, with 100.0% of males and 91.7% of females in these age groups living above the poverty line.
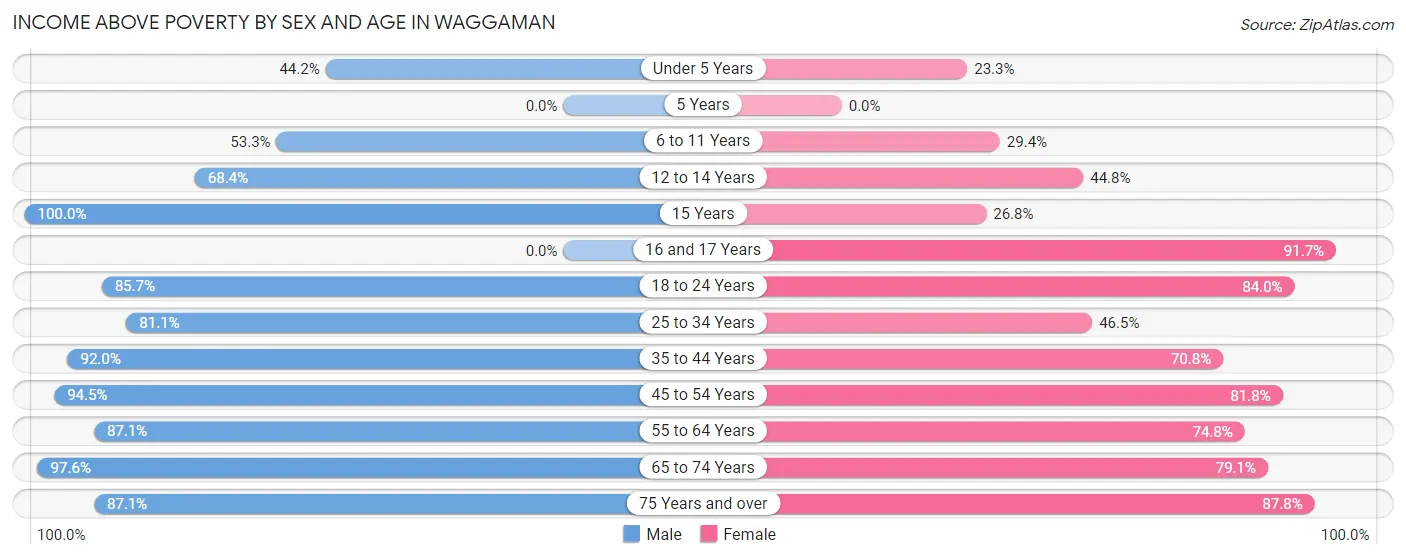
| Age Bracket | Male | Female |
| Under 5 Years | 117 (44.2%) | 34 (23.3%) |
| 5 Years | 0 (0.0%) | 0 (0.0%) |
| 6 to 11 Years | 204 (53.3%) | 157 (29.3%) |
| 12 to 14 Years | 305 (68.4%) | 65 (44.8%) |
| 15 Years | 31 (100.0%) | 48 (26.8%) |
| 16 and 17 Years | 0 (0.0%) | 376 (91.7%) |
| 18 to 24 Years | 365 (85.7%) | 741 (84.0%) |
| 25 to 34 Years | 429 (81.1%) | 304 (46.5%) |
| 35 to 44 Years | 300 (92.0%) | 288 (70.8%) |
| 45 to 54 Years | 481 (94.5%) | 885 (81.8%) |
| 55 to 64 Years | 771 (87.1%) | 424 (74.8%) |
| 65 to 74 Years | 442 (97.6%) | 495 (79.1%) |
| 75 Years and over | 284 (87.1%) | 251 (87.8%) |
| Total | 3,729 (78.9%) | 4,068 (68.1%) |
Income Below Poverty Among Married-Couple Families in Waggaman
The poverty statistics for married-couple families in Waggaman show that 9.9% or 137 of the total 1,384 families live below the poverty line. Families with no children have the highest poverty rate of 11.3%, comprising of 121 families. On the other hand, families with 3 or 4 children have the lowest poverty rate of 0.0%, which includes 0 families.
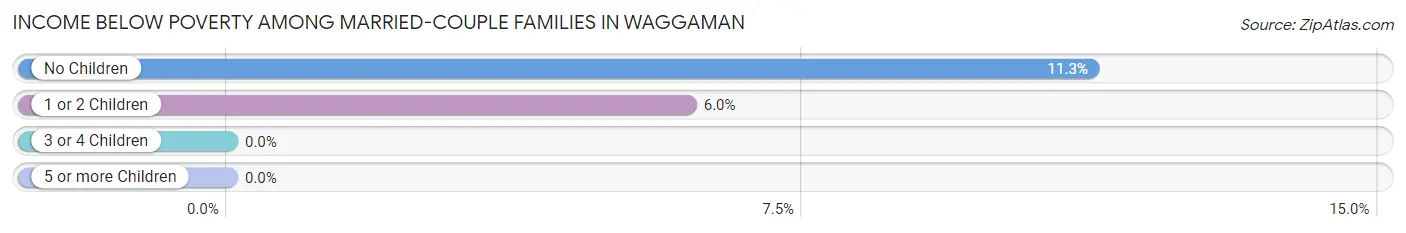
| Children | Above Poverty | Below Poverty |
| No Children | 955 (88.7%) | 121 (11.3%) |
| 1 or 2 Children | 251 (94.0%) | 16 (6.0%) |
| 3 or 4 Children | 15 (100.0%) | 0 (0.0%) |
| 5 or more Children | 26 (100.0%) | 0 (0.0%) |
| Total | 1,247 (90.1%) | 137 (9.9%) |
Income Below Poverty Among Single-Parent Households in Waggaman
According to the poverty data in Waggaman, 53.4% or 101 single-father households and 42.8% or 527 single-mother households are living below the poverty line. Among single-father households, those with 3 or 4 children have the highest poverty rate, with 63 households (100.0%) experiencing poverty. Likewise, among single-mother households, those with 3 or 4 children have the highest poverty rate, with 342 households (100.0%) falling below the poverty line.
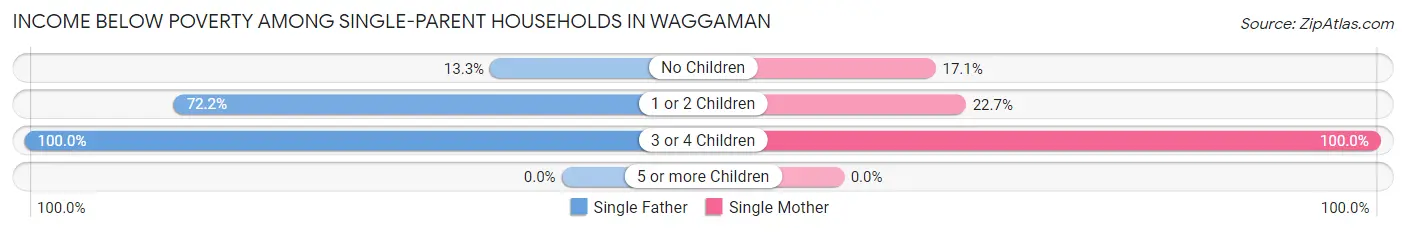
| Children | Single Father | Single Mother |
| No Children | 12 (13.3%) | 52 (17.1%) |
| 1 or 2 Children | 26 (72.2%) | 133 (22.7%) |
| 3 or 4 Children | 63 (100.0%) | 342 (100.0%) |
| 5 or more Children | 0 (0.0%) | 0 (0.0%) |
| Total | 101 (53.4%) | 527 (42.8%) |
Income Below Poverty Among Married-Couple vs Single-Parent Households in Waggaman
The poverty data for Waggaman shows that 137 of the married-couple family households (9.9%) and 628 of the single-parent households (44.2%) are living below the poverty level. Within the married-couple family households, those with no children have the highest poverty rate, with 121 households (11.3%) falling below the poverty line. Among the single-parent households, those with 3 or 4 children have the highest poverty rate, with 405 household (100.0%) living below poverty.
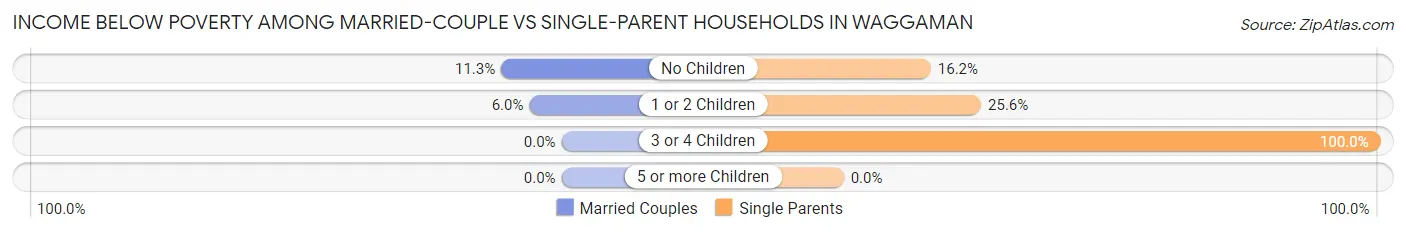
| Children | Married-Couple Families | Single-Parent Households |
| No Children | 121 (11.3%) | 64 (16.2%) |
| 1 or 2 Children | 16 (6.0%) | 159 (25.6%) |
| 3 or 4 Children | 0 (0.0%) | 405 (100.0%) |
| 5 or more Children | 0 (0.0%) | 0 (0.0%) |
| Total | 137 (9.9%) | 628 (44.2%) |
Race in Waggaman
The most populous races in Waggaman are Black / African American (7,608 | 71.1%), White / Caucasian (2,449 | 22.9%), and Hispanic or Latino (721 | 6.7%).
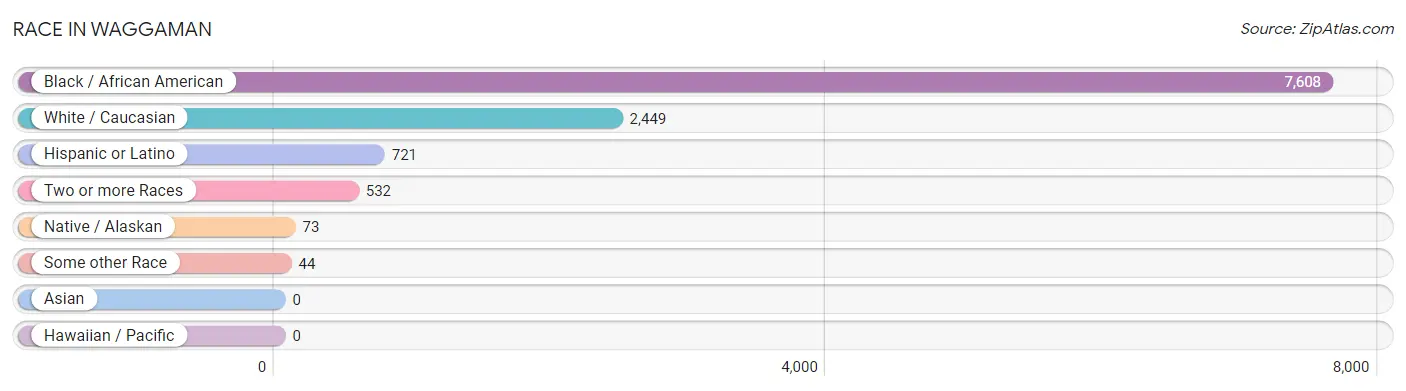
| Race | # Population | % Population |
| Asian | 0 | 0.0% |
| Black / African American | 7,608 | 71.1% |
| Hawaiian / Pacific | 0 | 0.0% |
| Hispanic or Latino | 721 | 6.7% |
| Native / Alaskan | 73 | 0.7% |
| White / Caucasian | 2,449 | 22.9% |
| Two or more Races | 532 | 5.0% |
| Some other Race | 44 | 0.4% |
| Total | 10,706 | 100.0% |
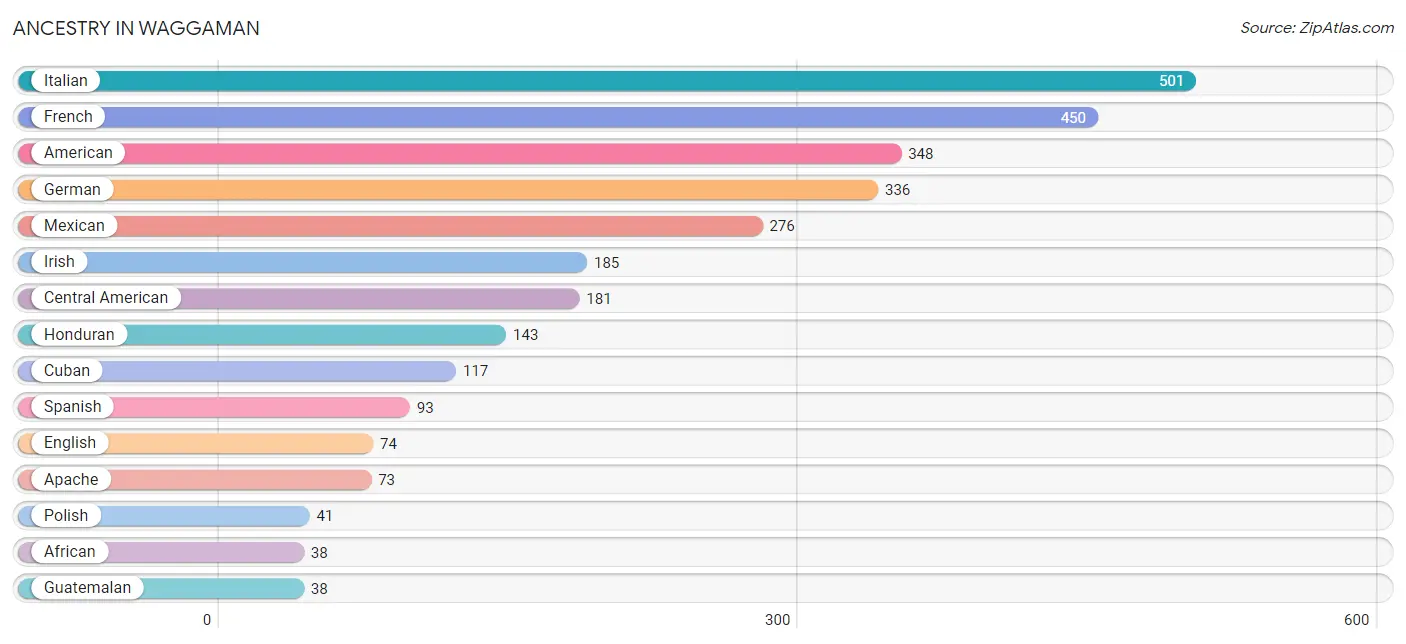
Ancestry in Waggaman
The most populous ancestries reported in Waggaman are Italian (501 | 4.7%), French (450 | 4.2%), American (348 | 3.3%), German (336 | 3.1%), and Mexican (276 | 2.6%), together accounting for 17.8% of all Waggaman residents.
| Ancestry | # Population | % Population |
| African | 38 | 0.4% |
| American | 348 | 3.3% |
| Apache | 73 | 0.7% |
| Cajun | 15 | 0.1% |
| Central American | 181 | 1.7% |
| Cuban | 117 | 1.1% |
| Danish | 22 | 0.2% |
| English | 74 | 0.7% |
| French | 450 | 4.2% |
| German | 336 | 3.1% |
| Guatemalan | 38 | 0.4% |
| Honduran | 143 | 1.3% |
| Irish | 185 | 1.7% |
| Italian | 501 | 4.7% |
| Lithuanian | 20 | 0.2% |
| Mexican | 276 | 2.6% |
| Polish | 41 | 0.4% |
| Puerto Rican | 35 | 0.3% |
| Scotch-Irish | 21 | 0.2% |
| Spanish | 93 | 0.9% |
| Subsaharan African | 38 | 0.4% | View All 21 Rows |
Immigrants in Waggaman
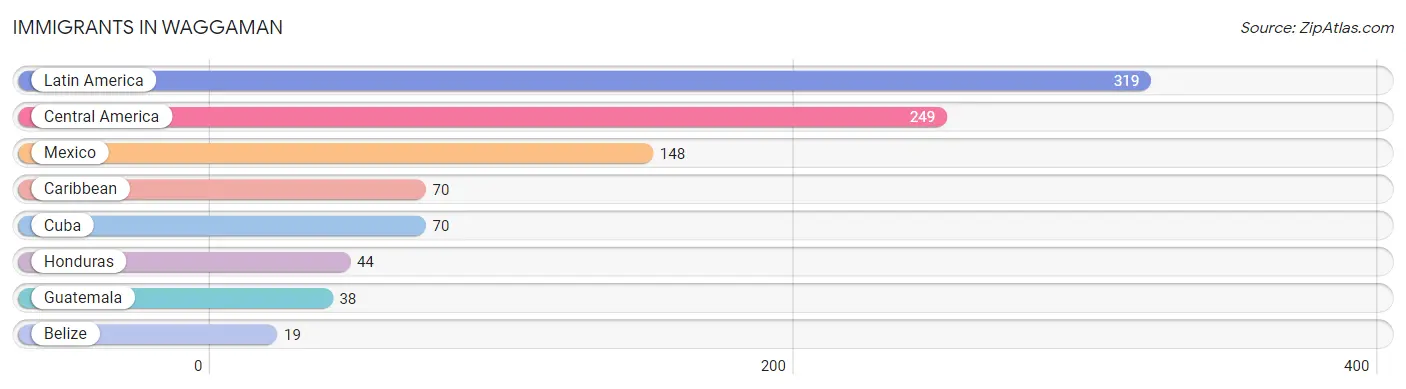
The most numerous immigrant groups reported in Waggaman came from Latin America (319 | 3.0%), Central America (249 | 2.3%), Mexico (148 | 1.4%), Caribbean (70 | 0.6%), and Cuba (70 | 0.6%), together accounting for 8.0% of all Waggaman residents.
| Immigration Origin | # Population | % Population |
| Belize | 19 | 0.2% |
| Caribbean | 70 | 0.6% |
| Central America | 249 | 2.3% |
| Cuba | 70 | 0.6% |
| Guatemala | 38 | 0.4% |
| Honduras | 44 | 0.4% |
| Latin America | 319 | 3.0% |
| Mexico | 148 | 1.4% | View All 8 Rows |
Sex and Age in Waggaman
Sex and Age in Waggaman
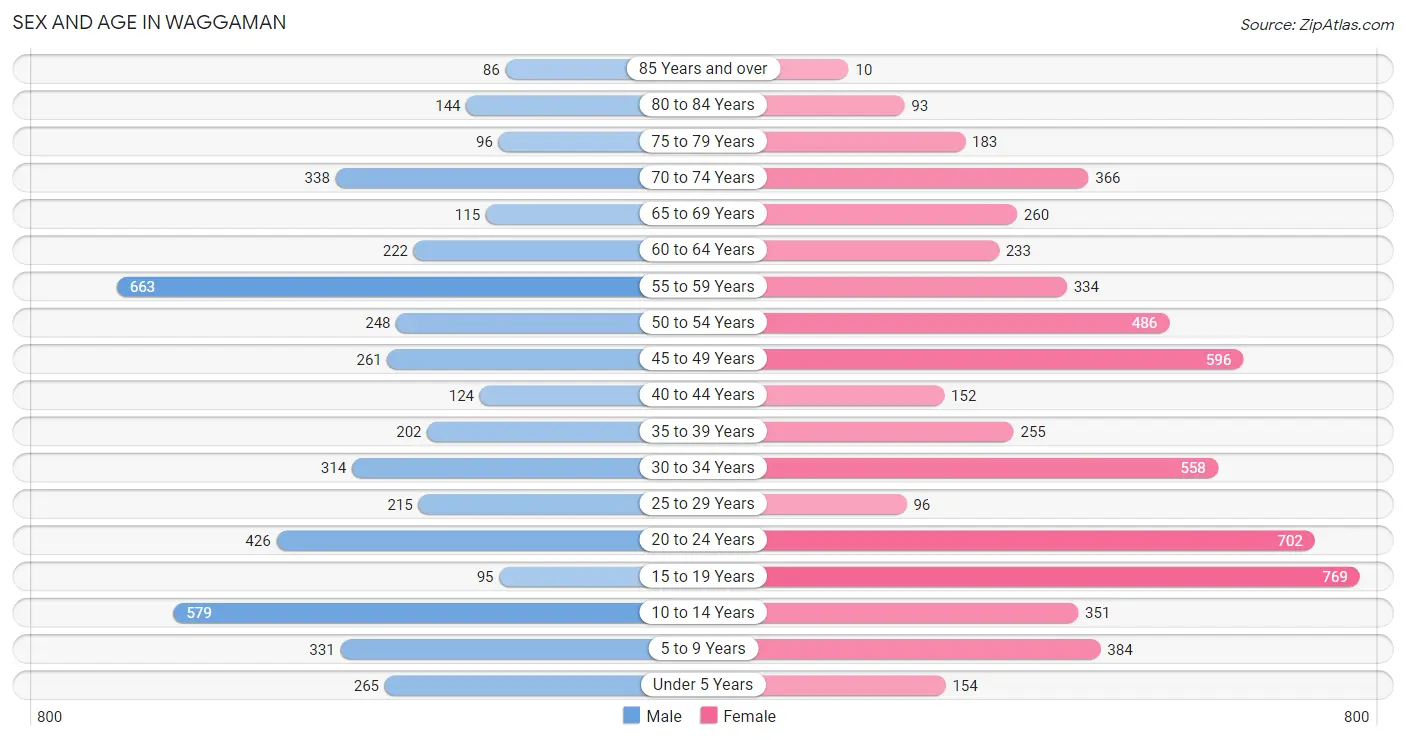
The most populous age groups in Waggaman are 55 to 59 Years (663 | 14.0%) for men and 15 to 19 Years (769 | 12.9%) for women.
| Age Bracket | Male | Female |
| Under 5 Years | 265 (5.6%) | 154 (2.6%) |
| 5 to 9 Years | 331 (7.0%) | 384 (6.4%) |
| 10 to 14 Years | 579 (12.3%) | 351 (5.9%) |
| 15 to 19 Years | 95 (2.0%) | 769 (12.9%) |
| 20 to 24 Years | 426 (9.0%) | 702 (11.7%) |
| 25 to 29 Years | 215 (4.5%) | 96 (1.6%) |
| 30 to 34 Years | 314 (6.7%) | 558 (9.3%) |
| 35 to 39 Years | 202 (4.3%) | 255 (4.3%) |
| 40 to 44 Years | 124 (2.6%) | 152 (2.5%) |
| 45 to 49 Years | 261 (5.5%) | 596 (10.0%) |
| 50 to 54 Years | 248 (5.2%) | 486 (8.1%) |
| 55 to 59 Years | 663 (14.0%) | 334 (5.6%) |
| 60 to 64 Years | 222 (4.7%) | 233 (3.9%) |
| 65 to 69 Years | 115 (2.4%) | 260 (4.3%) |
| 70 to 74 Years | 338 (7.1%) | 366 (6.1%) |
| 75 to 79 Years | 96 (2.0%) | 183 (3.1%) |
| 80 to 84 Years | 144 (3.0%) | 93 (1.5%) |
| 85 Years and over | 86 (1.8%) | 10 (0.2%) |
| Total | 4,724 (100.0%) | 5,982 (100.0%) |
Families and Households in Waggaman
Median Family Size in Waggaman
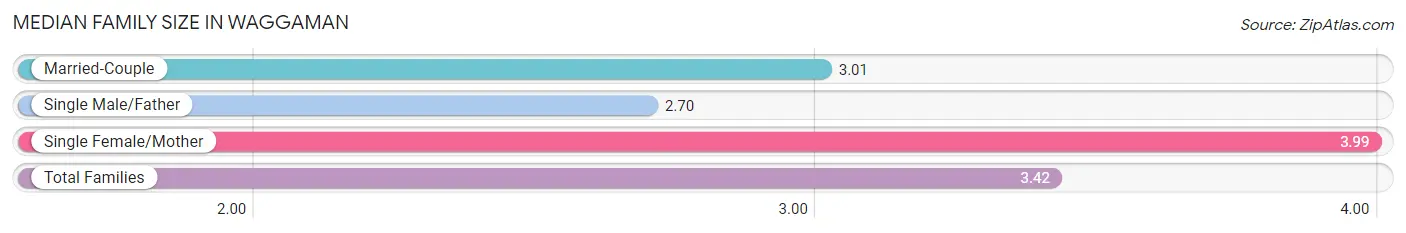
The median family size in Waggaman is 3.42 persons per family, with single female/mother families (1,231 | 43.9%) accounting for the largest median family size of 3.99 persons per family. On the other hand, single male/father families (189 | 6.7%) represent the smallest median family size with 2.70 persons per family.
| Family Type | # Families | Family Size |
| Married-Couple | 1,384 (49.4%) | 3.01 |
| Single Male/Father | 189 (6.7%) | 2.70 |
| Single Female/Mother | 1,231 (43.9%) | 3.99 |
| Total Families | 2,804 (100.0%) | 3.42 |
Median Household Size in Waggaman
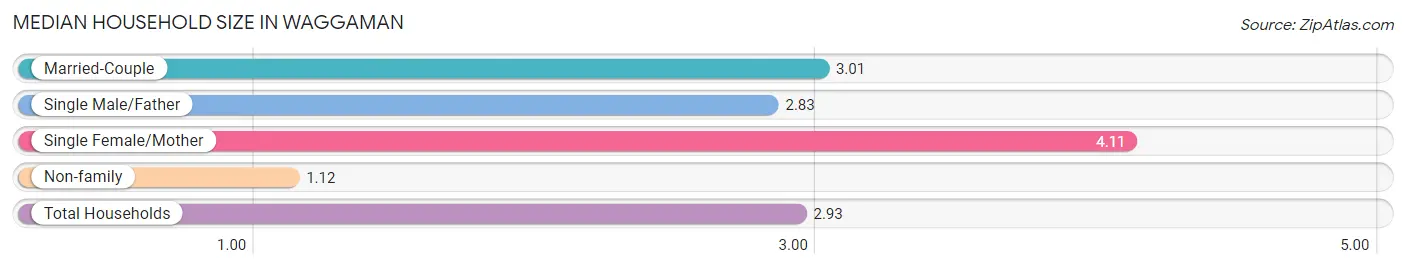
The median household size in Waggaman is 2.93 persons per household, with single female/mother households (1,231 | 33.7%) accounting for the largest median household size of 4.11 persons per household. non-family households (847 | 23.2%) represent the smallest median household size with 1.12 persons per household.
| Household Type | # Households | Household Size |
| Married-Couple | 1,384 (37.9%) | 3.01 |
| Single Male/Father | 189 (5.2%) | 2.83 |
| Single Female/Mother | 1,231 (33.7%) | 4.11 |
| Non-family | 847 (23.2%) | 1.12 |
| Total Households | 3,651 (100.0%) | 2.93 |
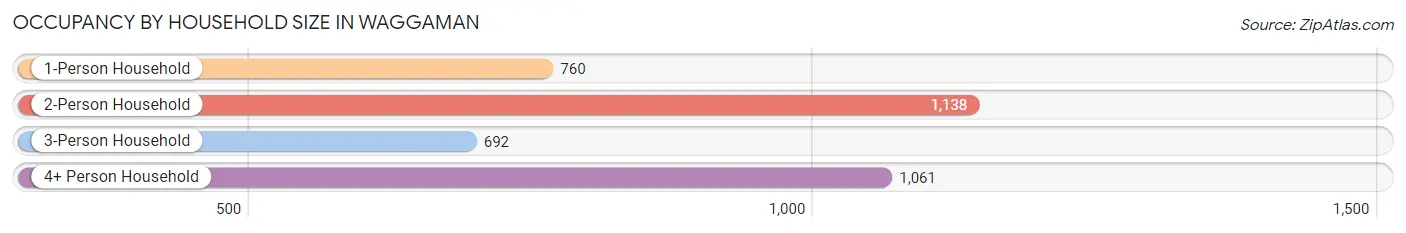
Household Size by Marriage Status in Waggaman
Out of a total of 3,651 households in Waggaman, 2,804 (76.8%) are family households, while 847 (23.2%) are nonfamily households. The most numerous type of family households are 2-person households, comprising 1,061, and the most common type of nonfamily households are 1-person households, comprising 760.
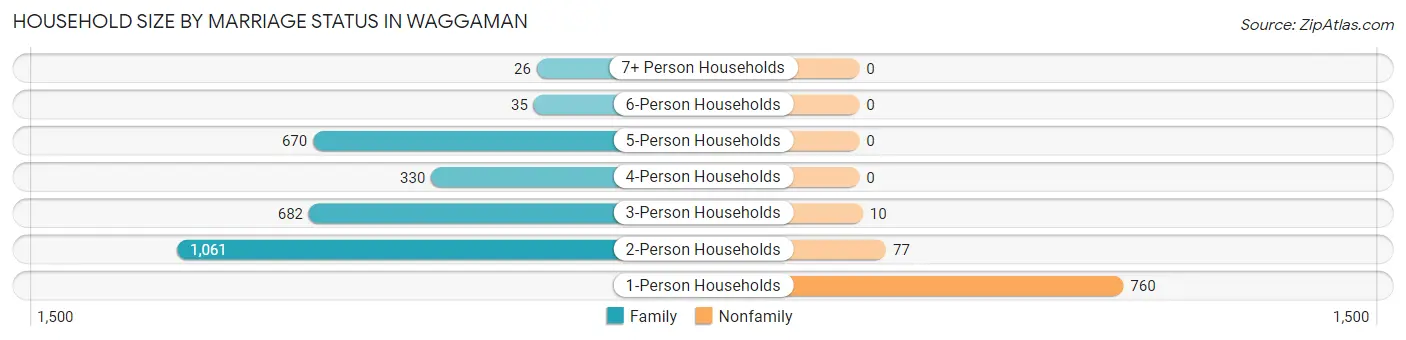
| Household Size | Family Households | Nonfamily Households |
| 1-Person Households | - | 760 (20.8%) |
| 2-Person Households | 1,061 (29.1%) | 77 (2.1%) |
| 3-Person Households | 682 (18.7%) | 10 (0.3%) |
| 4-Person Households | 330 (9.0%) | 0 (0.0%) |
| 5-Person Households | 670 (18.3%) | 0 (0.0%) |
| 6-Person Households | 35 (1.0%) | 0 (0.0%) |
| 7+ Person Households | 26 (0.7%) | 0 (0.0%) |
| Total | 2,804 (76.8%) | 847 (23.2%) |
Female Fertility in Waggaman
Fertility by Age in Waggaman
Average fertility rate in Waggaman is 50.0 births per 1,000 women. Women in the age bracket of 20 to 34 years have the highest fertility rate with 119.0 births per 1,000 women. Women in the age bracket of 20 to 34 years acount for 100.0% of all women with births.
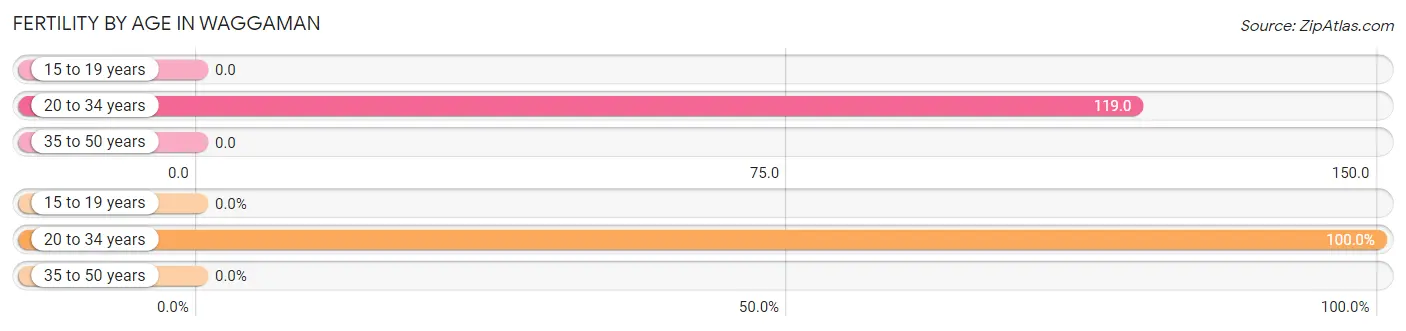
| Age Bracket | Women with Births | Births / 1,000 Women |
| 15 to 19 years | 0 (0.0%) | 0.0 |
| 20 to 34 years | 161 (100.0%) | 119.0 |
| 35 to 50 years | 0 (0.0%) | 0.0 |
| Total | 161 (100.0%) | 50.0 |
Fertility by Age by Marriage Status in Waggaman
16.1% of women with births (161) in Waggaman are married. The highest percentage of unmarried women with births falls into 20 to 34 years age bracket with 83.9% of them unmarried at the time of birth, while the lowest percentage of unmarried women with births belong to 20 to 34 years age bracket with 83.9% of them unmarried.
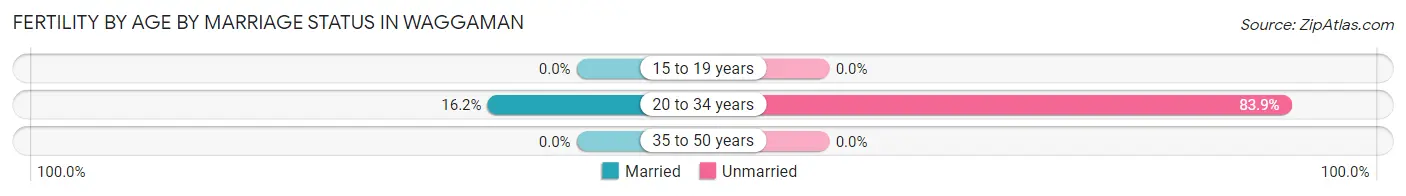
| Age Bracket | Married | Unmarried |
| 15 to 19 years | 0 (0.0%) | 0 (0.0%) |
| 20 to 34 years | 26 (16.2%) | 135 (83.9%) |
| 35 to 50 years | 0 (0.0%) | 0 (0.0%) |
| Total | 26 (16.2%) | 135 (83.9%) |
Fertility by Education in Waggaman
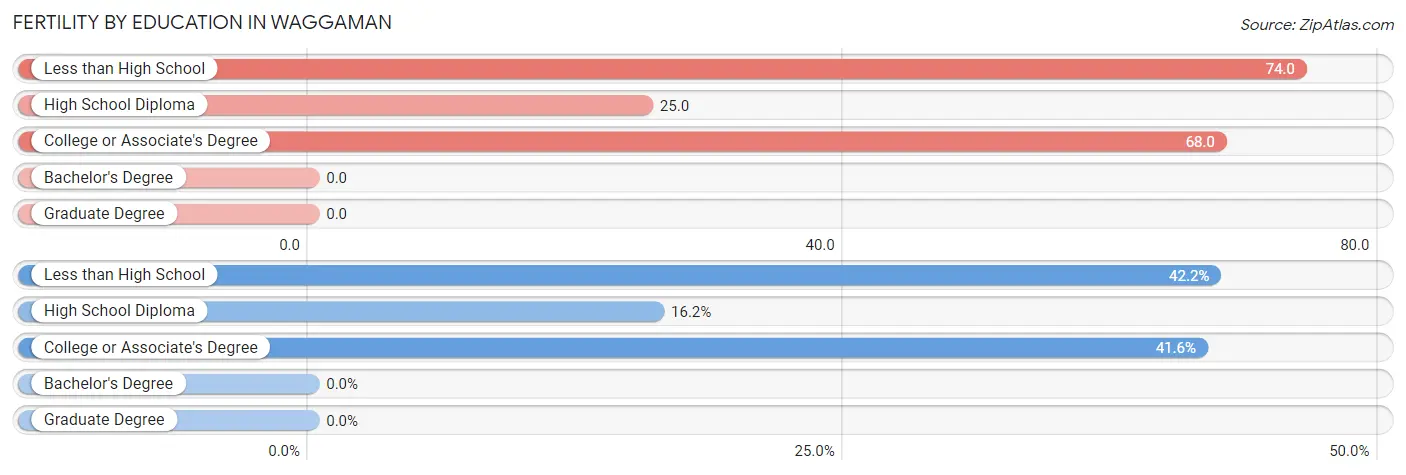
| Educational Attainment | Women with Births | Births / 1,000 Women |
| Less than High School | 68 (42.2%) | 74.0 |
| High School Diploma | 26 (16.2%) | 25.0 |
| College or Associate's Degree | 67 (41.6%) | 68.0 |
| Bachelor's Degree | 0 (0.0%) | 0.0 |
| Graduate Degree | 0 (0.0%) | 0.0 |
| Total | 161 (100.0%) | 50.0 |
Fertility by Education by Marriage Status in Waggaman
83.9% of women with births in Waggaman are unmarried. Women with the educational attainment of high school diploma are most likely to be married with 100.0% of them married at childbirth, while women with the educational attainment of less than high school are least likely to be married with 100.0% of them unmarried at childbirth.
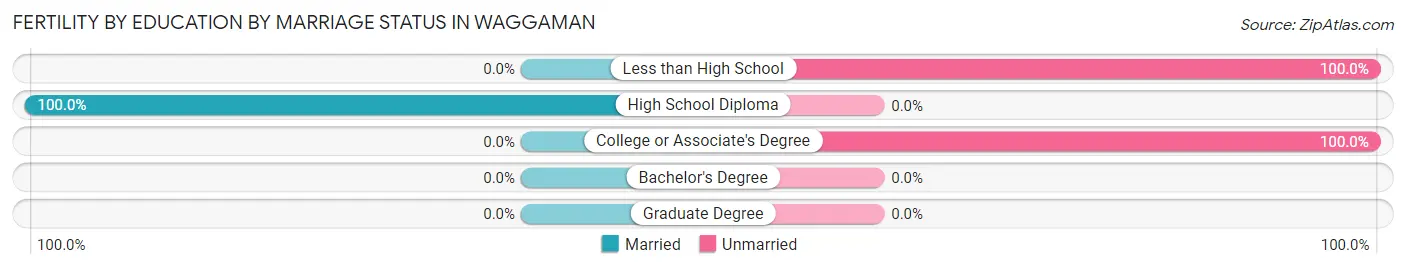
| Educational Attainment | Married | Unmarried |
| Less than High School | 0 (0.0%) | 68 (100.0%) |
| High School Diploma | 26 (100.0%) | 0 (0.0%) |
| College or Associate's Degree | 0 (0.0%) | 67 (100.0%) |
| Bachelor's Degree | 0 (0.0%) | 0 (0.0%) |
| Graduate Degree | 0 (0.0%) | 0 (0.0%) |
| Total | 26 (16.2%) | 135 (83.9%) |
Employment Characteristics in Waggaman
Employment by Class of Employer in Waggaman
Among the 4,229 employed individuals in Waggaman, private company employees (2,848 | 67.3%), local government employees (703 | 16.6%), and self-employed (incorporated) (189 | 4.5%) make up the most common classes of employment.
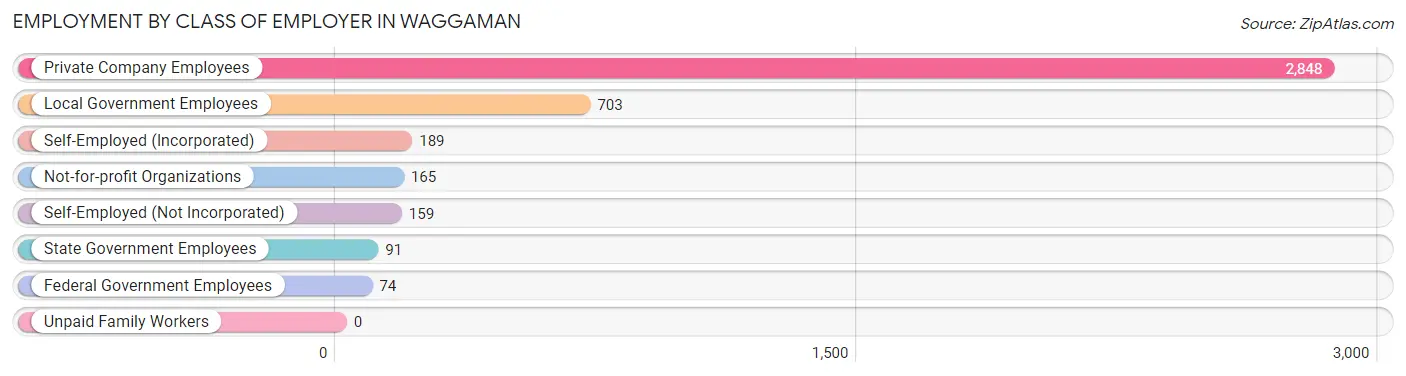
| Employer Class | # Employees | % Employees |
| Private Company Employees | 2,848 | 67.3% |
| Self-Employed (Incorporated) | 189 | 4.5% |
| Self-Employed (Not Incorporated) | 159 | 3.8% |
| Not-for-profit Organizations | 165 | 3.9% |
| Local Government Employees | 703 | 16.6% |
| State Government Employees | 91 | 2.1% |
| Federal Government Employees | 74 | 1.8% |
| Unpaid Family Workers | 0 | 0.0% |
| Total | 4,229 | 100.0% |
Employment Status by Age in Waggaman
According to the labor force statistics for Waggaman, out of the total population over 16 years of age (8,432), 58.9% or 4,966 individuals are in the labor force, with 9.8% or 487 of them unemployed. The age group with the highest labor force participation rate is 45 to 54 years, with 83.2% or 1,324 individuals in the labor force. Within the labor force, the 16 to 19 years age range has the highest percentage of unemployed individuals, with 83.7% or 87 of them being unemployed.
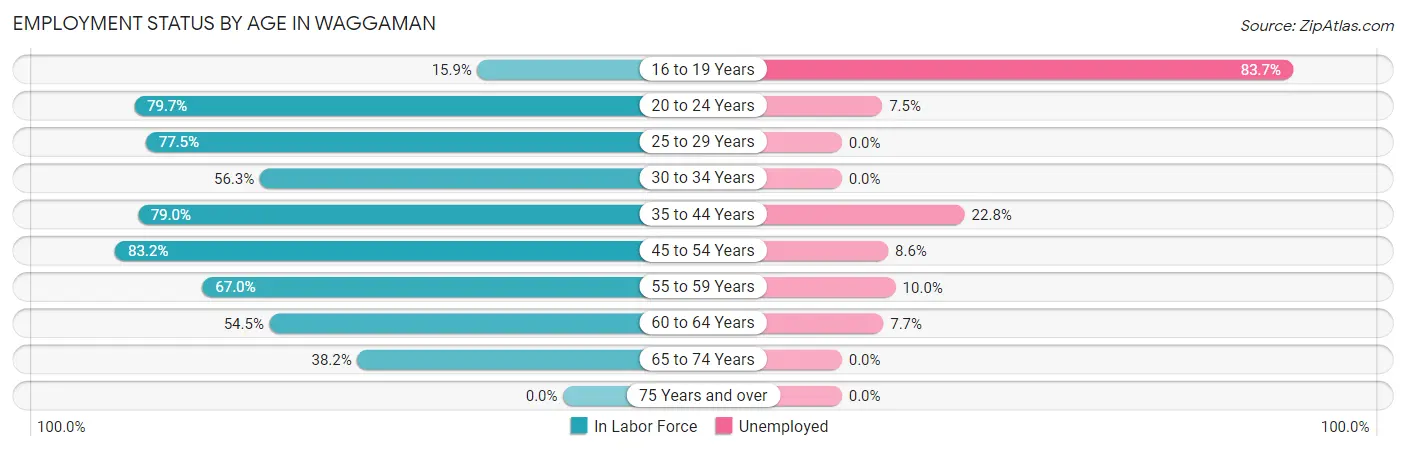
| Age Bracket | In Labor Force | Unemployed |
| 16 to 19 Years | 104 (15.9%) | 87 (83.7%) |
| 20 to 24 Years | 899 (79.7%) | 67 (7.5%) |
| 25 to 29 Years | 241 (77.5%) | 0 (0.0%) |
| 30 to 34 Years | 491 (56.3%) | 0 (0.0%) |
| 35 to 44 Years | 579 (79.0%) | 132 (22.8%) |
| 45 to 54 Years | 1,324 (83.2%) | 114 (8.6%) |
| 55 to 59 Years | 668 (67.0%) | 67 (10.0%) |
| 60 to 64 Years | 248 (54.5%) | 19 (7.7%) |
| 65 to 74 Years | 412 (38.2%) | 0 (0.0%) |
| 75 Years and over | 0 (0.0%) | 0 (0.0%) |
| Total | 4,966 (58.9%) | 487 (9.8%) |
Employment Status by Educational Attainment in Waggaman
According to labor force statistics for Waggaman, 71.6% of individuals (3,551) out of the total population between 25 and 64 years of age (4,959) are in the labor force, with 9.3% or 330 of them being unemployed. The group with the highest labor force participation rate are those with the educational attainment of bachelor's degree or higher, with 75.9% or 521 individuals in the labor force. Within the labor force, individuals with less than high school education have the highest percentage of unemployment, with 35.2% or 150 of them being unemployed.
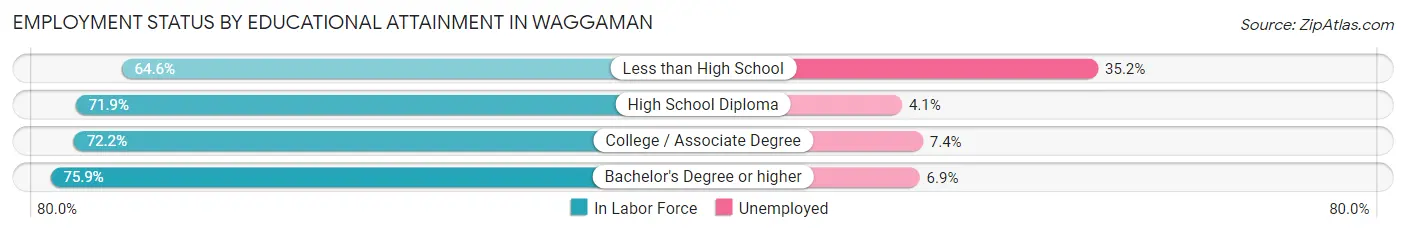
| Educational Attainment | In Labor Force | Unemployed |
| Less than High School | 426 (64.6%) | 232 (35.2%) |
| High School Diploma | 1,447 (71.9%) | 83 (4.1%) |
| College / Associate Degree | 1,156 (72.2%) | 118 (7.4%) |
| Bachelor's Degree or higher | 521 (75.9%) | 47 (6.9%) |
| Total | 3,551 (71.6%) | 461 (9.3%) |
Employment Occupations by Sex in Waggaman
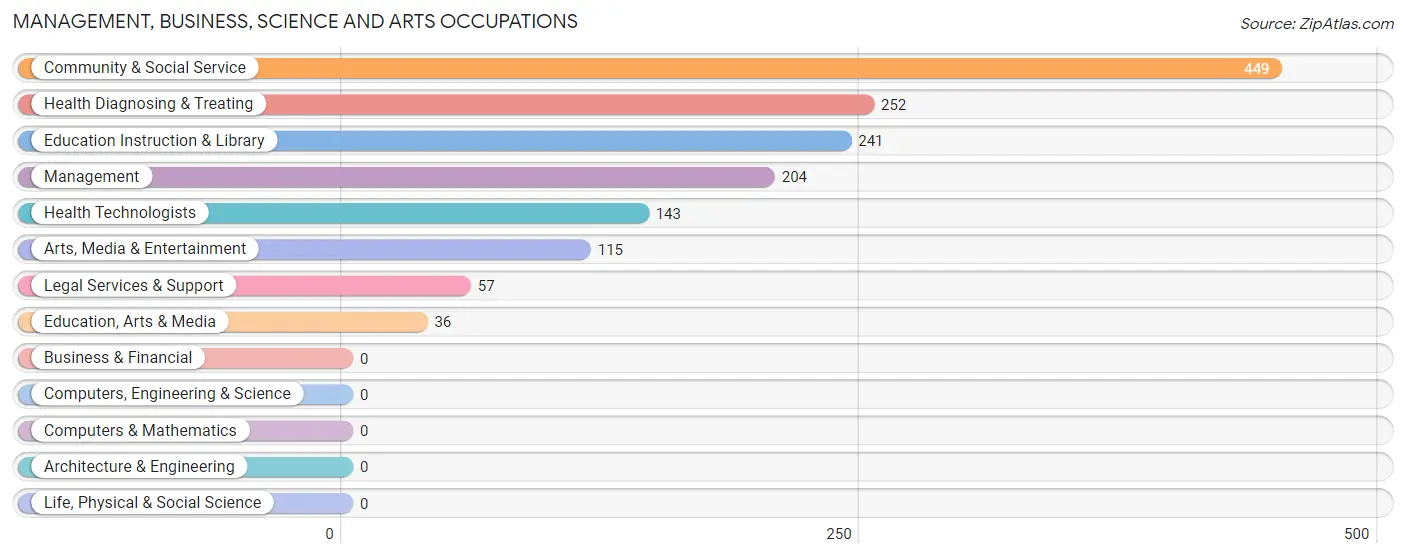
Management, Business, Science and Arts Occupations
The most common Management, Business, Science and Arts occupations in Waggaman are Community & Social Service (449 | 10.0%), Health Diagnosing & Treating (252 | 5.6%), Education Instruction & Library (241 | 5.4%), Management (204 | 4.5%), and Health Technologists (143 | 3.2%).
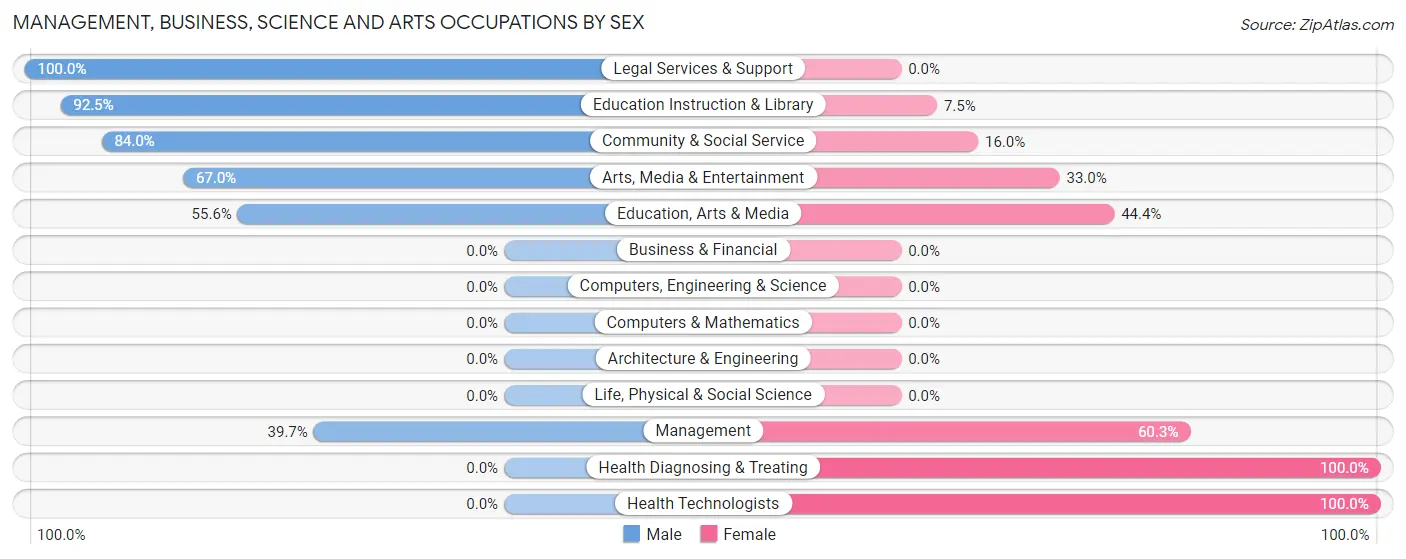
Management, Business, Science and Arts Occupations by Sex
Within the Management, Business, Science and Arts occupations in Waggaman, the most male-oriented occupations are Legal Services & Support (100.0%), Education Instruction & Library (92.5%), and Community & Social Service (84.0%), while the most female-oriented occupations are Health Diagnosing & Treating (100.0%), Health Technologists (100.0%), and Management (60.3%).
| Occupation | Male | Female |
| Management | 81 (39.7%) | 123 (60.3%) |
| Business & Financial | 0 (0.0%) | 0 (0.0%) |
| Computers, Engineering & Science | 0 (0.0%) | 0 (0.0%) |
| Computers & Mathematics | 0 (0.0%) | 0 (0.0%) |
| Architecture & Engineering | 0 (0.0%) | 0 (0.0%) |
| Life, Physical & Social Science | 0 (0.0%) | 0 (0.0%) |
| Community & Social Service | 377 (84.0%) | 72 (16.0%) |
| Education, Arts & Media | 20 (55.6%) | 16 (44.4%) |
| Legal Services & Support | 57 (100.0%) | 0 (0.0%) |
| Education Instruction & Library | 223 (92.5%) | 18 (7.5%) |
| Arts, Media & Entertainment | 77 (67.0%) | 38 (33.0%) |
| Health Diagnosing & Treating | 0 (0.0%) | 252 (100.0%) |
| Health Technologists | 0 (0.0%) | 143 (100.0%) |
| Total (Category) | 458 (50.6%) | 447 (49.4%) |
| Total (Overall) | 2,003 (44.7%) | 2,477 (55.3%) |
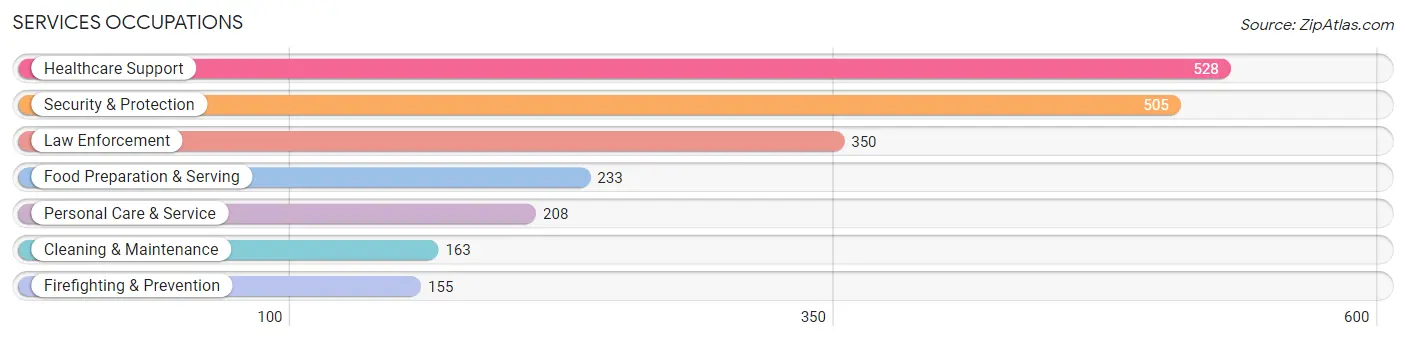
Services Occupations
The most common Services occupations in Waggaman are Healthcare Support (528 | 11.8%), Security & Protection (505 | 11.3%), Law Enforcement (350 | 7.8%), Food Preparation & Serving (233 | 5.2%), and Personal Care & Service (208 | 4.6%).
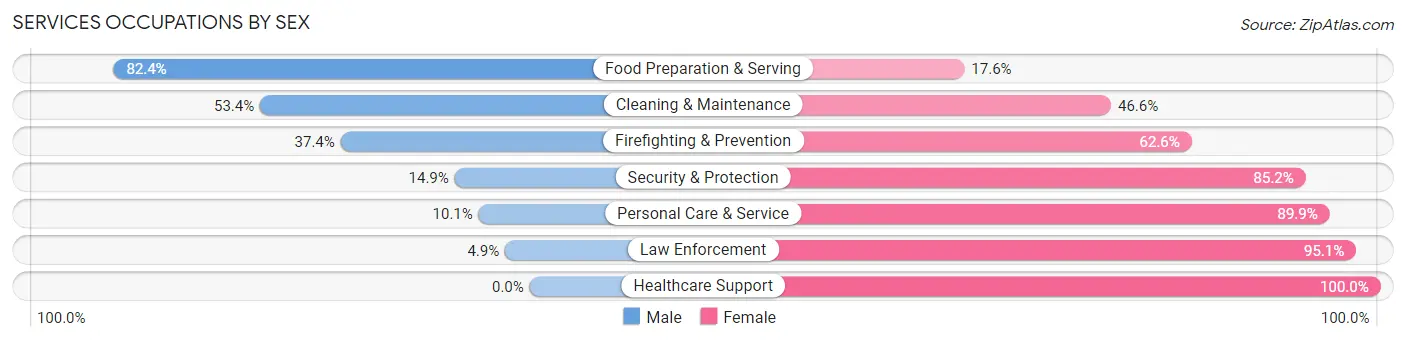
Services Occupations by Sex
Within the Services occupations in Waggaman, the most male-oriented occupations are Food Preparation & Serving (82.4%), Cleaning & Maintenance (53.4%), and Firefighting & Prevention (37.4%), while the most female-oriented occupations are Healthcare Support (100.0%), Law Enforcement (95.1%), and Personal Care & Service (89.9%).
| Occupation | Male | Female |
| Healthcare Support | 0 (0.0%) | 528 (100.0%) |
| Security & Protection | 75 (14.8%) | 430 (85.2%) |
| Firefighting & Prevention | 58 (37.4%) | 97 (62.6%) |
| Law Enforcement | 17 (4.9%) | 333 (95.1%) |
| Food Preparation & Serving | 192 (82.4%) | 41 (17.6%) |
| Cleaning & Maintenance | 87 (53.4%) | 76 (46.6%) |
| Personal Care & Service | 21 (10.1%) | 187 (89.9%) |
| Total (Category) | 375 (22.9%) | 1,262 (77.1%) |
| Total (Overall) | 2,003 (44.7%) | 2,477 (55.3%) |
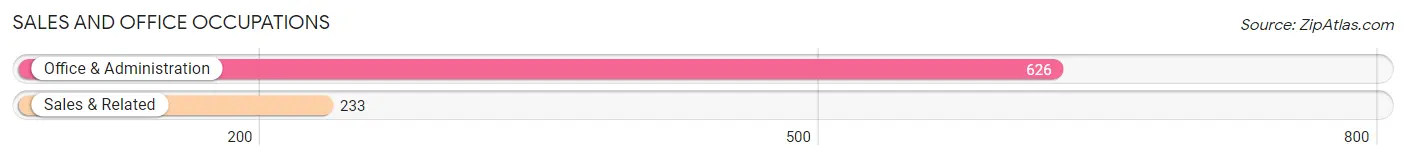
Sales and Office Occupations
The most common Sales and Office occupations in Waggaman are Office & Administration (626 | 14.0%), and Sales & Related (233 | 5.2%).
Sales and Office Occupations by Sex
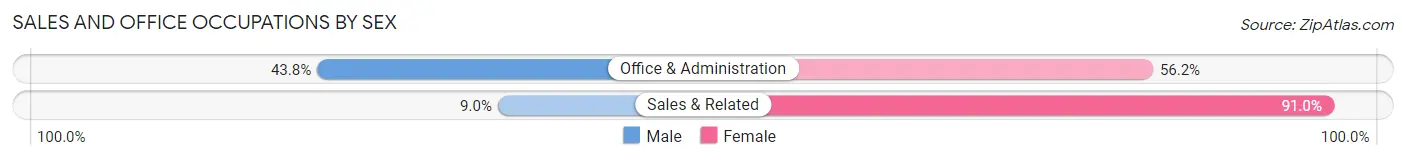
| Occupation | Male | Female |
| Sales & Related | 21 (9.0%) | 212 (91.0%) |
| Office & Administration | 274 (43.8%) | 352 (56.2%) |
| Total (Category) | 295 (34.3%) | 564 (65.7%) |
| Total (Overall) | 2,003 (44.7%) | 2,477 (55.3%) |
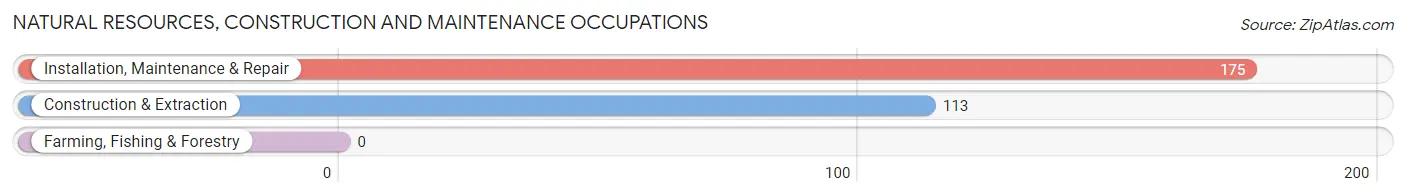
Natural Resources, Construction and Maintenance Occupations
The most common Natural Resources, Construction and Maintenance occupations in Waggaman are Installation, Maintenance & Repair (175 | 3.9%), and Construction & Extraction (113 | 2.5%).
Natural Resources, Construction and Maintenance Occupations by Sex
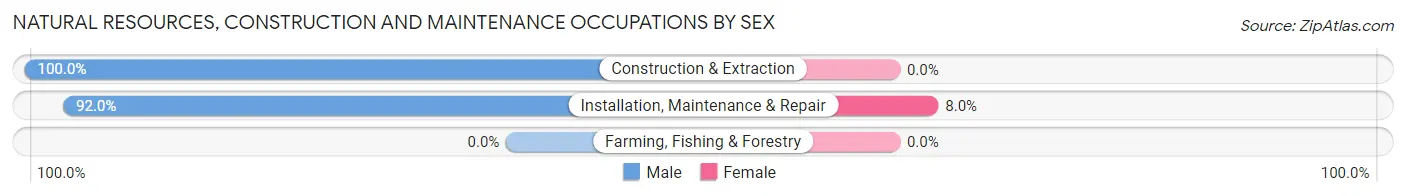
| Occupation | Male | Female |
| Farming, Fishing & Forestry | 0 (0.0%) | 0 (0.0%) |
| Construction & Extraction | 113 (100.0%) | 0 (0.0%) |
| Installation, Maintenance & Repair | 161 (92.0%) | 14 (8.0%) |
| Total (Category) | 274 (95.1%) | 14 (4.9%) |
| Total (Overall) | 2,003 (44.7%) | 2,477 (55.3%) |
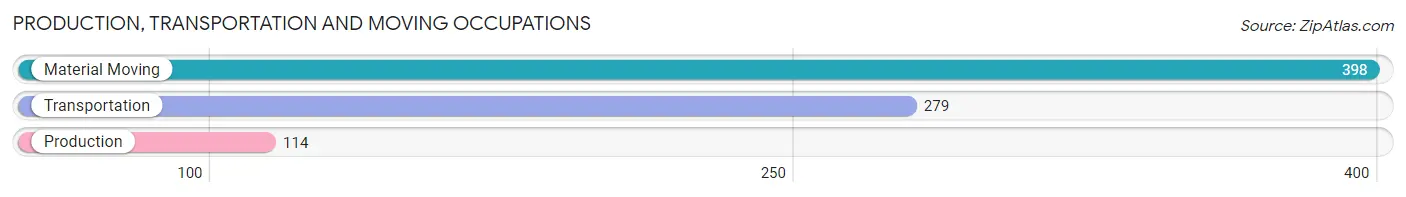
Production, Transportation and Moving Occupations
The most common Production, Transportation and Moving occupations in Waggaman are Material Moving (398 | 8.9%), Transportation (279 | 6.2%), and Production (114 | 2.5%).
Production, Transportation and Moving Occupations by Sex
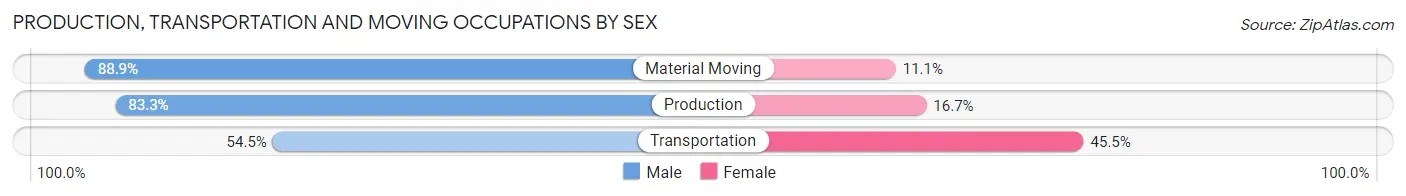
| Occupation | Male | Female |
| Production | 95 (83.3%) | 19 (16.7%) |
| Transportation | 152 (54.5%) | 127 (45.5%) |
| Material Moving | 354 (88.9%) | 44 (11.1%) |
| Total (Category) | 601 (76.0%) | 190 (24.0%) |
| Total (Overall) | 2,003 (44.7%) | 2,477 (55.3%) |
Employment Industries by Sex in Waggaman
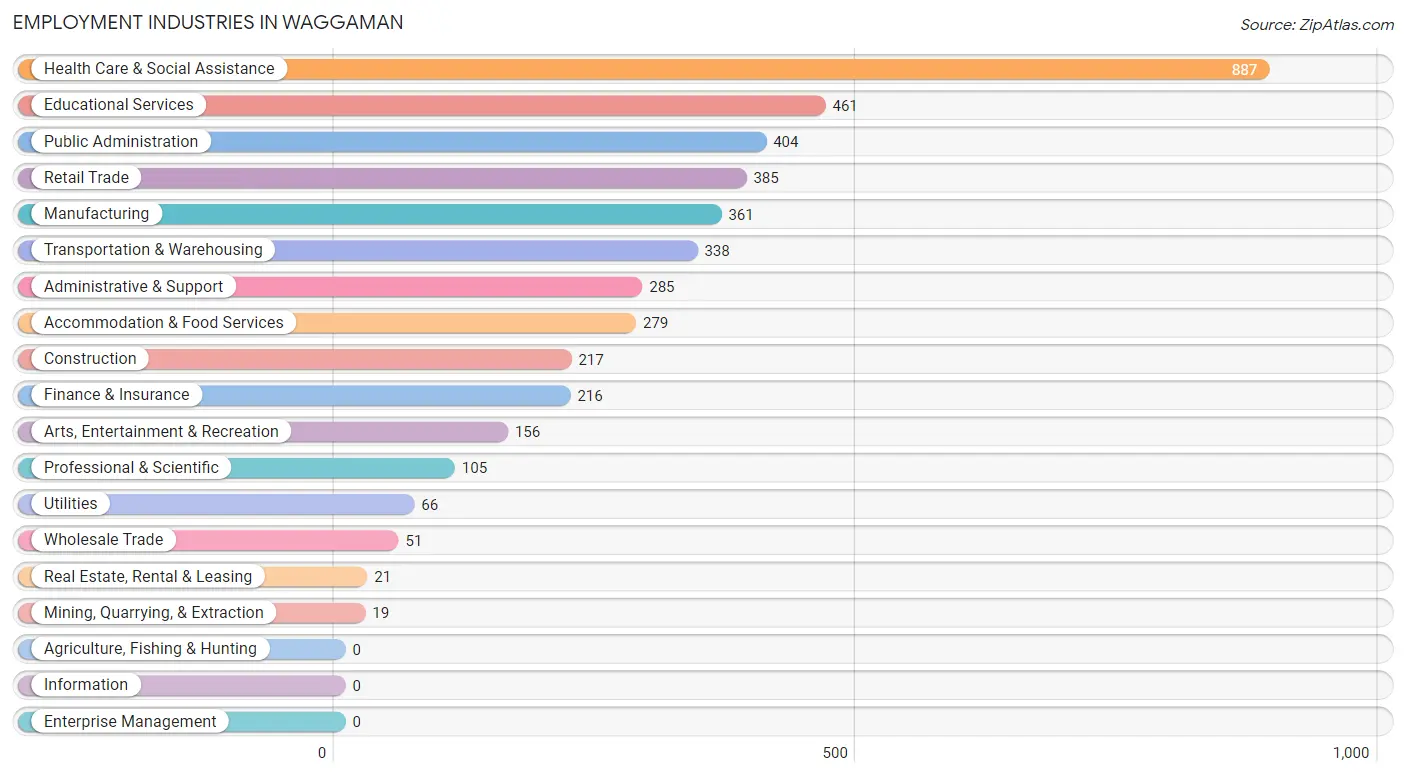
Employment Industries in Waggaman
The major employment industries in Waggaman include Health Care & Social Assistance (887 | 19.8%), Educational Services (461 | 10.3%), Public Administration (404 | 9.0%), Retail Trade (385 | 8.6%), and Manufacturing (361 | 8.1%).
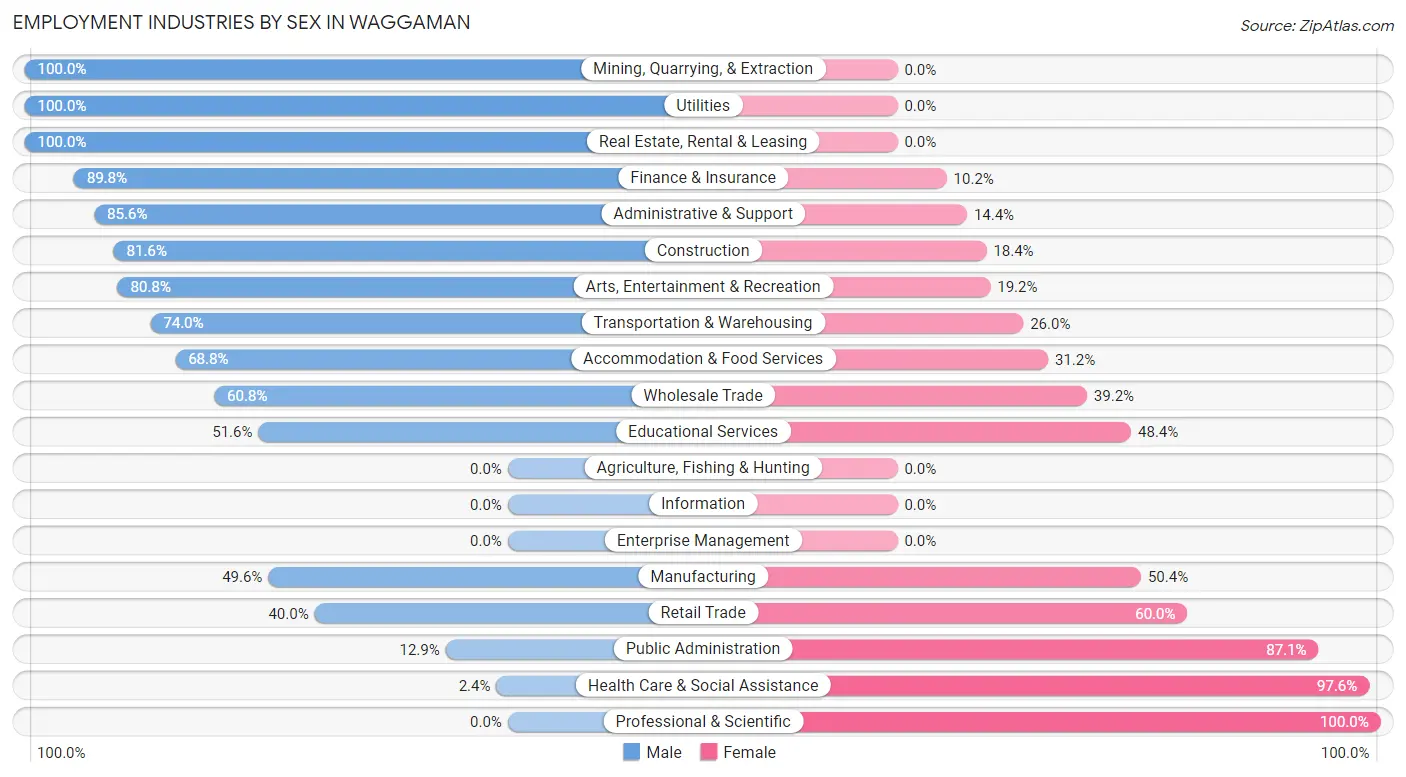
Employment Industries by Sex in Waggaman
The Waggaman industries that see more men than women are Mining, Quarrying, & Extraction (100.0%), Utilities (100.0%), and Real Estate, Rental & Leasing (100.0%), whereas the industries that tend to have a higher number of women are Professional & Scientific (100.0%), Health Care & Social Assistance (97.6%), and Public Administration (87.1%).
| Industry | Male | Female |
| Agriculture, Fishing & Hunting | 0 (0.0%) | 0 (0.0%) |
| Mining, Quarrying, & Extraction | 19 (100.0%) | 0 (0.0%) |
| Construction | 177 (81.6%) | 40 (18.4%) |
| Manufacturing | 179 (49.6%) | 182 (50.4%) |
| Wholesale Trade | 31 (60.8%) | 20 (39.2%) |
| Retail Trade | 154 (40.0%) | 231 (60.0%) |
| Transportation & Warehousing | 250 (74.0%) | 88 (26.0%) |
| Utilities | 66 (100.0%) | 0 (0.0%) |
| Information | 0 (0.0%) | 0 (0.0%) |
| Finance & Insurance | 194 (89.8%) | 22 (10.2%) |
| Real Estate, Rental & Leasing | 21 (100.0%) | 0 (0.0%) |
| Professional & Scientific | 0 (0.0%) | 105 (100.0%) |
| Enterprise Management | 0 (0.0%) | 0 (0.0%) |
| Administrative & Support | 244 (85.6%) | 41 (14.4%) |
| Educational Services | 238 (51.6%) | 223 (48.4%) |
| Health Care & Social Assistance | 21 (2.4%) | 866 (97.6%) |
| Arts, Entertainment & Recreation | 126 (80.8%) | 30 (19.2%) |
| Accommodation & Food Services | 192 (68.8%) | 87 (31.2%) |
| Public Administration | 52 (12.9%) | 352 (87.1%) |
| Total | 2,003 (44.7%) | 2,477 (55.3%) |
Education in Waggaman
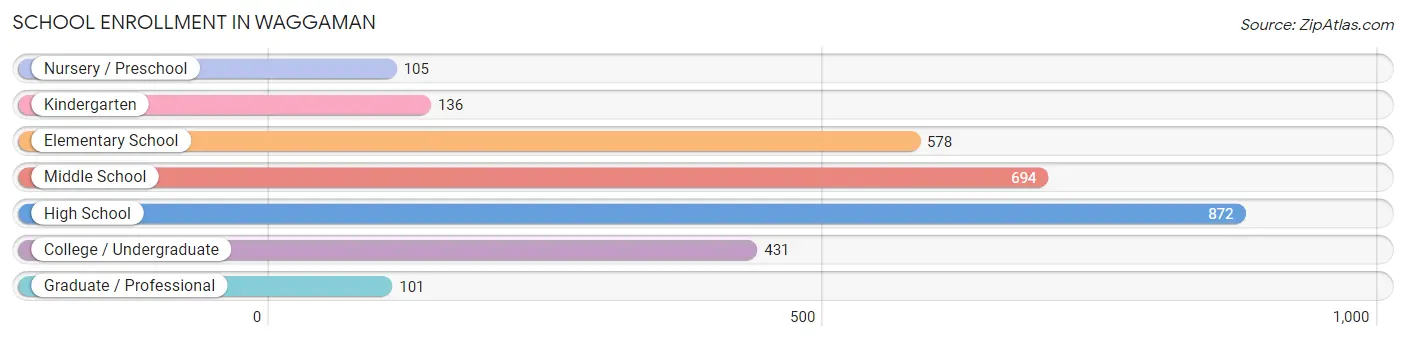
School Enrollment in Waggaman
The most common levels of schooling among the 2,917 students in Waggaman are high school (872 | 29.9%), middle school (694 | 23.8%), and elementary school (578 | 19.8%).
| School Level | # Students | % Students |
| Nursery / Preschool | 105 | 3.6% |
| Kindergarten | 136 | 4.7% |
| Elementary School | 578 | 19.8% |
| Middle School | 694 | 23.8% |
| High School | 872 | 29.9% |
| College / Undergraduate | 431 | 14.8% |
| Graduate / Professional | 101 | 3.5% |
| Total | 2,917 | 100.0% |
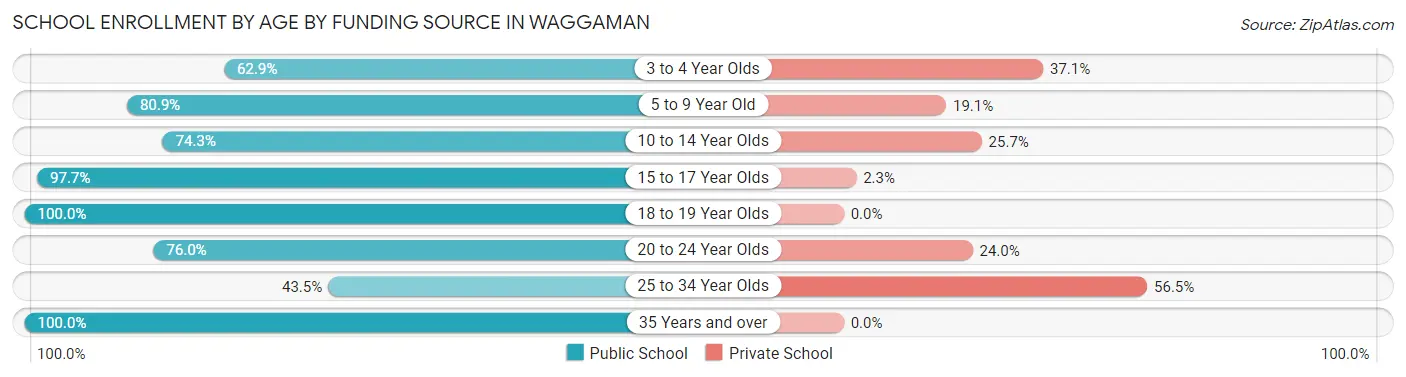
School Enrollment by Age by Funding Source in Waggaman
Out of a total of 2,917 students who are enrolled in schools in Waggaman, 481 (16.5%) attend a private institution, while the remaining 2,436 (83.5%) are enrolled in public schools. The age group of 25 to 34 year olds has the highest likelihood of being enrolled in private schools, with 39 (56.5% in the age bracket) enrolled. Conversely, the age group of 18 to 19 year olds has the lowest likelihood of being enrolled in a private school, with 59 (100.0% in the age bracket) attending a public institution.
| Age Bracket | Public School | Private School |
| 3 to 4 Year Olds | 66 (62.9%) | 39 (37.1%) |
| 5 to 9 Year Old | 505 (80.9%) | 119 (19.1%) |
| 10 to 14 Year Olds | 691 (74.3%) | 239 (25.7%) |
| 15 to 17 Year Olds | 668 (97.7%) | 16 (2.3%) |
| 18 to 19 Year Olds | 59 (100.0%) | 0 (0.0%) |
| 20 to 24 Year Olds | 95 (76.0%) | 30 (24.0%) |
| 25 to 34 Year Olds | 30 (43.5%) | 39 (56.5%) |
| 35 Years and over | 321 (100.0%) | 0 (0.0%) |
| Total | 2,436 (83.5%) | 481 (16.5%) |
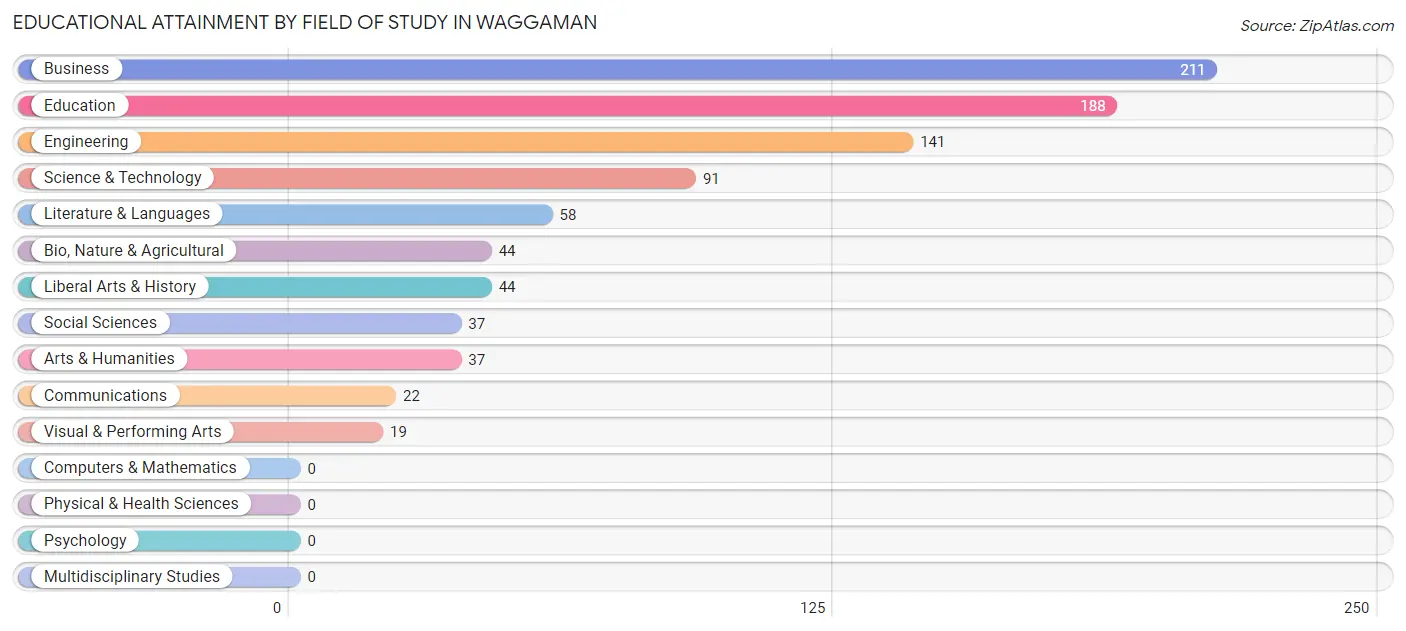
Educational Attainment by Field of Study in Waggaman
Business (211 | 23.6%), education (188 | 21.1%), engineering (141 | 15.8%), science & technology (91 | 10.2%), and literature & languages (58 | 6.5%) are the most common fields of study among 892 individuals in Waggaman who have obtained a bachelor's degree or higher.
| Field of Study | # Graduates | % Graduates |
| Computers & Mathematics | 0 | 0.0% |
| Bio, Nature & Agricultural | 44 | 4.9% |
| Physical & Health Sciences | 0 | 0.0% |
| Psychology | 0 | 0.0% |
| Social Sciences | 37 | 4.2% |
| Engineering | 141 | 15.8% |
| Multidisciplinary Studies | 0 | 0.0% |
| Science & Technology | 91 | 10.2% |
| Business | 211 | 23.6% |
| Education | 188 | 21.1% |
| Literature & Languages | 58 | 6.5% |
| Liberal Arts & History | 44 | 4.9% |
| Visual & Performing Arts | 19 | 2.1% |
| Communications | 22 | 2.5% |
| Arts & Humanities | 37 | 4.2% |
| Total | 892 | 100.0% |
Transportation & Commute in Waggaman
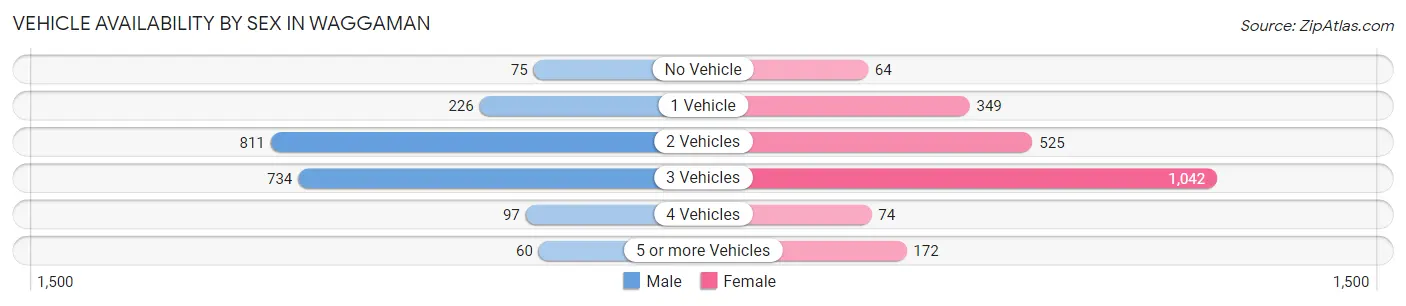
Vehicle Availability by Sex in Waggaman
The most prevalent vehicle ownership categories in Waggaman are males with 2 vehicles (811, accounting for 40.5%) and females with 2 vehicles (525, making up 36.4%).
| Vehicles Available | Male | Female |
| No Vehicle | 75 (3.7%) | 64 (2.9%) |
| 1 Vehicle | 226 (11.3%) | 349 (15.7%) |
| 2 Vehicles | 811 (40.5%) | 525 (23.6%) |
| 3 Vehicles | 734 (36.6%) | 1,042 (46.8%) |
| 4 Vehicles | 97 (4.8%) | 74 (3.3%) |
| 5 or more Vehicles | 60 (3.0%) | 172 (7.7%) |
| Total | 2,003 (100.0%) | 2,226 (100.0%) |
Commute Time in Waggaman
The most frequently occuring commute durations in Waggaman are 20 to 24 minutes (1,184 commuters, 29.2%), 30 to 34 minutes (612 commuters, 15.1%), and 45 to 59 minutes (540 commuters, 13.3%).
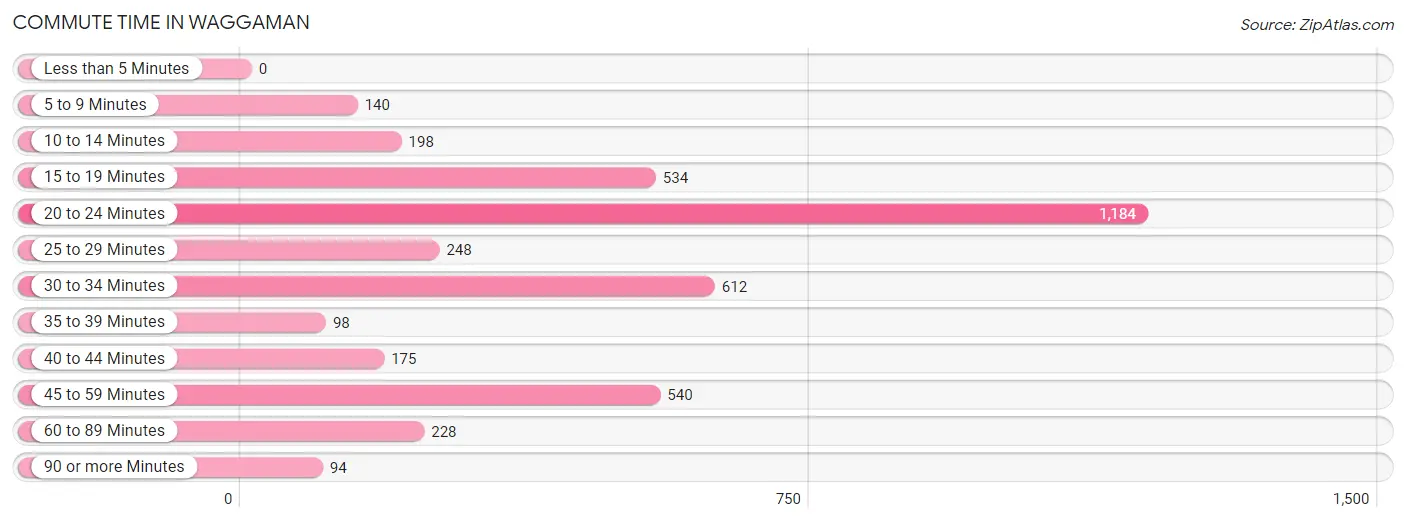
| Commute Time | # Commuters | % Commuters |
| Less than 5 Minutes | 0 | 0.0% |
| 5 to 9 Minutes | 140 | 3.5% |
| 10 to 14 Minutes | 198 | 4.9% |
| 15 to 19 Minutes | 534 | 13.2% |
| 20 to 24 Minutes | 1,184 | 29.2% |
| 25 to 29 Minutes | 248 | 6.1% |
| 30 to 34 Minutes | 612 | 15.1% |
| 35 to 39 Minutes | 98 | 2.4% |
| 40 to 44 Minutes | 175 | 4.3% |
| 45 to 59 Minutes | 540 | 13.3% |
| 60 to 89 Minutes | 228 | 5.6% |
| 90 or more Minutes | 94 | 2.3% |
Commute Time by Sex in Waggaman
The most common commute times in Waggaman are 15 to 19 minutes (466 commuters, 24.8%) for males and 20 to 24 minutes (979 commuters, 45.0%) for females.
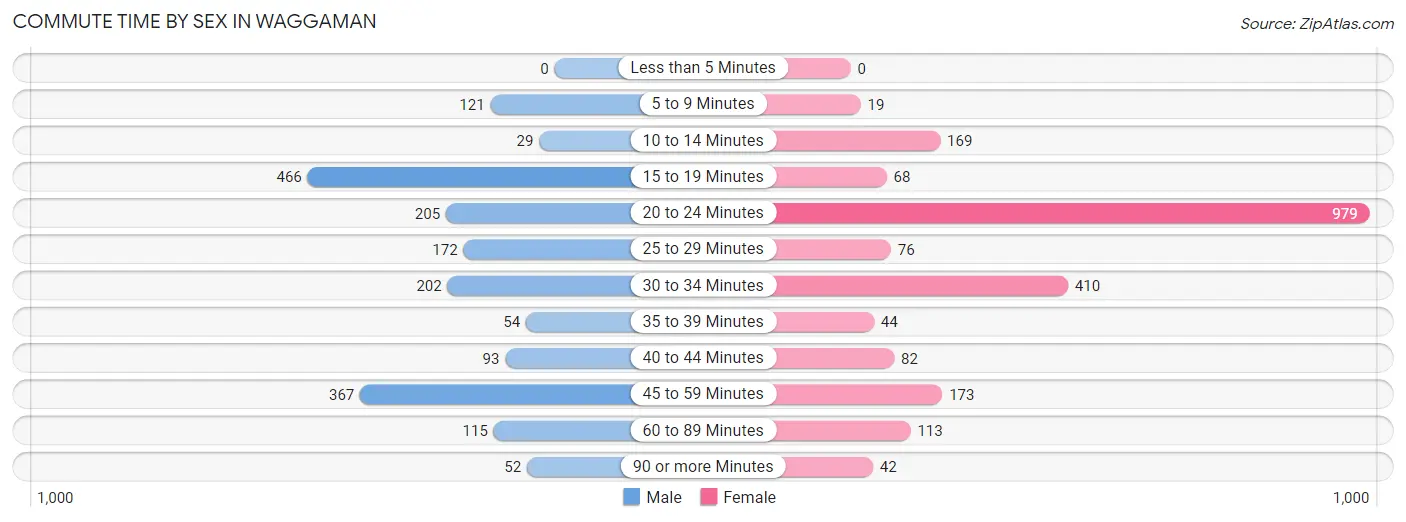
| Commute Time | Male | Female |
| Less than 5 Minutes | 0 (0.0%) | 0 (0.0%) |
| 5 to 9 Minutes | 121 (6.5%) | 19 (0.9%) |
| 10 to 14 Minutes | 29 (1.5%) | 169 (7.8%) |
| 15 to 19 Minutes | 466 (24.8%) | 68 (3.1%) |
| 20 to 24 Minutes | 205 (10.9%) | 979 (45.0%) |
| 25 to 29 Minutes | 172 (9.2%) | 76 (3.5%) |
| 30 to 34 Minutes | 202 (10.8%) | 410 (18.9%) |
| 35 to 39 Minutes | 54 (2.9%) | 44 (2.0%) |
| 40 to 44 Minutes | 93 (5.0%) | 82 (3.8%) |
| 45 to 59 Minutes | 367 (19.6%) | 173 (8.0%) |
| 60 to 89 Minutes | 115 (6.1%) | 113 (5.2%) |
| 90 or more Minutes | 52 (2.8%) | 42 (1.9%) |
Time of Departure to Work by Sex in Waggaman
The most frequent times of departure to work in Waggaman are 5:00 AM to 5:29 AM (372, 19.8%) for males and 12:00 AM to 4:59 AM (504, 23.2%) for females.
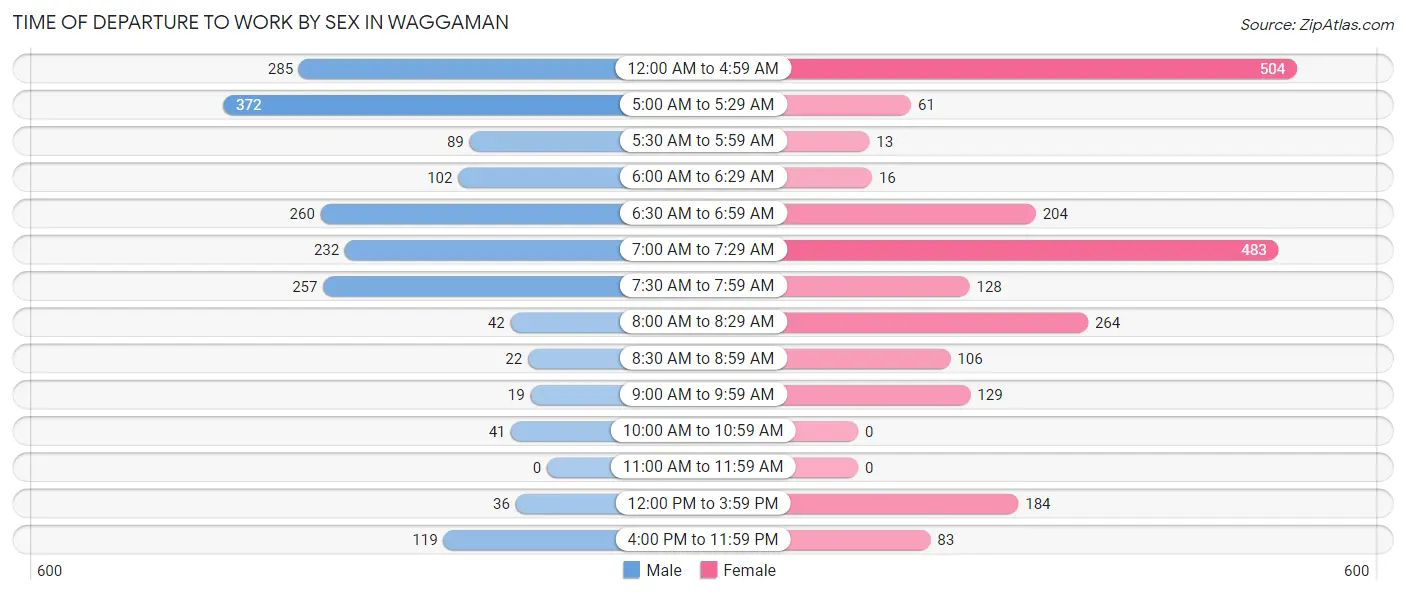
| Time of Departure | Male | Female |
| 12:00 AM to 4:59 AM | 285 (15.2%) | 504 (23.2%) |
| 5:00 AM to 5:29 AM | 372 (19.8%) | 61 (2.8%) |
| 5:30 AM to 5:59 AM | 89 (4.7%) | 13 (0.6%) |
| 6:00 AM to 6:29 AM | 102 (5.4%) | 16 (0.7%) |
| 6:30 AM to 6:59 AM | 260 (13.9%) | 204 (9.4%) |
| 7:00 AM to 7:29 AM | 232 (12.4%) | 483 (22.2%) |
| 7:30 AM to 7:59 AM | 257 (13.7%) | 128 (5.9%) |
| 8:00 AM to 8:29 AM | 42 (2.2%) | 264 (12.1%) |
| 8:30 AM to 8:59 AM | 22 (1.2%) | 106 (4.9%) |
| 9:00 AM to 9:59 AM | 19 (1.0%) | 129 (5.9%) |
| 10:00 AM to 10:59 AM | 41 (2.2%) | 0 (0.0%) |
| 11:00 AM to 11:59 AM | 0 (0.0%) | 0 (0.0%) |
| 12:00 PM to 3:59 PM | 36 (1.9%) | 184 (8.5%) |
| 4:00 PM to 11:59 PM | 119 (6.3%) | 83 (3.8%) |
| Total | 1,876 (100.0%) | 2,175 (100.0%) |
Housing Occupancy in Waggaman
Occupancy by Ownership in Waggaman
Of the total 3,651 dwellings in Waggaman, owner-occupied units account for 2,497 (68.4%), while renter-occupied units make up 1,154 (31.6%).
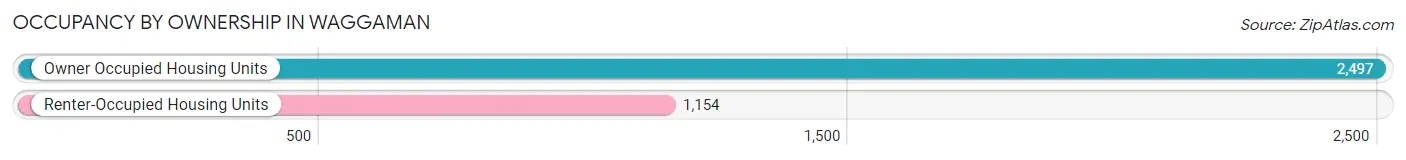
| Occupancy | # Housing Units | % Housing Units |
| Owner Occupied Housing Units | 2,497 | 68.4% |
| Renter-Occupied Housing Units | 1,154 | 31.6% |
| Total Occupied Housing Units | 3,651 | 100.0% |
Occupancy by Household Size in Waggaman
| Household Size | # Housing Units | % Housing Units |
| 1-Person Household | 760 | 20.8% |
| 2-Person Household | 1,138 | 31.2% |
| 3-Person Household | 692 | 19.0% |
| 4+ Person Household | 1,061 | 29.1% |
| Total Housing Units | 3,651 | 100.0% |
Occupancy by Ownership by Household Size in Waggaman
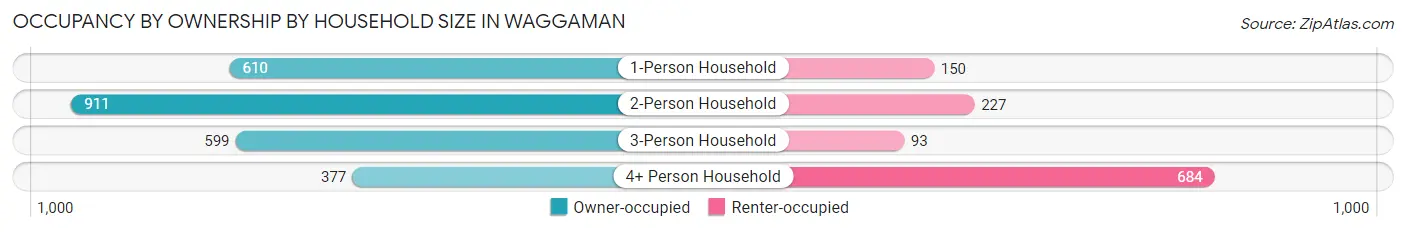
| Household Size | Owner-occupied | Renter-occupied |
| 1-Person Household | 610 (80.3%) | 150 (19.7%) |
| 2-Person Household | 911 (80.0%) | 227 (20.0%) |
| 3-Person Household | 599 (86.6%) | 93 (13.4%) |
| 4+ Person Household | 377 (35.5%) | 684 (64.5%) |
| Total Housing Units | 2,497 (68.4%) | 1,154 (31.6%) |
Occupancy by Educational Attainment in Waggaman
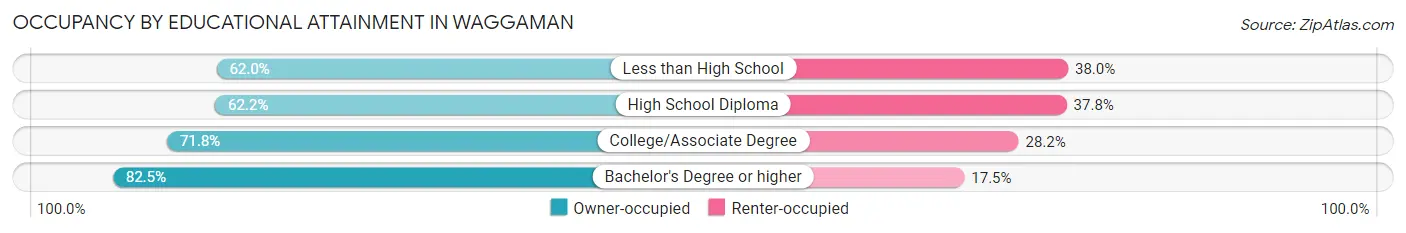
| Household Size | Owner-occupied | Renter-occupied |
| Less than High School | 316 (62.0%) | 194 (38.0%) |
| High School Diploma | 791 (62.2%) | 480 (37.8%) |
| College/Associate Degree | 1,022 (71.8%) | 402 (28.2%) |
| Bachelor's Degree or higher | 368 (82.5%) | 78 (17.5%) |
Occupancy by Age of Householder in Waggaman
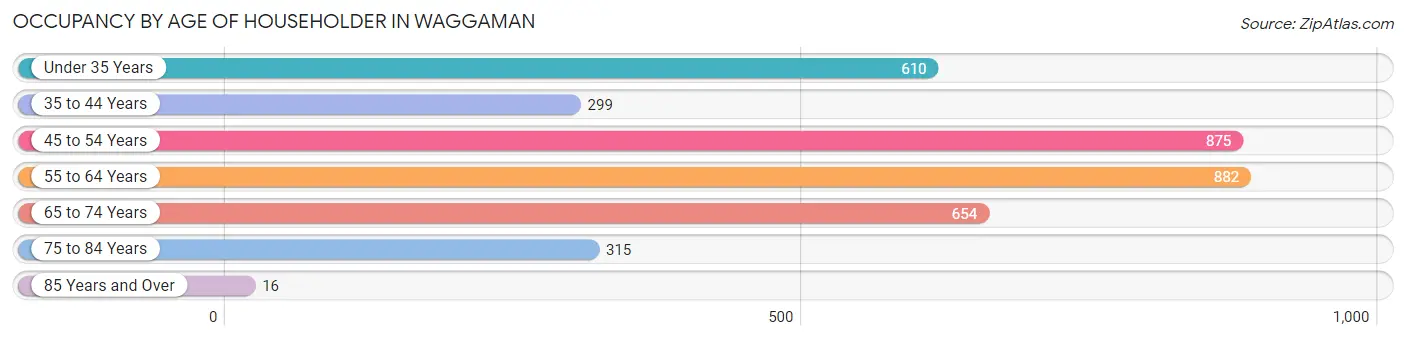
| Age Bracket | # Households | % Households |
| Under 35 Years | 610 | 16.7% |
| 35 to 44 Years | 299 | 8.2% |
| 45 to 54 Years | 875 | 24.0% |
| 55 to 64 Years | 882 | 24.2% |
| 65 to 74 Years | 654 | 17.9% |
| 75 to 84 Years | 315 | 8.6% |
| 85 Years and Over | 16 | 0.4% |
| Total | 3,651 | 100.0% |
Housing Finances in Waggaman
Median Income by Occupancy in Waggaman
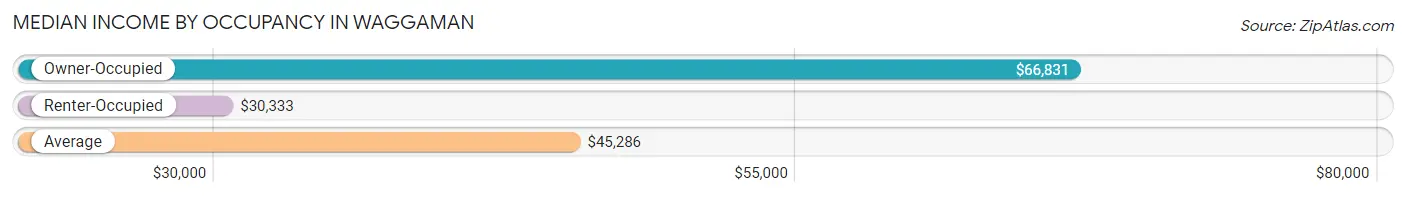
| Occupancy Type | # Households | Median Income |
| Owner-Occupied | 2,497 (68.4%) | $66,831 |
| Renter-Occupied | 1,154 (31.6%) | $30,333 |
| Average | 3,651 (100.0%) | $45,286 |
Occupancy by Householder Income Bracket in Waggaman
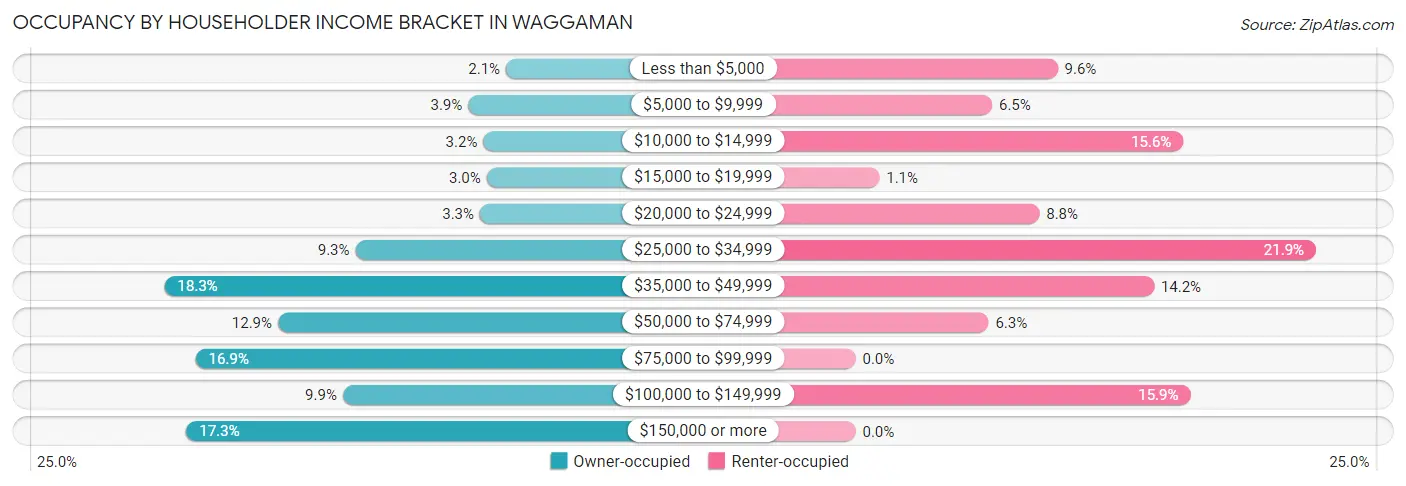
| Income Bracket | Owner-occupied | Renter-occupied |
| Less than $5,000 | 52 (2.1%) | 111 (9.6%) |
| $5,000 to $9,999 | 97 (3.9%) | 75 (6.5%) |
| $10,000 to $14,999 | 79 (3.2%) | 180 (15.6%) |
| $15,000 to $19,999 | 75 (3.0%) | 13 (1.1%) |
| $20,000 to $24,999 | 83 (3.3%) | 101 (8.7%) |
| $25,000 to $34,999 | 231 (9.2%) | 253 (21.9%) |
| $35,000 to $49,999 | 458 (18.3%) | 164 (14.2%) |
| $50,000 to $74,999 | 323 (12.9%) | 73 (6.3%) |
| $75,000 to $99,999 | 421 (16.9%) | 0 (0.0%) |
| $100,000 to $149,999 | 246 (9.9%) | 184 (15.9%) |
| $150,000 or more | 432 (17.3%) | 0 (0.0%) |
| Total | 2,497 (100.0%) | 1,154 (100.0%) |
Monthly Housing Cost Tiers in Waggaman
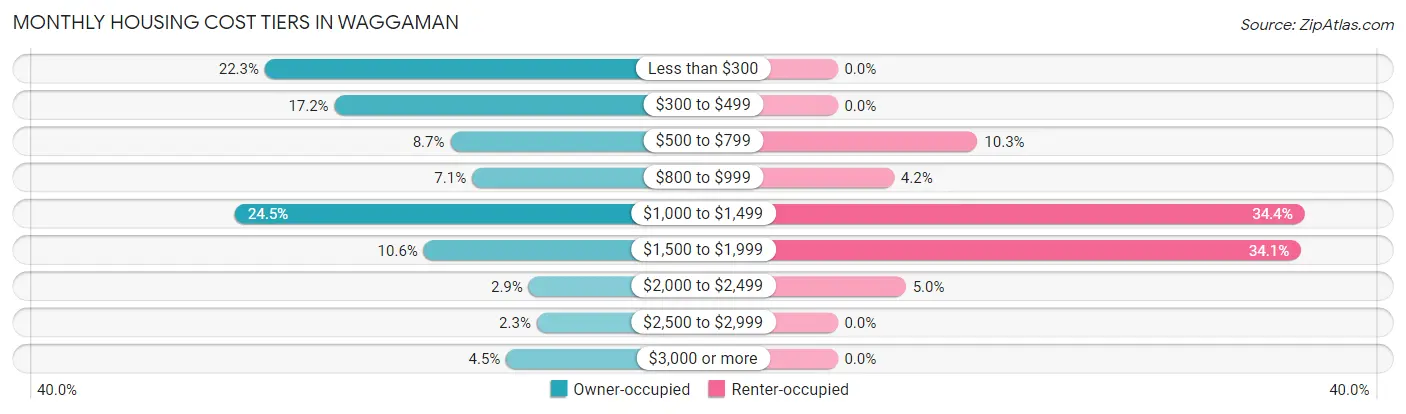
| Monthly Cost | Owner-occupied | Renter-occupied |
| Less than $300 | 557 (22.3%) | 0 (0.0%) |
| $300 to $499 | 429 (17.2%) | 0 (0.0%) |
| $500 to $799 | 216 (8.6%) | 119 (10.3%) |
| $800 to $999 | 176 (7.0%) | 48 (4.2%) |
| $1,000 to $1,499 | 612 (24.5%) | 397 (34.4%) |
| $1,500 to $1,999 | 265 (10.6%) | 394 (34.1%) |
| $2,000 to $2,499 | 72 (2.9%) | 58 (5.0%) |
| $2,500 to $2,999 | 57 (2.3%) | 0 (0.0%) |
| $3,000 or more | 113 (4.5%) | 0 (0.0%) |
| Total | 2,497 (100.0%) | 1,154 (100.0%) |
Physical Housing Characteristics in Waggaman
Housing Structures in Waggaman
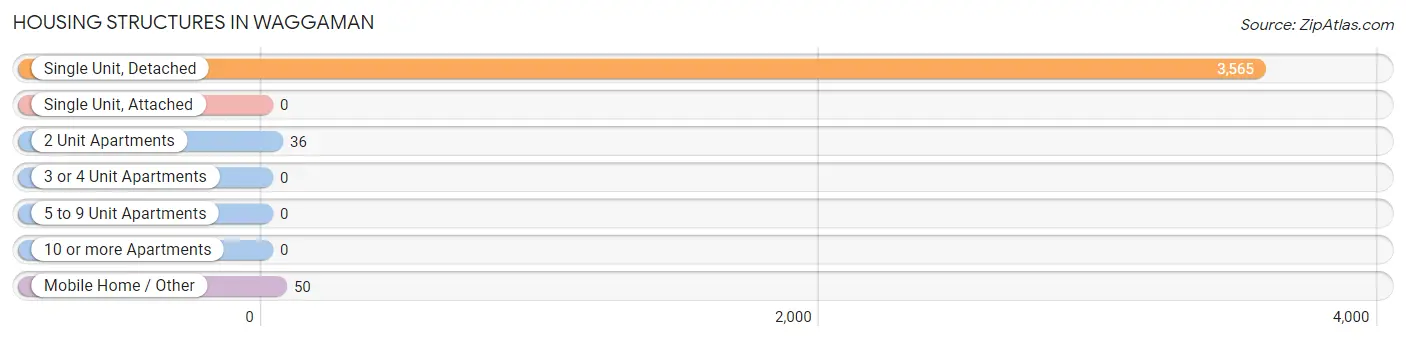
| Structure Type | # Housing Units | % Housing Units |
| Single Unit, Detached | 3,565 | 97.6% |
| Single Unit, Attached | 0 | 0.0% |
| 2 Unit Apartments | 36 | 1.0% |
| 3 or 4 Unit Apartments | 0 | 0.0% |
| 5 to 9 Unit Apartments | 0 | 0.0% |
| 10 or more Apartments | 0 | 0.0% |
| Mobile Home / Other | 50 | 1.4% |
| Total | 3,651 | 100.0% |
Housing Structures by Occupancy in Waggaman
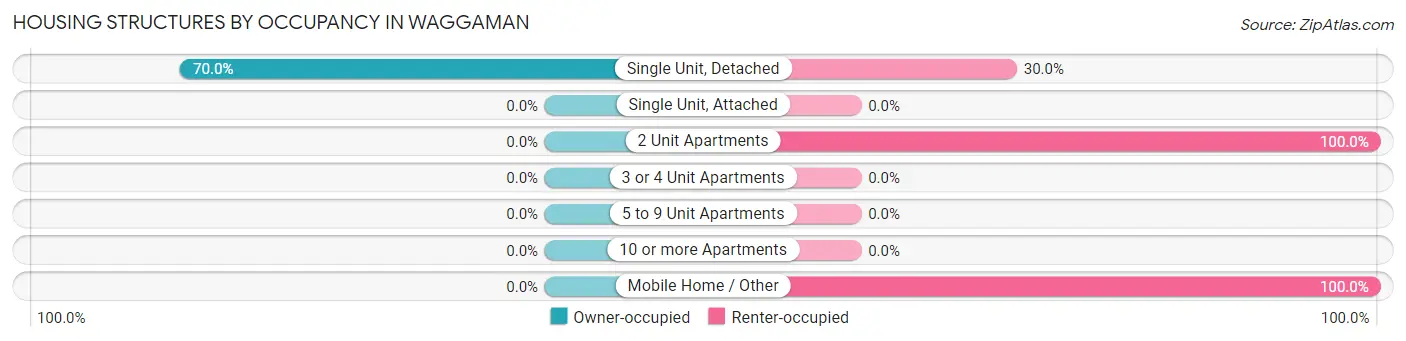
| Structure Type | Owner-occupied | Renter-occupied |
| Single Unit, Detached | 2,497 (70.0%) | 1,068 (30.0%) |
| Single Unit, Attached | 0 (0.0%) | 0 (0.0%) |
| 2 Unit Apartments | 0 (0.0%) | 36 (100.0%) |
| 3 or 4 Unit Apartments | 0 (0.0%) | 0 (0.0%) |
| 5 to 9 Unit Apartments | 0 (0.0%) | 0 (0.0%) |
| 10 or more Apartments | 0 (0.0%) | 0 (0.0%) |
| Mobile Home / Other | 0 (0.0%) | 50 (100.0%) |
| Total | 2,497 (68.4%) | 1,154 (31.6%) |
Housing Structures by Number of Rooms in Waggaman
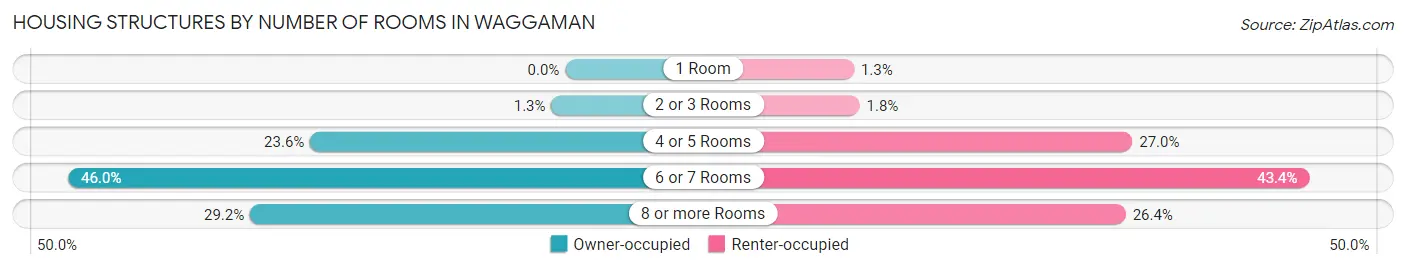
| Number of Rooms | Owner-occupied | Renter-occupied |
| 1 Room | 0 (0.0%) | 15 (1.3%) |
| 2 or 3 Rooms | 32 (1.3%) | 21 (1.8%) |
| 4 or 5 Rooms | 589 (23.6%) | 312 (27.0%) |
| 6 or 7 Rooms | 1,148 (46.0%) | 501 (43.4%) |
| 8 or more Rooms | 728 (29.1%) | 305 (26.4%) |
| Total | 2,497 (100.0%) | 1,154 (100.0%) |
Housing Structure by Heating Type in Waggaman
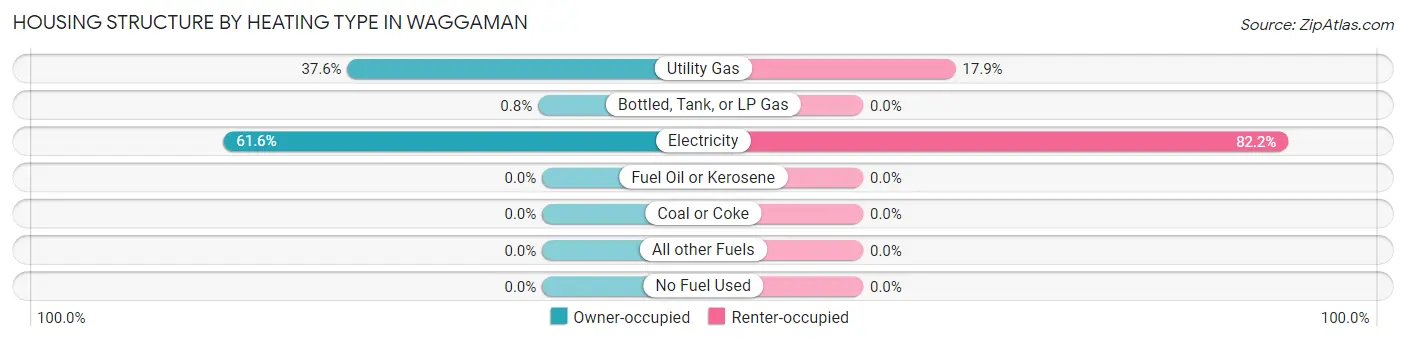
| Heating Type | Owner-occupied | Renter-occupied |
| Utility Gas | 939 (37.6%) | 206 (17.8%) |
| Bottled, Tank, or LP Gas | 20 (0.8%) | 0 (0.0%) |
| Electricity | 1,538 (61.6%) | 948 (82.2%) |
| Fuel Oil or Kerosene | 0 (0.0%) | 0 (0.0%) |
| Coal or Coke | 0 (0.0%) | 0 (0.0%) |
| All other Fuels | 0 (0.0%) | 0 (0.0%) |
| No Fuel Used | 0 (0.0%) | 0 (0.0%) |
| Total | 2,497 (100.0%) | 1,154 (100.0%) |
Household Vehicle Usage in Waggaman
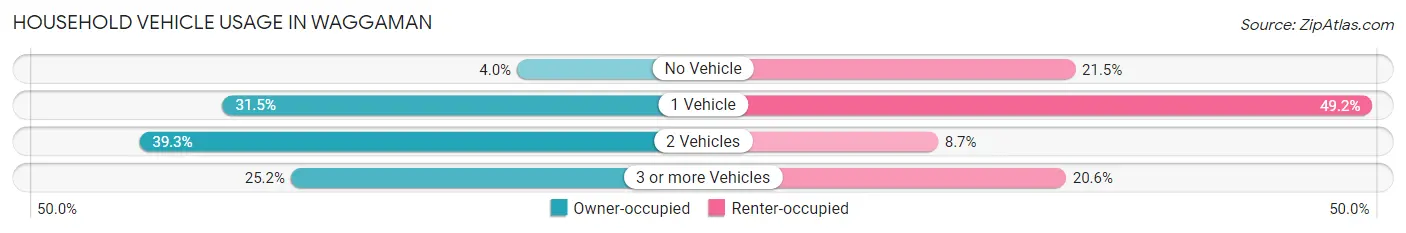
| Vehicles per Household | Owner-occupied | Renter-occupied |
| No Vehicle | 101 (4.0%) | 248 (21.5%) |
| 1 Vehicle | 787 (31.5%) | 568 (49.2%) |
| 2 Vehicles | 981 (39.3%) | 100 (8.7%) |
| 3 or more Vehicles | 628 (25.2%) | 238 (20.6%) |
| Total | 2,497 (100.0%) | 1,154 (100.0%) |
Real Estate & Mortgages in Waggaman
Real Estate and Mortgage Overview in Waggaman
| Characteristic | Without Mortgage | With Mortgage |
| Housing Units | 1,096 | 1,401 |
| Median Property Value | $116,500 | $154,000 |
| Median Household Income | $48,421 | $296 |
| Monthly Housing Costs | $297 | $101 |
| Real Estate Taxes | $199 | $107 |
Property Value by Mortgage Status in Waggaman
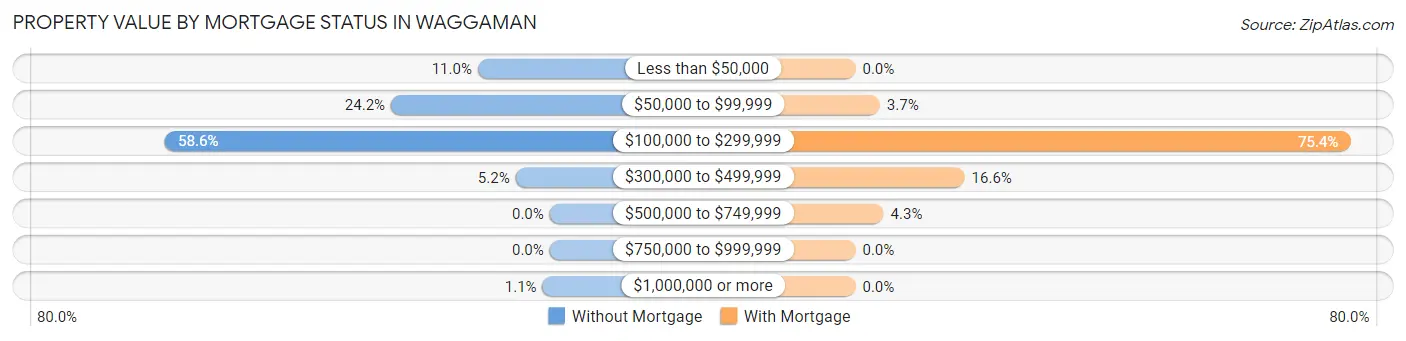
| Property Value | Without Mortgage | With Mortgage |
| Less than $50,000 | 120 (11.0%) | 0 (0.0%) |
| $50,000 to $99,999 | 265 (24.2%) | 52 (3.7%) |
| $100,000 to $299,999 | 642 (58.6%) | 1,056 (75.4%) |
| $300,000 to $499,999 | 57 (5.2%) | 233 (16.6%) |
| $500,000 to $749,999 | 0 (0.0%) | 60 (4.3%) |
| $750,000 to $999,999 | 0 (0.0%) | 0 (0.0%) |
| $1,000,000 or more | 12 (1.1%) | 0 (0.0%) |
| Total | 1,096 (100.0%) | 1,401 (100.0%) |
Household Income by Mortgage Status in Waggaman
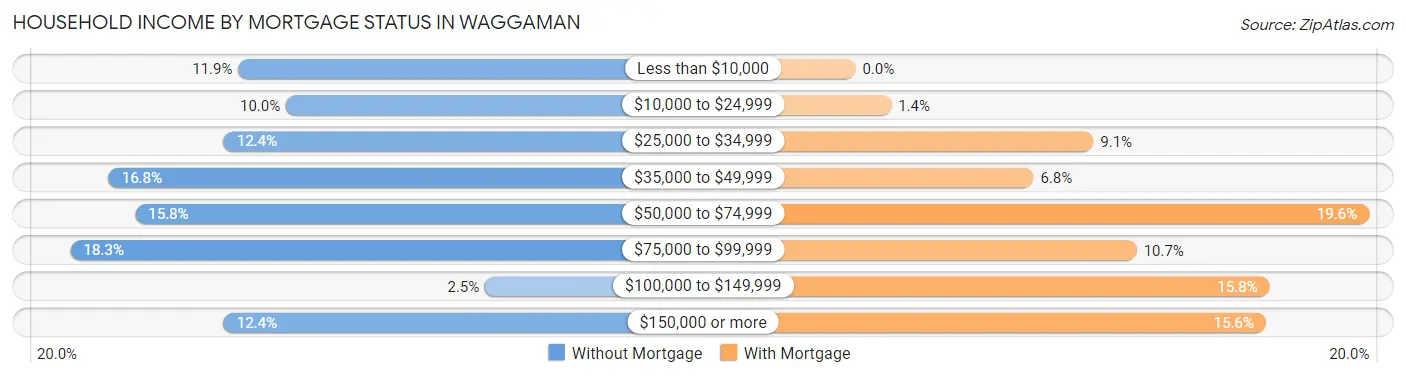
| Household Income | Without Mortgage | With Mortgage |
| Less than $10,000 | 130 (11.9%) | 0 (0.0%) |
| $10,000 to $24,999 | 110 (10.0%) | 19 (1.4%) |
| $25,000 to $34,999 | 136 (12.4%) | 127 (9.1%) |
| $35,000 to $49,999 | 184 (16.8%) | 95 (6.8%) |
| $50,000 to $74,999 | 173 (15.8%) | 274 (19.6%) |
| $75,000 to $99,999 | 200 (18.2%) | 150 (10.7%) |
| $100,000 to $149,999 | 27 (2.5%) | 221 (15.8%) |
| $150,000 or more | 136 (12.4%) | 219 (15.6%) |
| Total | 1,096 (100.0%) | 1,401 (100.0%) |
Property Value to Household Income Ratio in Waggaman
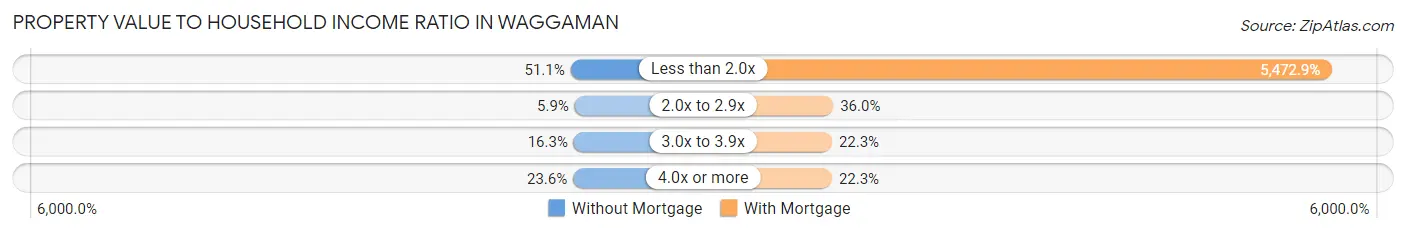
| Value-to-Income Ratio | Without Mortgage | With Mortgage |
| Less than 2.0x | 560 (51.1%) | 76,675 (5,472.9%) |
| 2.0x to 2.9x | 65 (5.9%) | 504 (36.0%) |
| 3.0x to 3.9x | 179 (16.3%) | 313 (22.3%) |
| 4.0x or more | 259 (23.6%) | 312 (22.3%) |
| Total | 1,096 (100.0%) | 1,401 (100.0%) |
Real Estate Taxes by Mortgage Status in Waggaman
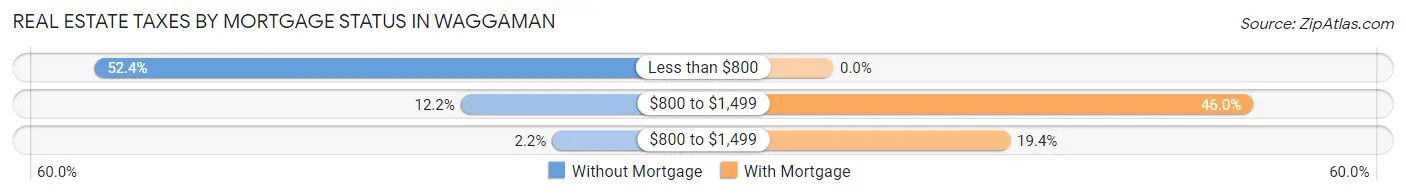
| Property Taxes | Without Mortgage | With Mortgage |
| Less than $800 | 574 (52.4%) | 0 (0.0%) |
| $800 to $1,499 | 134 (12.2%) | 645 (46.0%) |
| $800 to $1,499 | 24 (2.2%) | 272 (19.4%) |
| Total | 1,096 (100.0%) | 1,401 (100.0%) |
Health & Disability in Waggaman
Health Insurance Coverage by Age in Waggaman
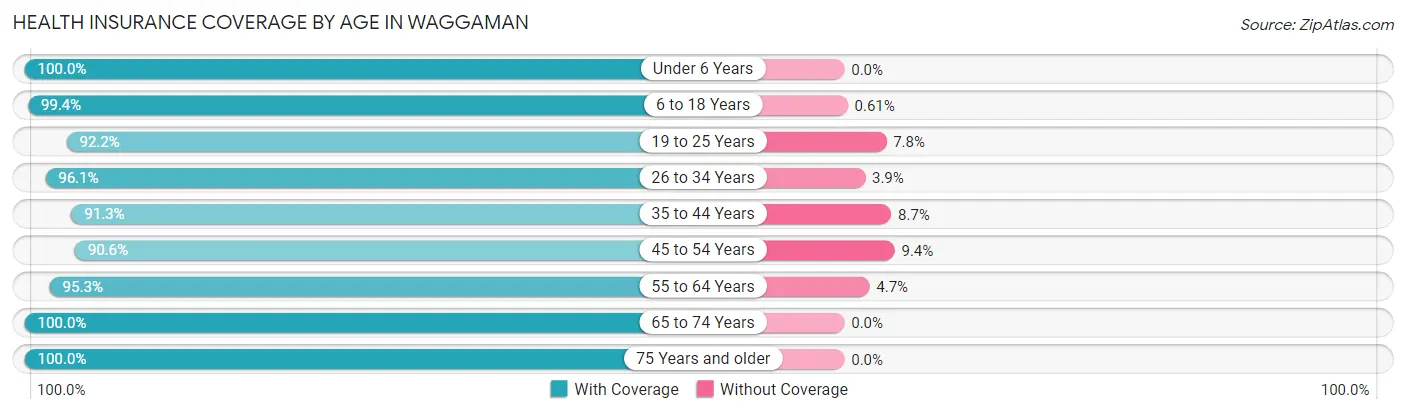
| Age Bracket | With Coverage | Without Coverage |
| Under 6 Years | 555 (100.0%) | 0 (0.0%) |
| 6 to 18 Years | 2,290 (99.4%) | 14 (0.6%) |
| 19 to 25 Years | 1,122 (92.2%) | 95 (7.8%) |
| 26 to 34 Years | 1,118 (96.1%) | 45 (3.9%) |
| 35 to 44 Years | 669 (91.3%) | 64 (8.7%) |
| 45 to 54 Years | 1,442 (90.6%) | 149 (9.4%) |
| 55 to 64 Years | 1,384 (95.3%) | 68 (4.7%) |
| 65 to 74 Years | 1,079 (100.0%) | 0 (0.0%) |
| 75 Years and older | 612 (100.0%) | 0 (0.0%) |
| Total | 10,271 (95.9%) | 435 (4.1%) |
Health Insurance Coverage by Citizenship Status in Waggaman
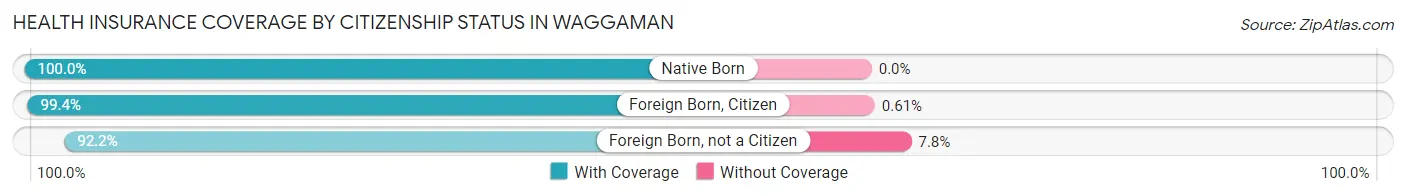
| Citizenship Status | With Coverage | Without Coverage |
| Native Born | 555 (100.0%) | 0 (0.0%) |
| Foreign Born, Citizen | 2,290 (99.4%) | 14 (0.6%) |
| Foreign Born, not a Citizen | 1,122 (92.2%) | 95 (7.8%) |
Health Insurance Coverage by Household Income in Waggaman
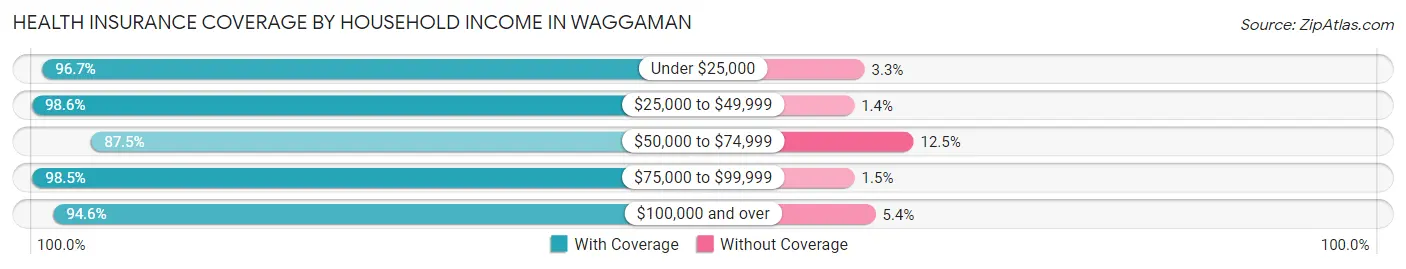
| Household Income | With Coverage | Without Coverage |
| Under $25,000 | 2,201 (96.7%) | 76 (3.3%) |
| $25,000 to $49,999 | 2,619 (98.6%) | 37 (1.4%) |
| $50,000 to $74,999 | 889 (87.5%) | 127 (12.5%) |
| $75,000 to $99,999 | 1,543 (98.5%) | 23 (1.5%) |
| $100,000 and over | 3,019 (94.6%) | 172 (5.4%) |
Public vs Private Health Insurance Coverage by Age in Waggaman
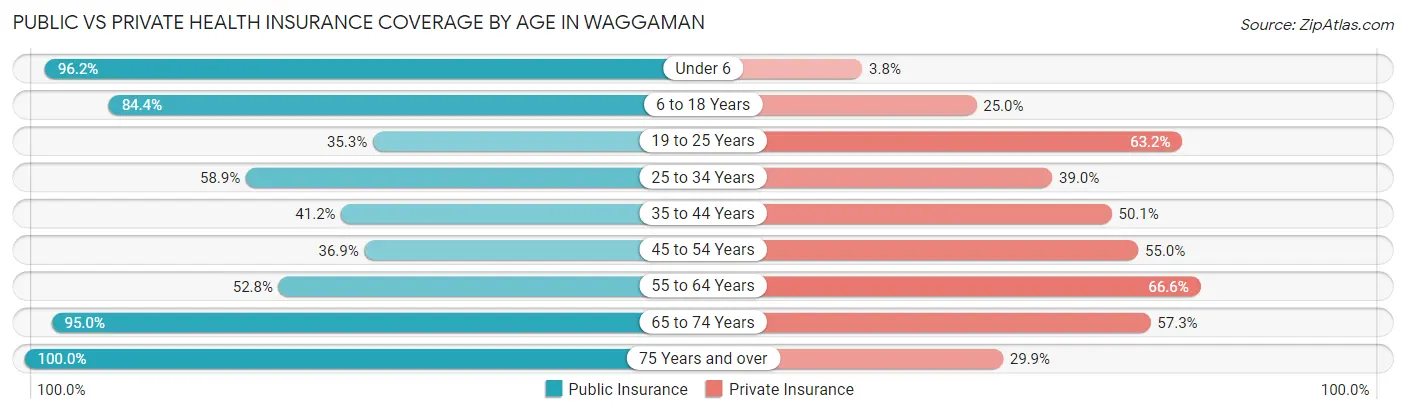
| Age Bracket | Public Insurance | Private Insurance |
| Under 6 | 534 (96.2%) | 21 (3.8%) |
| 6 to 18 Years | 1,944 (84.4%) | 575 (25.0%) |
| 19 to 25 Years | 430 (35.3%) | 769 (63.2%) |
| 25 to 34 Years | 685 (58.9%) | 454 (39.0%) |
| 35 to 44 Years | 302 (41.2%) | 367 (50.1%) |
| 45 to 54 Years | 587 (36.9%) | 875 (55.0%) |
| 55 to 64 Years | 767 (52.8%) | 967 (66.6%) |
| 65 to 74 Years | 1,025 (95.0%) | 618 (57.3%) |
| 75 Years and over | 612 (100.0%) | 183 (29.9%) |
| Total | 6,886 (64.3%) | 4,829 (45.1%) |
Disability Status by Sex by Age in Waggaman
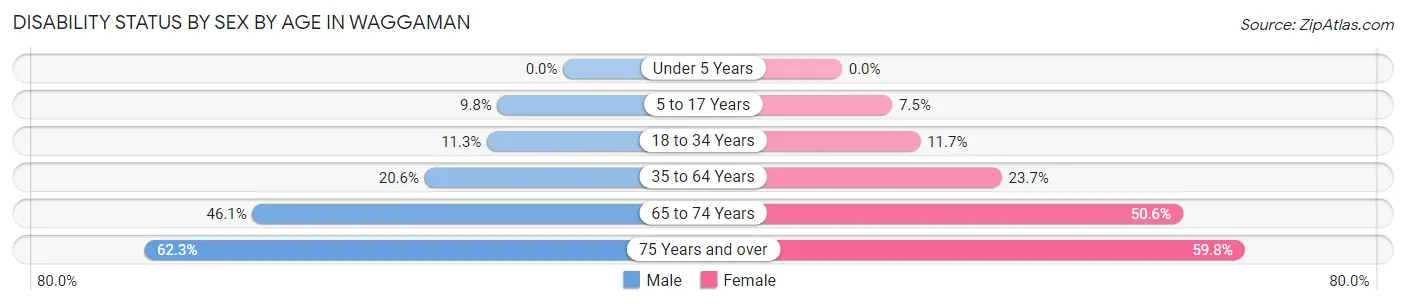
| Age Bracket | Male | Female |
| Under 5 Years | 0 (0.0%) | 0 (0.0%) |
| 5 to 17 Years | 98 (9.8%) | 99 (7.5%) |
| 18 to 34 Years | 108 (11.3%) | 179 (11.7%) |
| 35 to 64 Years | 354 (20.6%) | 488 (23.7%) |
| 65 to 74 Years | 209 (46.1%) | 317 (50.6%) |
| 75 Years and over | 203 (62.3%) | 171 (59.8%) |
Disability Class by Sex by Age in Waggaman
Disability Class: Hearing Difficulty
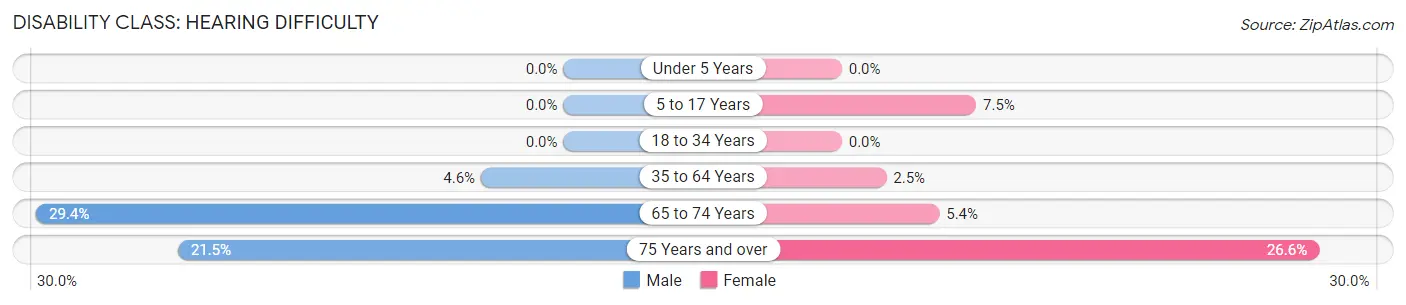
| Age Bracket | Male | Female |
| Under 5 Years | 0 (0.0%) | 0 (0.0%) |
| 5 to 17 Years | 0 (0.0%) | 99 (7.5%) |
| 18 to 34 Years | 0 (0.0%) | 0 (0.0%) |
| 35 to 64 Years | 79 (4.6%) | 51 (2.5%) |
| 65 to 74 Years | 133 (29.4%) | 34 (5.4%) |
| 75 Years and over | 70 (21.5%) | 76 (26.6%) |
Disability Class: Vision Difficulty
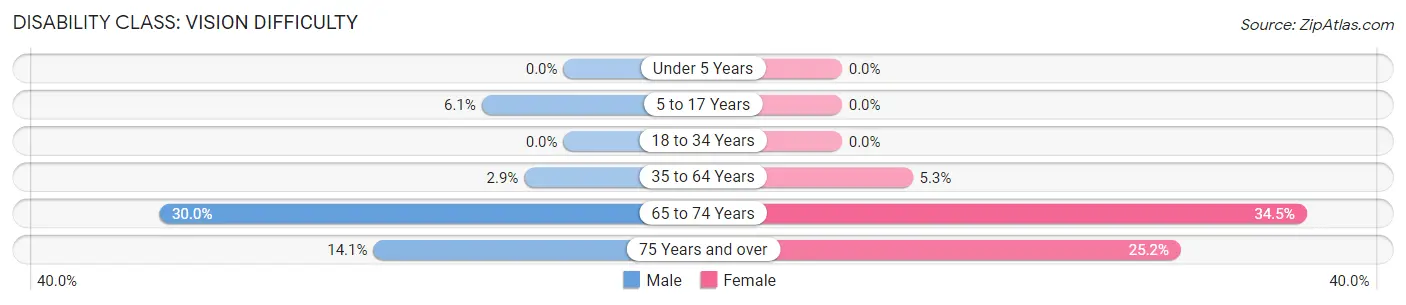
| Age Bracket | Male | Female |
| Under 5 Years | 0 (0.0%) | 0 (0.0%) |
| 5 to 17 Years | 61 (6.1%) | 0 (0.0%) |
| 18 to 34 Years | 0 (0.0%) | 0 (0.0%) |
| 35 to 64 Years | 50 (2.9%) | 108 (5.2%) |
| 65 to 74 Years | 136 (30.0%) | 216 (34.5%) |
| 75 Years and over | 46 (14.1%) | 72 (25.2%) |
Disability Class: Cognitive Difficulty
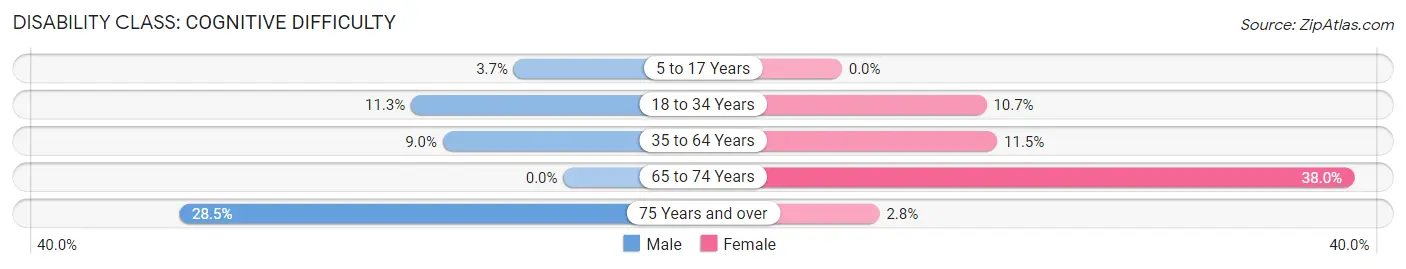
| Age Bracket | Male | Female |
| 5 to 17 Years | 37 (3.7%) | 0 (0.0%) |
| 18 to 34 Years | 108 (11.3%) | 165 (10.7%) |
| 35 to 64 Years | 154 (8.9%) | 237 (11.5%) |
| 65 to 74 Years | 0 (0.0%) | 238 (38.0%) |
| 75 Years and over | 93 (28.5%) | 8 (2.8%) |
Disability Class: Ambulatory Difficulty
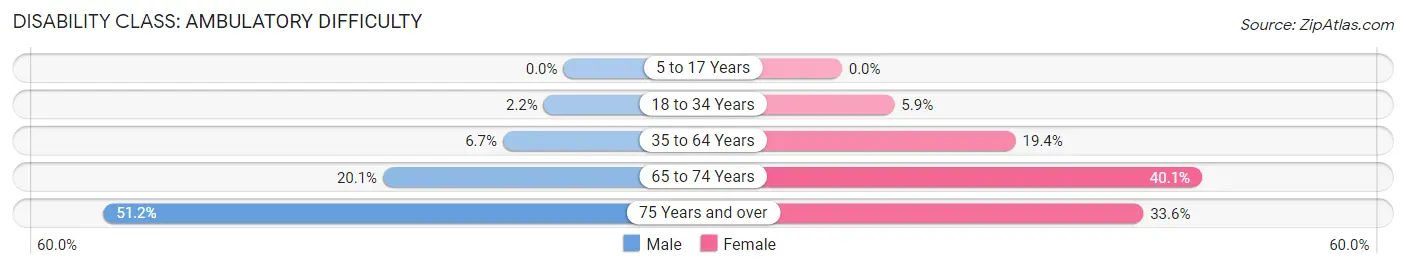
| Age Bracket | Male | Female |
| 5 to 17 Years | 0 (0.0%) | 0 (0.0%) |
| 18 to 34 Years | 21 (2.2%) | 90 (5.9%) |
| 35 to 64 Years | 116 (6.7%) | 398 (19.4%) |
| 65 to 74 Years | 91 (20.1%) | 251 (40.1%) |
| 75 Years and over | 167 (51.2%) | 96 (33.6%) |
Disability Class: Self-Care Difficulty
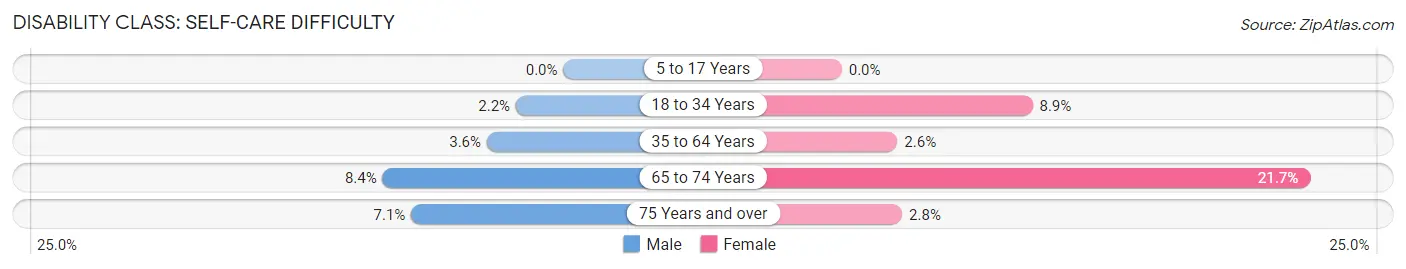
| Age Bracket | Male | Female |
| 5 to 17 Years | 0 (0.0%) | 0 (0.0%) |
| 18 to 34 Years | 21 (2.2%) | 136 (8.8%) |
| 35 to 64 Years | 61 (3.5%) | 53 (2.6%) |
| 65 to 74 Years | 38 (8.4%) | 136 (21.7%) |
| 75 Years and over | 23 (7.1%) | 8 (2.8%) |
Technology Access in Waggaman
Computing Device Access in Waggaman
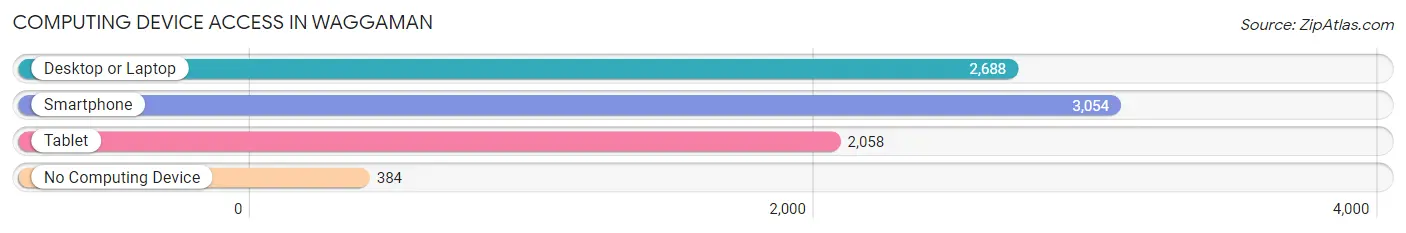
| Device Type | # Households | % Households |
| Desktop or Laptop | 2,688 | 73.6% |
| Smartphone | 3,054 | 83.7% |
| Tablet | 2,058 | 56.4% |
| No Computing Device | 384 | 10.5% |
| Total | 3,651 | 100.0% |
Internet Access in Waggaman
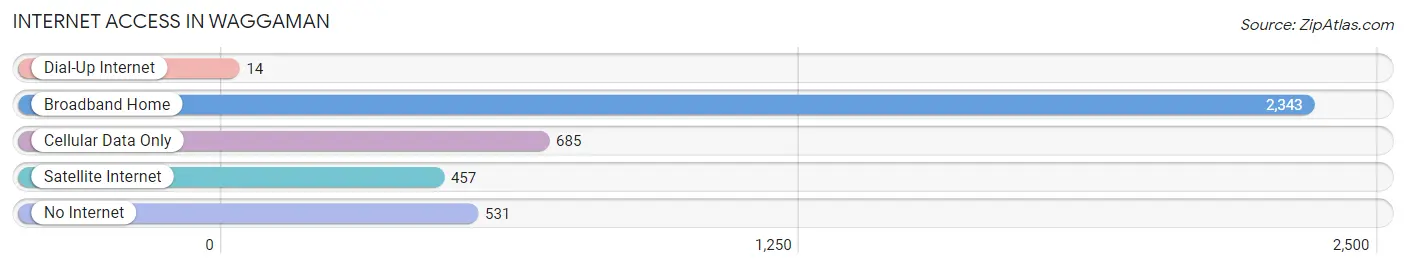
| Internet Type | # Households | % Households |
| Dial-Up Internet | 14 | 0.4% |
| Broadband Home | 2,343 | 64.2% |
| Cellular Data Only | 685 | 18.8% |
| Satellite Internet | 457 | 12.5% |
| No Internet | 531 | 14.5% |
| Total | 3,651 | 100.0% |
Waggaman Summary
Waggaman is a census-designated place (CDP) located in Jefferson Parish, Louisiana. It is situated on the west bank of the Mississippi River, about 15 miles from downtown New Orleans. The population of Waggaman was 8,873 at the 2010 census.
Geography
Waggaman is located at 29°54'25" North, 90°14'45" West (29.906833, -90.245833). According to the United States Census Bureau, the CDP has a total area of 4.3 square miles (11.2 km2), of which 4.2 square miles (10.9 km2) is land and 0.1 square mile (0.3 km2) (2.37%) is water.
History
Waggaman was founded in 1837 by William Waggaman, a wealthy planter from Maryland. He purchased a large tract of land along the Mississippi River and built a plantation home, which still stands today. The town was originally known as Waggaman's Landing, but the name was changed to Waggaman in 1891.
The town was a major port for the shipment of cotton and other goods during the 19th century. It was also a popular destination for steamboat travel. In the early 20th century, Waggaman was a popular resort town, with many hotels and restaurants.
Economy
The economy of Waggaman is largely based on the petrochemical industry. The town is home to several large chemical plants, including the Shell Chemical Plant and the Dow Chemical Plant. These plants provide jobs for many of the town's residents.
In addition to the petrochemical industry, Waggaman is also home to several small businesses, including restaurants, retail stores, and service providers. The town is also home to a number of small farms, which produce a variety of fruits and vegetables.
Demographics
As of the 2010 census, there were 8,873 people, 3,093 households, and 2,323 families residing in the CDP. The population density was 2,093.3 people per square mile (806.7/km2). There were 3,309 housing units at an average density of 786.3 per square mile (303.7/km2). The racial makeup of the CDP was 68.2% White, 24.3% African American, 0.4% Native American, 1.2% Asian, 0.1% Pacific Islander, 3.7% from other races, and 2.1% from two or more races. Hispanic or Latino of any race were 8.2% of the population.
There were 3,093 households, out of which 37.2% had children under the age of 18 living with them, 51.2% were married couples living together, 17.2% had a female householder with no husband present, and 25.2% were non-families. 20.2% of all households were made up of individuals, and 6.7% had someone living alone who was 65 years of age or older. The average household size was 2.86 and the average family size was 3.30.
In the CDP, the population was spread out, with 28.2% under the age of 18, 9.7% from 18 to 24, 28.7% from 25 to 44, 24.2% from 45 to 64, and 9.2% who were 65 years of age or older. The median age was 34 years. For every 100 females, there were 95.2 males. For every 100 females age 18 and over, there were 91.2 males.
The median income for a household in the CDP was $41,944, and the median income for a family was $46,944. Males had a median income of $37,917 versus $25,917 for females. The per capita income for the CDP was $17,944. About 10.2% of families and 12.2% of the population were below the poverty line, including 16.2% of those under age 18 and 8.2% of those age 65 or over.
Common Questions
What is Per Capita Income in Waggaman?
Per Capita income in Waggaman is $25,745.
What is the Median Family Income in Waggaman?
Median Family Income in Waggaman is $48,684.
What is the Median Household income in Waggaman?
Median Household Income in Waggaman is $45,286.
What is Income or Wage Gap in Waggaman?
Income or Wage Gap in Waggaman is 41.3%.
Women in Waggaman earn 58.7 cents for every dollar earned by a man.
What is Family Income Deficit in Waggaman?
Family Income Deficit in Waggaman is $9,894.
Families that are below poverty line in Waggaman earn $9,894 less on average than the poverty threshold level.
What is Inequality or Gini Index in Waggaman?
Inequality or Gini Index in Waggaman is 0.47.
What is the Total Population of Waggaman?
Total Population of Waggaman is 10,706.
What is the Total Male Population of Waggaman?
Total Male Population of Waggaman is 4,724.
What is the Total Female Population of Waggaman?
Total Female Population of Waggaman is 5,982.
What is the Ratio of Males per 100 Females in Waggaman?
There are 78.97 Males per 100 Females in Waggaman.
What is the Ratio of Females per 100 Males in Waggaman?
There are 126.63 Females per 100 Males in Waggaman.
What is the Median Population Age in Waggaman?
Median Population Age in Waggaman is 38.1 Years.
What is the Average Family Size in Waggaman
Average Family Size in Waggaman is 3.4 People.
What is the Average Household Size in Waggaman
Average Household Size in Waggaman is 2.9 People.
How Large is the Labor Force in Waggaman?
There are 4,966 People in the Labor Forcein in Waggaman.
What is the Percentage of People in the Labor Force in Waggaman?
58.9% of People are in the Labor Force in Waggaman.
What is the Unemployment Rate in Waggaman?
Unemployment Rate in Waggaman is 9.8%.