Jefferson, LA Map & Demographics
Jefferson Map
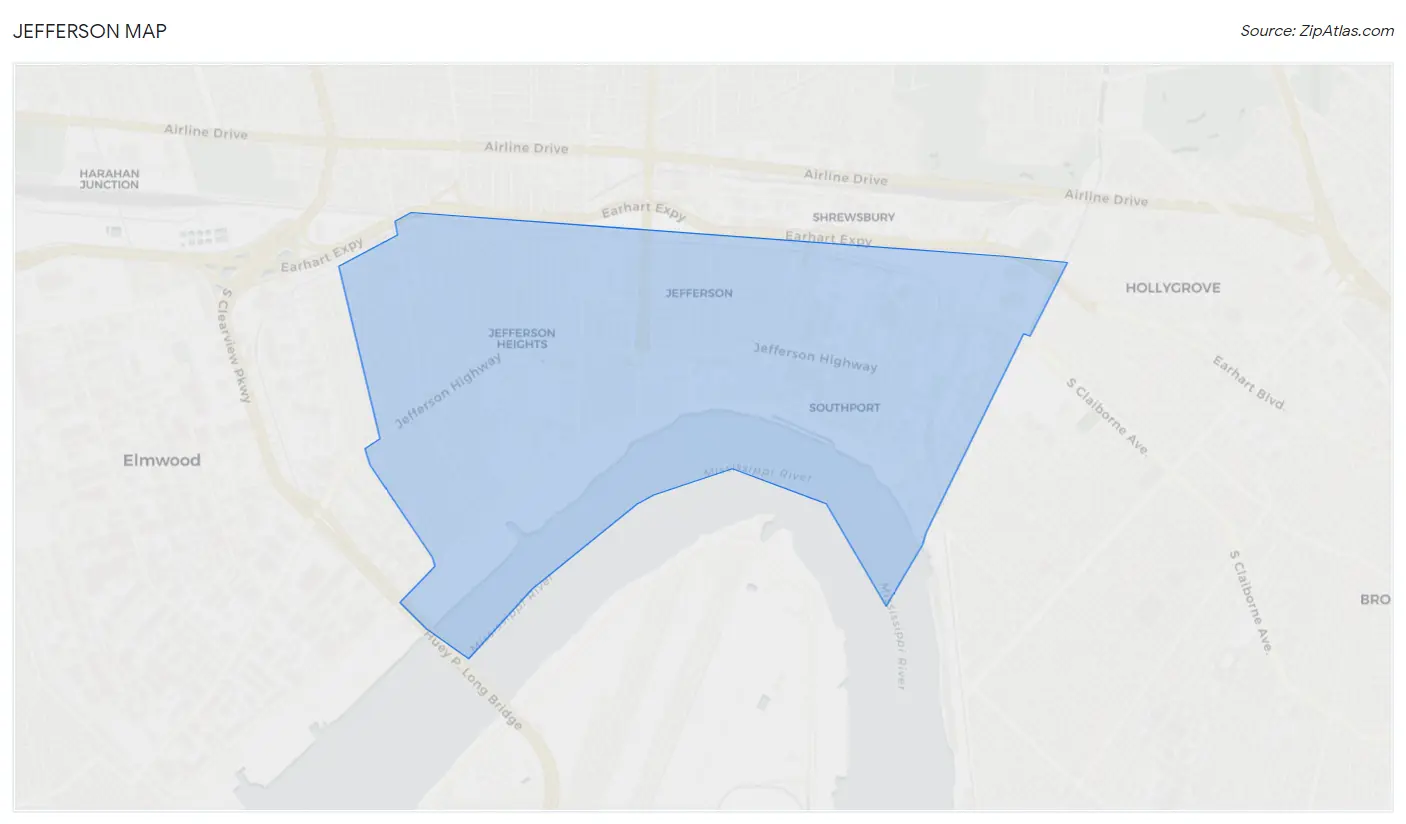
Jefferson Overview
$38,905
PER CAPITA INCOME
$66,484
AVG FAMILY INCOME
$54,808
AVG HOUSEHOLD INCOME
4.3%
WAGE / INCOME GAP [ % ]
95.7¢/ $1
WAGE / INCOME GAP [ $ ]
$7,444
FAMILY INCOME DEFICIT
0.44
INEQUALITY / GINI INDEX
10,141
TOTAL POPULATION
4,767
MALE POPULATION
5,374
FEMALE POPULATION
88.70
MALES / 100 FEMALES
112.73
FEMALES / 100 MALES
44.9
MEDIAN AGE
2.8
AVG FAMILY SIZE
1.9
AVG HOUSEHOLD SIZE
5,956
LABOR FORCE [ PEOPLE ]
68.0%
PERCENT IN LABOR FORCE
4.2%
UNEMPLOYMENT RATE
Income in Jefferson
Income Overview in Jefferson
Per Capita Income in Jefferson is $38,905, while median incomes of families and households are $66,484 and $54,808 respectively.
| Characteristic | Number | Measure |
| Per Capita Income | 10,141 | $38,905 |
| Median Family Income | 2,236 | $66,484 |
| Mean Family Income | 2,236 | $88,813 |
| Median Household Income | 5,195 | $54,808 |
| Mean Household Income | 5,195 | $73,340 |
| Income Deficit | 2,236 | $7,444 |
| Wage / Income Gap (%) | 10,141 | 4.33% |
| Wage / Income Gap ($) | 10,141 | 95.67¢ per $1 |
| Gini / Inequality Index | 10,141 | 0.44 |
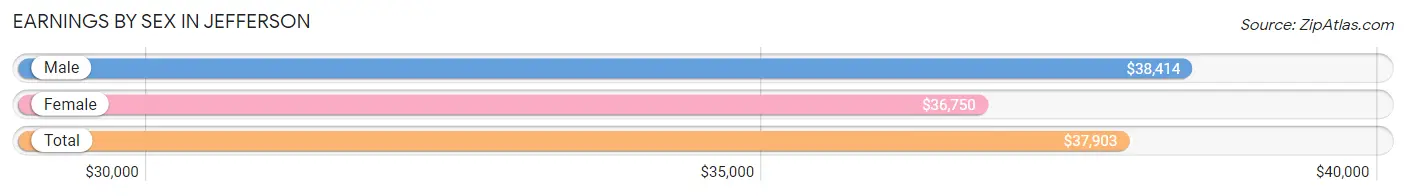
Earnings by Sex in Jefferson
Average Earnings in Jefferson are $37,903, $38,414 for men and $36,750 for women, a difference of 4.3%.
| Sex | Number | Average Earnings |
| Male | 2,884 (46.3%) | $38,414 |
| Female | 3,350 (53.7%) | $36,750 |
| Total | 6,234 (100.0%) | $37,903 |
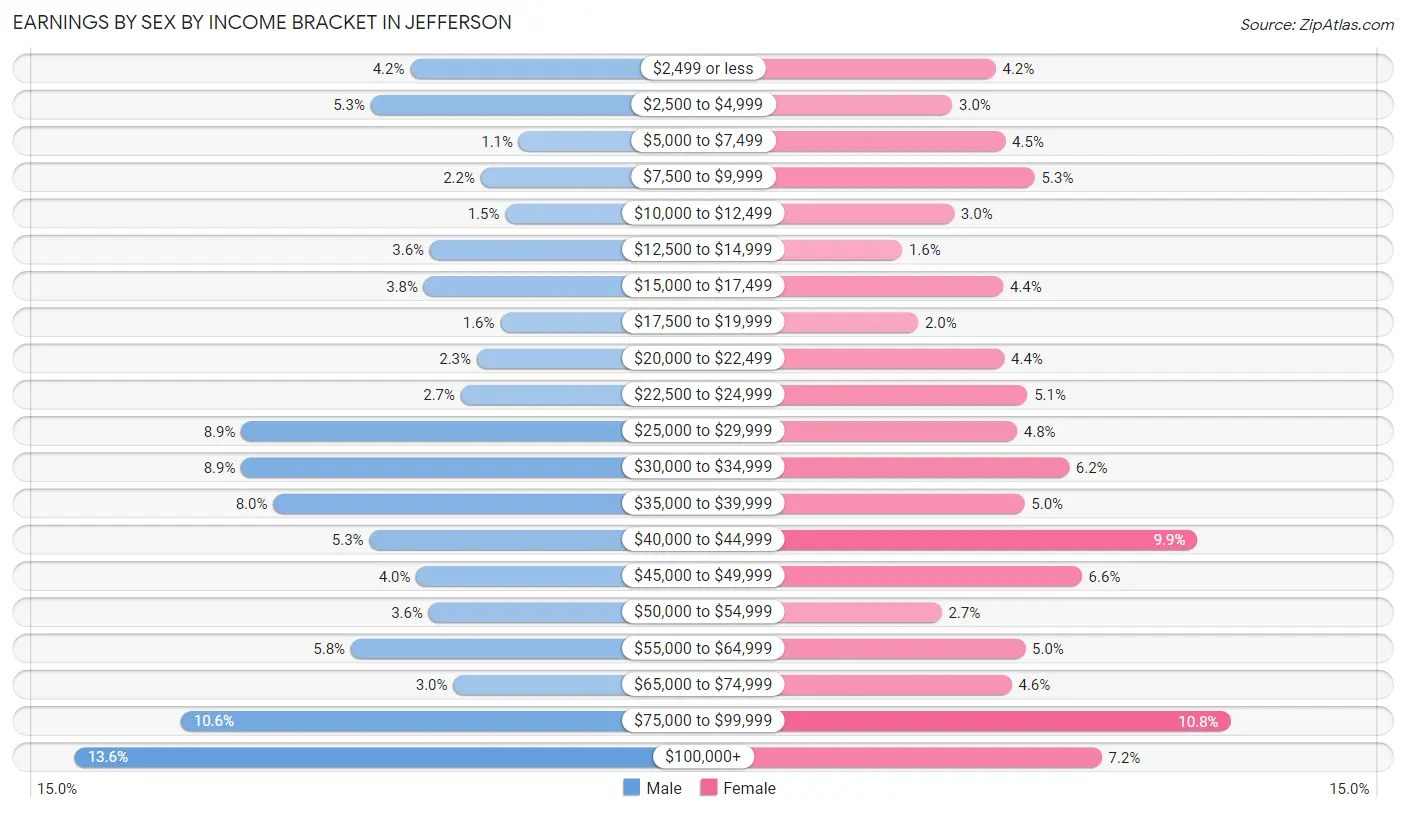
Earnings by Sex by Income Bracket in Jefferson
The most common earnings brackets in Jefferson are $100,000+ for men (392 | 13.6%) and $75,000 to $99,999 for women (361 | 10.8%).
| Income | Male | Female |
| $2,499 or less | 120 (4.2%) | 140 (4.2%) |
| $2,500 to $4,999 | 152 (5.3%) | 99 (3.0%) |
| $5,000 to $7,499 | 32 (1.1%) | 149 (4.4%) |
| $7,500 to $9,999 | 63 (2.2%) | 177 (5.3%) |
| $10,000 to $12,499 | 43 (1.5%) | 101 (3.0%) |
| $12,500 to $14,999 | 104 (3.6%) | 52 (1.5%) |
| $15,000 to $17,499 | 109 (3.8%) | 147 (4.4%) |
| $17,500 to $19,999 | 47 (1.6%) | 67 (2.0%) |
| $20,000 to $22,499 | 66 (2.3%) | 148 (4.4%) |
| $22,500 to $24,999 | 79 (2.7%) | 170 (5.1%) |
| $25,000 to $29,999 | 257 (8.9%) | 160 (4.8%) |
| $30,000 to $34,999 | 257 (8.9%) | 209 (6.2%) |
| $35,000 to $39,999 | 231 (8.0%) | 167 (5.0%) |
| $40,000 to $44,999 | 153 (5.3%) | 330 (9.9%) |
| $45,000 to $49,999 | 115 (4.0%) | 221 (6.6%) |
| $50,000 to $54,999 | 105 (3.6%) | 89 (2.7%) |
| $55,000 to $64,999 | 168 (5.8%) | 168 (5.0%) |
| $65,000 to $74,999 | 85 (2.9%) | 155 (4.6%) |
| $75,000 to $99,999 | 306 (10.6%) | 361 (10.8%) |
| $100,000+ | 392 (13.6%) | 240 (7.2%) |
| Total | 2,884 (100.0%) | 3,350 (100.0%) |
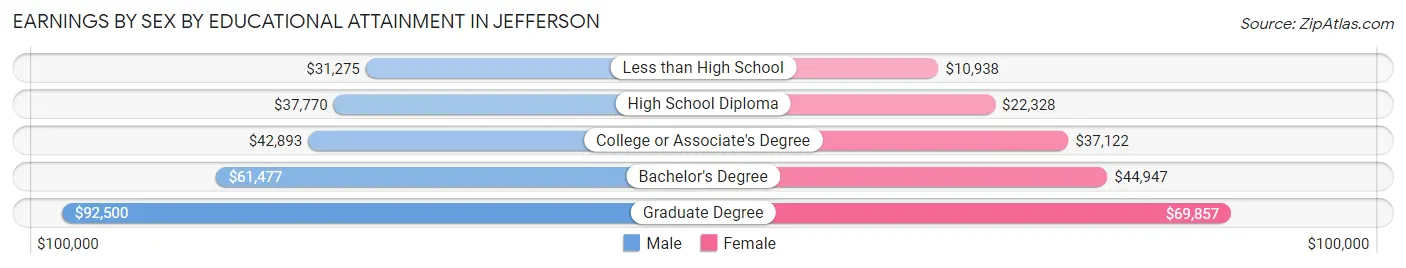
Earnings by Sex by Educational Attainment in Jefferson
Average earnings in Jefferson are $41,889 for men and $40,372 for women, a difference of 3.6%. Men with an educational attainment of graduate degree enjoy the highest average annual earnings of $92,500, while those with less than high school education earn the least with $31,275. Women with an educational attainment of graduate degree earn the most with the average annual earnings of $69,857, while those with less than high school education have the smallest earnings of $10,938.
| Educational Attainment | Male Income | Female Income |
| Less than High School | $31,275 | $10,938 |
| High School Diploma | $37,770 | $22,328 |
| College or Associate's Degree | $42,893 | $37,122 |
| Bachelor's Degree | $61,477 | $44,947 |
| Graduate Degree | $92,500 | $69,857 |
| Total | $41,889 | $40,372 |
Family Income in Jefferson
Family Income Brackets in Jefferson
According to the Jefferson family income data, there are 364 families falling into the $75,000 to $99,999 income range, which is the most common income bracket and makes up 16.3% of all families. Conversely, the $10,000 to $14,999 income bracket is the least frequent group with only 78 families (3.5%) belonging to this category.
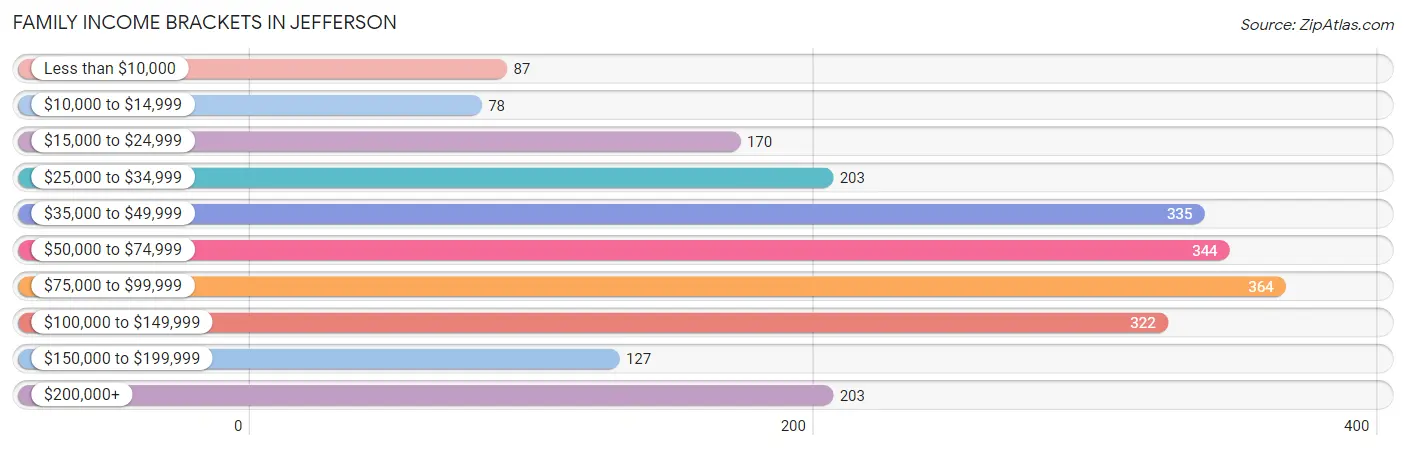
| Income Bracket | # Families | % Families |
| Less than $10,000 | 87 | 3.9% |
| $10,000 to $14,999 | 78 | 3.5% |
| $15,000 to $24,999 | 170 | 7.6% |
| $25,000 to $34,999 | 203 | 9.1% |
| $35,000 to $49,999 | 335 | 15.0% |
| $50,000 to $74,999 | 344 | 15.4% |
| $75,000 to $99,999 | 364 | 16.3% |
| $100,000 to $149,999 | 322 | 14.4% |
| $150,000 to $199,999 | 127 | 5.7% |
| $200,000+ | 203 | 9.1% |
Family Income by Famaliy Size in Jefferson
4-person families (304 | 13.6%) account for the highest median family income in Jefferson with $93,816 per family, while 2-person families (1,334 | 59.7%) have the highest median income of $31,400 per family member.
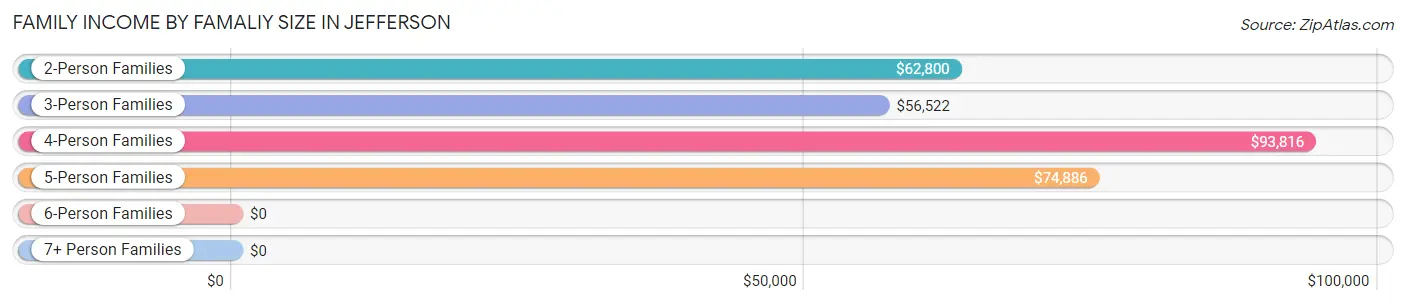
| Income Bracket | # Families | Median Income |
| 2-Person Families | 1,334 (59.7%) | $62,800 |
| 3-Person Families | 518 (23.2%) | $56,522 |
| 4-Person Families | 304 (13.6%) | $93,816 |
| 5-Person Families | 67 (3.0%) | $74,886 |
| 6-Person Families | 11 (0.5%) | $0 |
| 7+ Person Families | 2 (0.1%) | $0 |
| Total | 2,236 (100.0%) | $66,484 |
Family Income by Number of Earners in Jefferson
The median family income in Jefferson is $66,484, with families comprising 3+ earners (131) having the highest median family income of $110,825, while families with 1 earner (896) have the lowest median family income of $41,338, accounting for 5.9% and 40.1% of families, respectively.
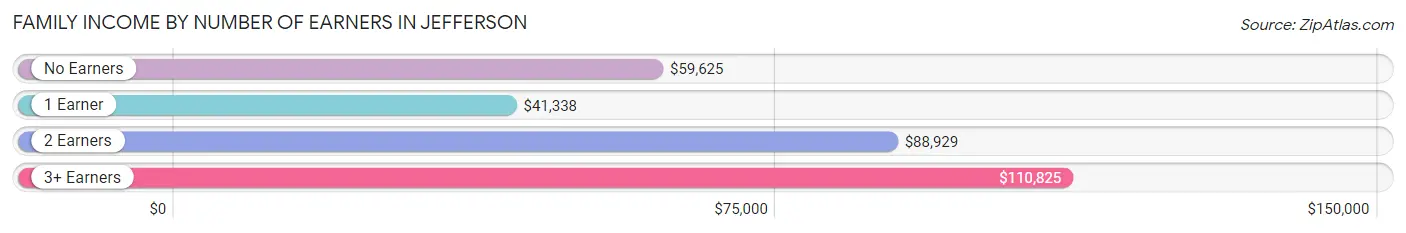
| Number of Earners | # Families | Median Income |
| No Earners | 189 (8.5%) | $59,625 |
| 1 Earner | 896 (40.1%) | $41,338 |
| 2 Earners | 1,020 (45.6%) | $88,929 |
| 3+ Earners | 131 (5.9%) | $110,825 |
| Total | 2,236 (100.0%) | $66,484 |
Household Income in Jefferson
Household Income Brackets in Jefferson
With 836 households falling in the category, the $35,000 to $49,999 income range is the most frequent in Jefferson, accounting for 16.1% of all households. In contrast, only 218 households (4.2%) fall into the $150,000 to $199,999 income bracket, making it the least populous group.
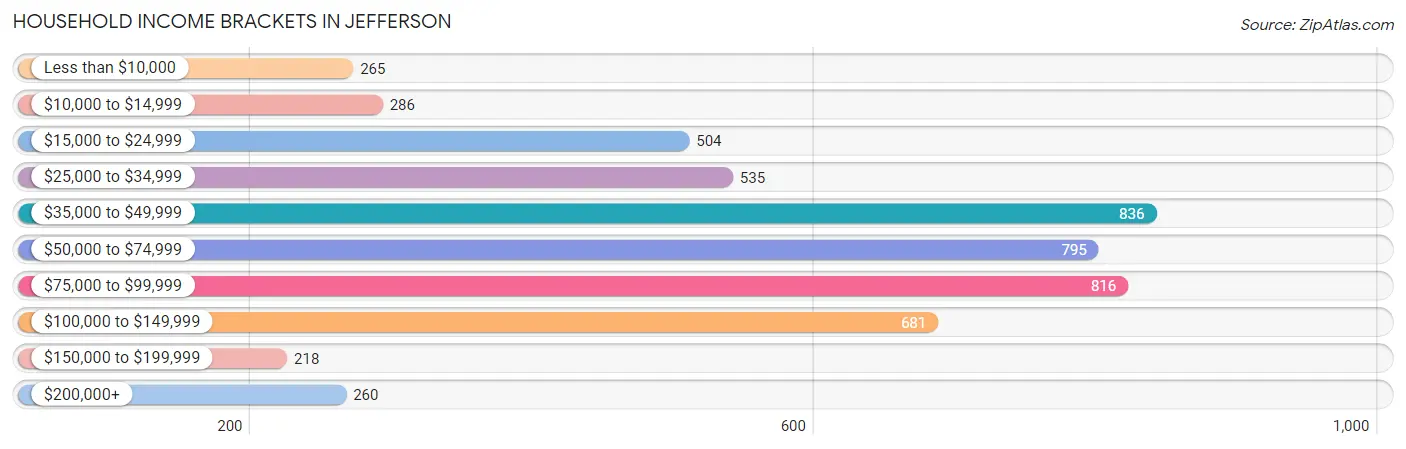
| Income Bracket | # Households | % Households |
| Less than $10,000 | 265 | 5.1% |
| $10,000 to $14,999 | 286 | 5.5% |
| $15,000 to $24,999 | 504 | 9.7% |
| $25,000 to $34,999 | 535 | 10.3% |
| $35,000 to $49,999 | 836 | 16.1% |
| $50,000 to $74,999 | 795 | 15.3% |
| $75,000 to $99,999 | 816 | 15.7% |
| $100,000 to $149,999 | 681 | 13.1% |
| $150,000 to $199,999 | 218 | 4.2% |
| $200,000+ | 260 | 5.0% |
Household Income by Householder Age in Jefferson
The median household income in Jefferson is $54,808, with the highest median household income of $69,983 found in the 45 to 64 years age bracket for the primary householder. A total of 2,075 households (39.9%) fall into this category. Meanwhile, the 15 to 24 years age bracket for the primary householder has the lowest median household income of $27,384, with 222 households (4.3%) in this group.
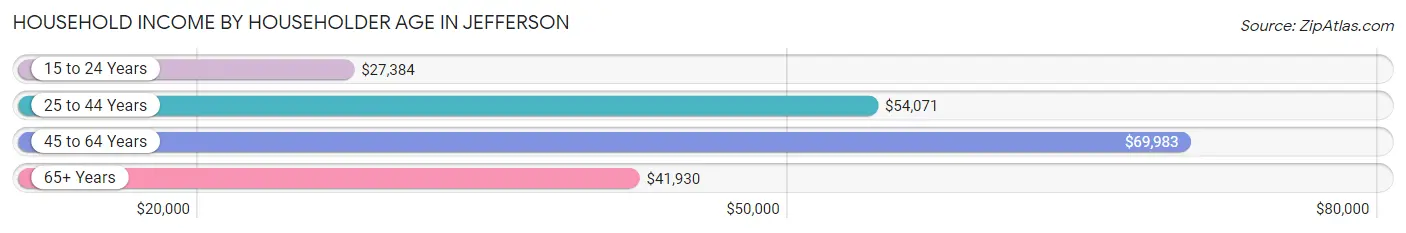
| Income Bracket | # Households | Median Income |
| 15 to 24 Years | 222 (4.3%) | $27,384 |
| 25 to 44 Years | 1,446 (27.8%) | $54,071 |
| 45 to 64 Years | 2,075 (39.9%) | $69,983 |
| 65+ Years | 1,452 (28.0%) | $41,930 |
| Total | 5,195 (100.0%) | $54,808 |
Poverty in Jefferson
Income Below Poverty by Sex and Age in Jefferson
With 9.4% poverty level for males and 14.6% for females among the residents of Jefferson, under 5 year old males and 12 to 14 year old females are the most vulnerable to poverty, with 63 males (25.3%) and 91 females (39.2%) in their respective age groups living below the poverty level.
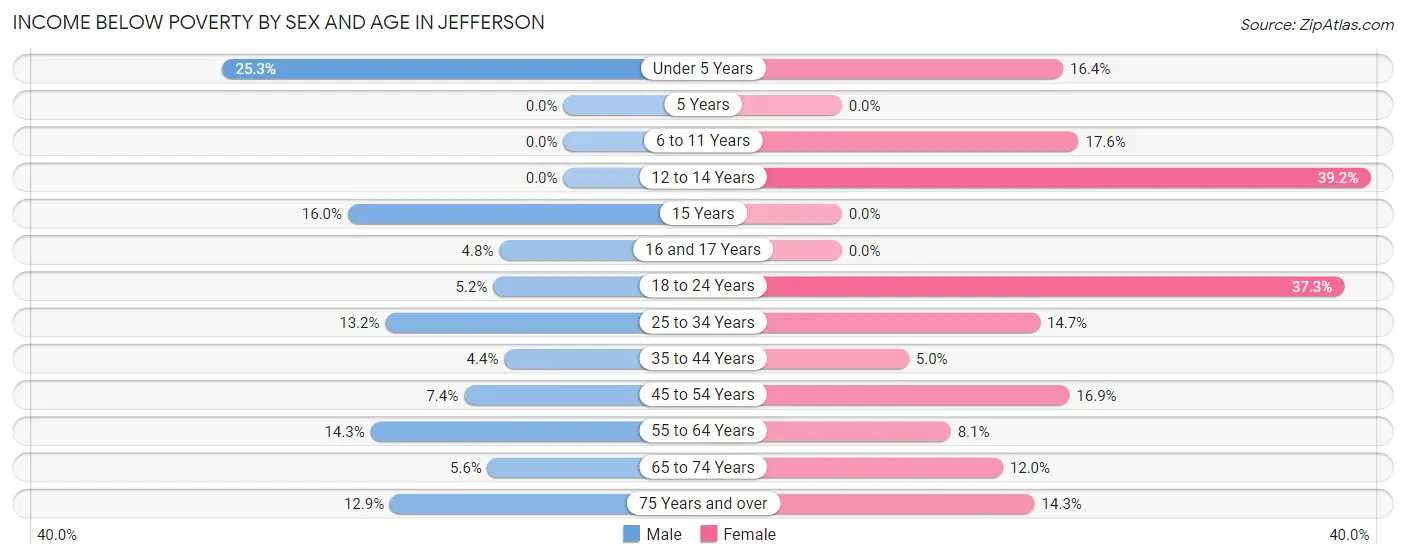
| Age Bracket | Male | Female |
| Under 5 Years | 63 (25.3%) | 23 (16.4%) |
| 5 Years | 0 (0.0%) | 0 (0.0%) |
| 6 to 11 Years | 0 (0.0%) | 48 (17.6%) |
| 12 to 14 Years | 0 (0.0%) | 91 (39.2%) |
| 15 Years | 8 (16.0%) | 0 (0.0%) |
| 16 and 17 Years | 8 (4.8%) | 0 (0.0%) |
| 18 to 24 Years | 17 (5.2%) | 132 (37.3%) |
| 25 to 34 Years | 78 (13.2%) | 114 (14.7%) |
| 35 to 44 Years | 34 (4.4%) | 31 (5.0%) |
| 45 to 54 Years | 33 (7.4%) | 122 (16.9%) |
| 55 to 64 Years | 124 (14.3%) | 78 (8.1%) |
| 65 to 74 Years | 28 (5.6%) | 77 (12.0%) |
| 75 Years and over | 48 (12.9%) | 57 (14.3%) |
| Total | 441 (9.4%) | 773 (14.6%) |
Income Above Poverty by Sex and Age in Jefferson
According to the poverty statistics in Jefferson, males aged 6 to 11 years and females aged 5 years are the age groups that are most secure financially, with 100.0% of males and 100.0% of females in these age groups living above the poverty line.
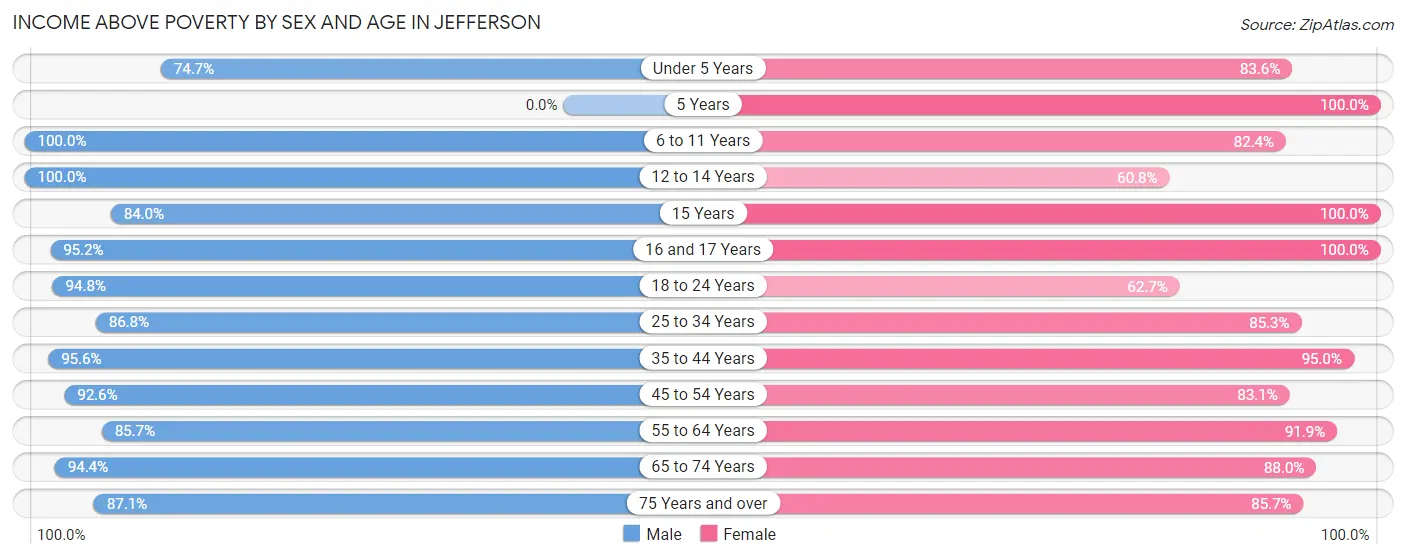
| Age Bracket | Male | Female |
| Under 5 Years | 186 (74.7%) | 117 (83.6%) |
| 5 Years | 0 (0.0%) | 67 (100.0%) |
| 6 to 11 Years | 244 (100.0%) | 225 (82.4%) |
| 12 to 14 Years | 109 (100.0%) | 141 (60.8%) |
| 15 Years | 42 (84.0%) | 18 (100.0%) |
| 16 and 17 Years | 160 (95.2%) | 87 (100.0%) |
| 18 to 24 Years | 309 (94.8%) | 222 (62.7%) |
| 25 to 34 Years | 512 (86.8%) | 661 (85.3%) |
| 35 to 44 Years | 741 (95.6%) | 592 (95.0%) |
| 45 to 54 Years | 415 (92.6%) | 600 (83.1%) |
| 55 to 64 Years | 742 (85.7%) | 886 (91.9%) |
| 65 to 74 Years | 470 (94.4%) | 567 (88.0%) |
| 75 Years and over | 325 (87.1%) | 341 (85.7%) |
| Total | 4,255 (90.6%) | 4,524 (85.4%) |
Income Below Poverty Among Married-Couple Families in Jefferson
The poverty statistics for married-couple families in Jefferson show that 5.3% or 64 of the total 1,203 families live below the poverty line. Families with no children have the highest poverty rate of 5.7%, comprising of 45 families. On the other hand, families with 3 or 4 children have the lowest poverty rate of 0.0%, which includes 0 families.
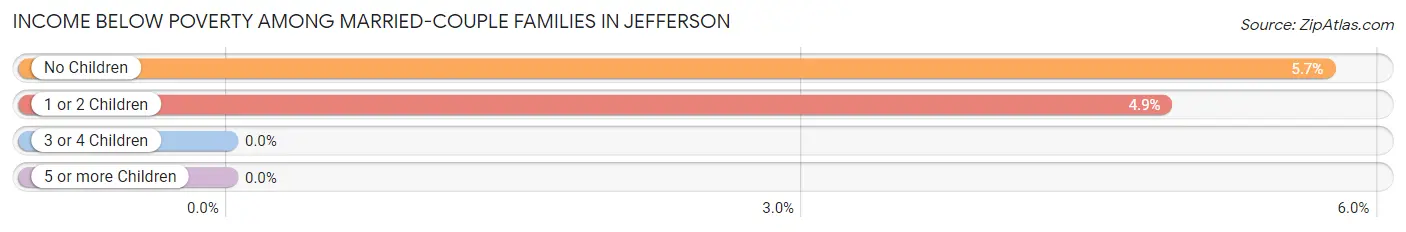
| Children | Above Poverty | Below Poverty |
| No Children | 740 (94.3%) | 45 (5.7%) |
| 1 or 2 Children | 370 (95.1%) | 19 (4.9%) |
| 3 or 4 Children | 29 (100.0%) | 0 (0.0%) |
| 5 or more Children | 0 (0.0%) | 0 (0.0%) |
| Total | 1,139 (94.7%) | 64 (5.3%) |
Income Below Poverty Among Single-Parent Households in Jefferson
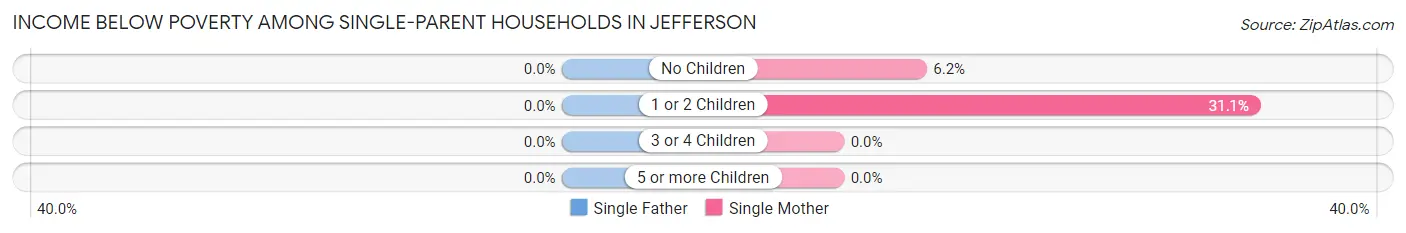
| Children | Single Father | Single Mother |
| No Children | 0 (0.0%) | 22 (6.2%) |
| 1 or 2 Children | 0 (0.0%) | 152 (31.1%) |
| 3 or 4 Children | 0 (0.0%) | 0 (0.0%) |
| 5 or more Children | 0 (0.0%) | 0 (0.0%) |
| Total | 0 (0.0%) | 174 (20.2%) |
Income Below Poverty Among Married-Couple vs Single-Parent Households in Jefferson
The poverty data for Jefferson shows that 64 of the married-couple family households (5.3%) and 174 of the single-parent households (16.8%) are living below the poverty level. Within the married-couple family households, those with no children have the highest poverty rate, with 45 households (5.7%) falling below the poverty line. Among the single-parent households, those with 1 or 2 children have the highest poverty rate, with 152 household (27.1%) living below poverty.
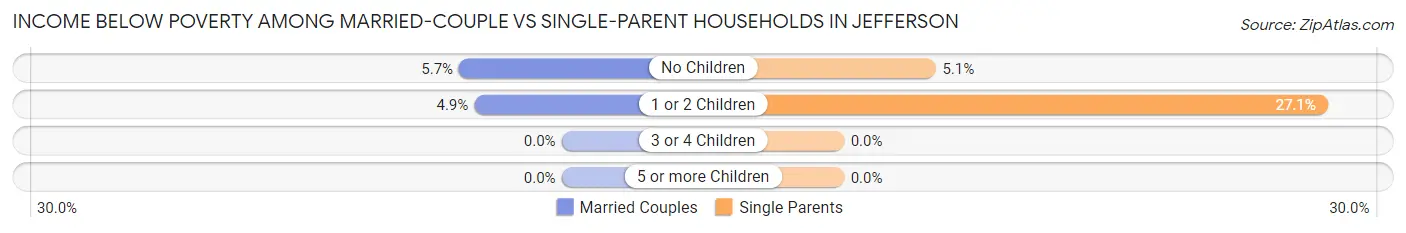
| Children | Married-Couple Families | Single-Parent Households |
| No Children | 45 (5.7%) | 22 (5.1%) |
| 1 or 2 Children | 19 (4.9%) | 152 (27.1%) |
| 3 or 4 Children | 0 (0.0%) | 0 (0.0%) |
| 5 or more Children | 0 (0.0%) | 0 (0.0%) |
| Total | 64 (5.3%) | 174 (16.8%) |
Race in Jefferson
The most populous races in Jefferson are White / Caucasian (6,847 | 67.5%), Black / African American (2,480 | 24.5%), and Hispanic or Latino (959 | 9.5%).
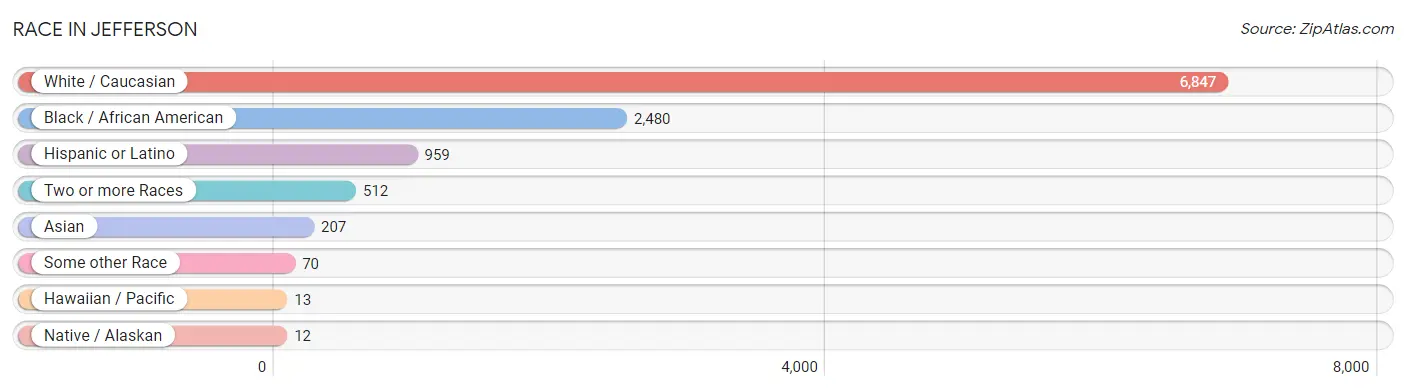
| Race | # Population | % Population |
| Asian | 207 | 2.0% |
| Black / African American | 2,480 | 24.5% |
| Hawaiian / Pacific | 13 | 0.1% |
| Hispanic or Latino | 959 | 9.5% |
| Native / Alaskan | 12 | 0.1% |
| White / Caucasian | 6,847 | 67.5% |
| Two or more Races | 512 | 5.1% |
| Some other Race | 70 | 0.7% |
| Total | 10,141 | 100.0% |
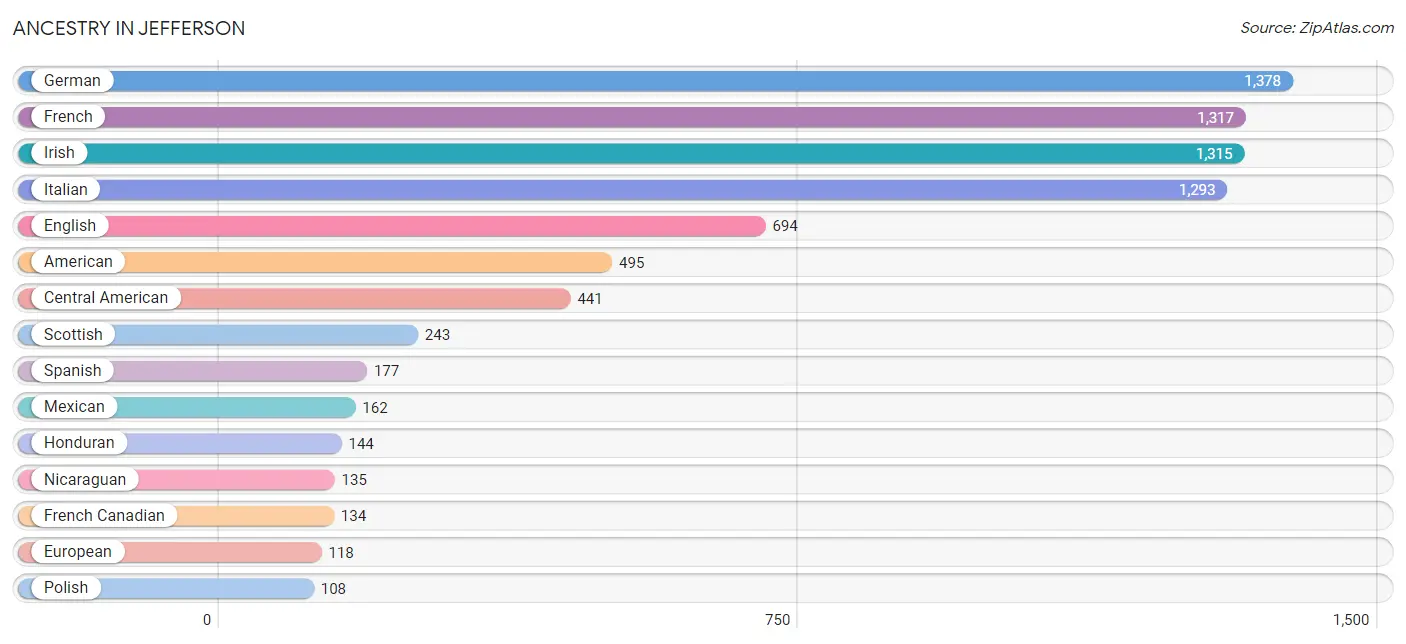
Ancestry in Jefferson
The most populous ancestries reported in Jefferson are German (1,378 | 13.6%), French (1,317 | 13.0%), Irish (1,315 | 13.0%), Italian (1,293 | 12.8%), and English (694 | 6.8%), together accounting for 59.1% of all Jefferson residents.
| Ancestry | # Population | % Population |
| African | 18 | 0.2% |
| American | 495 | 4.9% |
| Arab | 52 | 0.5% |
| Armenian | 7 | 0.1% |
| Bhutanese | 21 | 0.2% |
| Brazilian | 48 | 0.5% |
| British | 42 | 0.4% |
| Burmese | 21 | 0.2% |
| Cajun | 31 | 0.3% |
| Canadian | 22 | 0.2% |
| Central American | 441 | 4.3% |
| Central American Indian | 9 | 0.1% |
| Cherokee | 9 | 0.1% |
| Colombian | 45 | 0.4% |
| Costa Rican | 12 | 0.1% |
| Cuban | 23 | 0.2% |
| Dominican | 24 | 0.2% |
| Dutch | 76 | 0.7% |
| Eastern European | 3 | 0.0% |
| English | 694 | 6.8% |
| European | 118 | 1.2% |
| Filipino | 20 | 0.2% |
| French | 1,317 | 13.0% |
| French Canadian | 134 | 1.3% |
| German | 1,378 | 13.6% |
| Greek | 29 | 0.3% |
| Haitian | 19 | 0.2% |
| Honduran | 144 | 1.4% |
| Hungarian | 8 | 0.1% |
| Indian (Asian) | 25 | 0.3% |
| Irish | 1,315 | 13.0% |
| Italian | 1,293 | 12.8% |
| Korean | 62 | 0.6% |
| Lebanese | 39 | 0.4% |
| Lithuanian | 9 | 0.1% |
| Mexican | 162 | 1.6% |
| Native Hawaiian | 26 | 0.3% |
| Nicaraguan | 135 | 1.3% |
| Northern European | 5 | 0.1% |
| Norwegian | 22 | 0.2% |
| Osage | 9 | 0.1% |
| Pakistani | 14 | 0.1% |
| Peruvian | 4 | 0.0% |
| Polish | 108 | 1.1% |
| Portuguese | 33 | 0.3% |
| Puerto Rican | 34 | 0.3% |
| Russian | 17 | 0.2% |
| Salvadoran | 38 | 0.4% |
| Scotch-Irish | 65 | 0.6% |
| Scottish | 243 | 2.4% |
| Sioux | 5 | 0.1% |
| Slovak | 7 | 0.1% |
| South American | 49 | 0.5% |
| Spaniard | 34 | 0.3% |
| Spanish | 177 | 1.8% |
| Sri Lankan | 56 | 0.5% |
| Subsaharan African | 18 | 0.2% |
| Swedish | 14 | 0.1% |
| Swiss | 11 | 0.1% |
| Thai | 19 | 0.2% |
| Welsh | 24 | 0.2% | View All 61 Rows |
Immigrants in Jefferson
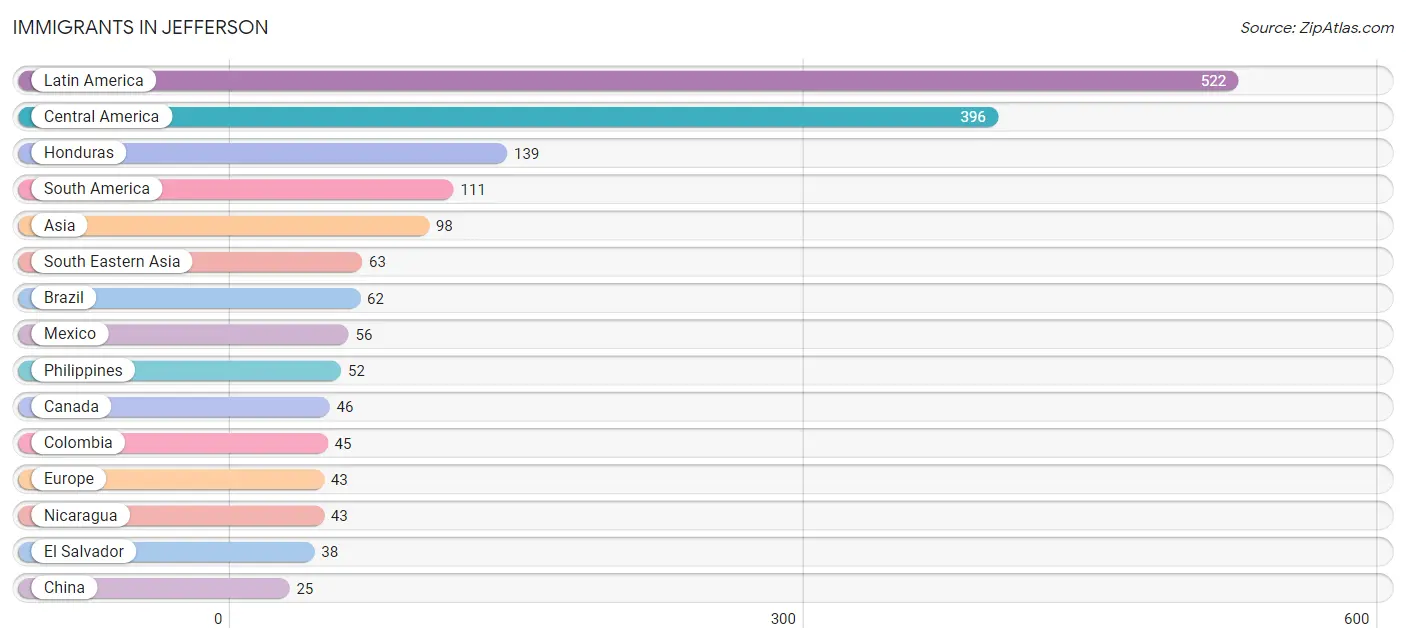
The most numerous immigrant groups reported in Jefferson came from Latin America (522 | 5.1%), Central America (396 | 3.9%), Honduras (139 | 1.4%), South America (111 | 1.1%), and Asia (98 | 1.0%), together accounting for 12.5% of all Jefferson residents.
| Immigration Origin | # Population | % Population |
| Africa | 24 | 0.2% |
| Asia | 98 | 1.0% |
| Belize | 8 | 0.1% |
| Brazil | 62 | 0.6% |
| Canada | 46 | 0.4% |
| Caribbean | 15 | 0.2% |
| Central America | 396 | 3.9% |
| China | 25 | 0.3% |
| Colombia | 45 | 0.4% |
| Costa Rica | 7 | 0.1% |
| Cuba | 5 | 0.1% |
| Eastern Asia | 25 | 0.3% |
| El Salvador | 38 | 0.4% |
| England | 5 | 0.1% |
| Europe | 43 | 0.4% |
| France | 7 | 0.1% |
| Greece | 13 | 0.1% |
| Honduras | 139 | 1.4% |
| India | 10 | 0.1% |
| Latin America | 522 | 5.1% |
| Mexico | 56 | 0.5% |
| Nicaragua | 43 | 0.4% |
| Nigeria | 11 | 0.1% |
| Northern Africa | 13 | 0.1% |
| Northern Europe | 5 | 0.1% |
| Peru | 4 | 0.0% |
| Philippines | 52 | 0.5% |
| South America | 111 | 1.1% |
| South Central Asia | 10 | 0.1% |
| South Eastern Asia | 63 | 0.6% |
| Southern Europe | 21 | 0.2% |
| Spain | 8 | 0.1% |
| Switzerland | 10 | 0.1% |
| Vietnam | 11 | 0.1% |
| Western Africa | 11 | 0.1% |
| Western Europe | 17 | 0.2% | View All 36 Rows |
Sex and Age in Jefferson
Sex and Age in Jefferson
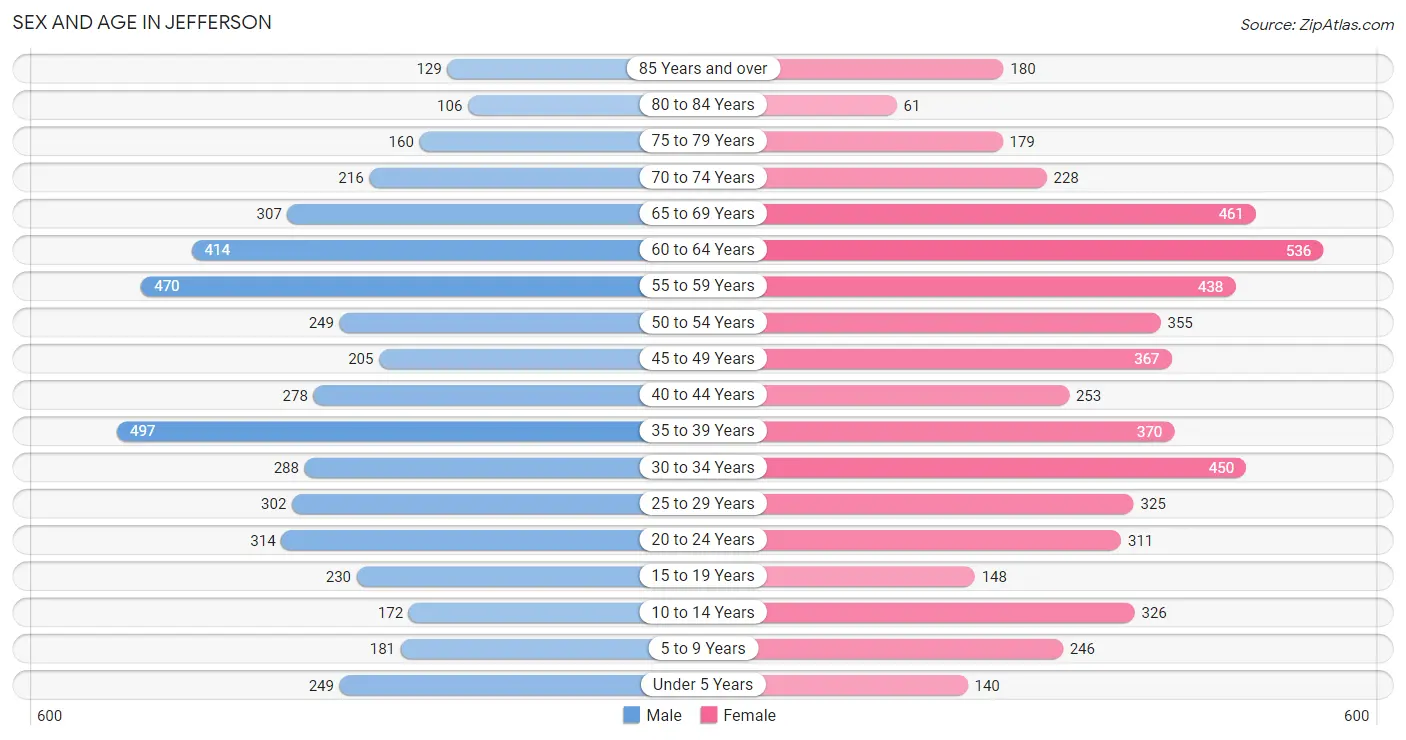
The most populous age groups in Jefferson are 35 to 39 Years (497 | 10.4%) for men and 60 to 64 Years (536 | 10.0%) for women.
| Age Bracket | Male | Female |
| Under 5 Years | 249 (5.2%) | 140 (2.6%) |
| 5 to 9 Years | 181 (3.8%) | 246 (4.6%) |
| 10 to 14 Years | 172 (3.6%) | 326 (6.1%) |
| 15 to 19 Years | 230 (4.8%) | 148 (2.8%) |
| 20 to 24 Years | 314 (6.6%) | 311 (5.8%) |
| 25 to 29 Years | 302 (6.3%) | 325 (6.0%) |
| 30 to 34 Years | 288 (6.0%) | 450 (8.4%) |
| 35 to 39 Years | 497 (10.4%) | 370 (6.9%) |
| 40 to 44 Years | 278 (5.8%) | 253 (4.7%) |
| 45 to 49 Years | 205 (4.3%) | 367 (6.8%) |
| 50 to 54 Years | 249 (5.2%) | 355 (6.6%) |
| 55 to 59 Years | 470 (9.9%) | 438 (8.2%) |
| 60 to 64 Years | 414 (8.7%) | 536 (10.0%) |
| 65 to 69 Years | 307 (6.4%) | 461 (8.6%) |
| 70 to 74 Years | 216 (4.5%) | 228 (4.2%) |
| 75 to 79 Years | 160 (3.4%) | 179 (3.3%) |
| 80 to 84 Years | 106 (2.2%) | 61 (1.1%) |
| 85 Years and over | 129 (2.7%) | 180 (3.4%) |
| Total | 4,767 (100.0%) | 5,374 (100.0%) |
Families and Households in Jefferson
Median Family Size in Jefferson
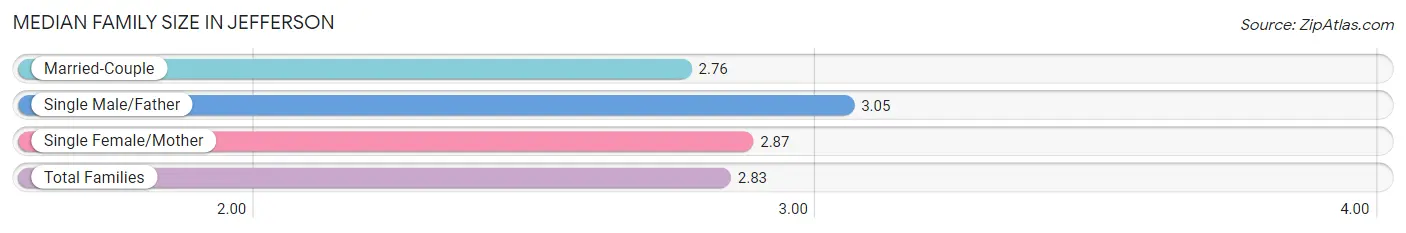
The median family size in Jefferson is 2.83 persons per family, with single male/father families (172 | 7.7%) accounting for the largest median family size of 3.05 persons per family. On the other hand, married-couple families (1,203 | 53.8%) represent the smallest median family size with 2.76 persons per family.
| Family Type | # Families | Family Size |
| Married-Couple | 1,203 (53.8%) | 2.76 |
| Single Male/Father | 172 (7.7%) | 3.05 |
| Single Female/Mother | 861 (38.5%) | 2.87 |
| Total Families | 2,236 (100.0%) | 2.83 |
Median Household Size in Jefferson
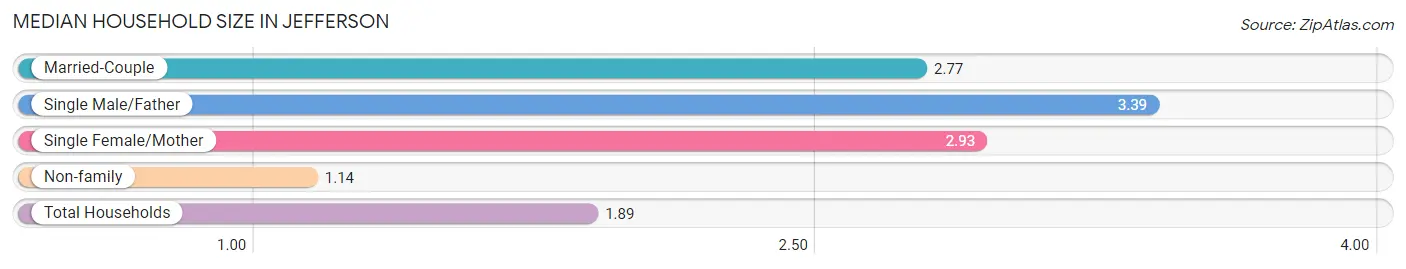
The median household size in Jefferson is 1.89 persons per household, with single male/father households (172 | 3.3%) accounting for the largest median household size of 3.39 persons per household. non-family households (2,959 | 57.0%) represent the smallest median household size with 1.14 persons per household.
| Household Type | # Households | Household Size |
| Married-Couple | 1,203 (23.2%) | 2.77 |
| Single Male/Father | 172 (3.3%) | 3.39 |
| Single Female/Mother | 861 (16.6%) | 2.93 |
| Non-family | 2,959 (57.0%) | 1.14 |
| Total Households | 5,195 (100.0%) | 1.89 |
Household Size by Marriage Status in Jefferson
Out of a total of 5,195 households in Jefferson, 2,236 (43.0%) are family households, while 2,959 (57.0%) are nonfamily households. The most numerous type of family households are 2-person households, comprising 1,272, and the most common type of nonfamily households are 1-person households, comprising 2,608.
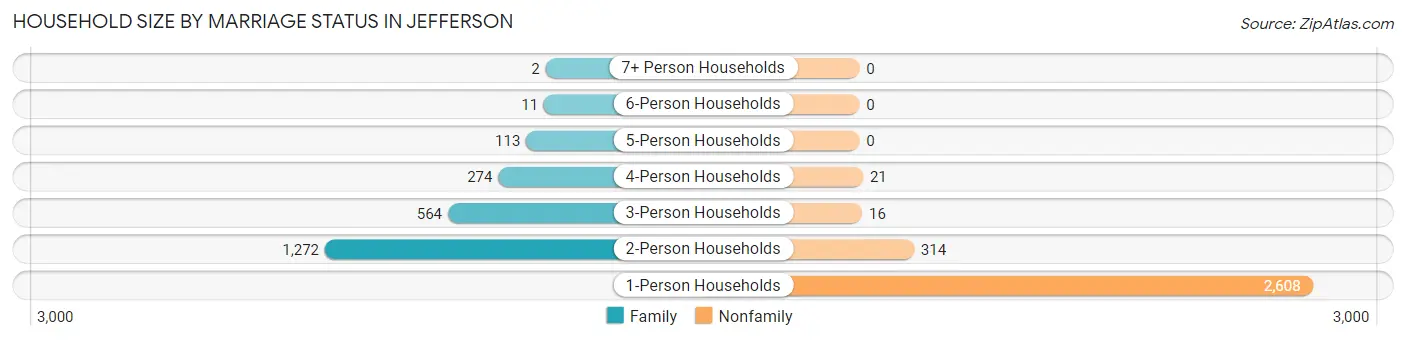
| Household Size | Family Households | Nonfamily Households |
| 1-Person Households | - | 2,608 (50.2%) |
| 2-Person Households | 1,272 (24.5%) | 314 (6.0%) |
| 3-Person Households | 564 (10.9%) | 16 (0.3%) |
| 4-Person Households | 274 (5.3%) | 21 (0.4%) |
| 5-Person Households | 113 (2.2%) | 0 (0.0%) |
| 6-Person Households | 11 (0.2%) | 0 (0.0%) |
| 7+ Person Households | 2 (0.0%) | 0 (0.0%) |
| Total | 2,236 (43.0%) | 2,959 (57.0%) |
Female Fertility in Jefferson
Fertility by Age in Jefferson
Average fertility rate in Jefferson is 67.0 births per 1,000 women. Women in the age bracket of 20 to 34 years have the highest fertility rate with 108.0 births per 1,000 women. Women in the age bracket of 20 to 34 years acount for 76.0% of all women with births.
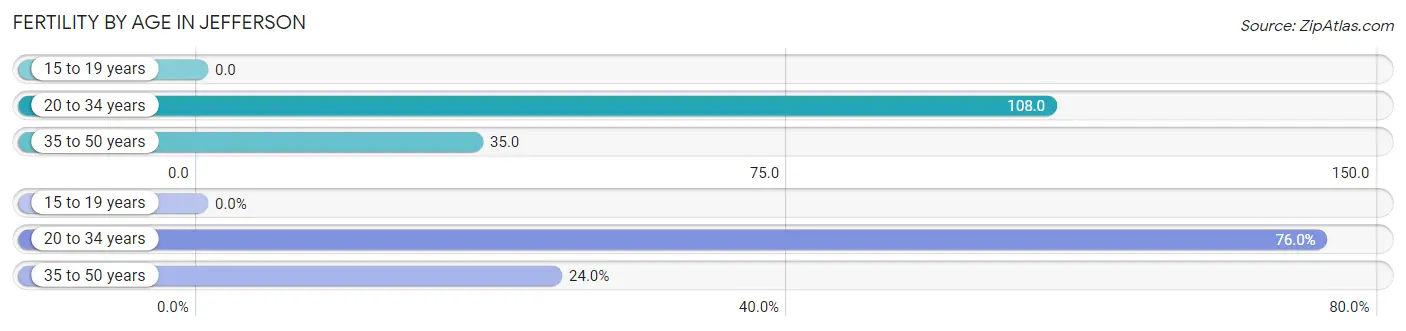
| Age Bracket | Women with Births | Births / 1,000 Women |
| 15 to 19 years | 0 (0.0%) | 0.0 |
| 20 to 34 years | 117 (76.0%) | 108.0 |
| 35 to 50 years | 37 (24.0%) | 35.0 |
| Total | 154 (100.0%) | 67.0 |
Fertility by Age by Marriage Status in Jefferson
60.4% of women with births (154) in Jefferson are married. The highest percentage of unmarried women with births falls into 20 to 34 years age bracket with 52.1% of them unmarried at the time of birth, while the lowest percentage of unmarried women with births belong to 35 to 50 years age bracket with 0.0% of them unmarried.
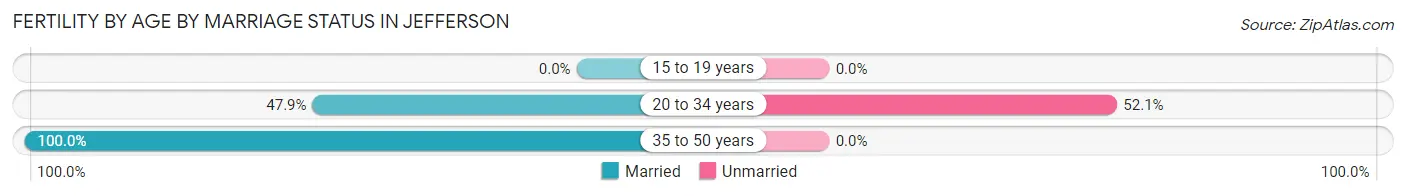
| Age Bracket | Married | Unmarried |
| 15 to 19 years | 0 (0.0%) | 0 (0.0%) |
| 20 to 34 years | 56 (47.9%) | 61 (52.1%) |
| 35 to 50 years | 37 (100.0%) | 0 (0.0%) |
| Total | 93 (60.4%) | 61 (39.6%) |
Fertility by Education in Jefferson
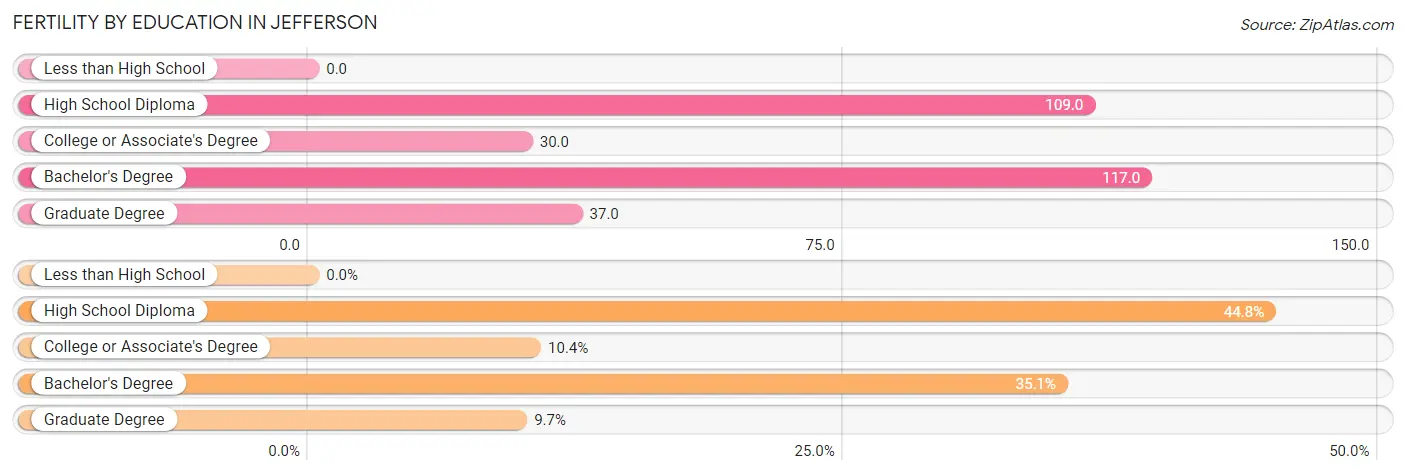
| Educational Attainment | Women with Births | Births / 1,000 Women |
| Less than High School | 0 (0.0%) | 0.0 |
| High School Diploma | 69 (44.8%) | 109.0 |
| College or Associate's Degree | 16 (10.4%) | 30.0 |
| Bachelor's Degree | 54 (35.1%) | 117.0 |
| Graduate Degree | 15 (9.7%) | 37.0 |
| Total | 154 (100.0%) | 67.0 |
Fertility by Education by Marriage Status in Jefferson
39.6% of women with births in Jefferson are unmarried. Women with the educational attainment of college or associate's degree are most likely to be married with 100.0% of them married at childbirth, while women with the educational attainment of high school diploma are least likely to be married with 53.6% of them unmarried at childbirth.
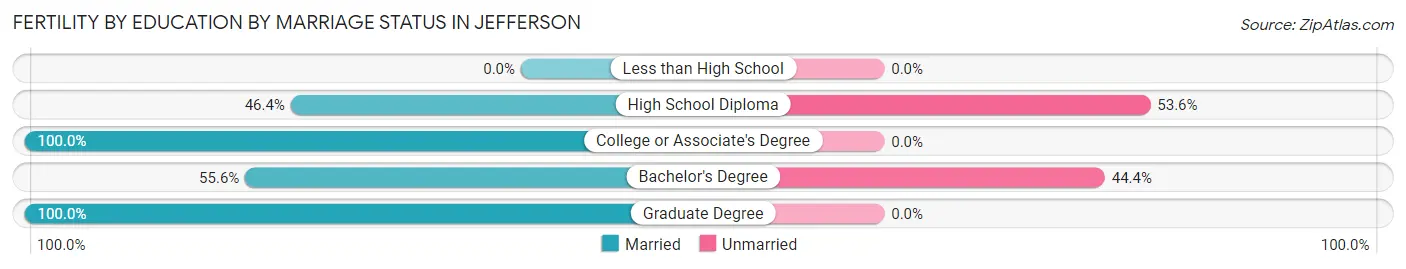
| Educational Attainment | Married | Unmarried |
| Less than High School | 0 (0.0%) | 0 (0.0%) |
| High School Diploma | 32 (46.4%) | 37 (53.6%) |
| College or Associate's Degree | 16 (100.0%) | 0 (0.0%) |
| Bachelor's Degree | 30 (55.6%) | 24 (44.4%) |
| Graduate Degree | 15 (100.0%) | 0 (0.0%) |
| Total | 93 (60.4%) | 61 (39.6%) |
Employment Characteristics in Jefferson
Employment by Class of Employer in Jefferson
Among the 5,581 employed individuals in Jefferson, private company employees (3,276 | 58.7%), not-for-profit organizations (704 | 12.6%), and self-employed (not incorporated) (545 | 9.8%) make up the most common classes of employment.
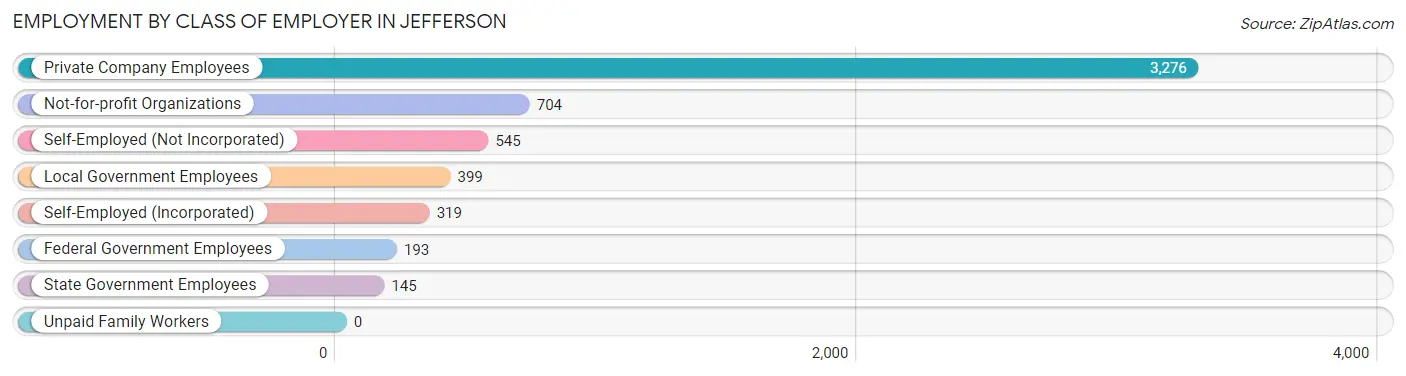
| Employer Class | # Employees | % Employees |
| Private Company Employees | 3,276 | 58.7% |
| Self-Employed (Incorporated) | 319 | 5.7% |
| Self-Employed (Not Incorporated) | 545 | 9.8% |
| Not-for-profit Organizations | 704 | 12.6% |
| Local Government Employees | 399 | 7.1% |
| State Government Employees | 145 | 2.6% |
| Federal Government Employees | 193 | 3.5% |
| Unpaid Family Workers | 0 | 0.0% |
| Total | 5,581 | 100.0% |
Employment Status by Age in Jefferson
According to the labor force statistics for Jefferson, out of the total population over 16 years of age (8,759), 68.0% or 5,956 individuals are in the labor force, with 4.2% or 250 of them unemployed. The age group with the highest labor force participation rate is 35 to 44 years, with 90.2% or 1,261 individuals in the labor force. Within the labor force, the 16 to 19 years age range has the highest percentage of unemployed individuals, with 52.6% or 30 of them being unemployed.
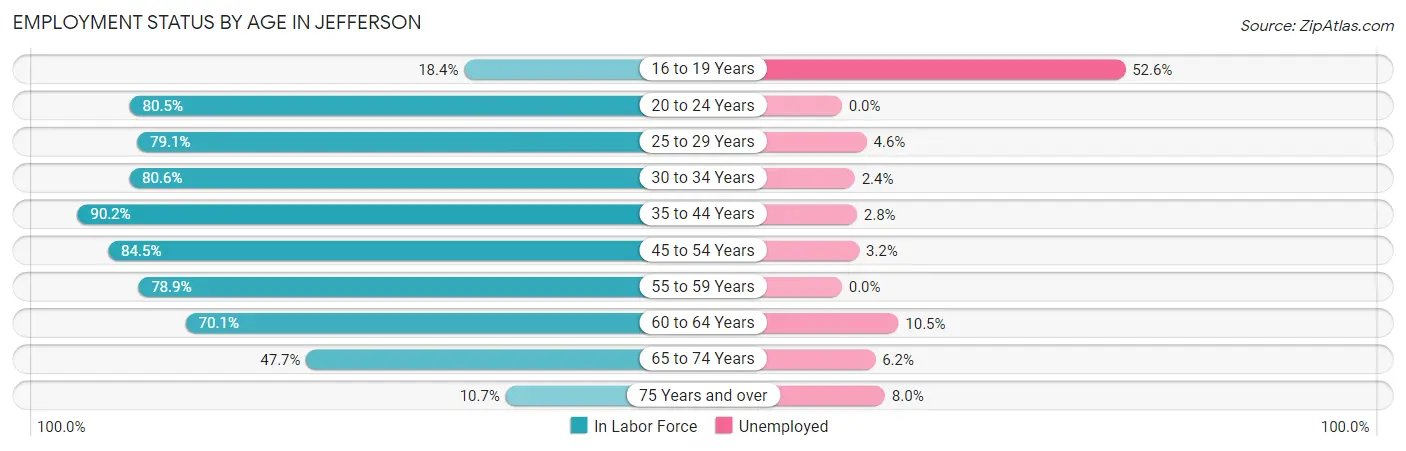
| Age Bracket | In Labor Force | Unemployed |
| 16 to 19 Years | 57 (18.4%) | 30 (52.6%) |
| 20 to 24 Years | 503 (80.5%) | 0 (0.0%) |
| 25 to 29 Years | 496 (79.1%) | 23 (4.6%) |
| 30 to 34 Years | 595 (80.6%) | 14 (2.4%) |
| 35 to 44 Years | 1,261 (90.2%) | 35 (2.8%) |
| 45 to 54 Years | 994 (84.5%) | 32 (3.2%) |
| 55 to 59 Years | 716 (78.9%) | 0 (0.0%) |
| 60 to 64 Years | 666 (70.1%) | 70 (10.5%) |
| 65 to 74 Years | 578 (47.7%) | 36 (6.2%) |
| 75 Years and over | 87 (10.7%) | 7 (8.0%) |
| Total | 5,956 (68.0%) | 250 (4.2%) |
Employment Status by Educational Attainment in Jefferson
According to labor force statistics for Jefferson, 81.6% of individuals (4,730) out of the total population between 25 and 64 years of age (5,797) are in the labor force, with 3.7% or 175 of them being unemployed. The group with the highest labor force participation rate are those with the educational attainment of bachelor's degree or higher, with 89.7% or 1,888 individuals in the labor force. Within the labor force, individuals with less than high school education have the highest percentage of unemployment, with 14.3% or 60 of them being unemployed.
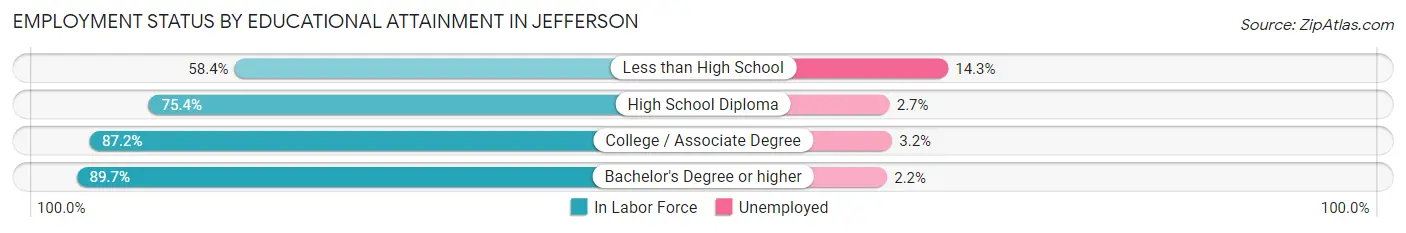
| Educational Attainment | In Labor Force | Unemployed |
| Less than High School | 420 (58.4%) | 103 (14.3%) |
| High School Diploma | 1,110 (75.4%) | 40 (2.7%) |
| College / Associate Degree | 1,309 (87.2%) | 48 (3.2%) |
| Bachelor's Degree or higher | 1,888 (89.7%) | 46 (2.2%) |
| Total | 4,730 (81.6%) | 214 (3.7%) |
Employment Occupations by Sex in Jefferson
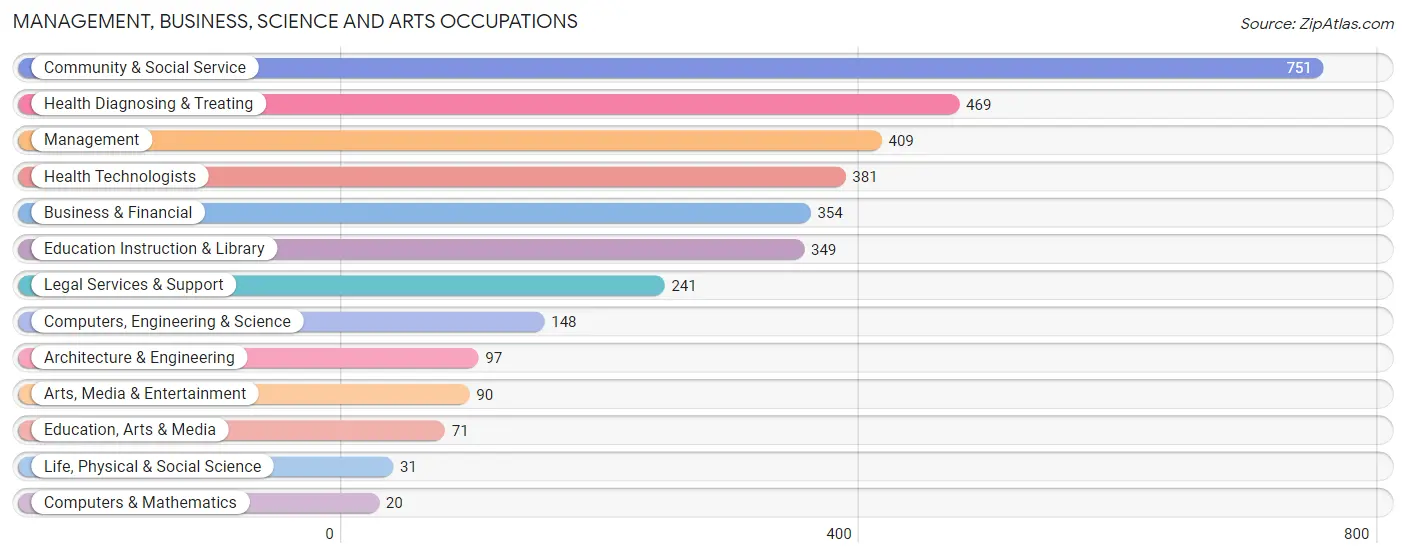
Management, Business, Science and Arts Occupations
The most common Management, Business, Science and Arts occupations in Jefferson are Community & Social Service (751 | 13.3%), Health Diagnosing & Treating (469 | 8.3%), Management (409 | 7.2%), Health Technologists (381 | 6.8%), and Business & Financial (354 | 6.3%).
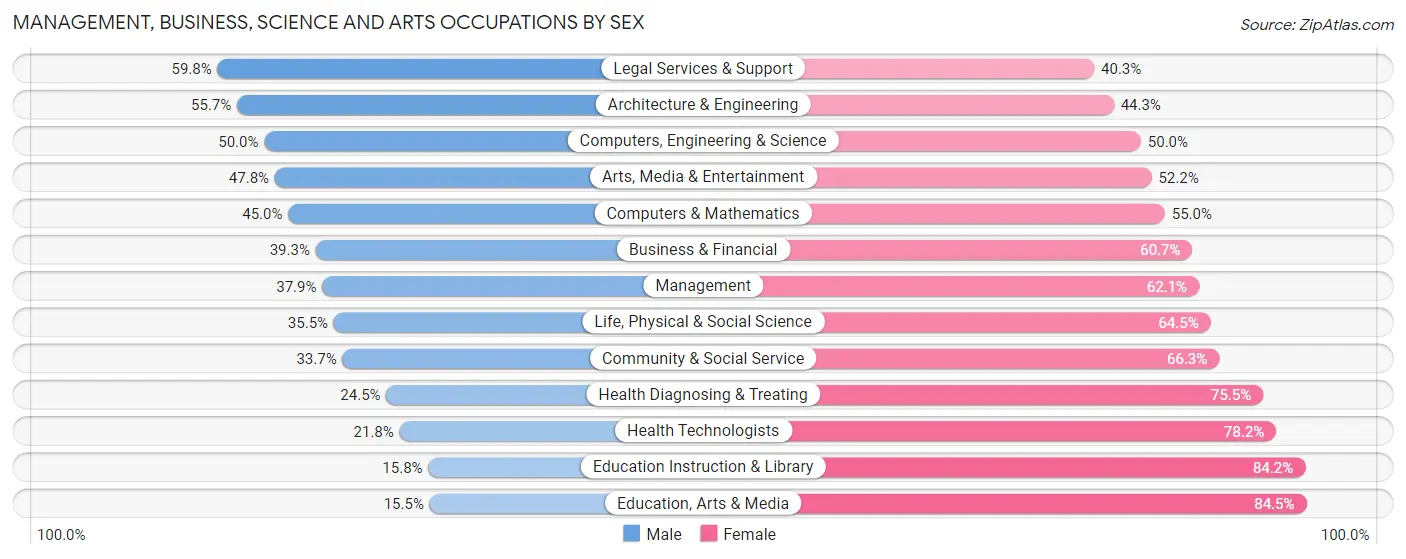
Management, Business, Science and Arts Occupations by Sex
Within the Management, Business, Science and Arts occupations in Jefferson, the most male-oriented occupations are Legal Services & Support (59.8%), Architecture & Engineering (55.7%), and Computers, Engineering & Science (50.0%), while the most female-oriented occupations are Education, Arts & Media (84.5%), Education Instruction & Library (84.2%), and Health Technologists (78.2%).
| Occupation | Male | Female |
| Management | 155 (37.9%) | 254 (62.1%) |
| Business & Financial | 139 (39.3%) | 215 (60.7%) |
| Computers, Engineering & Science | 74 (50.0%) | 74 (50.0%) |
| Computers & Mathematics | 9 (45.0%) | 11 (55.0%) |
| Architecture & Engineering | 54 (55.7%) | 43 (44.3%) |
| Life, Physical & Social Science | 11 (35.5%) | 20 (64.5%) |
| Community & Social Service | 253 (33.7%) | 498 (66.3%) |
| Education, Arts & Media | 11 (15.5%) | 60 (84.5%) |
| Legal Services & Support | 144 (59.8%) | 97 (40.3%) |
| Education Instruction & Library | 55 (15.8%) | 294 (84.2%) |
| Arts, Media & Entertainment | 43 (47.8%) | 47 (52.2%) |
| Health Diagnosing & Treating | 115 (24.5%) | 354 (75.5%) |
| Health Technologists | 83 (21.8%) | 298 (78.2%) |
| Total (Category) | 736 (34.5%) | 1,395 (65.5%) |
| Total (Overall) | 2,484 (44.0%) | 3,156 (56.0%) |
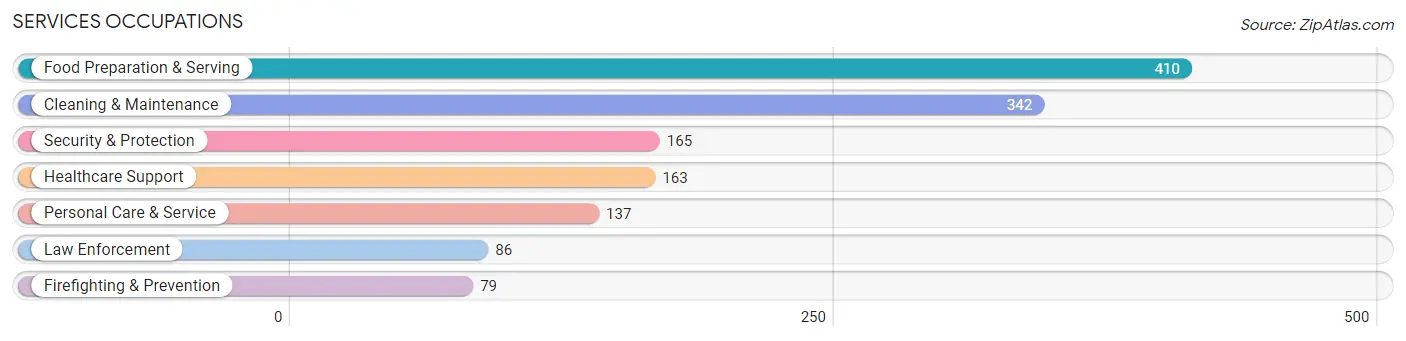
Services Occupations
The most common Services occupations in Jefferson are Food Preparation & Serving (410 | 7.3%), Cleaning & Maintenance (342 | 6.1%), Security & Protection (165 | 2.9%), Healthcare Support (163 | 2.9%), and Personal Care & Service (137 | 2.4%).
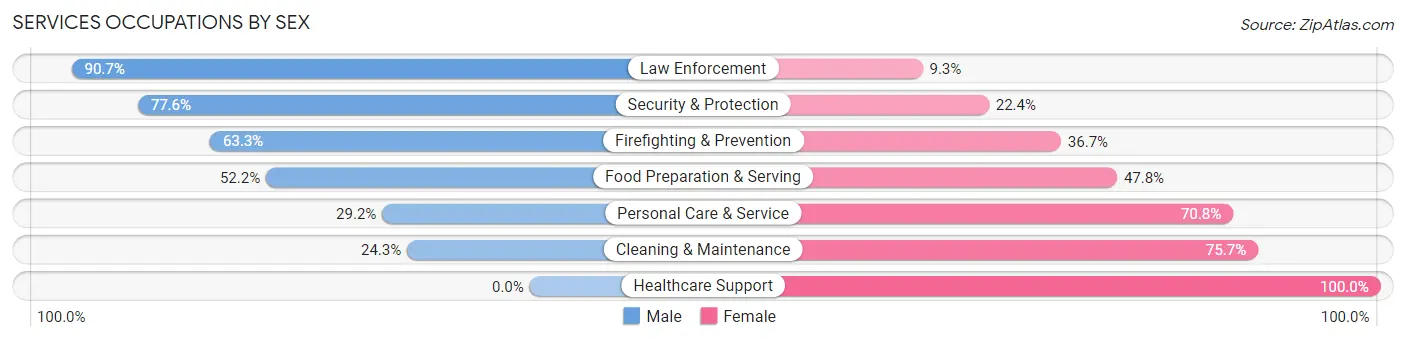
Services Occupations by Sex
Within the Services occupations in Jefferson, the most male-oriented occupations are Law Enforcement (90.7%), Security & Protection (77.6%), and Firefighting & Prevention (63.3%), while the most female-oriented occupations are Healthcare Support (100.0%), Cleaning & Maintenance (75.7%), and Personal Care & Service (70.8%).
| Occupation | Male | Female |
| Healthcare Support | 0 (0.0%) | 163 (100.0%) |
| Security & Protection | 128 (77.6%) | 37 (22.4%) |
| Firefighting & Prevention | 50 (63.3%) | 29 (36.7%) |
| Law Enforcement | 78 (90.7%) | 8 (9.3%) |
| Food Preparation & Serving | 214 (52.2%) | 196 (47.8%) |
| Cleaning & Maintenance | 83 (24.3%) | 259 (75.7%) |
| Personal Care & Service | 40 (29.2%) | 97 (70.8%) |
| Total (Category) | 465 (38.2%) | 752 (61.8%) |
| Total (Overall) | 2,484 (44.0%) | 3,156 (56.0%) |
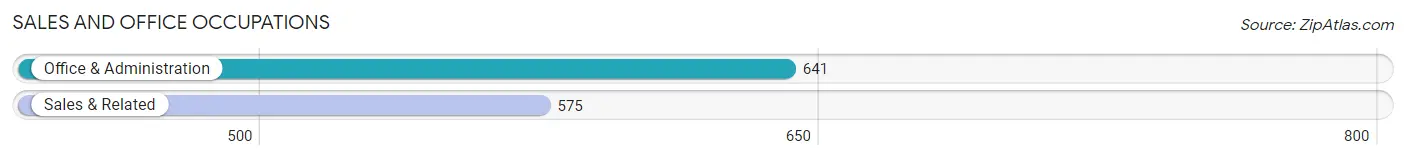
Sales and Office Occupations
The most common Sales and Office occupations in Jefferson are Office & Administration (641 | 11.4%), and Sales & Related (575 | 10.2%).
Sales and Office Occupations by Sex
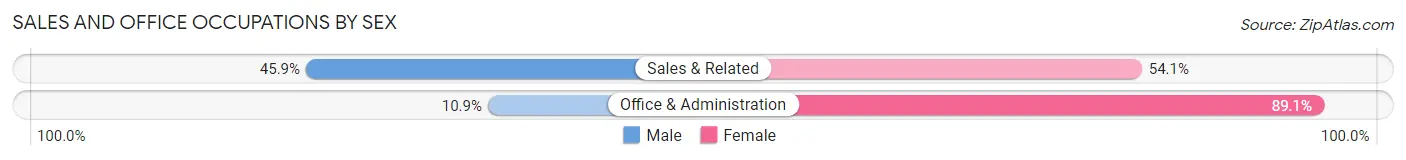
| Occupation | Male | Female |
| Sales & Related | 264 (45.9%) | 311 (54.1%) |
| Office & Administration | 70 (10.9%) | 571 (89.1%) |
| Total (Category) | 334 (27.5%) | 882 (72.5%) |
| Total (Overall) | 2,484 (44.0%) | 3,156 (56.0%) |
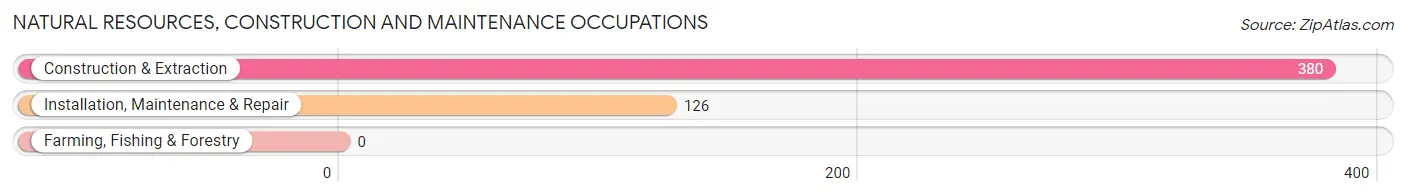
Natural Resources, Construction and Maintenance Occupations
The most common Natural Resources, Construction and Maintenance occupations in Jefferson are Construction & Extraction (380 | 6.7%), and Installation, Maintenance & Repair (126 | 2.2%).
Natural Resources, Construction and Maintenance Occupations by Sex
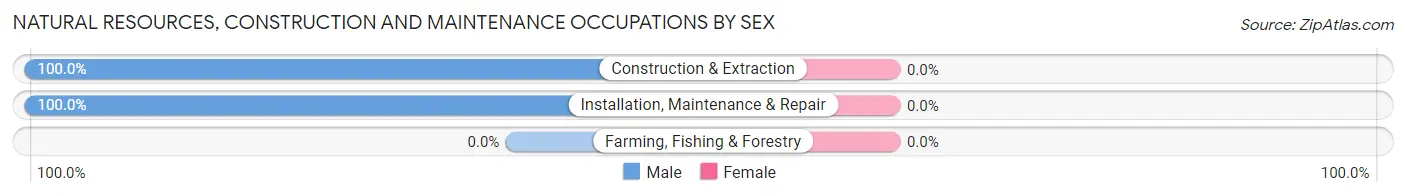
| Occupation | Male | Female |
| Farming, Fishing & Forestry | 0 (0.0%) | 0 (0.0%) |
| Construction & Extraction | 380 (100.0%) | 0 (0.0%) |
| Installation, Maintenance & Repair | 126 (100.0%) | 0 (0.0%) |
| Total (Category) | 506 (100.0%) | 0 (0.0%) |
| Total (Overall) | 2,484 (44.0%) | 3,156 (56.0%) |
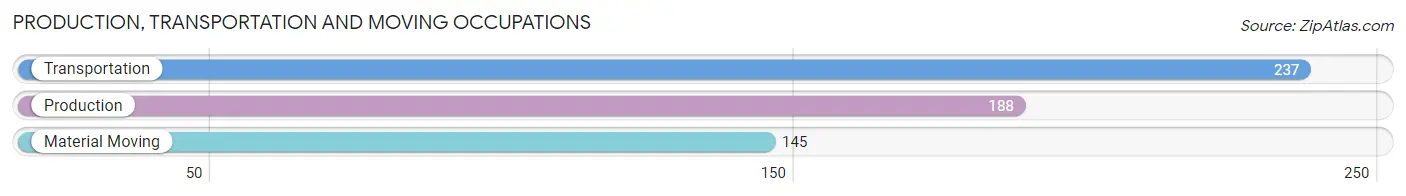
Production, Transportation and Moving Occupations
The most common Production, Transportation and Moving occupations in Jefferson are Transportation (237 | 4.2%), Production (188 | 3.3%), and Material Moving (145 | 2.6%).
Production, Transportation and Moving Occupations by Sex
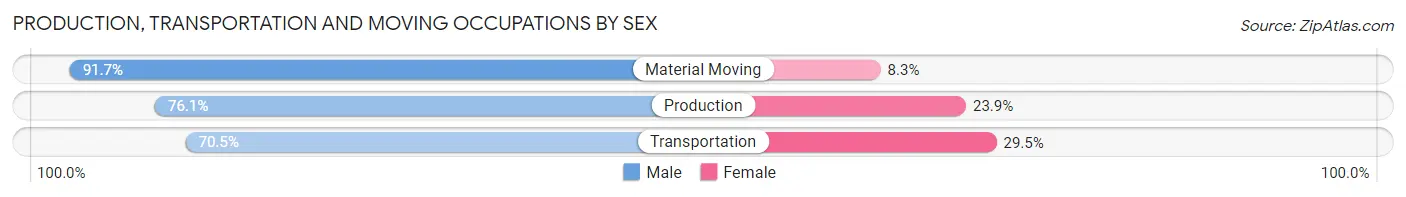
| Occupation | Male | Female |
| Production | 143 (76.1%) | 45 (23.9%) |
| Transportation | 167 (70.5%) | 70 (29.5%) |
| Material Moving | 133 (91.7%) | 12 (8.3%) |
| Total (Category) | 443 (77.7%) | 127 (22.3%) |
| Total (Overall) | 2,484 (44.0%) | 3,156 (56.0%) |
Employment Industries by Sex in Jefferson
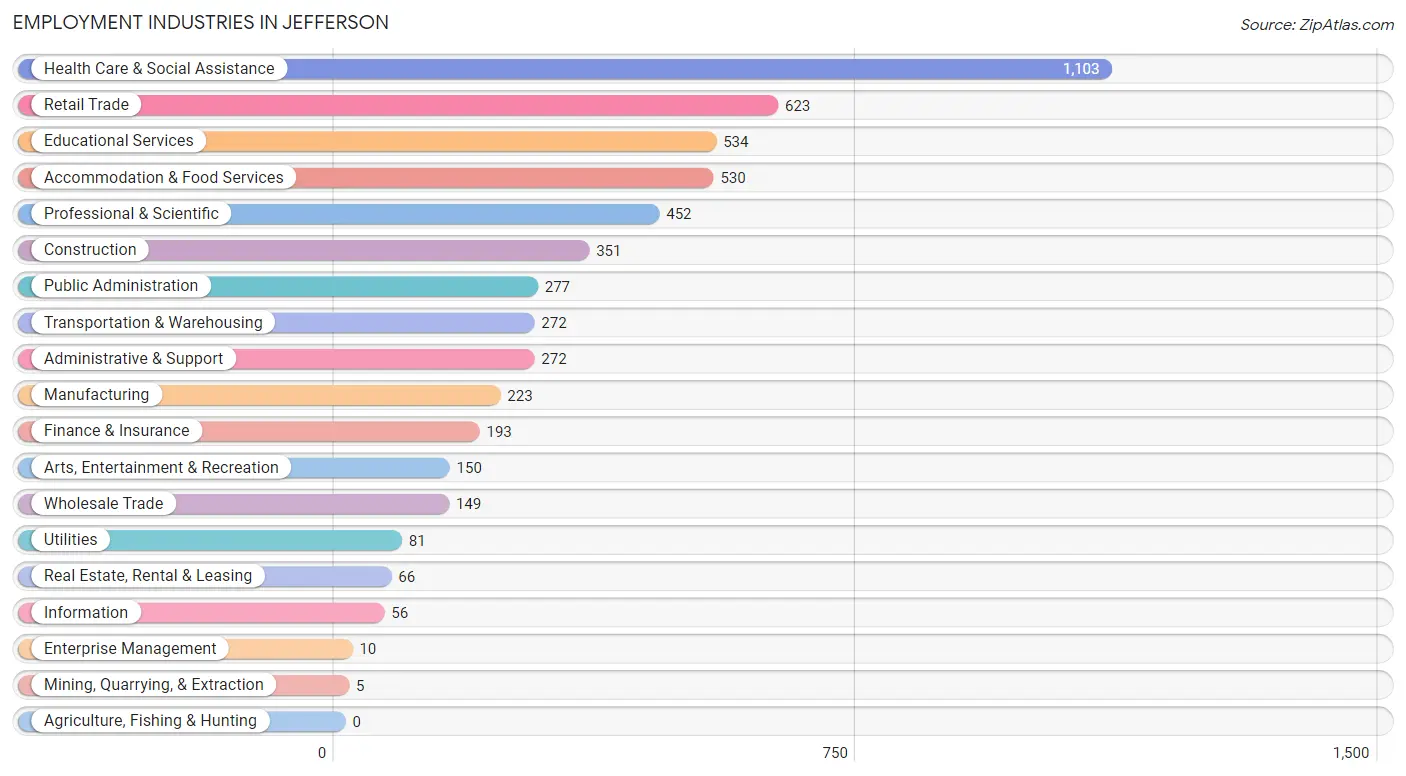
Employment Industries in Jefferson
The major employment industries in Jefferson include Health Care & Social Assistance (1,103 | 19.6%), Retail Trade (623 | 11.1%), Educational Services (534 | 9.5%), Accommodation & Food Services (530 | 9.4%), and Professional & Scientific (452 | 8.0%).
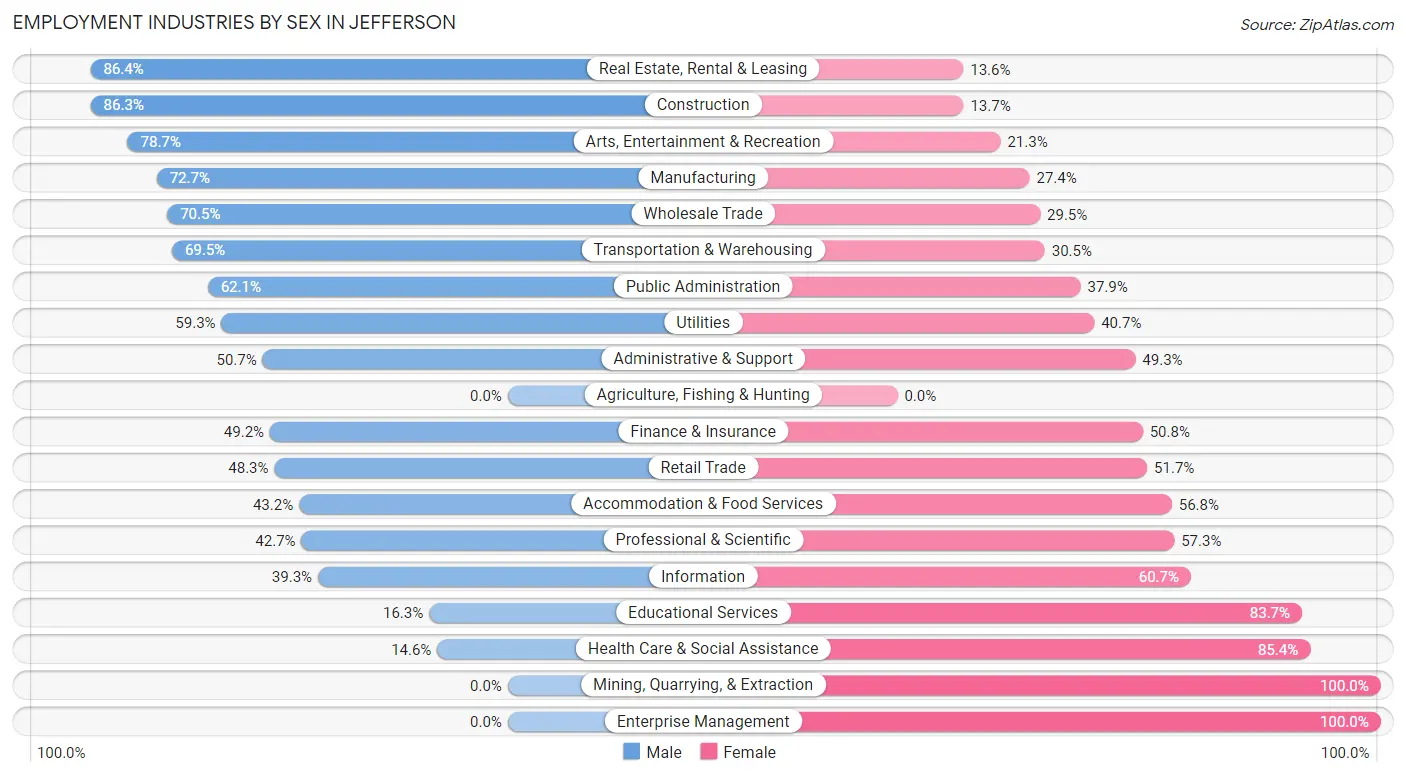
Employment Industries by Sex in Jefferson
The Jefferson industries that see more men than women are Real Estate, Rental & Leasing (86.4%), Construction (86.3%), and Arts, Entertainment & Recreation (78.7%), whereas the industries that tend to have a higher number of women are Mining, Quarrying, & Extraction (100.0%), Enterprise Management (100.0%), and Health Care & Social Assistance (85.4%).
| Industry | Male | Female |
| Agriculture, Fishing & Hunting | 0 (0.0%) | 0 (0.0%) |
| Mining, Quarrying, & Extraction | 0 (0.0%) | 5 (100.0%) |
| Construction | 303 (86.3%) | 48 (13.7%) |
| Manufacturing | 162 (72.7%) | 61 (27.4%) |
| Wholesale Trade | 105 (70.5%) | 44 (29.5%) |
| Retail Trade | 301 (48.3%) | 322 (51.7%) |
| Transportation & Warehousing | 189 (69.5%) | 83 (30.5%) |
| Utilities | 48 (59.3%) | 33 (40.7%) |
| Information | 22 (39.3%) | 34 (60.7%) |
| Finance & Insurance | 95 (49.2%) | 98 (50.8%) |
| Real Estate, Rental & Leasing | 57 (86.4%) | 9 (13.6%) |
| Professional & Scientific | 193 (42.7%) | 259 (57.3%) |
| Enterprise Management | 0 (0.0%) | 10 (100.0%) |
| Administrative & Support | 138 (50.7%) | 134 (49.3%) |
| Educational Services | 87 (16.3%) | 447 (83.7%) |
| Health Care & Social Assistance | 161 (14.6%) | 942 (85.4%) |
| Arts, Entertainment & Recreation | 118 (78.7%) | 32 (21.3%) |
| Accommodation & Food Services | 229 (43.2%) | 301 (56.8%) |
| Public Administration | 172 (62.1%) | 105 (37.9%) |
| Total | 2,484 (44.0%) | 3,156 (56.0%) |
Education in Jefferson
School Enrollment in Jefferson
The most common levels of schooling among the 1,734 students in Jefferson are elementary school (455 | 26.2%), high school (419 | 24.2%), and middle school (359 | 20.7%).
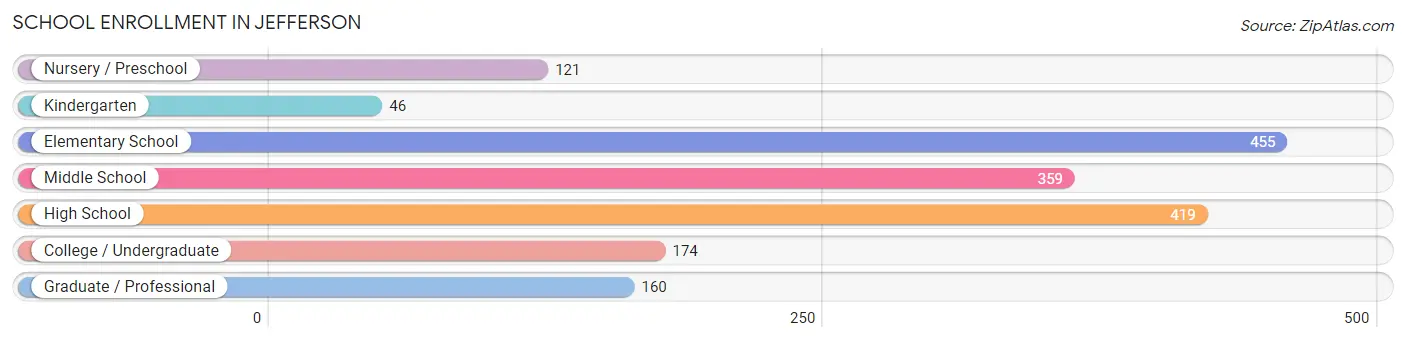
| School Level | # Students | % Students |
| Nursery / Preschool | 121 | 7.0% |
| Kindergarten | 46 | 2.6% |
| Elementary School | 455 | 26.2% |
| Middle School | 359 | 20.7% |
| High School | 419 | 24.2% |
| College / Undergraduate | 174 | 10.0% |
| Graduate / Professional | 160 | 9.2% |
| Total | 1,734 | 100.0% |
School Enrollment by Age by Funding Source in Jefferson
Out of a total of 1,734 students who are enrolled in schools in Jefferson, 439 (25.3%) attend a private institution, while the remaining 1,295 (74.7%) are enrolled in public schools. The age group of 25 to 34 year olds has the highest likelihood of being enrolled in private schools, with 59 (46.1% in the age bracket) enrolled. Conversely, the age group of 20 to 24 year olds has the lowest likelihood of being enrolled in a private school, with 113 (100.0% in the age bracket) attending a public institution.
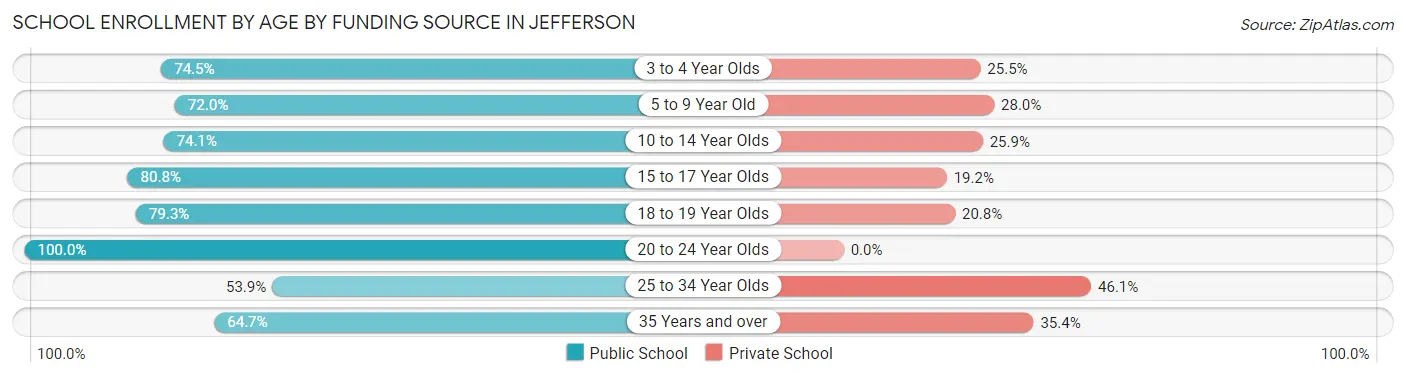
| Age Bracket | Public School | Private School |
| 3 to 4 Year Olds | 79 (74.5%) | 27 (25.5%) |
| 5 to 9 Year Old | 298 (72.0%) | 116 (28.0%) |
| 10 to 14 Year Olds | 369 (74.1%) | 129 (25.9%) |
| 15 to 17 Year Olds | 261 (80.8%) | 62 (19.2%) |
| 18 to 19 Year Olds | 42 (79.2%) | 11 (20.7%) |
| 20 to 24 Year Olds | 113 (100.0%) | 0 (0.0%) |
| 25 to 34 Year Olds | 69 (53.9%) | 59 (46.1%) |
| 35 Years and over | 64 (64.6%) | 35 (35.3%) |
| Total | 1,295 (74.7%) | 439 (25.3%) |
Educational Attainment by Field of Study in Jefferson
Business (512 | 18.5%), science & technology (351 | 12.7%), education (290 | 10.5%), liberal arts & history (266 | 9.6%), and social sciences (252 | 9.1%) are the most common fields of study among 2,769 individuals in Jefferson who have obtained a bachelor's degree or higher.

| Field of Study | # Graduates | % Graduates |
| Computers & Mathematics | 29 | 1.1% |
| Bio, Nature & Agricultural | 134 | 4.8% |
| Physical & Health Sciences | 53 | 1.9% |
| Psychology | 201 | 7.3% |
| Social Sciences | 252 | 9.1% |
| Engineering | 79 | 2.9% |
| Multidisciplinary Studies | 25 | 0.9% |
| Science & Technology | 351 | 12.7% |
| Business | 512 | 18.5% |
| Education | 290 | 10.5% |
| Literature & Languages | 158 | 5.7% |
| Liberal Arts & History | 266 | 9.6% |
| Visual & Performing Arts | 226 | 8.2% |
| Communications | 75 | 2.7% |
| Arts & Humanities | 118 | 4.3% |
| Total | 2,769 | 100.0% |
Transportation & Commute in Jefferson
Vehicle Availability by Sex in Jefferson
The most prevalent vehicle ownership categories in Jefferson are males with 2 vehicles (1,036, accounting for 41.5%) and females with 2 vehicles (1,273, making up 34.1%).
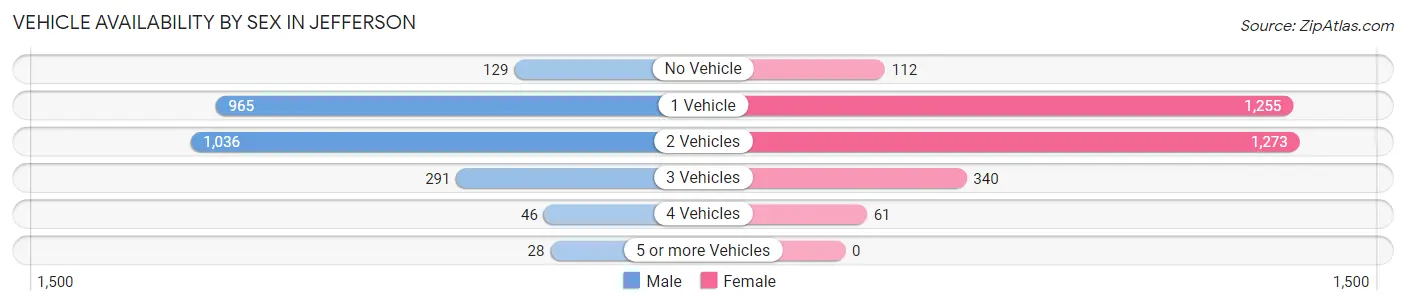
| Vehicles Available | Male | Female |
| No Vehicle | 129 (5.2%) | 112 (3.7%) |
| 1 Vehicle | 965 (38.7%) | 1,255 (41.3%) |
| 2 Vehicles | 1,036 (41.5%) | 1,273 (41.9%) |
| 3 Vehicles | 291 (11.7%) | 340 (11.2%) |
| 4 Vehicles | 46 (1.8%) | 61 (2.0%) |
| 5 or more Vehicles | 28 (1.1%) | 0 (0.0%) |
| Total | 2,495 (100.0%) | 3,041 (100.0%) |
Commute Time in Jefferson
The most frequently occuring commute durations in Jefferson are 15 to 19 minutes (1,160 commuters, 22.5%), 20 to 24 minutes (939 commuters, 18.2%), and 5 to 9 minutes (785 commuters, 15.2%).
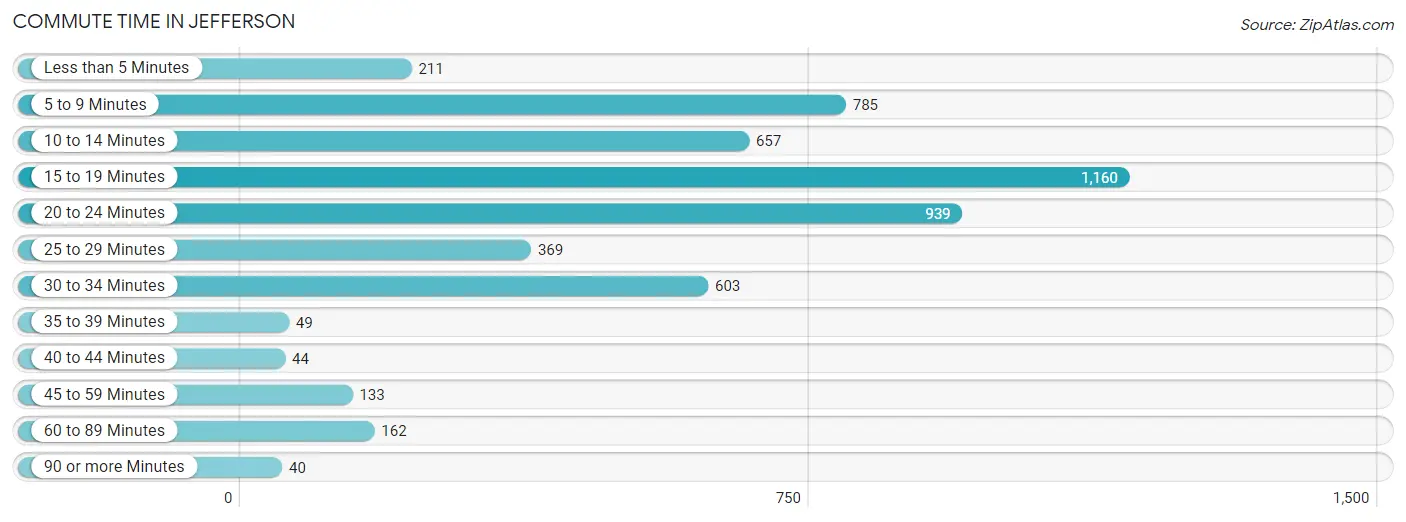
| Commute Time | # Commuters | % Commuters |
| Less than 5 Minutes | 211 | 4.1% |
| 5 to 9 Minutes | 785 | 15.2% |
| 10 to 14 Minutes | 657 | 12.8% |
| 15 to 19 Minutes | 1,160 | 22.5% |
| 20 to 24 Minutes | 939 | 18.2% |
| 25 to 29 Minutes | 369 | 7.2% |
| 30 to 34 Minutes | 603 | 11.7% |
| 35 to 39 Minutes | 49 | 0.9% |
| 40 to 44 Minutes | 44 | 0.9% |
| 45 to 59 Minutes | 133 | 2.6% |
| 60 to 89 Minutes | 162 | 3.1% |
| 90 or more Minutes | 40 | 0.8% |
Commute Time by Sex in Jefferson
The most common commute times in Jefferson are 20 to 24 minutes (559 commuters, 24.1%) for males and 15 to 19 minutes (849 commuters, 30.0%) for females.
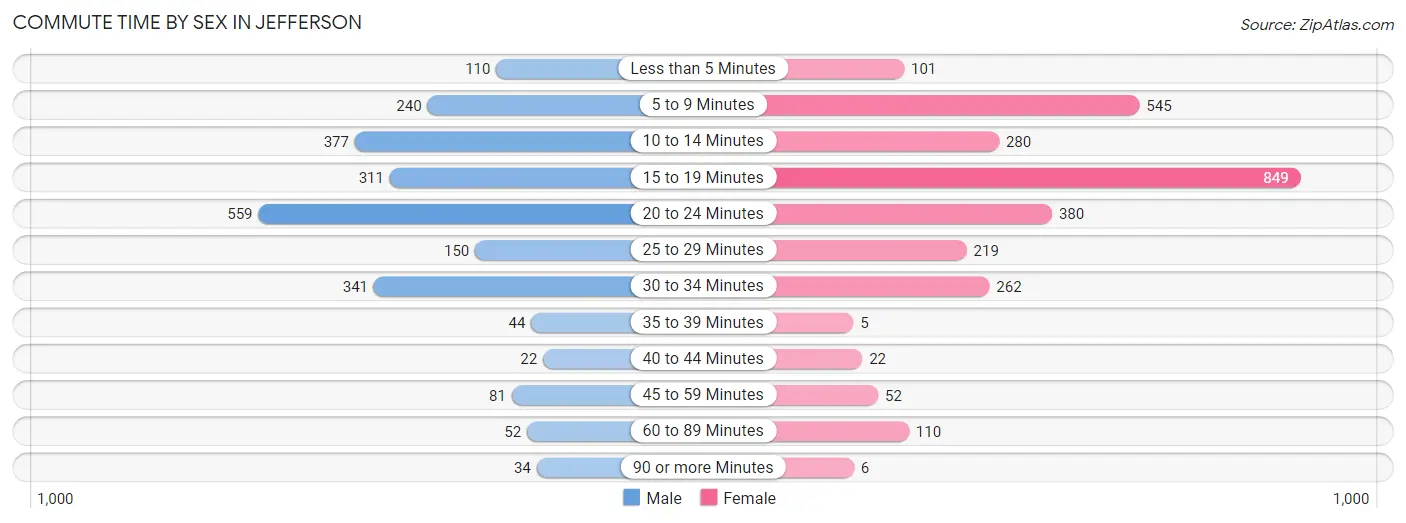
| Commute Time | Male | Female |
| Less than 5 Minutes | 110 (4.7%) | 101 (3.6%) |
| 5 to 9 Minutes | 240 (10.3%) | 545 (19.3%) |
| 10 to 14 Minutes | 377 (16.2%) | 280 (9.9%) |
| 15 to 19 Minutes | 311 (13.4%) | 849 (30.0%) |
| 20 to 24 Minutes | 559 (24.1%) | 380 (13.4%) |
| 25 to 29 Minutes | 150 (6.5%) | 219 (7.7%) |
| 30 to 34 Minutes | 341 (14.7%) | 262 (9.2%) |
| 35 to 39 Minutes | 44 (1.9%) | 5 (0.2%) |
| 40 to 44 Minutes | 22 (0.9%) | 22 (0.8%) |
| 45 to 59 Minutes | 81 (3.5%) | 52 (1.8%) |
| 60 to 89 Minutes | 52 (2.2%) | 110 (3.9%) |
| 90 or more Minutes | 34 (1.5%) | 6 (0.2%) |
Time of Departure to Work by Sex in Jefferson
The most frequent times of departure to work in Jefferson are 7:30 AM to 7:59 AM (390, 16.8%) for males and 7:30 AM to 7:59 AM (411, 14.5%) for females.
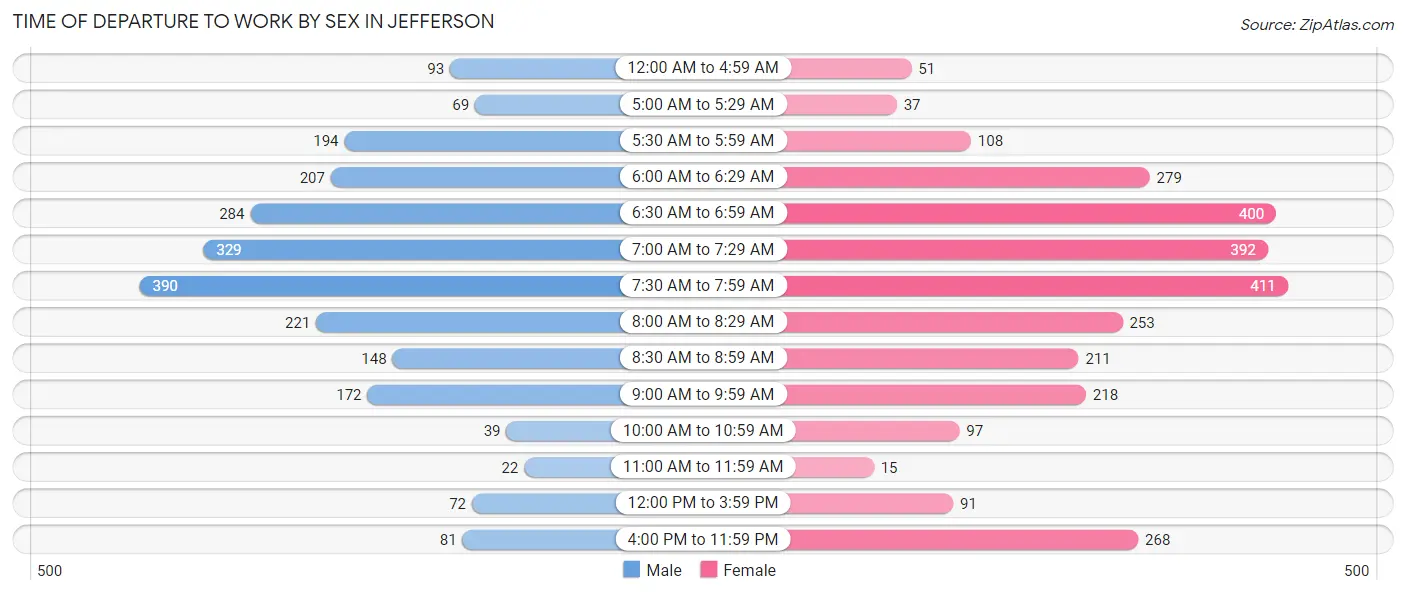
| Time of Departure | Male | Female |
| 12:00 AM to 4:59 AM | 93 (4.0%) | 51 (1.8%) |
| 5:00 AM to 5:29 AM | 69 (3.0%) | 37 (1.3%) |
| 5:30 AM to 5:59 AM | 194 (8.4%) | 108 (3.8%) |
| 6:00 AM to 6:29 AM | 207 (8.9%) | 279 (9.9%) |
| 6:30 AM to 6:59 AM | 284 (12.2%) | 400 (14.1%) |
| 7:00 AM to 7:29 AM | 329 (14.2%) | 392 (13.9%) |
| 7:30 AM to 7:59 AM | 390 (16.8%) | 411 (14.5%) |
| 8:00 AM to 8:29 AM | 221 (9.5%) | 253 (8.9%) |
| 8:30 AM to 8:59 AM | 148 (6.4%) | 211 (7.4%) |
| 9:00 AM to 9:59 AM | 172 (7.4%) | 218 (7.7%) |
| 10:00 AM to 10:59 AM | 39 (1.7%) | 97 (3.4%) |
| 11:00 AM to 11:59 AM | 22 (0.9%) | 15 (0.5%) |
| 12:00 PM to 3:59 PM | 72 (3.1%) | 91 (3.2%) |
| 4:00 PM to 11:59 PM | 81 (3.5%) | 268 (9.5%) |
| Total | 2,321 (100.0%) | 2,831 (100.0%) |
Housing Occupancy in Jefferson
Occupancy by Ownership in Jefferson
Of the total 5,195 dwellings in Jefferson, owner-occupied units account for 2,776 (53.4%), while renter-occupied units make up 2,419 (46.6%).
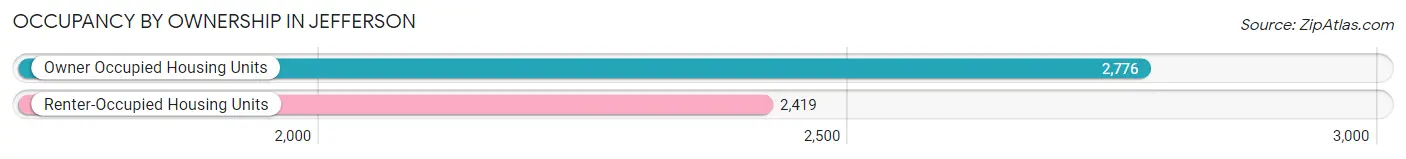
| Occupancy | # Housing Units | % Housing Units |
| Owner Occupied Housing Units | 2,776 | 53.4% |
| Renter-Occupied Housing Units | 2,419 | 46.6% |
| Total Occupied Housing Units | 5,195 | 100.0% |
Occupancy by Household Size in Jefferson
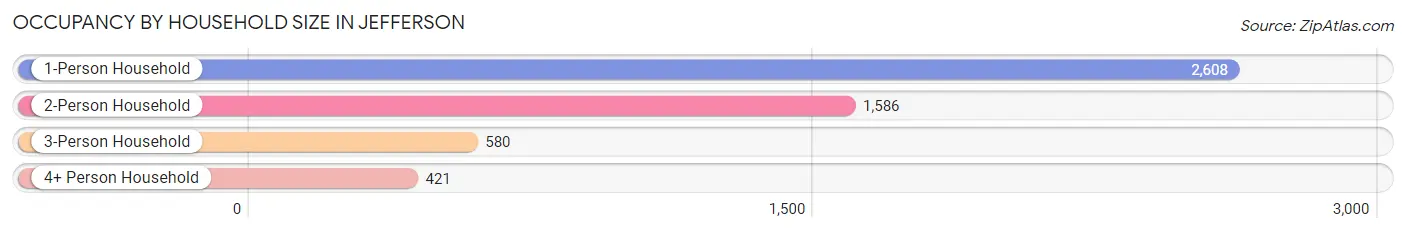
| Household Size | # Housing Units | % Housing Units |
| 1-Person Household | 2,608 | 50.2% |
| 2-Person Household | 1,586 | 30.5% |
| 3-Person Household | 580 | 11.2% |
| 4+ Person Household | 421 | 8.1% |
| Total Housing Units | 5,195 | 100.0% |
Occupancy by Ownership by Household Size in Jefferson
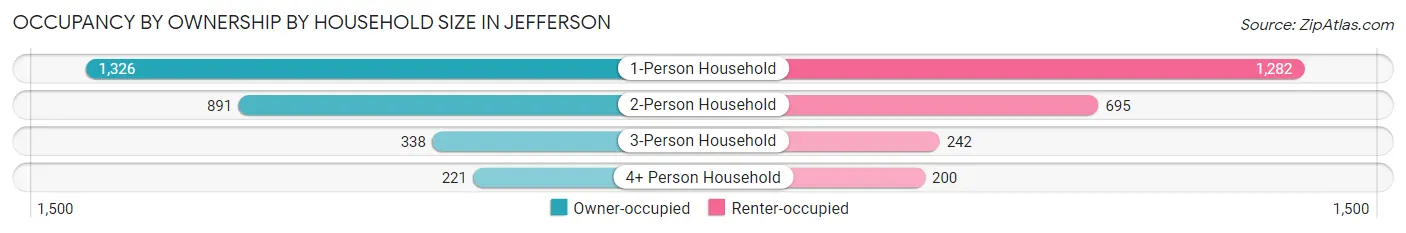
| Household Size | Owner-occupied | Renter-occupied |
| 1-Person Household | 1,326 (50.8%) | 1,282 (49.2%) |
| 2-Person Household | 891 (56.2%) | 695 (43.8%) |
| 3-Person Household | 338 (58.3%) | 242 (41.7%) |
| 4+ Person Household | 221 (52.5%) | 200 (47.5%) |
| Total Housing Units | 2,776 (53.4%) | 2,419 (46.6%) |
Occupancy by Educational Attainment in Jefferson
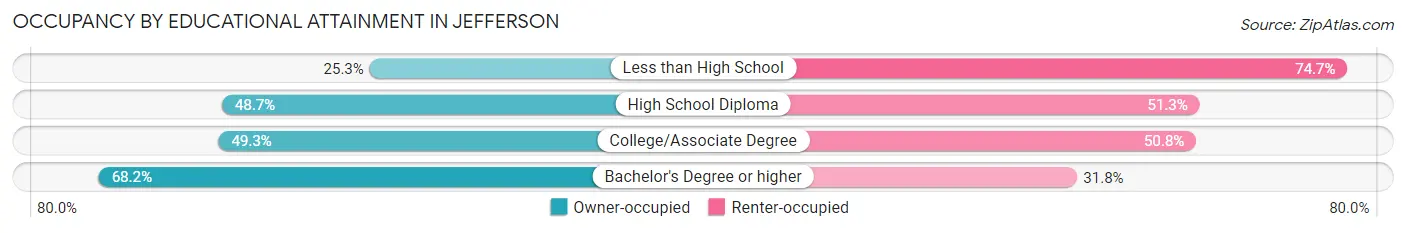
| Household Size | Owner-occupied | Renter-occupied |
| Less than High School | 135 (25.3%) | 399 (74.7%) |
| High School Diploma | 710 (48.7%) | 748 (51.3%) |
| College/Associate Degree | 661 (49.2%) | 681 (50.7%) |
| Bachelor's Degree or higher | 1,270 (68.2%) | 591 (31.8%) |
Occupancy by Age of Householder in Jefferson
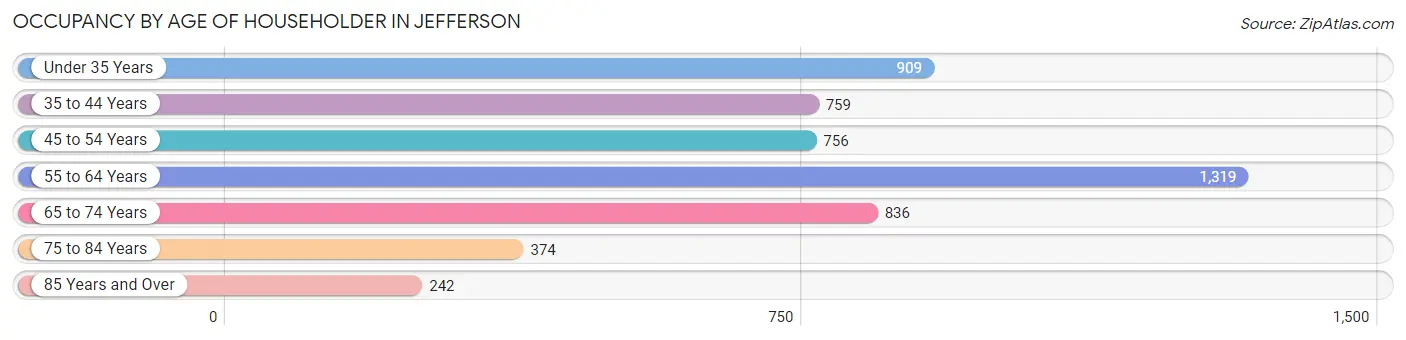
| Age Bracket | # Households | % Households |
| Under 35 Years | 909 | 17.5% |
| 35 to 44 Years | 759 | 14.6% |
| 45 to 54 Years | 756 | 14.5% |
| 55 to 64 Years | 1,319 | 25.4% |
| 65 to 74 Years | 836 | 16.1% |
| 75 to 84 Years | 374 | 7.2% |
| 85 Years and Over | 242 | 4.7% |
| Total | 5,195 | 100.0% |
Housing Finances in Jefferson
Median Income by Occupancy in Jefferson
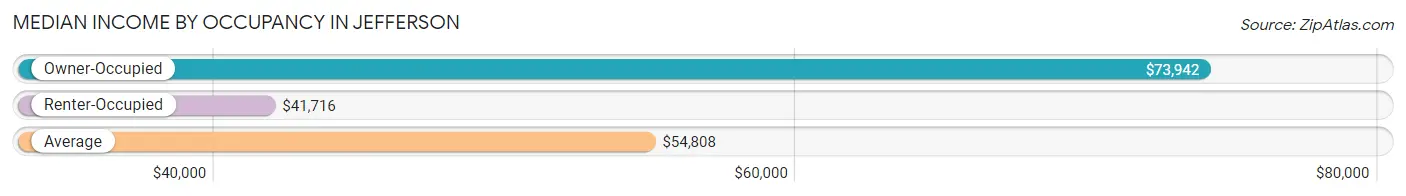
| Occupancy Type | # Households | Median Income |
| Owner-Occupied | 2,776 (53.4%) | $73,942 |
| Renter-Occupied | 2,419 (46.6%) | $41,716 |
| Average | 5,195 (100.0%) | $54,808 |
Occupancy by Householder Income Bracket in Jefferson
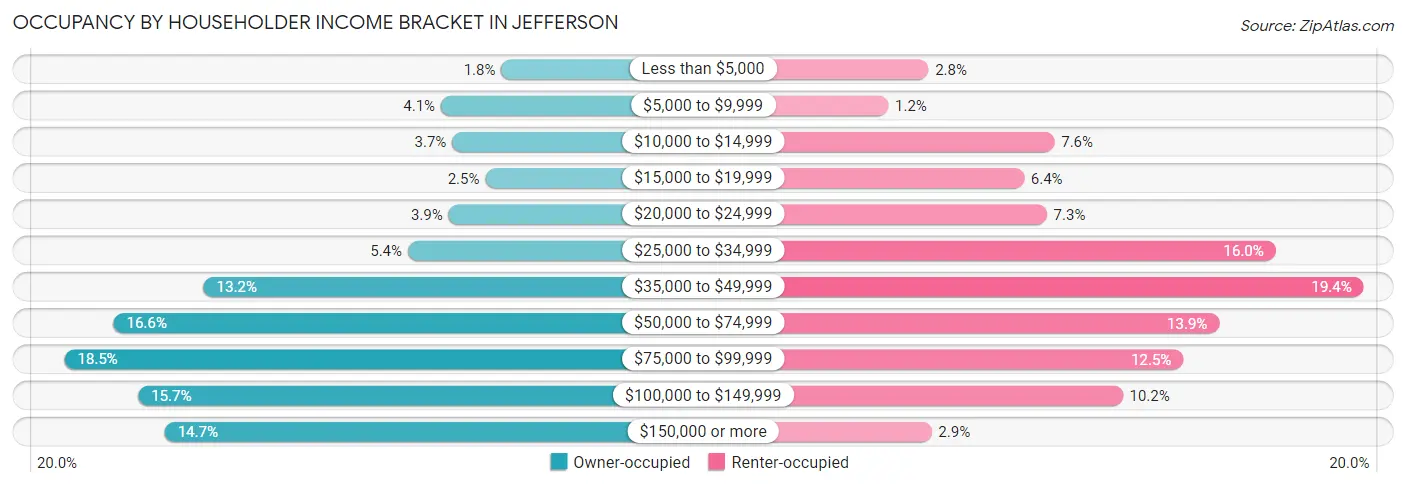
| Income Bracket | Owner-occupied | Renter-occupied |
| Less than $5,000 | 51 (1.8%) | 67 (2.8%) |
| $5,000 to $9,999 | 115 (4.1%) | 30 (1.2%) |
| $10,000 to $14,999 | 103 (3.7%) | 183 (7.6%) |
| $15,000 to $19,999 | 68 (2.5%) | 155 (6.4%) |
| $20,000 to $24,999 | 107 (3.8%) | 176 (7.3%) |
| $25,000 to $34,999 | 150 (5.4%) | 387 (16.0%) |
| $35,000 to $49,999 | 366 (13.2%) | 468 (19.4%) |
| $50,000 to $74,999 | 461 (16.6%) | 335 (13.9%) |
| $75,000 to $99,999 | 513 (18.5%) | 302 (12.5%) |
| $100,000 to $149,999 | 435 (15.7%) | 246 (10.2%) |
| $150,000 or more | 407 (14.7%) | 70 (2.9%) |
| Total | 2,776 (100.0%) | 2,419 (100.0%) |
Monthly Housing Cost Tiers in Jefferson
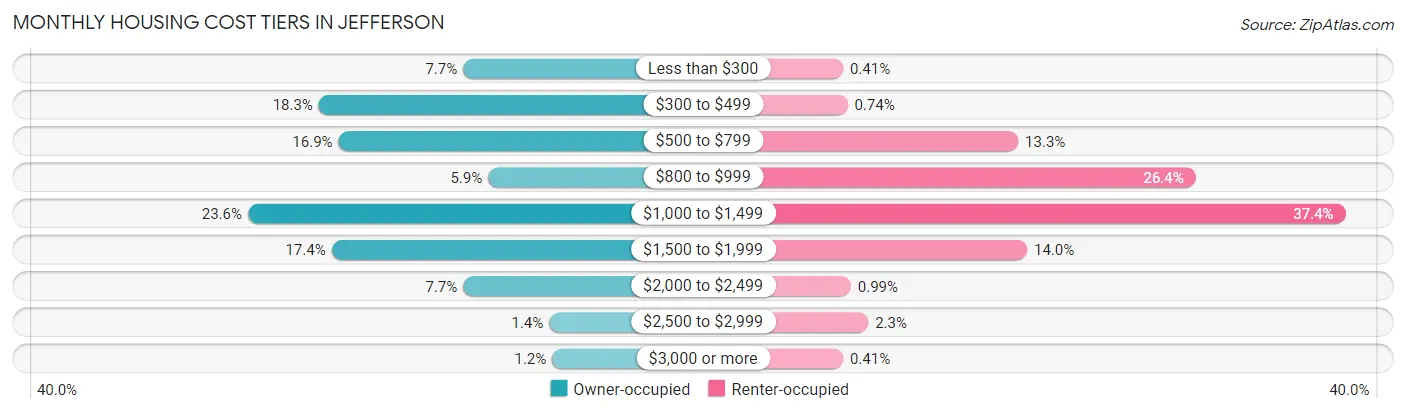
| Monthly Cost | Owner-occupied | Renter-occupied |
| Less than $300 | 214 (7.7%) | 10 (0.4%) |
| $300 to $499 | 509 (18.3%) | 18 (0.7%) |
| $500 to $799 | 469 (16.9%) | 322 (13.3%) |
| $800 to $999 | 163 (5.9%) | 638 (26.4%) |
| $1,000 to $1,499 | 654 (23.6%) | 905 (37.4%) |
| $1,500 to $1,999 | 483 (17.4%) | 338 (14.0%) |
| $2,000 to $2,499 | 214 (7.7%) | 24 (1.0%) |
| $2,500 to $2,999 | 38 (1.4%) | 55 (2.3%) |
| $3,000 or more | 32 (1.1%) | 10 (0.4%) |
| Total | 2,776 (100.0%) | 2,419 (100.0%) |
Physical Housing Characteristics in Jefferson
Housing Structures in Jefferson
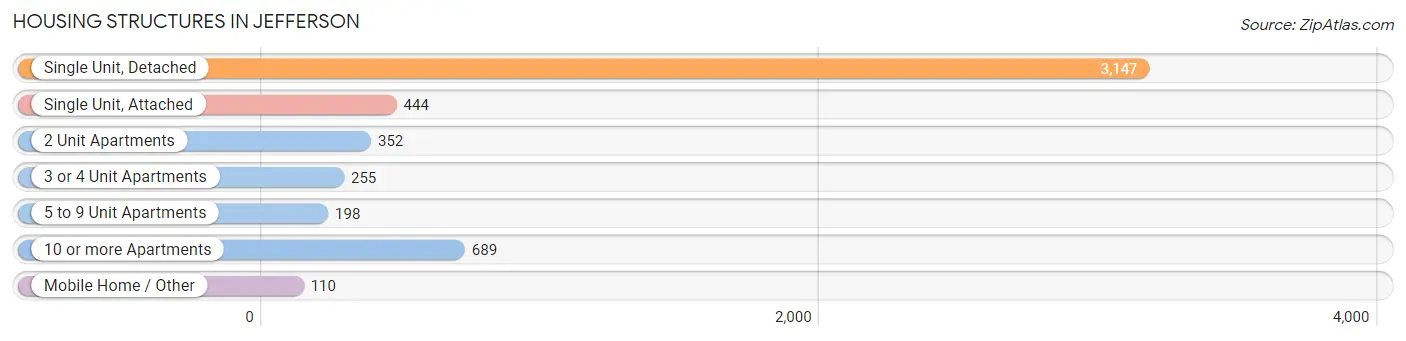
| Structure Type | # Housing Units | % Housing Units |
| Single Unit, Detached | 3,147 | 60.6% |
| Single Unit, Attached | 444 | 8.6% |
| 2 Unit Apartments | 352 | 6.8% |
| 3 or 4 Unit Apartments | 255 | 4.9% |
| 5 to 9 Unit Apartments | 198 | 3.8% |
| 10 or more Apartments | 689 | 13.3% |
| Mobile Home / Other | 110 | 2.1% |
| Total | 5,195 | 100.0% |
Housing Structures by Occupancy in Jefferson
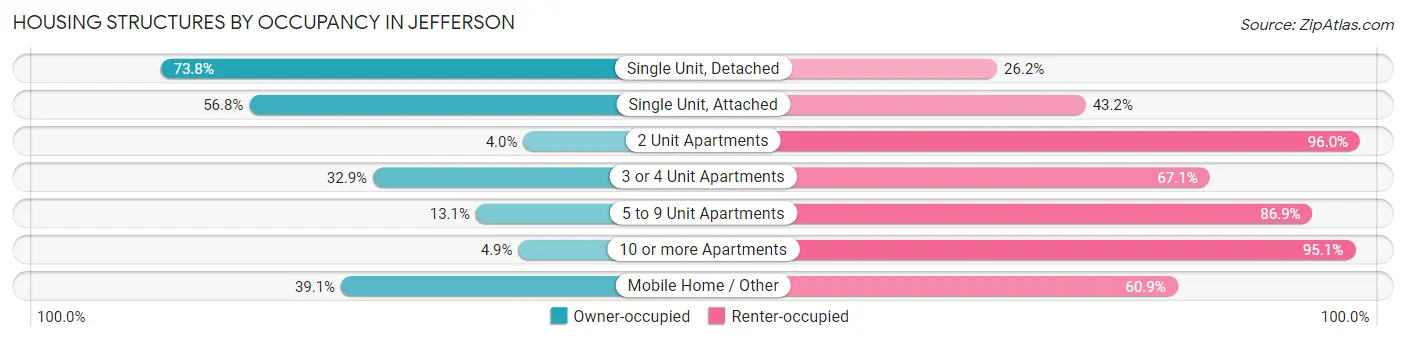
| Structure Type | Owner-occupied | Renter-occupied |
| Single Unit, Detached | 2,323 (73.8%) | 824 (26.2%) |
| Single Unit, Attached | 252 (56.8%) | 192 (43.2%) |
| 2 Unit Apartments | 14 (4.0%) | 338 (96.0%) |
| 3 or 4 Unit Apartments | 84 (32.9%) | 171 (67.1%) |
| 5 to 9 Unit Apartments | 26 (13.1%) | 172 (86.9%) |
| 10 or more Apartments | 34 (4.9%) | 655 (95.1%) |
| Mobile Home / Other | 43 (39.1%) | 67 (60.9%) |
| Total | 2,776 (53.4%) | 2,419 (46.6%) |
Housing Structures by Number of Rooms in Jefferson
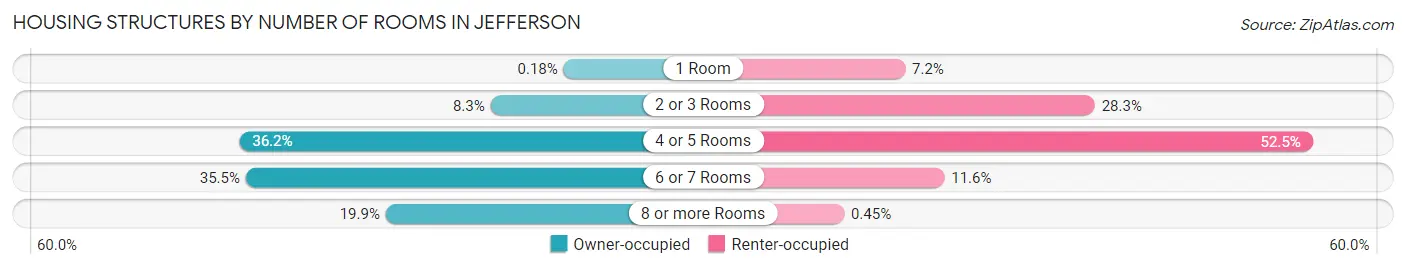
| Number of Rooms | Owner-occupied | Renter-occupied |
| 1 Room | 5 (0.2%) | 175 (7.2%) |
| 2 or 3 Rooms | 230 (8.3%) | 684 (28.3%) |
| 4 or 5 Rooms | 1,004 (36.2%) | 1,269 (52.5%) |
| 6 or 7 Rooms | 984 (35.4%) | 280 (11.6%) |
| 8 or more Rooms | 553 (19.9%) | 11 (0.4%) |
| Total | 2,776 (100.0%) | 2,419 (100.0%) |
Housing Structure by Heating Type in Jefferson
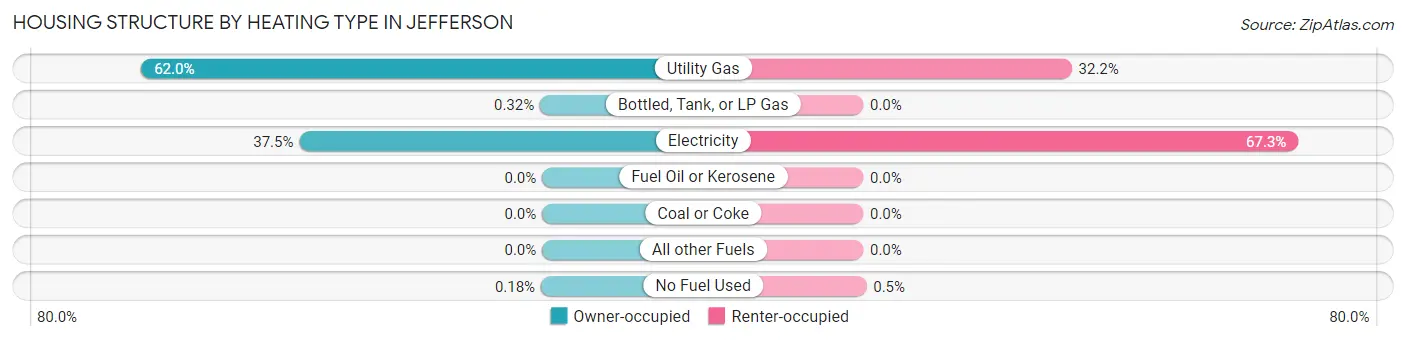
| Heating Type | Owner-occupied | Renter-occupied |
| Utility Gas | 1,720 (62.0%) | 780 (32.2%) |
| Bottled, Tank, or LP Gas | 9 (0.3%) | 0 (0.0%) |
| Electricity | 1,042 (37.5%) | 1,627 (67.3%) |
| Fuel Oil or Kerosene | 0 (0.0%) | 0 (0.0%) |
| Coal or Coke | 0 (0.0%) | 0 (0.0%) |
| All other Fuels | 0 (0.0%) | 0 (0.0%) |
| No Fuel Used | 5 (0.2%) | 12 (0.5%) |
| Total | 2,776 (100.0%) | 2,419 (100.0%) |
Household Vehicle Usage in Jefferson
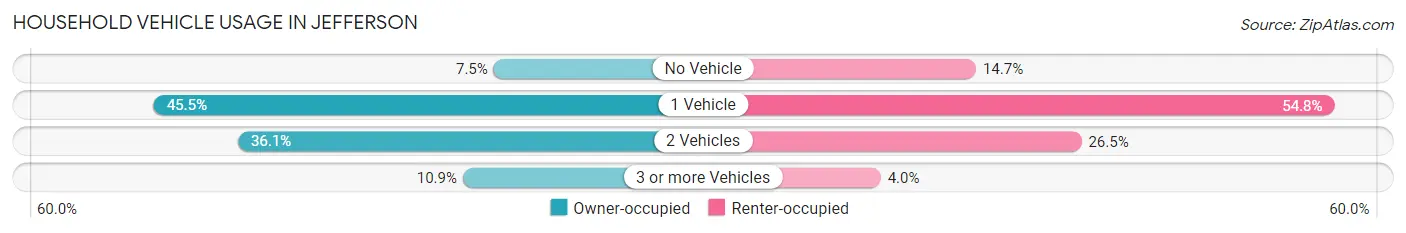
| Vehicles per Household | Owner-occupied | Renter-occupied |
| No Vehicle | 207 (7.5%) | 355 (14.7%) |
| 1 Vehicle | 1,264 (45.5%) | 1,326 (54.8%) |
| 2 Vehicles | 1,002 (36.1%) | 641 (26.5%) |
| 3 or more Vehicles | 303 (10.9%) | 97 (4.0%) |
| Total | 2,776 (100.0%) | 2,419 (100.0%) |
Real Estate & Mortgages in Jefferson
Real Estate and Mortgage Overview in Jefferson
| Characteristic | Without Mortgage | With Mortgage |
| Housing Units | 1,213 | 1,563 |
| Median Property Value | $217,200 | $244,500 |
| Median Household Income | $62,538 | $286 |
| Monthly Housing Costs | $450 | $32 |
| Real Estate Taxes | $664 | $23 |
Property Value by Mortgage Status in Jefferson
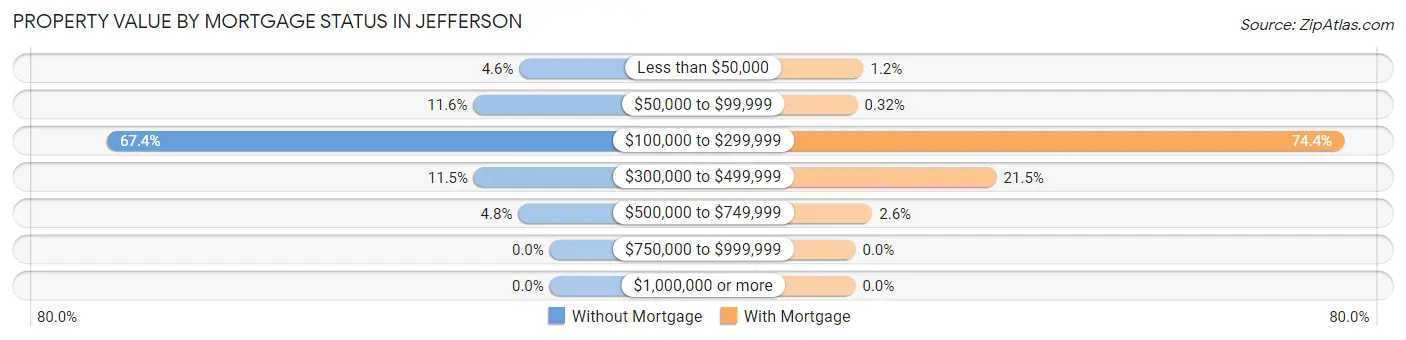
| Property Value | Without Mortgage | With Mortgage |
| Less than $50,000 | 56 (4.6%) | 19 (1.2%) |
| $50,000 to $99,999 | 141 (11.6%) | 5 (0.3%) |
| $100,000 to $299,999 | 818 (67.4%) | 1,163 (74.4%) |
| $300,000 to $499,999 | 140 (11.5%) | 336 (21.5%) |
| $500,000 to $749,999 | 58 (4.8%) | 40 (2.6%) |
| $750,000 to $999,999 | 0 (0.0%) | 0 (0.0%) |
| $1,000,000 or more | 0 (0.0%) | 0 (0.0%) |
| Total | 1,213 (100.0%) | 1,563 (100.0%) |
Household Income by Mortgage Status in Jefferson
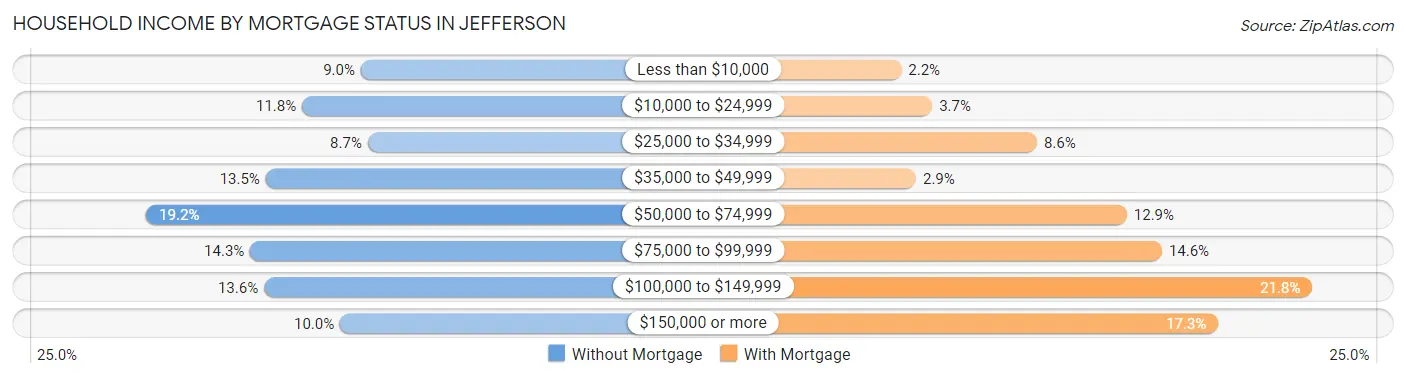
| Household Income | Without Mortgage | With Mortgage |
| Less than $10,000 | 109 (9.0%) | 34 (2.2%) |
| $10,000 to $24,999 | 143 (11.8%) | 57 (3.6%) |
| $25,000 to $34,999 | 105 (8.7%) | 135 (8.6%) |
| $35,000 to $49,999 | 164 (13.5%) | 45 (2.9%) |
| $50,000 to $74,999 | 233 (19.2%) | 202 (12.9%) |
| $75,000 to $99,999 | 173 (14.3%) | 228 (14.6%) |
| $100,000 to $149,999 | 165 (13.6%) | 340 (21.7%) |
| $150,000 or more | 121 (10.0%) | 270 (17.3%) |
| Total | 1,213 (100.0%) | 1,563 (100.0%) |
Property Value to Household Income Ratio in Jefferson
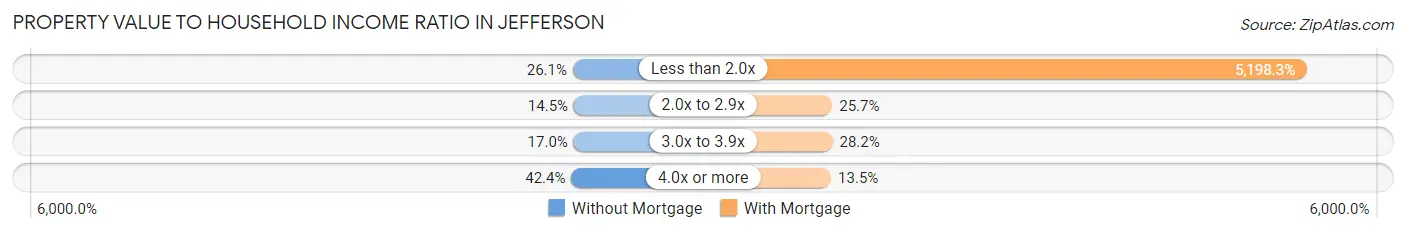
| Value-to-Income Ratio | Without Mortgage | With Mortgage |
| Less than 2.0x | 317 (26.1%) | 81,250 (5,198.3%) |
| 2.0x to 2.9x | 176 (14.5%) | 402 (25.7%) |
| 3.0x to 3.9x | 206 (17.0%) | 441 (28.2%) |
| 4.0x or more | 514 (42.4%) | 211 (13.5%) |
| Total | 1,213 (100.0%) | 1,563 (100.0%) |
Real Estate Taxes by Mortgage Status in Jefferson
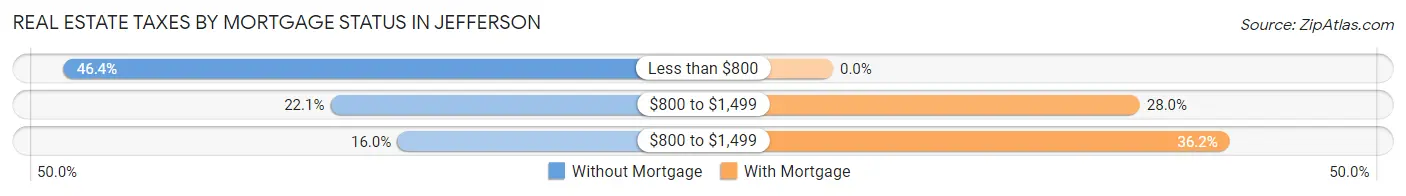
| Property Taxes | Without Mortgage | With Mortgage |
| Less than $800 | 563 (46.4%) | 0 (0.0%) |
| $800 to $1,499 | 268 (22.1%) | 438 (28.0%) |
| $800 to $1,499 | 194 (16.0%) | 566 (36.2%) |
| Total | 1,213 (100.0%) | 1,563 (100.0%) |
Health & Disability in Jefferson
Health Insurance Coverage by Age in Jefferson
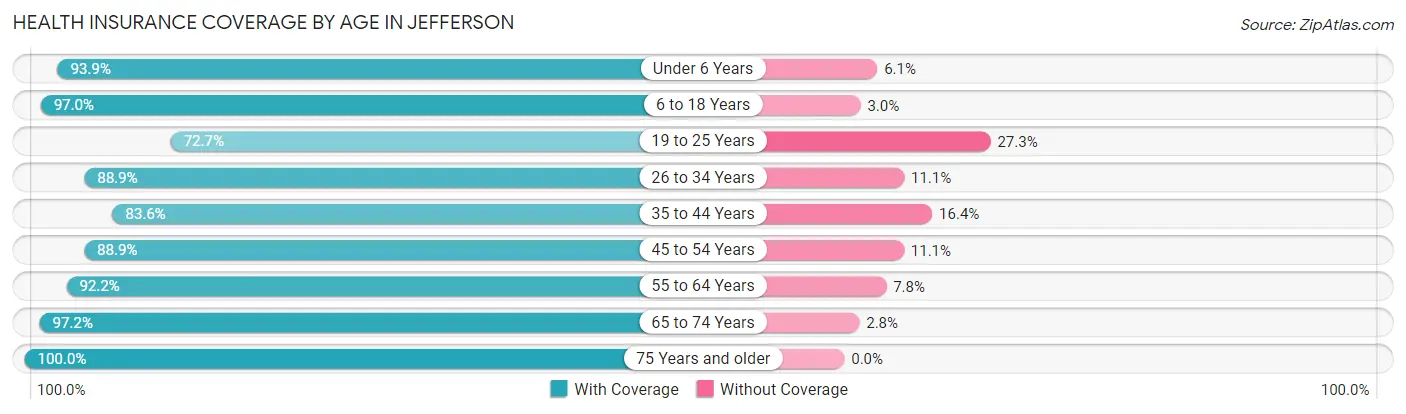
| Age Bracket | With Coverage | Without Coverage |
| Under 6 Years | 428 (93.9%) | 28 (6.1%) |
| 6 to 18 Years | 1,191 (97.0%) | 37 (3.0%) |
| 19 to 25 Years | 507 (72.7%) | 190 (27.3%) |
| 26 to 34 Years | 1,117 (88.9%) | 140 (11.1%) |
| 35 to 44 Years | 1,149 (83.6%) | 225 (16.4%) |
| 45 to 54 Years | 1,040 (88.9%) | 130 (11.1%) |
| 55 to 64 Years | 1,687 (92.2%) | 143 (7.8%) |
| 65 to 74 Years | 1,110 (97.2%) | 32 (2.8%) |
| 75 Years and older | 771 (100.0%) | 0 (0.0%) |
| Total | 9,000 (90.7%) | 925 (9.3%) |
Health Insurance Coverage by Citizenship Status in Jefferson
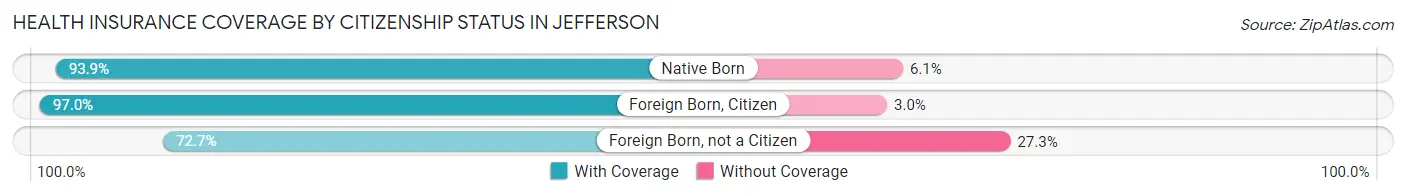
| Citizenship Status | With Coverage | Without Coverage |
| Native Born | 428 (93.9%) | 28 (6.1%) |
| Foreign Born, Citizen | 1,191 (97.0%) | 37 (3.0%) |
| Foreign Born, not a Citizen | 507 (72.7%) | 190 (27.3%) |
Health Insurance Coverage by Household Income in Jefferson
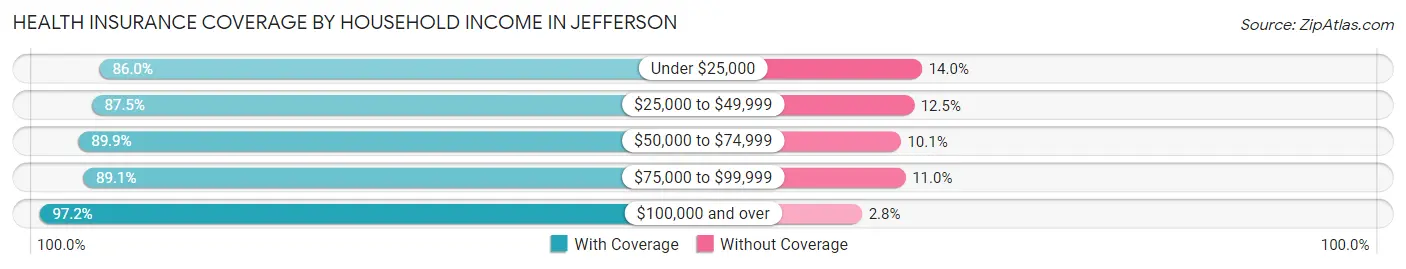
| Household Income | With Coverage | Without Coverage |
| Under $25,000 | 1,377 (86.0%) | 225 (14.0%) |
| $25,000 to $49,999 | 1,988 (87.5%) | 285 (12.5%) |
| $50,000 to $74,999 | 1,449 (89.9%) | 162 (10.1%) |
| $75,000 to $99,999 | 1,317 (89.0%) | 162 (11.0%) |
| $100,000 and over | 2,717 (97.2%) | 78 (2.8%) |
Public vs Private Health Insurance Coverage by Age in Jefferson
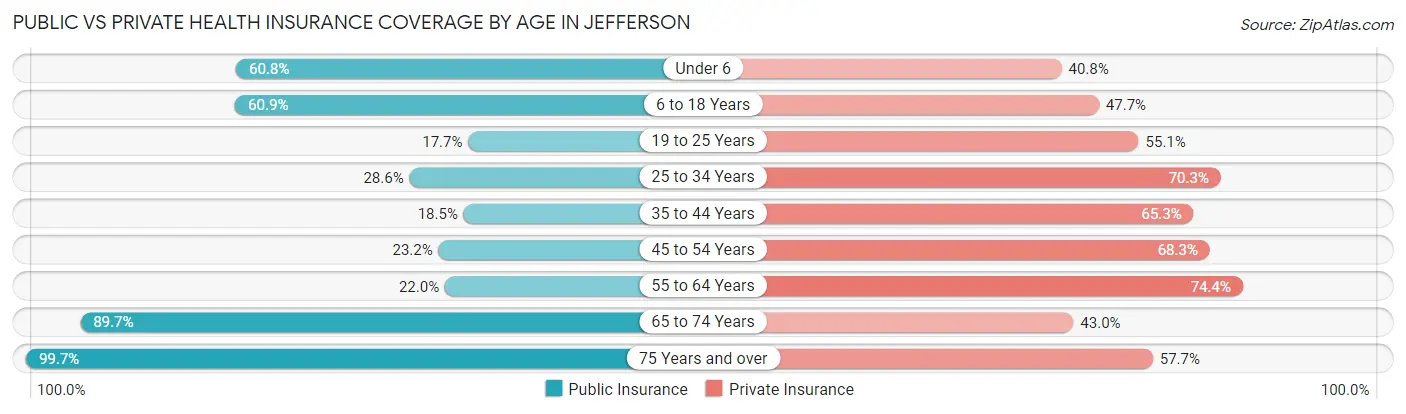
| Age Bracket | Public Insurance | Private Insurance |
| Under 6 | 277 (60.8%) | 186 (40.8%) |
| 6 to 18 Years | 748 (60.9%) | 586 (47.7%) |
| 19 to 25 Years | 123 (17.6%) | 384 (55.1%) |
| 25 to 34 Years | 359 (28.6%) | 884 (70.3%) |
| 35 to 44 Years | 254 (18.5%) | 897 (65.3%) |
| 45 to 54 Years | 271 (23.2%) | 799 (68.3%) |
| 55 to 64 Years | 402 (22.0%) | 1,362 (74.4%) |
| 65 to 74 Years | 1,024 (89.7%) | 491 (43.0%) |
| 75 Years and over | 769 (99.7%) | 445 (57.7%) |
| Total | 4,227 (42.6%) | 6,034 (60.8%) |
Disability Status by Sex by Age in Jefferson
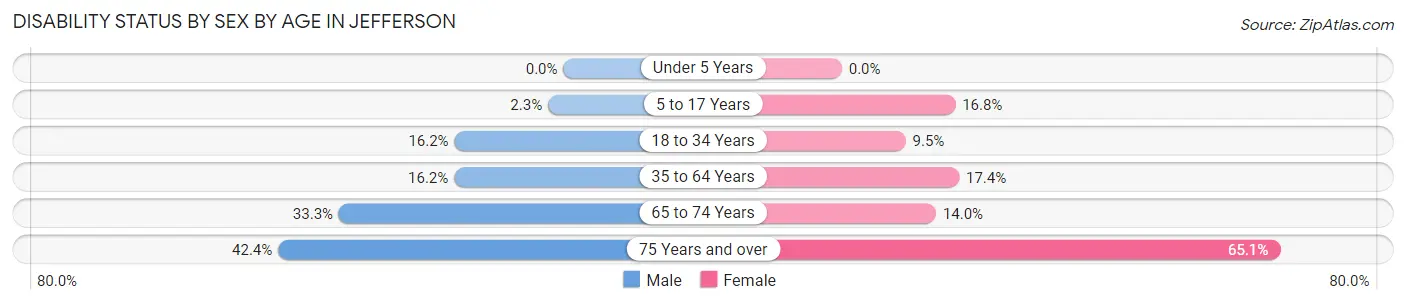
| Age Bracket | Male | Female |
| Under 5 Years | 0 (0.0%) | 0 (0.0%) |
| 5 to 17 Years | 13 (2.3%) | 114 (16.8%) |
| 18 to 34 Years | 141 (16.2%) | 107 (9.5%) |
| 35 to 64 Years | 335 (16.2%) | 402 (17.4%) |
| 65 to 74 Years | 166 (33.3%) | 90 (14.0%) |
| 75 Years and over | 158 (42.4%) | 259 (65.1%) |
Disability Class by Sex by Age in Jefferson
Disability Class: Hearing Difficulty
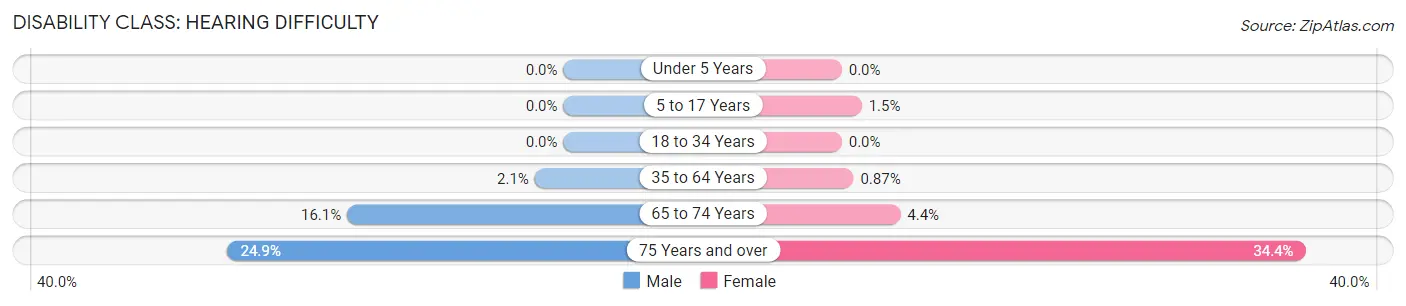
| Age Bracket | Male | Female |
| Under 5 Years | 0 (0.0%) | 0 (0.0%) |
| 5 to 17 Years | 0 (0.0%) | 10 (1.5%) |
| 18 to 34 Years | 0 (0.0%) | 0 (0.0%) |
| 35 to 64 Years | 44 (2.1%) | 20 (0.9%) |
| 65 to 74 Years | 80 (16.1%) | 28 (4.3%) |
| 75 Years and over | 93 (24.9%) | 137 (34.4%) |
Disability Class: Vision Difficulty
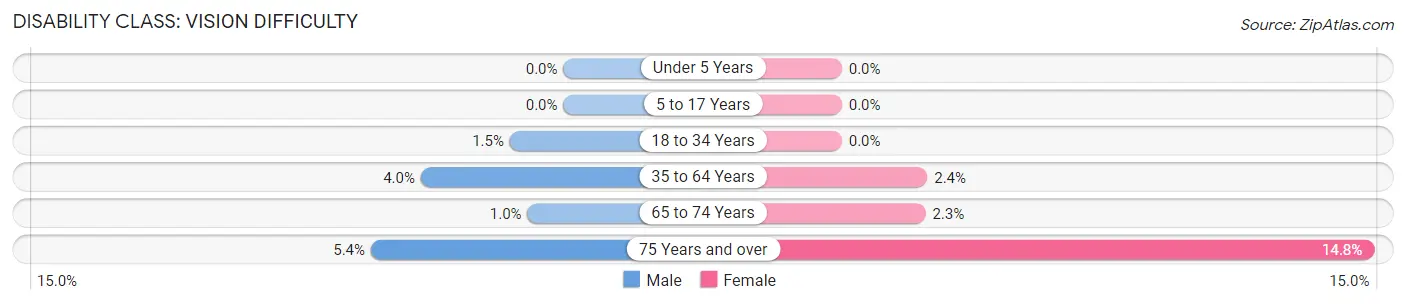
| Age Bracket | Male | Female |
| Under 5 Years | 0 (0.0%) | 0 (0.0%) |
| 5 to 17 Years | 0 (0.0%) | 0 (0.0%) |
| 18 to 34 Years | 13 (1.5%) | 0 (0.0%) |
| 35 to 64 Years | 82 (4.0%) | 55 (2.4%) |
| 65 to 74 Years | 5 (1.0%) | 15 (2.3%) |
| 75 Years and over | 20 (5.4%) | 59 (14.8%) |
Disability Class: Cognitive Difficulty
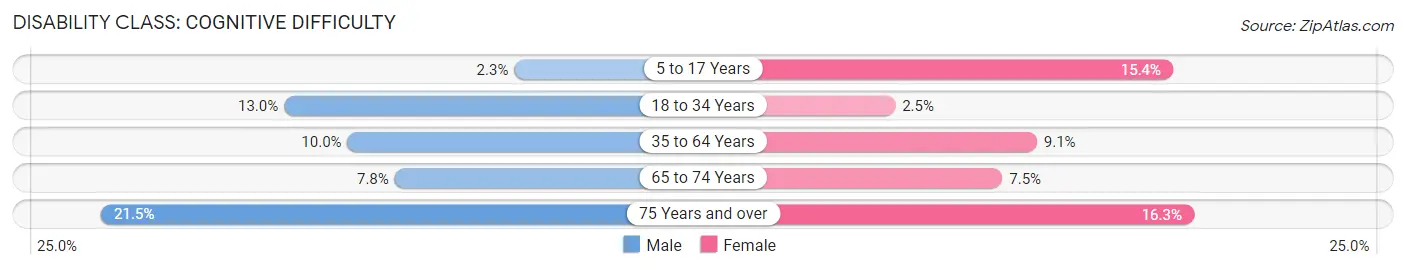
| Age Bracket | Male | Female |
| 5 to 17 Years | 13 (2.3%) | 104 (15.4%) |
| 18 to 34 Years | 113 (13.0%) | 28 (2.5%) |
| 35 to 64 Years | 207 (10.0%) | 209 (9.0%) |
| 65 to 74 Years | 39 (7.8%) | 48 (7.4%) |
| 75 Years and over | 80 (21.4%) | 65 (16.3%) |
Disability Class: Ambulatory Difficulty
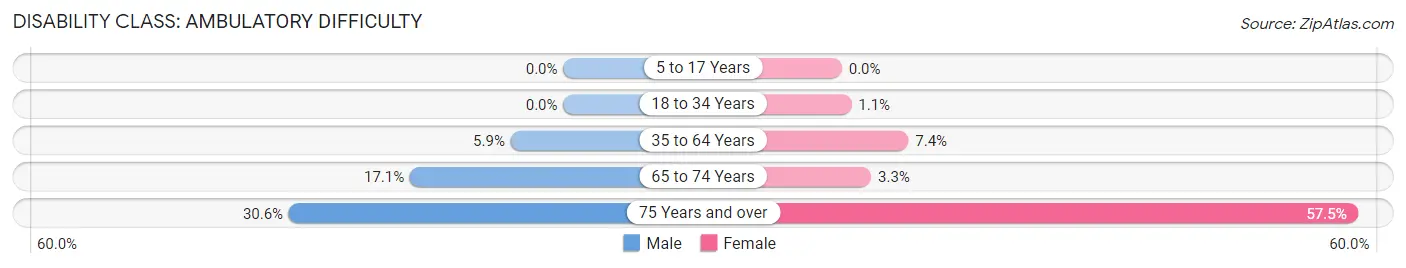
| Age Bracket | Male | Female |
| 5 to 17 Years | 0 (0.0%) | 0 (0.0%) |
| 18 to 34 Years | 0 (0.0%) | 12 (1.1%) |
| 35 to 64 Years | 121 (5.9%) | 171 (7.4%) |
| 65 to 74 Years | 85 (17.1%) | 21 (3.3%) |
| 75 Years and over | 114 (30.6%) | 229 (57.5%) |
Disability Class: Self-Care Difficulty
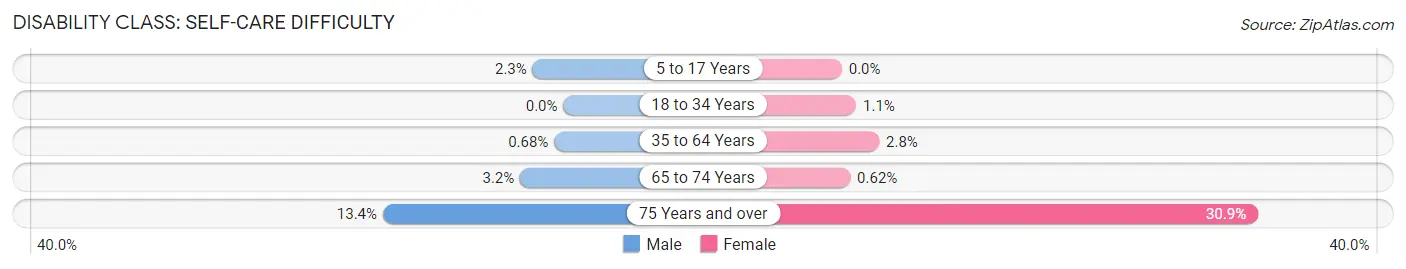
| Age Bracket | Male | Female |
| 5 to 17 Years | 13 (2.3%) | 0 (0.0%) |
| 18 to 34 Years | 0 (0.0%) | 12 (1.1%) |
| 35 to 64 Years | 14 (0.7%) | 64 (2.8%) |
| 65 to 74 Years | 16 (3.2%) | 4 (0.6%) |
| 75 Years and over | 50 (13.4%) | 123 (30.9%) |
Technology Access in Jefferson
Computing Device Access in Jefferson
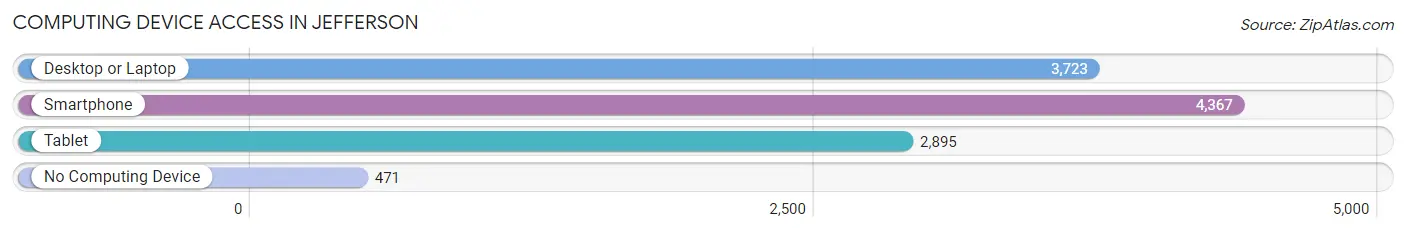
| Device Type | # Households | % Households |
| Desktop or Laptop | 3,723 | 71.7% |
| Smartphone | 4,367 | 84.1% |
| Tablet | 2,895 | 55.7% |
| No Computing Device | 471 | 9.1% |
| Total | 5,195 | 100.0% |
Internet Access in Jefferson
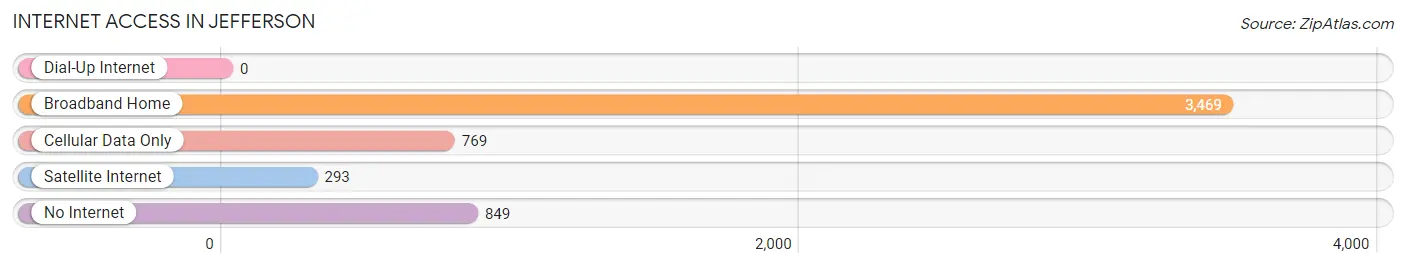
| Internet Type | # Households | % Households |
| Dial-Up Internet | 0 | 0.0% |
| Broadband Home | 3,469 | 66.8% |
| Cellular Data Only | 769 | 14.8% |
| Satellite Internet | 293 | 5.6% |
| No Internet | 849 | 16.3% |
| Total | 5,195 | 100.0% |
Jefferson Summary
Jefferson, Louisiana is a parish located in the southeastern part of the state. It is bordered by the Mississippi River to the east, the Gulf of Mexico to the south, and the parishes of St. Charles, St. John the Baptist, and St. James to the west. The parish seat is the city of Gretna.
History
Jefferson Parish was established in 1825, and was named after Thomas Jefferson, the third President of the United States. The parish was originally part of Orleans Parish, but was split off in 1825 due to the increasing population of the area.
In the early 19th century, the area was largely rural and agricultural, with the main crops being sugar cane and cotton. The area was also home to a large number of Native American tribes, including the Choctaw, Houma, and Chitimacha.
In the late 19th century, the area began to experience rapid growth due to the development of the port of New Orleans and the expansion of the railroad. This led to an influx of immigrants from Europe, particularly from Italy and Ireland.
Geography
Jefferson Parish is located in the southeastern part of Louisiana, and is bordered by the Mississippi River to the east, the Gulf of Mexico to the south, and the parishes of St. Charles, St. John the Baptist, and St. James to the west. The parish covers an area of 576 square miles, and has a population of 433,924 as of the 2010 census.
The parish is divided into two distinct regions: the East Bank and the West Bank. The East Bank is largely urban and suburban, while the West Bank is more rural and agricultural. The parish is home to several cities, including Gretna, Harahan, Kenner, Metairie, and Westwego.
Economy
Jefferson Parish has a diverse economy, with a mix of industries including manufacturing, retail, tourism, and healthcare. The parish is home to several major employers, including Ochsner Health System, Entergy Corporation, and the Port of New Orleans.
The parish is also home to several major tourist attractions, including the Audubon Zoo, the Aquarium of the Americas, and the French Quarter. Tourism is a major source of revenue for the parish, and is estimated to generate over $2 billion annually.
Demographics
As of the 2010 census, Jefferson Parish had a population of 433,924. The racial makeup of the parish was 64.3% White, 28.2% African American, 0.5% Native American, 2.3% Asian, 0.1% Pacific Islander, 2.7% from other races, and 1.9% from two or more races. Hispanic or Latino of any race were 8.3% of the population.
The median household income in the parish was $50,845, and the median family income was $60,879. The per capita income was $25,845. About 11.3% of families and 14.2% of the population were below the poverty line, including 19.2% of those under age 18 and 8.2% of those age 65 or over.
Jefferson Parish is home to a large number of immigrants, particularly from Mexico, Central America, and the Caribbean. The foreign-born population of the parish was estimated to be 8.3% in 2010.
Common Questions
What is Per Capita Income in Jefferson?
Per Capita income in Jefferson is $38,905.
What is the Median Family Income in Jefferson?
Median Family Income in Jefferson is $66,484.
What is the Median Household income in Jefferson?
Median Household Income in Jefferson is $54,808.
What is Income or Wage Gap in Jefferson?
Income or Wage Gap in Jefferson is 4.3%.
Women in Jefferson earn 95.7 cents for every dollar earned by a man.
What is Family Income Deficit in Jefferson?
Family Income Deficit in Jefferson is $7,444.
Families that are below poverty line in Jefferson earn $7,444 less on average than the poverty threshold level.
What is Inequality or Gini Index in Jefferson?
Inequality or Gini Index in Jefferson is 0.44.
What is the Total Population of Jefferson?
Total Population of Jefferson is 10,141.
What is the Total Male Population of Jefferson?
Total Male Population of Jefferson is 4,767.
What is the Total Female Population of Jefferson?
Total Female Population of Jefferson is 5,374.
What is the Ratio of Males per 100 Females in Jefferson?
There are 88.70 Males per 100 Females in Jefferson.
What is the Ratio of Females per 100 Males in Jefferson?
There are 112.73 Females per 100 Males in Jefferson.
What is the Median Population Age in Jefferson?
Median Population Age in Jefferson is 44.9 Years.
What is the Average Family Size in Jefferson
Average Family Size in Jefferson is 2.8 People.
What is the Average Household Size in Jefferson
Average Household Size in Jefferson is 1.9 People.
How Large is the Labor Force in Jefferson?
There are 5,956 People in the Labor Forcein in Jefferson.
What is the Percentage of People in the Labor Force in Jefferson?
68.0% of People are in the Labor Force in Jefferson.
What is the Unemployment Rate in Jefferson?
Unemployment Rate in Jefferson is 4.2%.