Berwick, LA Map & Demographics
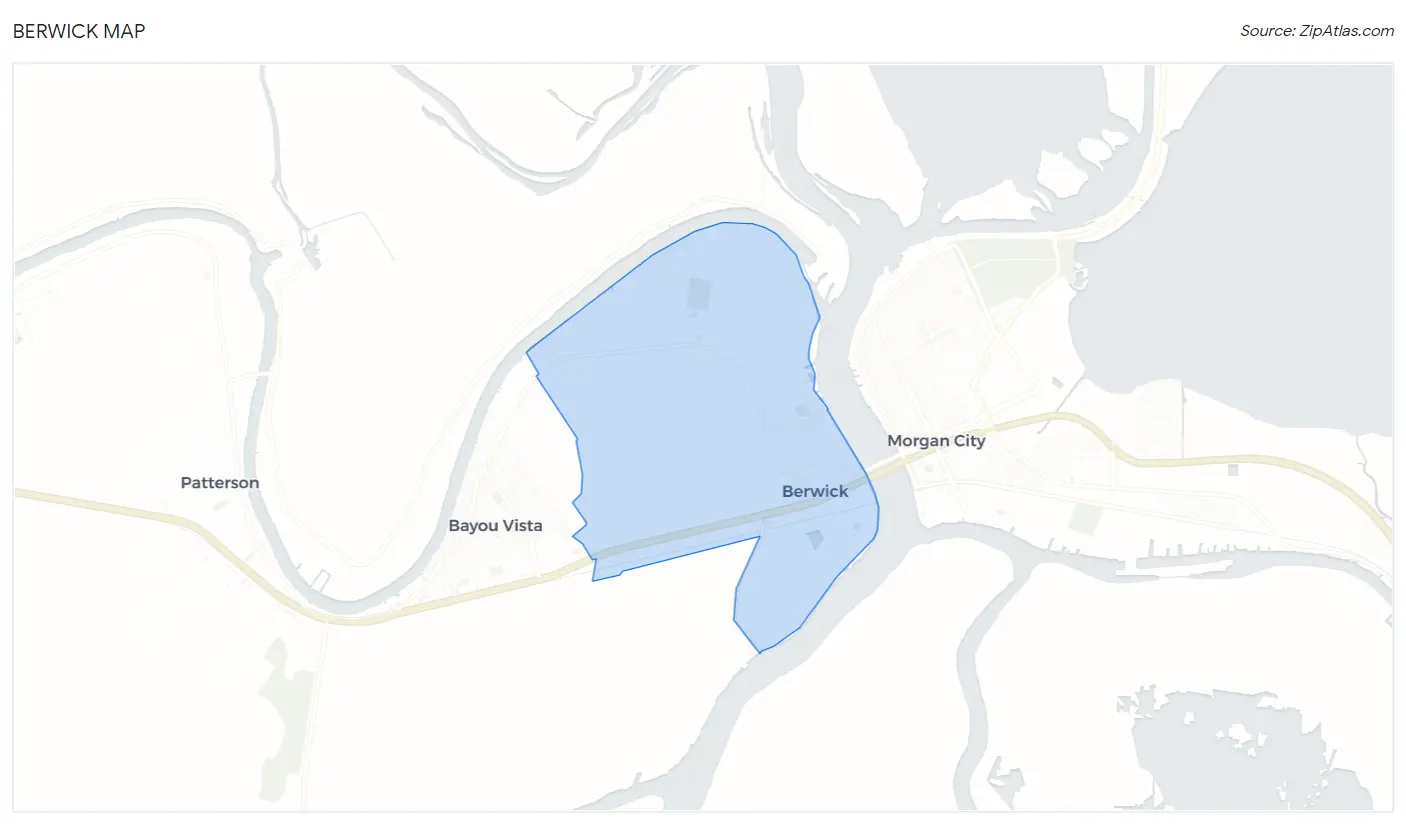
Berwick Map
Berwick Overview
$28,202
PER CAPITA INCOME
$91,667
AVG FAMILY INCOME
$52,458
AVG HOUSEHOLD INCOME
74.8%
WAGE / INCOME GAP [ % ]
25.2¢/ $1
WAGE / INCOME GAP [ $ ]
0.48
INEQUALITY / GINI INDEX
4,717
TOTAL POPULATION
2,241
MALE POPULATION
2,476
FEMALE POPULATION
90.51
MALES / 100 FEMALES
110.49
FEMALES / 100 MALES
34.6
MEDIAN AGE
3.4
AVG FAMILY SIZE
2.7
AVG HOUSEHOLD SIZE
2,161
LABOR FORCE [ PEOPLE ]
62.7%
PERCENT IN LABOR FORCE
10.3%
UNEMPLOYMENT RATE
Berwick Zip Codes
Berwick Area Codes
Income in Berwick
Income Overview in Berwick
Per Capita Income in Berwick is $28,202, while median incomes of families and households are $91,667 and $52,458 respectively.
| Characteristic | Number | Measure |
| Per Capita Income | 4,717 | $28,202 |
| Median Family Income | 1,172 | $91,667 |
| Mean Family Income | 1,172 | $93,024 |
| Median Household Income | 1,731 | $52,458 |
| Mean Household Income | 1,731 | $74,811 |
| Income Deficit | 1,172 | $0 |
| Wage / Income Gap (%) | 4,717 | 74.82% |
| Wage / Income Gap ($) | 4,717 | 25.18¢ per $1 |
| Gini / Inequality Index | 4,717 | 0.48 |
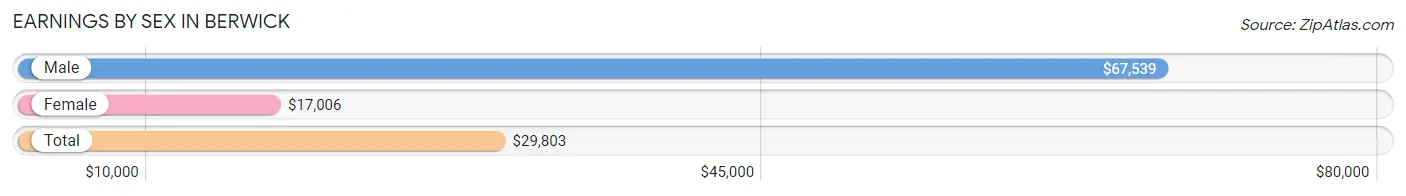
Earnings by Sex in Berwick
Average Earnings in Berwick are $29,803, $67,539 for men and $17,006 for women, a difference of 74.8%.
| Sex | Number | Average Earnings |
| Male | 1,055 (45.5%) | $67,539 |
| Female | 1,266 (54.5%) | $17,006 |
| Total | 2,321 (100.0%) | $29,803 |
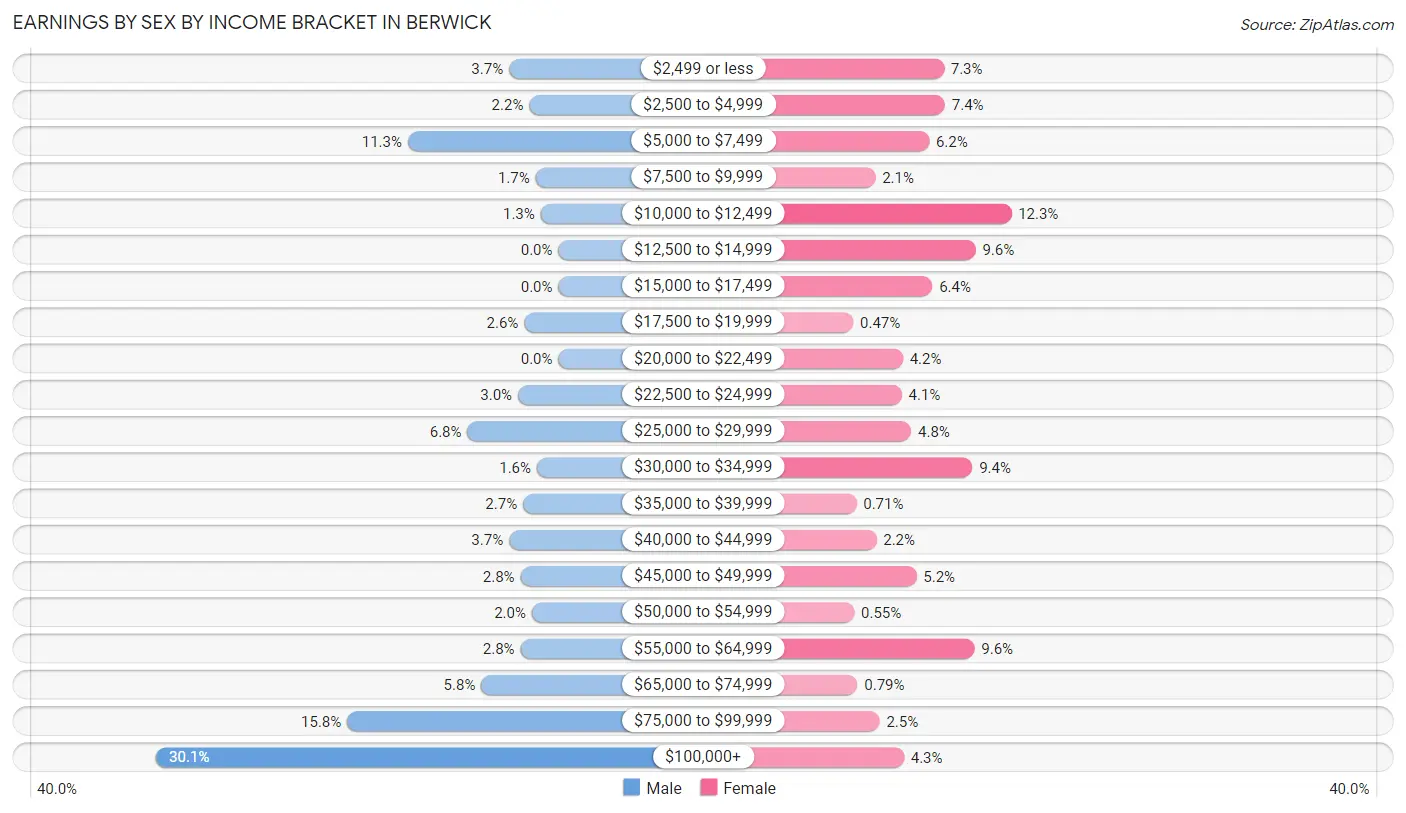
Earnings by Sex by Income Bracket in Berwick
The most common earnings brackets in Berwick are $100,000+ for men (318 | 30.1%) and $10,000 to $12,499 for women (156 | 12.3%).
| Income | Male | Female |
| $2,499 or less | 39 (3.7%) | 92 (7.3%) |
| $2,500 to $4,999 | 23 (2.2%) | 93 (7.3%) |
| $5,000 to $7,499 | 119 (11.3%) | 78 (6.2%) |
| $7,500 to $9,999 | 18 (1.7%) | 27 (2.1%) |
| $10,000 to $12,499 | 14 (1.3%) | 156 (12.3%) |
| $12,500 to $14,999 | 0 (0.0%) | 122 (9.6%) |
| $15,000 to $17,499 | 0 (0.0%) | 81 (6.4%) |
| $17,500 to $19,999 | 27 (2.6%) | 6 (0.5%) |
| $20,000 to $22,499 | 0 (0.0%) | 53 (4.2%) |
| $22,500 to $24,999 | 32 (3.0%) | 52 (4.1%) |
| $25,000 to $29,999 | 72 (6.8%) | 61 (4.8%) |
| $30,000 to $34,999 | 17 (1.6%) | 119 (9.4%) |
| $35,000 to $39,999 | 28 (2.6%) | 9 (0.7%) |
| $40,000 to $44,999 | 39 (3.7%) | 28 (2.2%) |
| $45,000 to $49,999 | 30 (2.8%) | 66 (5.2%) |
| $50,000 to $54,999 | 21 (2.0%) | 7 (0.5%) |
| $55,000 to $64,999 | 30 (2.8%) | 121 (9.6%) |
| $65,000 to $74,999 | 61 (5.8%) | 10 (0.8%) |
| $75,000 to $99,999 | 167 (15.8%) | 31 (2.5%) |
| $100,000+ | 318 (30.1%) | 54 (4.3%) |
| Total | 1,055 (100.0%) | 1,266 (100.0%) |
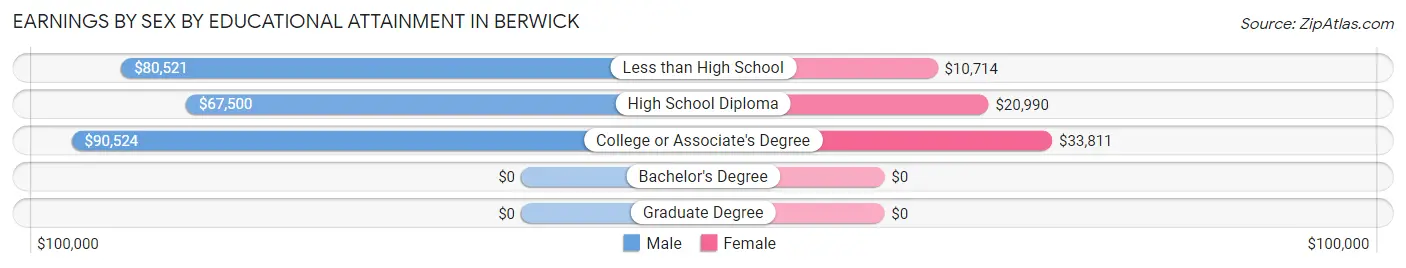
Earnings by Sex by Educational Attainment in Berwick
Average earnings in Berwick are $80,075 for men and $21,297 for women, a difference of 73.4%. Men with an educational attainment of college or associate's degree enjoy the highest average annual earnings of $90,524, while those with high school diploma education earn the least with $67,500. Women with an educational attainment of college or associate's degree earn the most with the average annual earnings of $33,811, while those with less than high school education have the smallest earnings of $10,714.
| Educational Attainment | Male Income | Female Income |
| Less than High School | $80,521 | $10,714 |
| High School Diploma | $67,500 | $20,990 |
| College or Associate's Degree | $90,524 | $33,811 |
| Bachelor's Degree | - | - |
| Graduate Degree | - | - |
| Total | $80,075 | $21,297 |
Family Income in Berwick
Family Income Brackets in Berwick
According to the Berwick family income data, there are 302 families falling into the $100,000 to $149,999 income range, which is the most common income bracket and makes up 25.8% of all families. Conversely, the $25,000 to $34,999 income bracket is the least frequent group with only 53 families (4.5%) belonging to this category.
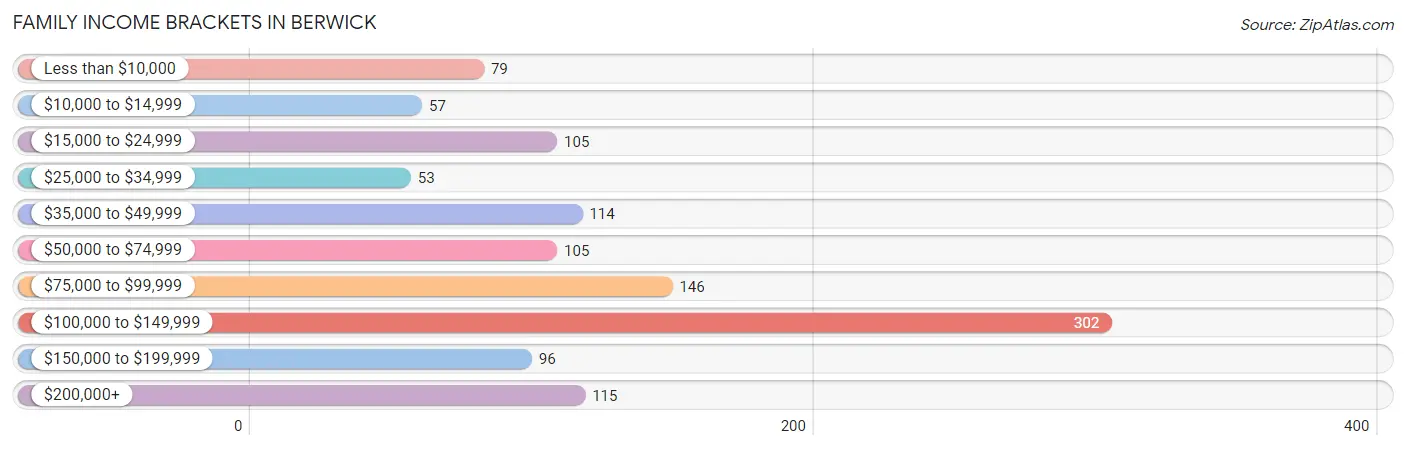
| Income Bracket | # Families | % Families |
| Less than $10,000 | 79 | 6.7% |
| $10,000 to $14,999 | 57 | 4.9% |
| $15,000 to $24,999 | 105 | 9.0% |
| $25,000 to $34,999 | 53 | 4.5% |
| $35,000 to $49,999 | 114 | 9.7% |
| $50,000 to $74,999 | 105 | 9.0% |
| $75,000 to $99,999 | 146 | 12.5% |
| $100,000 to $149,999 | 302 | 25.8% |
| $150,000 to $199,999 | 96 | 8.2% |
| $200,000+ | 115 | 9.8% |
Family Income by Famaliy Size in Berwick
4-person families (160 | 13.7%) account for the highest median family income in Berwick with $98,833 per family, while 2-person families (527 | 45.0%) have the highest median income of $46,648 per family member.
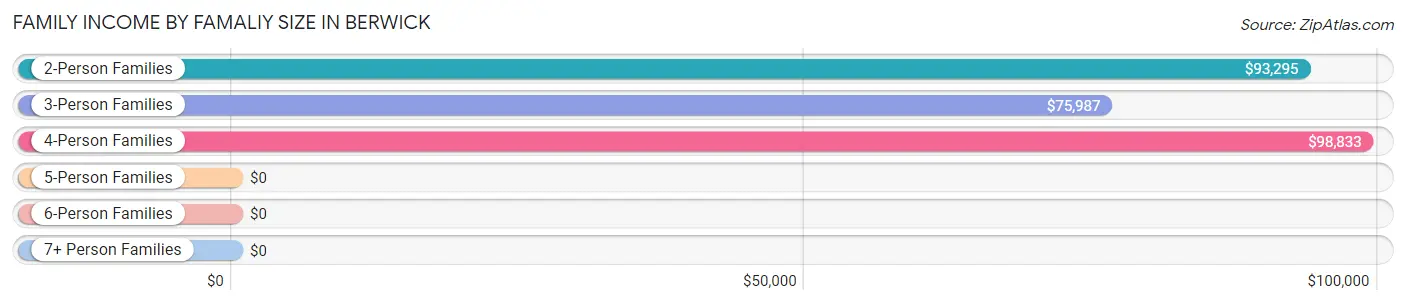
| Income Bracket | # Families | Median Income |
| 2-Person Families | 527 (45.0%) | $93,295 |
| 3-Person Families | 419 (35.7%) | $75,987 |
| 4-Person Families | 160 (13.7%) | $98,833 |
| 5-Person Families | 37 (3.2%) | $0 |
| 6-Person Families | 16 (1.4%) | $0 |
| 7+ Person Families | 13 (1.1%) | $0 |
| Total | 1,172 (100.0%) | $91,667 |
Family Income by Number of Earners in Berwick
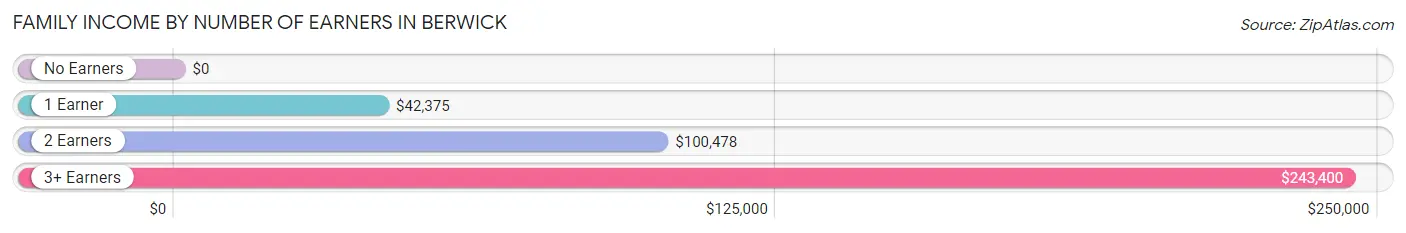
| Number of Earners | # Families | Median Income |
| No Earners | 174 (14.8%) | $0 |
| 1 Earner | 357 (30.5%) | $42,375 |
| 2 Earners | 525 (44.8%) | $100,478 |
| 3+ Earners | 116 (9.9%) | $243,400 |
| Total | 1,172 (100.0%) | $91,667 |
Household Income in Berwick
Household Income Brackets in Berwick
With 319 households falling in the category, the $100,000 to $149,999 income range is the most frequent in Berwick, accounting for 18.4% of all households. In contrast, only 111 households (6.4%) fall into the $150,000 to $199,999 income bracket, making it the least populous group.
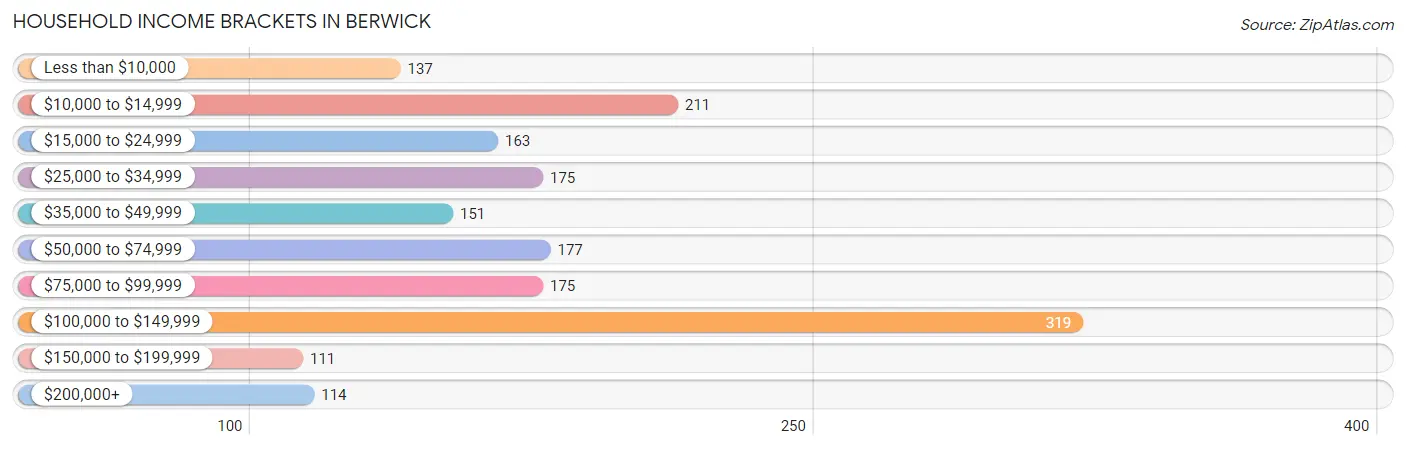
| Income Bracket | # Households | % Households |
| Less than $10,000 | 137 | 7.9% |
| $10,000 to $14,999 | 211 | 12.2% |
| $15,000 to $24,999 | 163 | 9.4% |
| $25,000 to $34,999 | 175 | 10.1% |
| $35,000 to $49,999 | 151 | 8.7% |
| $50,000 to $74,999 | 177 | 10.2% |
| $75,000 to $99,999 | 175 | 10.1% |
| $100,000 to $149,999 | 319 | 18.4% |
| $150,000 to $199,999 | 111 | 6.4% |
| $200,000+ | 114 | 6.6% |
Household Income by Householder Age in Berwick
The median household income in Berwick is $52,458, with the highest median household income of $90,469 found in the 45 to 64 years age bracket for the primary householder. A total of 745 households (43.0%) fall into this category. Meanwhile, the 15 to 24 years age bracket for the primary householder has the lowest median household income of $0, with 41 households (2.4%) in this group.
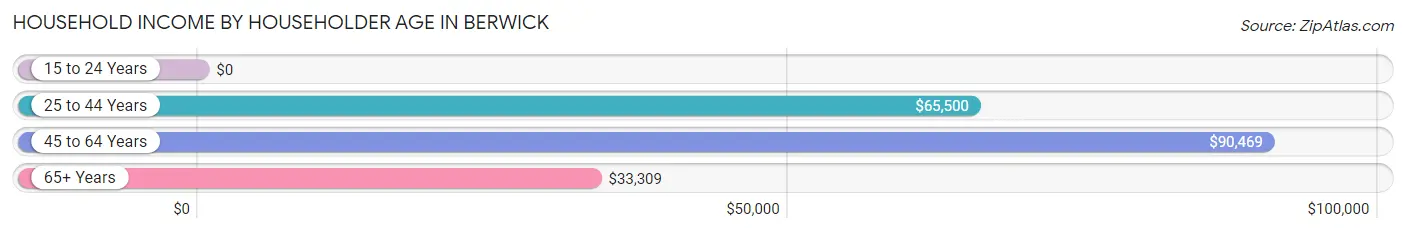
| Income Bracket | # Households | Median Income |
| 15 to 24 Years | 41 (2.4%) | $0 |
| 25 to 44 Years | 520 (30.0%) | $65,500 |
| 45 to 64 Years | 745 (43.0%) | $90,469 |
| 65+ Years | 425 (24.5%) | $33,309 |
| Total | 1,731 (100.0%) | $52,458 |
Poverty in Berwick
Income Below Poverty by Sex and Age in Berwick
With 18.2% poverty level for males and 28.5% for females among the residents of Berwick, 18 to 24 year old males and under 5 year old females are the most vulnerable to poverty, with 105 males (45.7%) and 79 females (68.1%) in their respective age groups living below the poverty level.
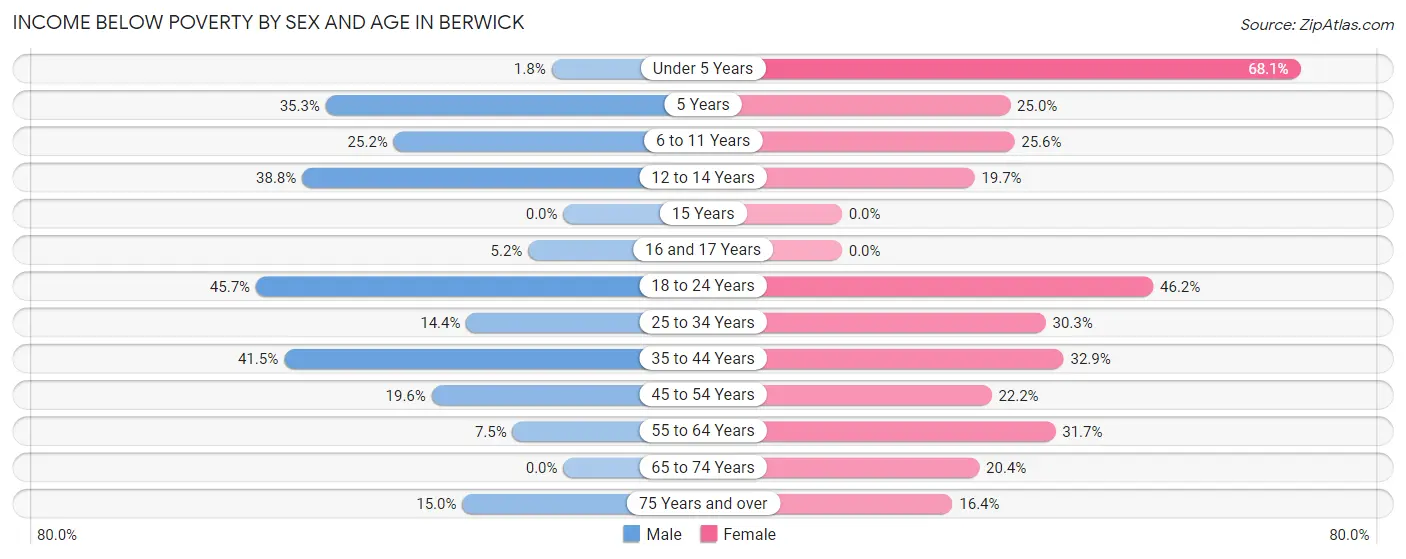
| Age Bracket | Male | Female |
| Under 5 Years | 7 (1.8%) | 79 (68.1%) |
| 5 Years | 18 (35.3%) | 6 (25.0%) |
| 6 to 11 Years | 31 (25.2%) | 63 (25.6%) |
| 12 to 14 Years | 45 (38.8%) | 26 (19.7%) |
| 15 Years | 0 (0.0%) | 0 (0.0%) |
| 16 and 17 Years | 6 (5.2%) | 0 (0.0%) |
| 18 to 24 Years | 105 (45.7%) | 92 (46.2%) |
| 25 to 34 Years | 34 (14.4%) | 92 (30.3%) |
| 35 to 44 Years | 73 (41.5%) | 82 (32.9%) |
| 45 to 54 Years | 53 (19.6%) | 80 (22.2%) |
| 55 to 64 Years | 23 (7.5%) | 110 (31.7%) |
| 65 to 74 Years | 0 (0.0%) | 31 (20.4%) |
| 75 Years and over | 9 (15.0%) | 44 (16.4%) |
| Total | 404 (18.2%) | 705 (28.5%) |
Income Above Poverty by Sex and Age in Berwick
According to the poverty statistics in Berwick, males aged 15 years and females aged 15 years are the age groups that are most secure financially, with 100.0% of males and 100.0% of females in these age groups living above the poverty line.
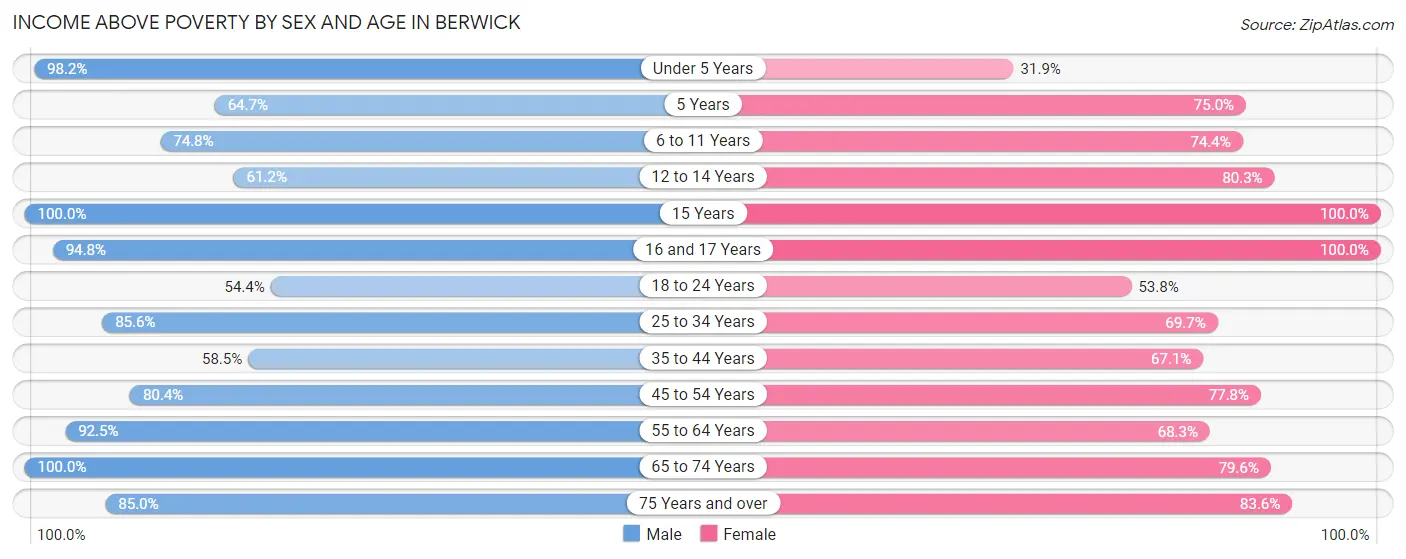
| Age Bracket | Male | Female |
| Under 5 Years | 390 (98.2%) | 37 (31.9%) |
| 5 Years | 33 (64.7%) | 18 (75.0%) |
| 6 to 11 Years | 92 (74.8%) | 183 (74.4%) |
| 12 to 14 Years | 71 (61.2%) | 106 (80.3%) |
| 15 Years | 6 (100.0%) | 60 (100.0%) |
| 16 and 17 Years | 109 (94.8%) | 19 (100.0%) |
| 18 to 24 Years | 125 (54.3%) | 107 (53.8%) |
| 25 to 34 Years | 202 (85.6%) | 212 (69.7%) |
| 35 to 44 Years | 103 (58.5%) | 167 (67.1%) |
| 45 to 54 Years | 218 (80.4%) | 280 (77.8%) |
| 55 to 64 Years | 282 (92.5%) | 237 (68.3%) |
| 65 to 74 Years | 130 (100.0%) | 121 (79.6%) |
| 75 Years and over | 51 (85.0%) | 224 (83.6%) |
| Total | 1,812 (81.8%) | 1,771 (71.5%) |
Income Below Poverty Among Married-Couple Families in Berwick
The poverty statistics for married-couple families in Berwick show that 10.0% or 74 of the total 743 families live below the poverty line. Families with 3 or 4 children have the highest poverty rate of 34.6%, comprising of 9 families. On the other hand, families with 1 or 2 children have the lowest poverty rate of 0.0%, which includes 0 families.
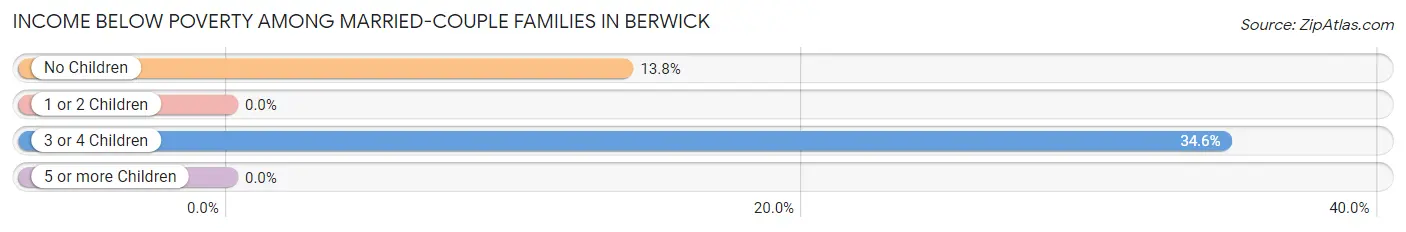
| Children | Above Poverty | Below Poverty |
| No Children | 407 (86.2%) | 65 (13.8%) |
| 1 or 2 Children | 245 (100.0%) | 0 (0.0%) |
| 3 or 4 Children | 17 (65.4%) | 9 (34.6%) |
| 5 or more Children | 0 (0.0%) | 0 (0.0%) |
| Total | 669 (90.0%) | 74 (10.0%) |
Income Below Poverty Among Single-Parent Households in Berwick
According to the poverty data in Berwick, 9.8% or 11 single-father households and 39.1% or 124 single-mother households are living below the poverty line. Among single-father households, those with no children have the highest poverty rate, with 11 households (50.0%) experiencing poverty. Likewise, among single-mother households, those with 3 or 4 children have the highest poverty rate, with 28 households (100.0%) falling below the poverty line.
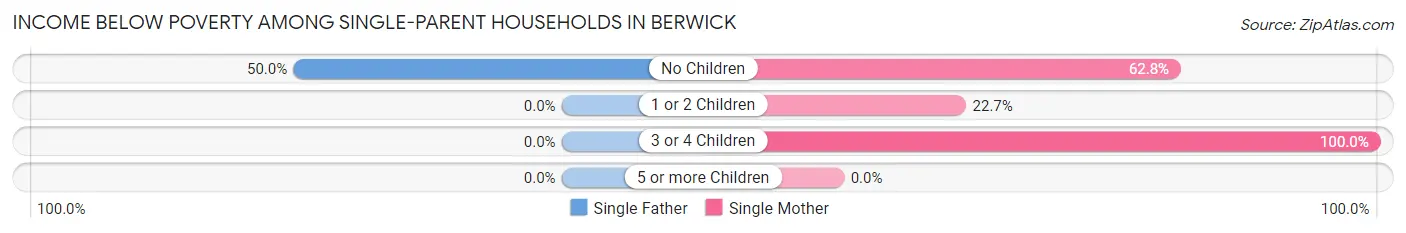
| Children | Single Father | Single Mother |
| No Children | 11 (50.0%) | 49 (62.8%) |
| 1 or 2 Children | 0 (0.0%) | 47 (22.7%) |
| 3 or 4 Children | 0 (0.0%) | 28 (100.0%) |
| 5 or more Children | 0 (0.0%) | 0 (0.0%) |
| Total | 11 (9.8%) | 124 (39.1%) |
Income Below Poverty Among Married-Couple vs Single-Parent Households in Berwick
The poverty data for Berwick shows that 74 of the married-couple family households (10.0%) and 135 of the single-parent households (31.5%) are living below the poverty level. Within the married-couple family households, those with 3 or 4 children have the highest poverty rate, with 9 households (34.6%) falling below the poverty line. Among the single-parent households, those with 3 or 4 children have the highest poverty rate, with 28 household (100.0%) living below poverty.
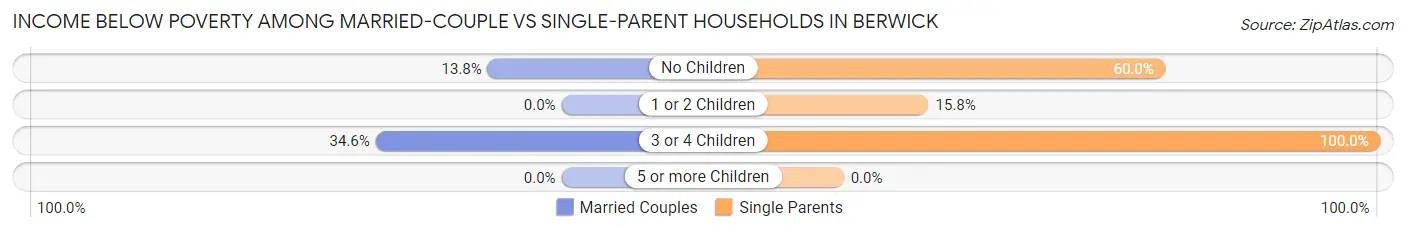
| Children | Married-Couple Families | Single-Parent Households |
| No Children | 65 (13.8%) | 60 (60.0%) |
| 1 or 2 Children | 0 (0.0%) | 47 (15.8%) |
| 3 or 4 Children | 9 (34.6%) | 28 (100.0%) |
| 5 or more Children | 0 (0.0%) | 0 (0.0%) |
| Total | 74 (10.0%) | 135 (31.5%) |
Race in Berwick
The most populous races in Berwick are White / Caucasian (3,768 | 79.9%), Black / African American (588 | 12.5%), and Hispanic or Latino (275 | 5.8%).
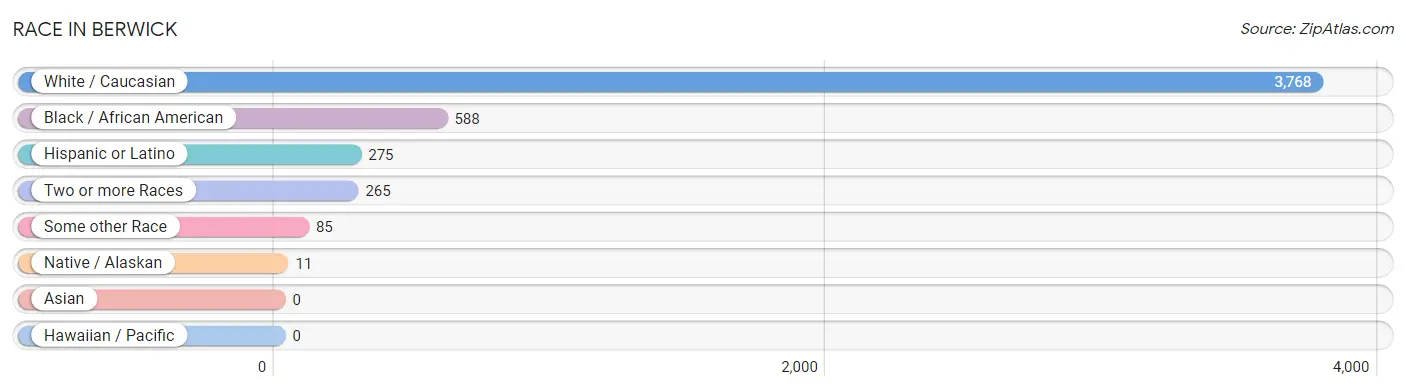
| Race | # Population | % Population |
| Asian | 0 | 0.0% |
| Black / African American | 588 | 12.5% |
| Hawaiian / Pacific | 0 | 0.0% |
| Hispanic or Latino | 275 | 5.8% |
| Native / Alaskan | 11 | 0.2% |
| White / Caucasian | 3,768 | 79.9% |
| Two or more Races | 265 | 5.6% |
| Some other Race | 85 | 1.8% |
| Total | 4,717 | 100.0% |
Ancestry in Berwick
The most populous ancestries reported in Berwick are French (983 | 20.8%), Italian (529 | 11.2%), American (478 | 10.1%), English (292 | 6.2%), and Irish (233 | 4.9%), together accounting for 53.3% of all Berwick residents.
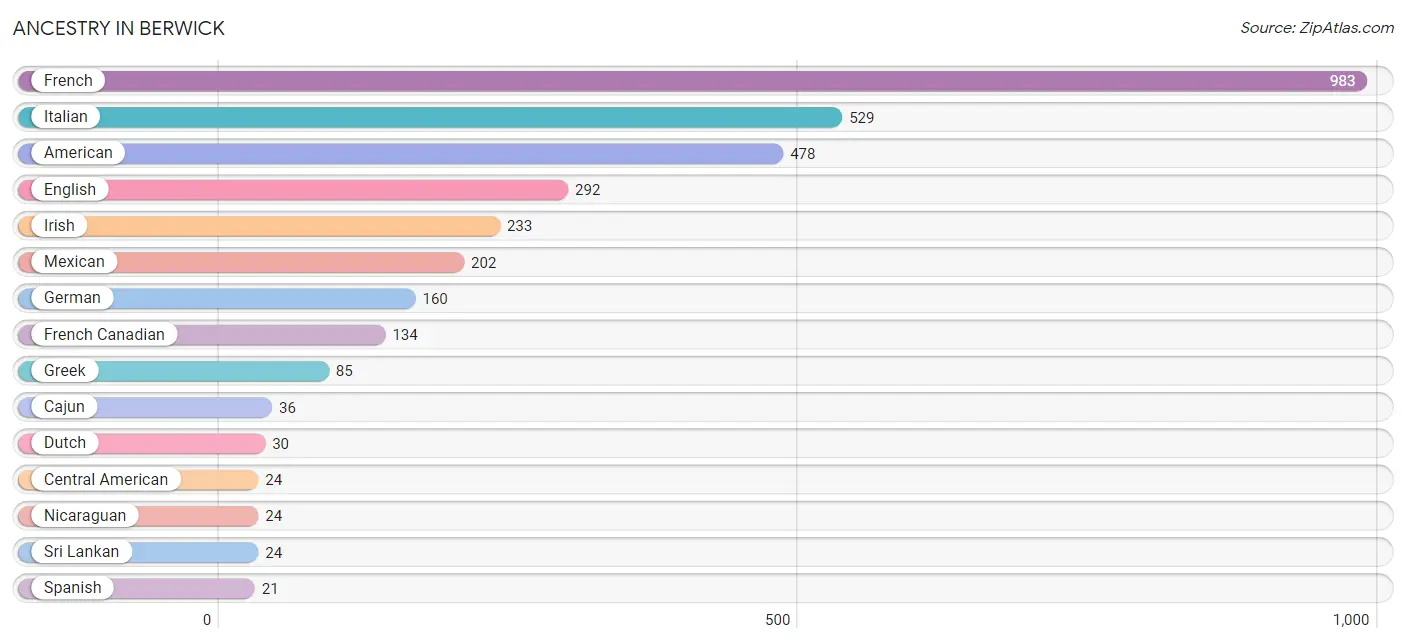
| Ancestry | # Population | % Population |
| American | 478 | 10.1% |
| Arab | 11 | 0.2% |
| Cajun | 36 | 0.8% |
| Central American | 24 | 0.5% |
| Cherokee | 2 | 0.0% |
| Choctaw | 1 | 0.0% |
| Cuban | 11 | 0.2% |
| Dutch | 30 | 0.6% |
| English | 292 | 6.2% |
| French | 983 | 20.8% |
| French Canadian | 134 | 2.8% |
| German | 160 | 3.4% |
| Greek | 85 | 1.8% |
| Inupiat | 11 | 0.2% |
| Irish | 233 | 4.9% |
| Italian | 529 | 11.2% |
| Lebanese | 11 | 0.2% |
| Mexican | 202 | 4.3% |
| Nicaraguan | 24 | 0.5% |
| Puerto Rican | 11 | 0.2% |
| Spanish | 21 | 0.4% |
| Sri Lankan | 24 | 0.5% |
| Welsh | 18 | 0.4% | View All 23 Rows |
Immigrants in Berwick
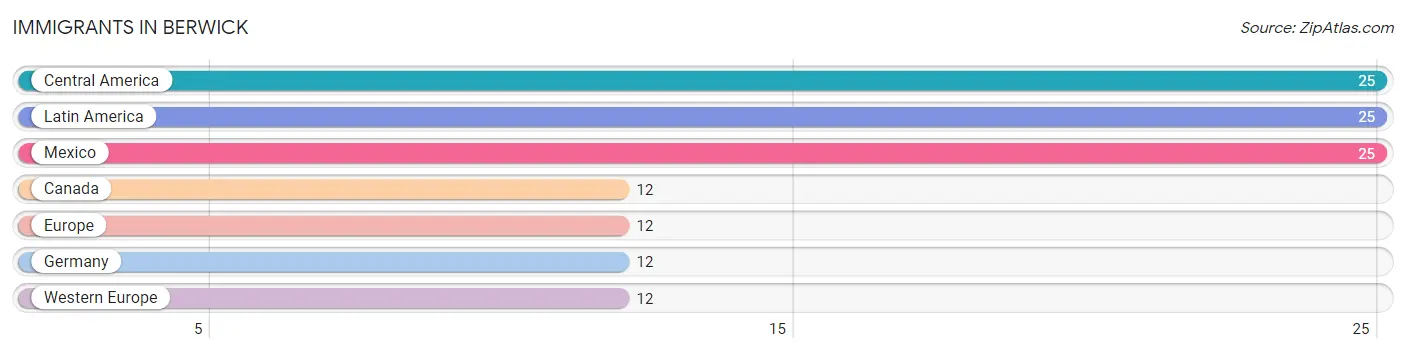
The most numerous immigrant groups reported in Berwick came from Central America (25 | 0.5%), Latin America (25 | 0.5%), Mexico (25 | 0.5%), Canada (12 | 0.3%), and Europe (12 | 0.3%), together accounting for 2.1% of all Berwick residents.
| Immigration Origin | # Population | % Population |
| Canada | 12 | 0.3% |
| Central America | 25 | 0.5% |
| Europe | 12 | 0.3% |
| Germany | 12 | 0.3% |
| Latin America | 25 | 0.5% |
| Mexico | 25 | 0.5% |
| Western Europe | 12 | 0.3% | View All 7 Rows |
Sex and Age in Berwick
Sex and Age in Berwick
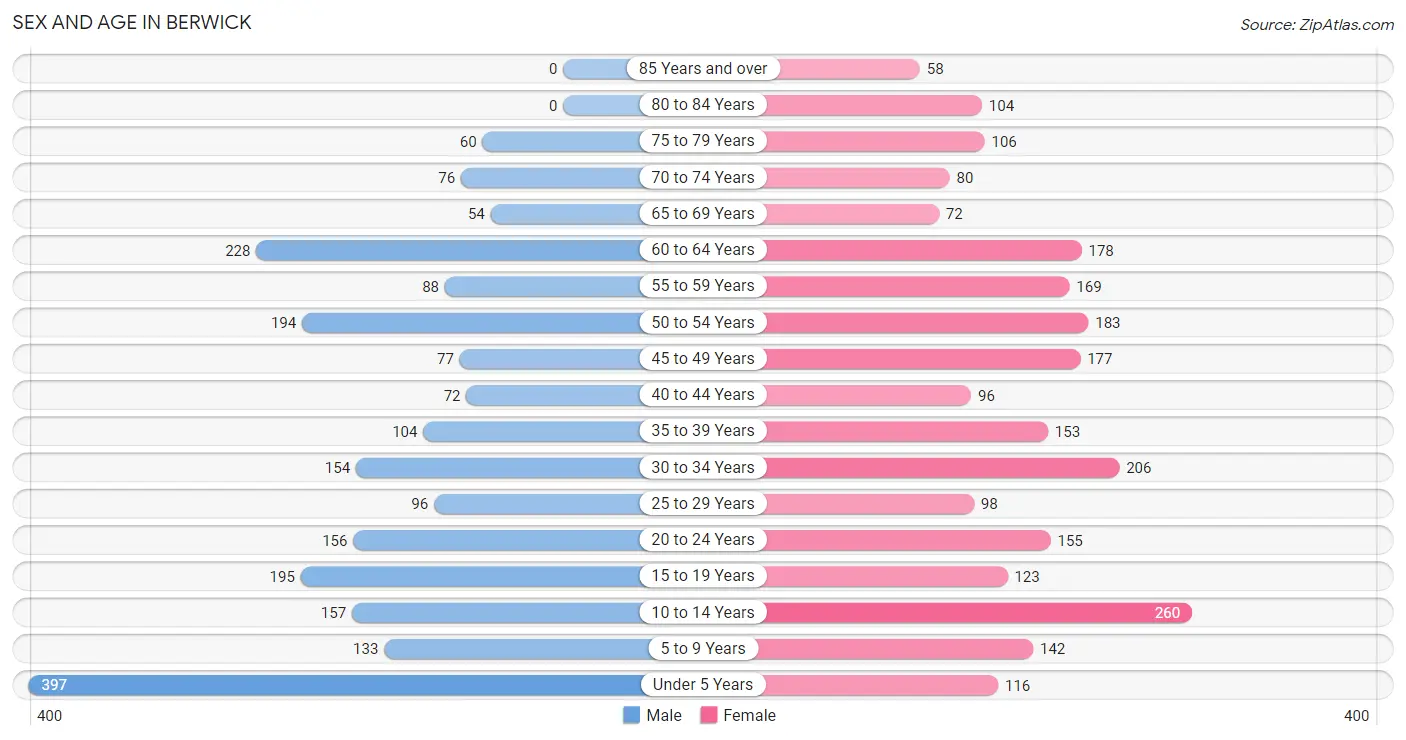
The most populous age groups in Berwick are Under 5 Years (397 | 17.7%) for men and 10 to 14 Years (260 | 10.5%) for women.
| Age Bracket | Male | Female |
| Under 5 Years | 397 (17.7%) | 116 (4.7%) |
| 5 to 9 Years | 133 (5.9%) | 142 (5.7%) |
| 10 to 14 Years | 157 (7.0%) | 260 (10.5%) |
| 15 to 19 Years | 195 (8.7%) | 123 (5.0%) |
| 20 to 24 Years | 156 (7.0%) | 155 (6.3%) |
| 25 to 29 Years | 96 (4.3%) | 98 (4.0%) |
| 30 to 34 Years | 154 (6.9%) | 206 (8.3%) |
| 35 to 39 Years | 104 (4.6%) | 153 (6.2%) |
| 40 to 44 Years | 72 (3.2%) | 96 (3.9%) |
| 45 to 49 Years | 77 (3.4%) | 177 (7.1%) |
| 50 to 54 Years | 194 (8.7%) | 183 (7.4%) |
| 55 to 59 Years | 88 (3.9%) | 169 (6.8%) |
| 60 to 64 Years | 228 (10.2%) | 178 (7.2%) |
| 65 to 69 Years | 54 (2.4%) | 72 (2.9%) |
| 70 to 74 Years | 76 (3.4%) | 80 (3.2%) |
| 75 to 79 Years | 60 (2.7%) | 106 (4.3%) |
| 80 to 84 Years | 0 (0.0%) | 104 (4.2%) |
| 85 Years and over | 0 (0.0%) | 58 (2.3%) |
| Total | 2,241 (100.0%) | 2,476 (100.0%) |
Families and Households in Berwick
Median Family Size in Berwick
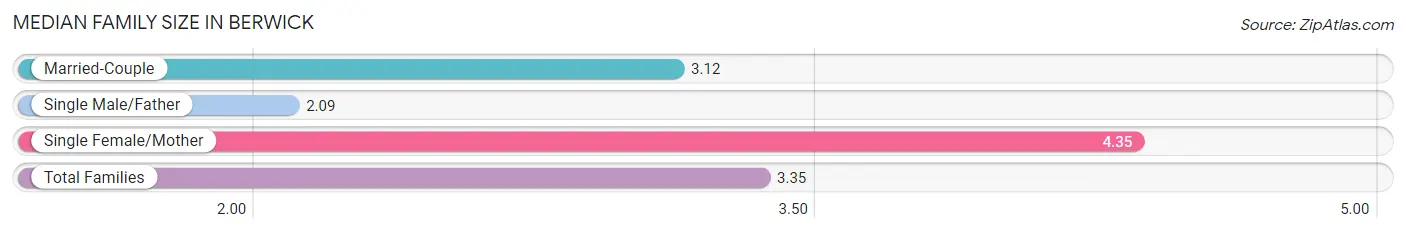
The median family size in Berwick is 3.35 persons per family, with single female/mother families (317 | 27.1%) accounting for the largest median family size of 4.35 persons per family. On the other hand, single male/father families (112 | 9.6%) represent the smallest median family size with 2.09 persons per family.
| Family Type | # Families | Family Size |
| Married-Couple | 743 (63.4%) | 3.12 |
| Single Male/Father | 112 (9.6%) | 2.09 |
| Single Female/Mother | 317 (27.1%) | 4.35 |
| Total Families | 1,172 (100.0%) | 3.35 |
Median Household Size in Berwick
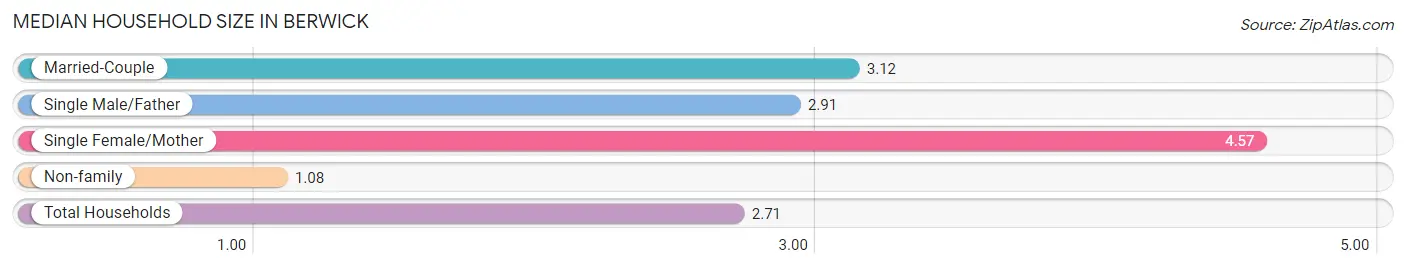
The median household size in Berwick is 2.71 persons per household, with single female/mother households (317 | 18.3%) accounting for the largest median household size of 4.57 persons per household. non-family households (559 | 32.3%) represent the smallest median household size with 1.08 persons per household.
| Household Type | # Households | Household Size |
| Married-Couple | 743 (42.9%) | 3.12 |
| Single Male/Father | 112 (6.5%) | 2.91 |
| Single Female/Mother | 317 (18.3%) | 4.57 |
| Non-family | 559 (32.3%) | 1.08 |
| Total Households | 1,731 (100.0%) | 2.71 |
Household Size by Marriage Status in Berwick
Out of a total of 1,731 households in Berwick, 1,172 (67.7%) are family households, while 559 (32.3%) are nonfamily households. The most numerous type of family households are 2-person households, comprising 467, and the most common type of nonfamily households are 1-person households, comprising 525.
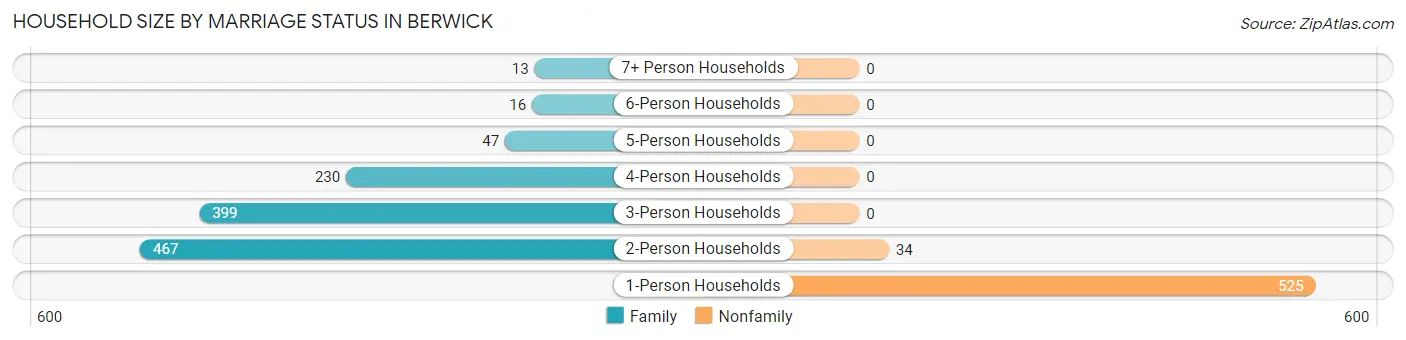
| Household Size | Family Households | Nonfamily Households |
| 1-Person Households | - | 525 (30.3%) |
| 2-Person Households | 467 (27.0%) | 34 (2.0%) |
| 3-Person Households | 399 (23.1%) | 0 (0.0%) |
| 4-Person Households | 230 (13.3%) | 0 (0.0%) |
| 5-Person Households | 47 (2.7%) | 0 (0.0%) |
| 6-Person Households | 16 (0.9%) | 0 (0.0%) |
| 7+ Person Households | 13 (0.7%) | 0 (0.0%) |
| Total | 1,172 (67.7%) | 559 (32.3%) |
Female Fertility in Berwick
Fertility by Age in Berwick
Average fertility rate in Berwick is 36.0 births per 1,000 women. Women in the age bracket of 20 to 34 years have the highest fertility rate with 81.0 births per 1,000 women. Women in the age bracket of 20 to 34 years acount for 100.0% of all women with births.
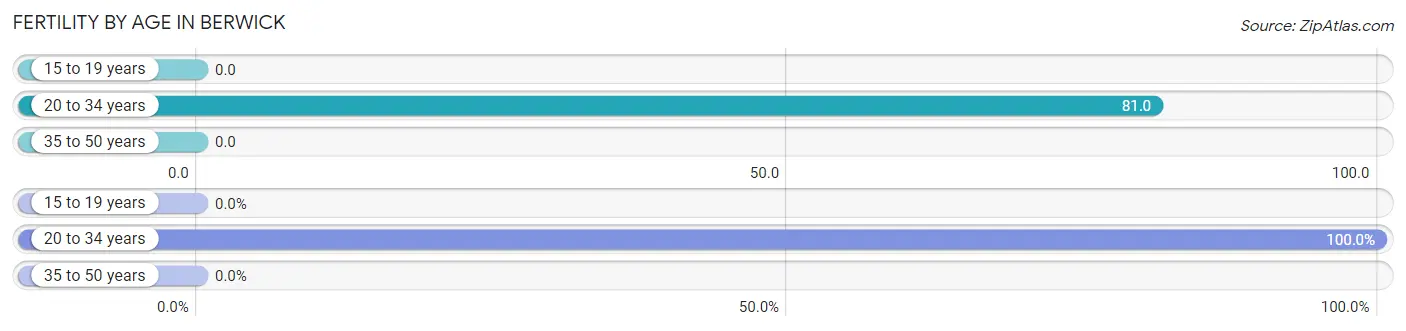
| Age Bracket | Women with Births | Births / 1,000 Women |
| 15 to 19 years | 0 (0.0%) | 0.0 |
| 20 to 34 years | 37 (100.0%) | 81.0 |
| 35 to 50 years | 0 (0.0%) | 0.0 |
| Total | 37 (100.0%) | 36.0 |
Fertility by Age by Marriage Status in Berwick
13.5% of women with births (37) in Berwick are married. The highest percentage of unmarried women with births falls into 20 to 34 years age bracket with 86.5% of them unmarried at the time of birth, while the lowest percentage of unmarried women with births belong to 20 to 34 years age bracket with 86.5% of them unmarried.
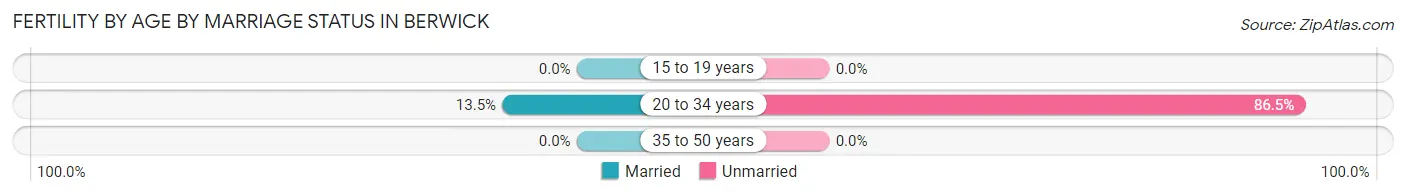
| Age Bracket | Married | Unmarried |
| 15 to 19 years | 0 (0.0%) | 0 (0.0%) |
| 20 to 34 years | 5 (13.5%) | 32 (86.5%) |
| 35 to 50 years | 0 (0.0%) | 0 (0.0%) |
| Total | 5 (13.5%) | 32 (86.5%) |
Fertility by Education in Berwick
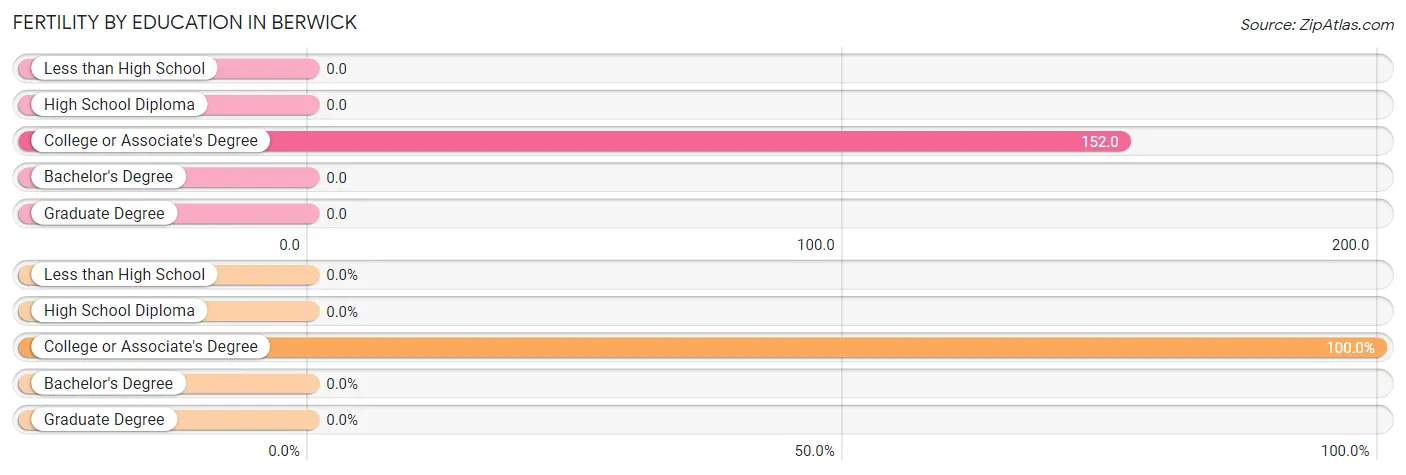
| Educational Attainment | Women with Births | Births / 1,000 Women |
| Less than High School | 0 (0.0%) | 0.0 |
| High School Diploma | 0 (0.0%) | 0.0 |
| College or Associate's Degree | 37 (100.0%) | 152.0 |
| Bachelor's Degree | 0 (0.0%) | 0.0 |
| Graduate Degree | 0 (0.0%) | 0.0 |
| Total | 37 (100.0%) | 36.0 |
Fertility by Education by Marriage Status in Berwick
86.5% of women with births in Berwick are unmarried. Women with the educational attainment of college or associate's degree are most likely to be married with 13.5% of them married at childbirth, while women with the educational attainment of college or associate's degree are least likely to be married with 86.5% of them unmarried at childbirth.
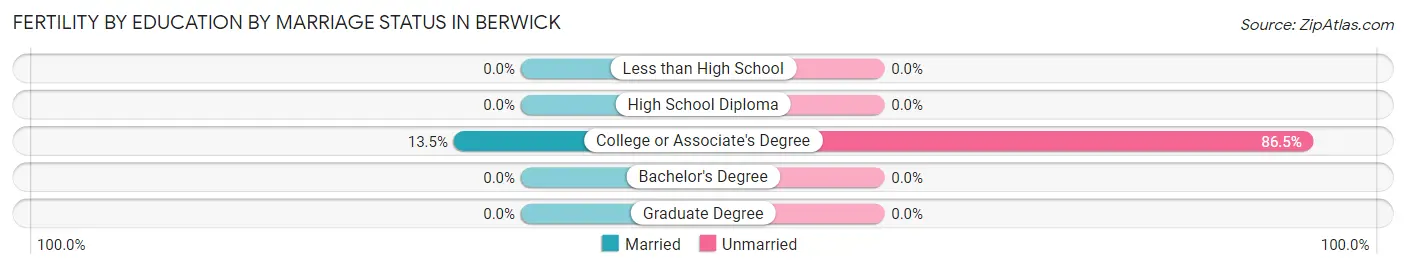
| Educational Attainment | Married | Unmarried |
| Less than High School | 0 (0.0%) | 0 (0.0%) |
| High School Diploma | 0 (0.0%) | 0 (0.0%) |
| College or Associate's Degree | 5 (13.5%) | 32 (86.5%) |
| Bachelor's Degree | 0 (0.0%) | 0 (0.0%) |
| Graduate Degree | 0 (0.0%) | 0 (0.0%) |
| Total | 5 (13.5%) | 32 (86.5%) |
Employment Characteristics in Berwick
Employment by Class of Employer in Berwick
Among the 1,931 employed individuals in Berwick, private company employees (1,329 | 68.8%), local government employees (171 | 8.9%), and self-employed (incorporated) (164 | 8.5%) make up the most common classes of employment.
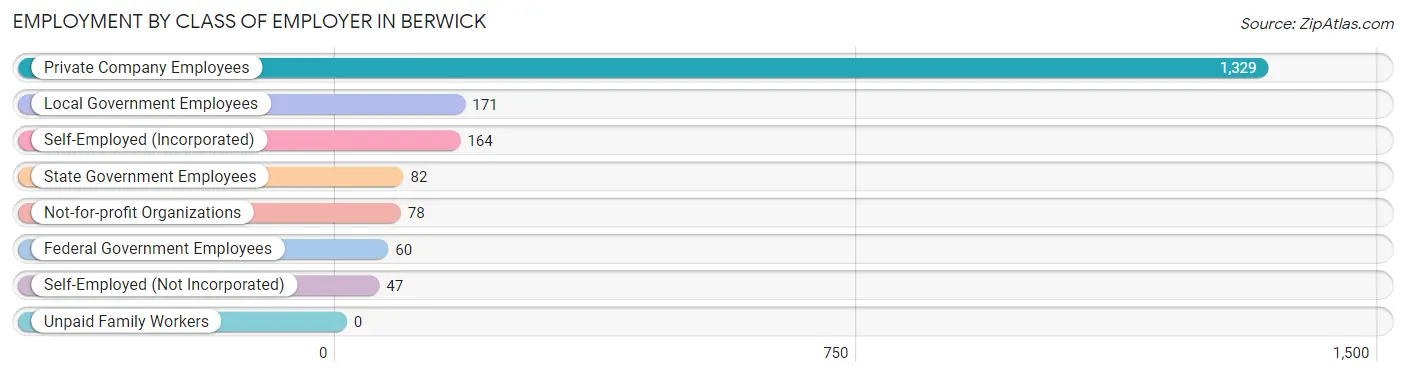
| Employer Class | # Employees | % Employees |
| Private Company Employees | 1,329 | 68.8% |
| Self-Employed (Incorporated) | 164 | 8.5% |
| Self-Employed (Not Incorporated) | 47 | 2.4% |
| Not-for-profit Organizations | 78 | 4.0% |
| Local Government Employees | 171 | 8.9% |
| State Government Employees | 82 | 4.3% |
| Federal Government Employees | 60 | 3.1% |
| Unpaid Family Workers | 0 | 0.0% |
| Total | 1,931 | 100.0% |
Employment Status by Age in Berwick
According to the labor force statistics for Berwick, out of the total population over 16 years of age (3,446), 62.7% or 2,161 individuals are in the labor force, with 10.3% or 223 of them unemployed. The age group with the highest labor force participation rate is 30 to 34 years, with 86.1% or 310 individuals in the labor force. Within the labor force, the 25 to 29 years age range has the highest percentage of unemployed individuals, with 44.8% or 60 of them being unemployed.
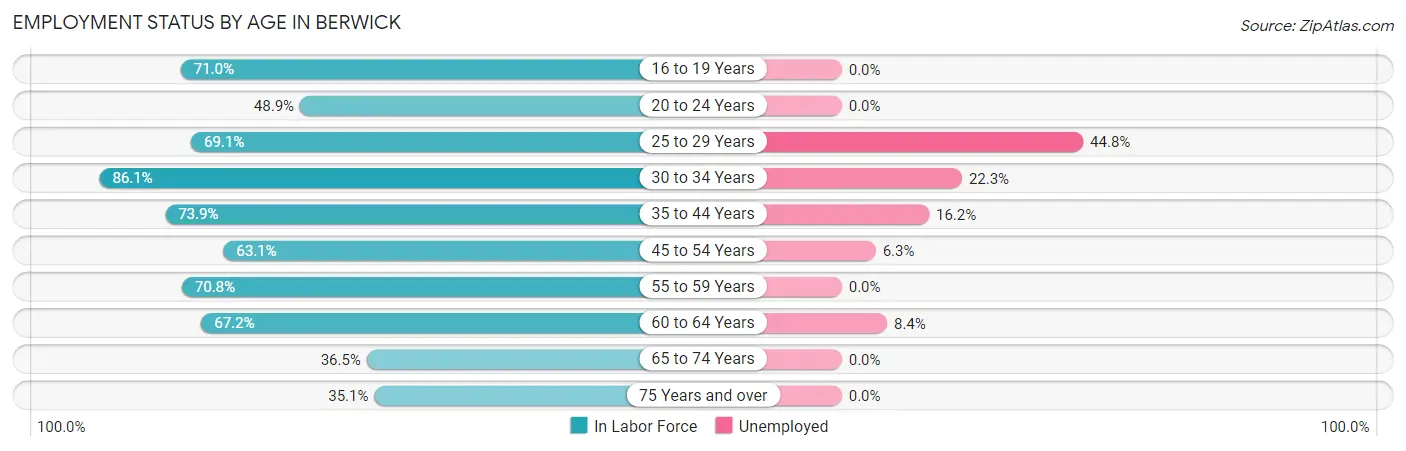
| Age Bracket | In Labor Force | Unemployed |
| 16 to 19 Years | 179 (71.0%) | 0 (0.0%) |
| 20 to 24 Years | 152 (48.9%) | 0 (0.0%) |
| 25 to 29 Years | 134 (69.1%) | 60 (44.8%) |
| 30 to 34 Years | 310 (86.1%) | 69 (22.3%) |
| 35 to 44 Years | 314 (73.9%) | 51 (16.2%) |
| 45 to 54 Years | 398 (63.1%) | 25 (6.3%) |
| 55 to 59 Years | 182 (70.8%) | 0 (0.0%) |
| 60 to 64 Years | 273 (67.2%) | 23 (8.4%) |
| 65 to 74 Years | 103 (36.5%) | 0 (0.0%) |
| 75 Years and over | 115 (35.1%) | 0 (0.0%) |
| Total | 2,161 (62.7%) | 223 (10.3%) |
Employment Status by Educational Attainment in Berwick
According to labor force statistics for Berwick, 70.9% of individuals (1,612) out of the total population between 25 and 64 years of age (2,273) are in the labor force, with 13.9% or 224 of them being unemployed. The group with the highest labor force participation rate are those with the educational attainment of bachelor's degree or higher, with 79.2% or 446 individuals in the labor force. Within the labor force, individuals with less than high school education have the highest percentage of unemployment, with 41.2% or 136 of them being unemployed.
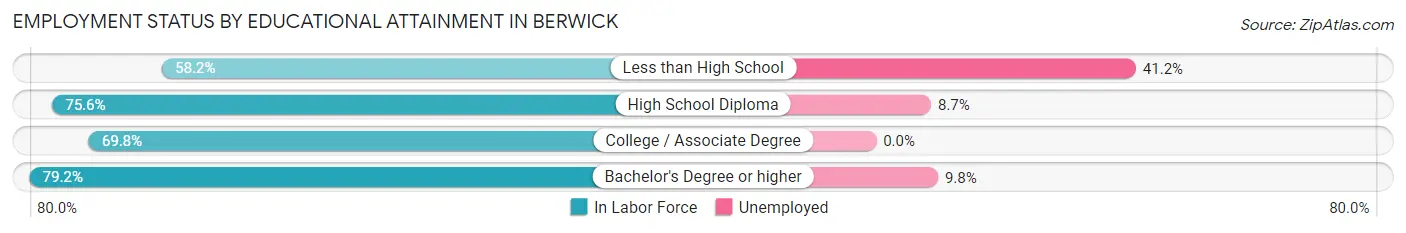
| Educational Attainment | In Labor Force | Unemployed |
| Less than High School | 330 (58.2%) | 234 (41.2%) |
| High School Diploma | 484 (75.6%) | 56 (8.7%) |
| College / Associate Degree | 351 (69.8%) | 0 (0.0%) |
| Bachelor's Degree or higher | 446 (79.2%) | 55 (9.8%) |
| Total | 1,612 (70.9%) | 316 (13.9%) |
Employment Occupations by Sex in Berwick
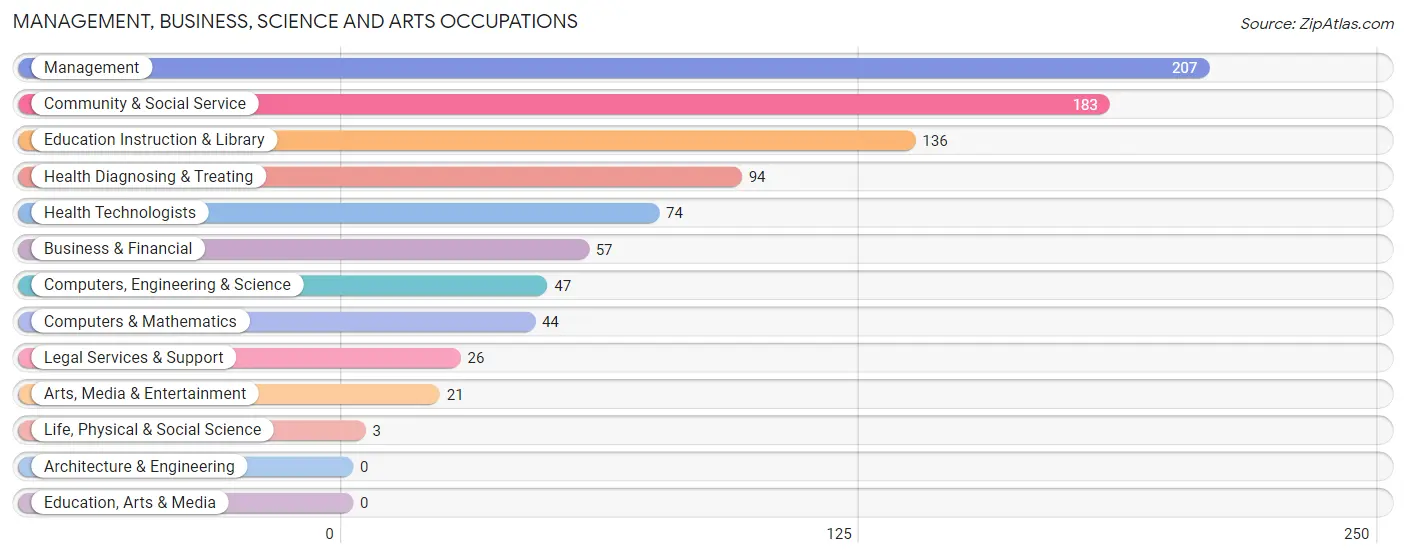
Management, Business, Science and Arts Occupations
The most common Management, Business, Science and Arts occupations in Berwick are Management (207 | 10.9%), Community & Social Service (183 | 9.7%), Education Instruction & Library (136 | 7.2%), Health Diagnosing & Treating (94 | 5.0%), and Health Technologists (74 | 3.9%).
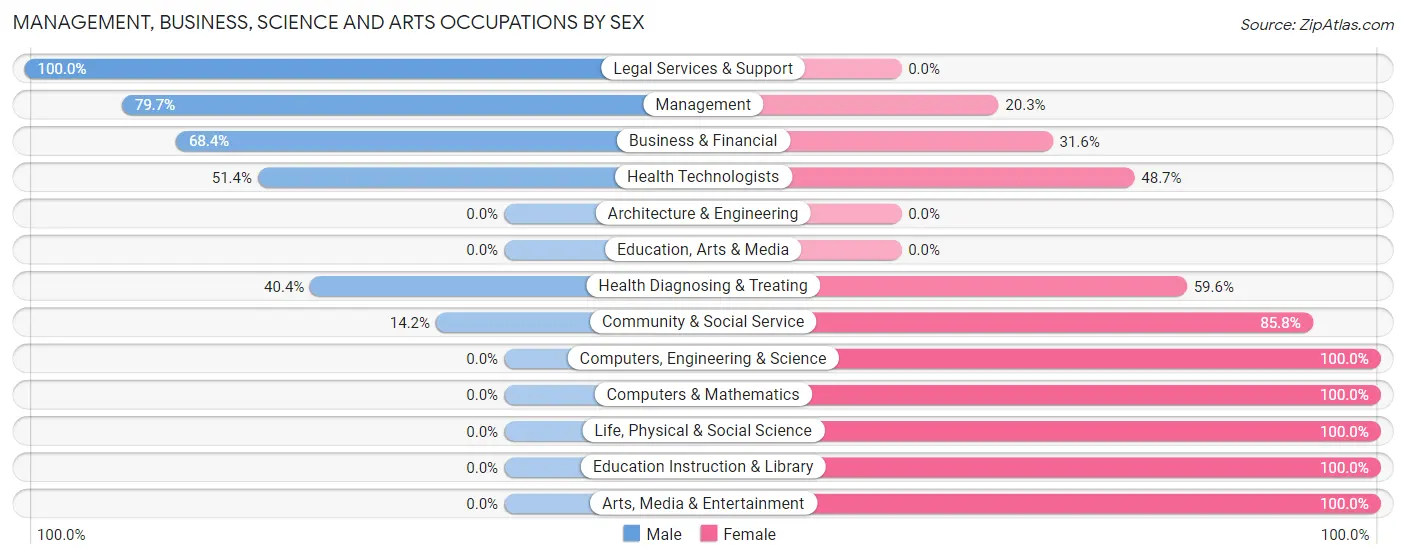
Management, Business, Science and Arts Occupations by Sex
Within the Management, Business, Science and Arts occupations in Berwick, the most male-oriented occupations are Legal Services & Support (100.0%), Management (79.7%), and Business & Financial (68.4%), while the most female-oriented occupations are Computers, Engineering & Science (100.0%), Computers & Mathematics (100.0%), and Life, Physical & Social Science (100.0%).
| Occupation | Male | Female |
| Management | 165 (79.7%) | 42 (20.3%) |
| Business & Financial | 39 (68.4%) | 18 (31.6%) |
| Computers, Engineering & Science | 0 (0.0%) | 47 (100.0%) |
| Computers & Mathematics | 0 (0.0%) | 44 (100.0%) |
| Architecture & Engineering | 0 (0.0%) | 0 (0.0%) |
| Life, Physical & Social Science | 0 (0.0%) | 3 (100.0%) |
| Community & Social Service | 26 (14.2%) | 157 (85.8%) |
| Education, Arts & Media | 0 (0.0%) | 0 (0.0%) |
| Legal Services & Support | 26 (100.0%) | 0 (0.0%) |
| Education Instruction & Library | 0 (0.0%) | 136 (100.0%) |
| Arts, Media & Entertainment | 0 (0.0%) | 21 (100.0%) |
| Health Diagnosing & Treating | 38 (40.4%) | 56 (59.6%) |
| Health Technologists | 38 (51.3%) | 36 (48.6%) |
| Total (Category) | 268 (45.6%) | 320 (54.4%) |
| Total (Overall) | 915 (48.3%) | 978 (51.7%) |
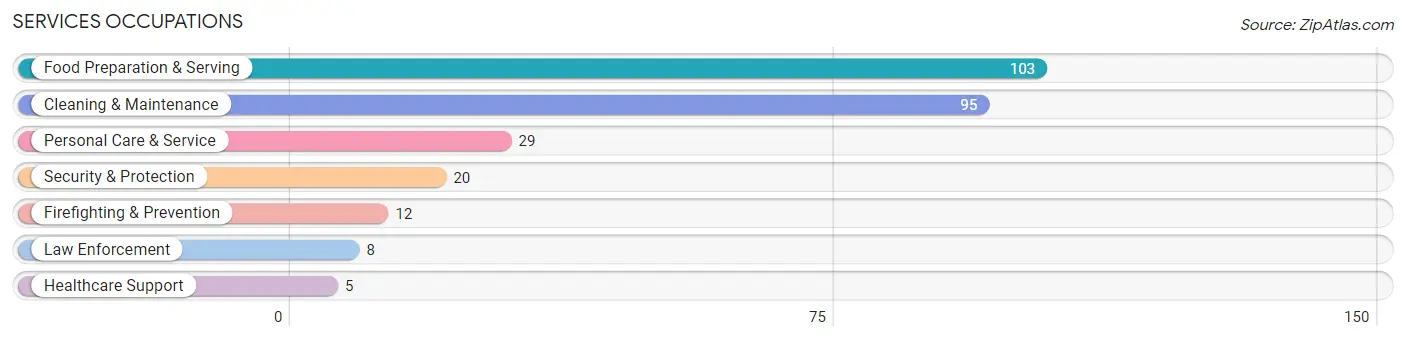
Services Occupations
The most common Services occupations in Berwick are Food Preparation & Serving (103 | 5.4%), Cleaning & Maintenance (95 | 5.0%), Personal Care & Service (29 | 1.5%), Security & Protection (20 | 1.1%), and Firefighting & Prevention (12 | 0.6%).
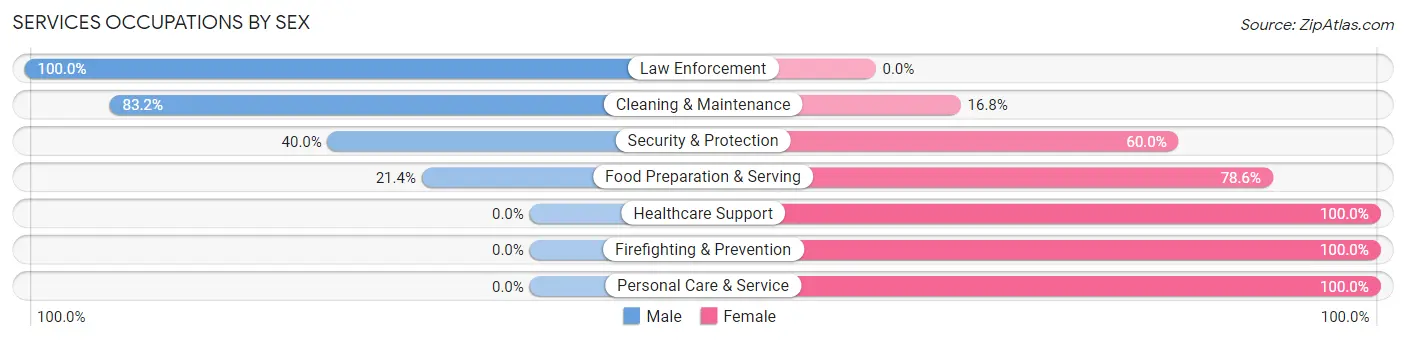
Services Occupations by Sex
Within the Services occupations in Berwick, the most male-oriented occupations are Law Enforcement (100.0%), Cleaning & Maintenance (83.2%), and Security & Protection (40.0%), while the most female-oriented occupations are Healthcare Support (100.0%), Firefighting & Prevention (100.0%), and Personal Care & Service (100.0%).
| Occupation | Male | Female |
| Healthcare Support | 0 (0.0%) | 5 (100.0%) |
| Security & Protection | 8 (40.0%) | 12 (60.0%) |
| Firefighting & Prevention | 0 (0.0%) | 12 (100.0%) |
| Law Enforcement | 8 (100.0%) | 0 (0.0%) |
| Food Preparation & Serving | 22 (21.4%) | 81 (78.6%) |
| Cleaning & Maintenance | 79 (83.2%) | 16 (16.8%) |
| Personal Care & Service | 0 (0.0%) | 29 (100.0%) |
| Total (Category) | 109 (43.2%) | 143 (56.8%) |
| Total (Overall) | 915 (48.3%) | 978 (51.7%) |
Sales and Office Occupations
The most common Sales and Office occupations in Berwick are Office & Administration (324 | 17.1%), and Sales & Related (319 | 16.9%).

Sales and Office Occupations by Sex

| Occupation | Male | Female |
| Sales & Related | 117 (36.7%) | 202 (63.3%) |
| Office & Administration | 36 (11.1%) | 288 (88.9%) |
| Total (Category) | 153 (23.8%) | 490 (76.2%) |
| Total (Overall) | 915 (48.3%) | 978 (51.7%) |
Natural Resources, Construction and Maintenance Occupations
The most common Natural Resources, Construction and Maintenance occupations in Berwick are Construction & Extraction (40 | 2.1%), and Installation, Maintenance & Repair (3 | 0.2%).
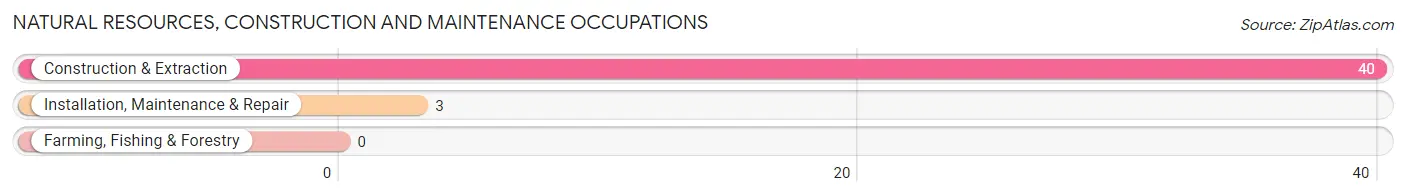
Natural Resources, Construction and Maintenance Occupations by Sex
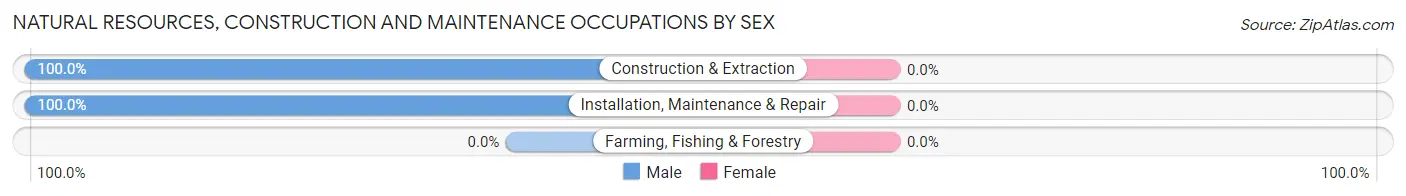
| Occupation | Male | Female |
| Farming, Fishing & Forestry | 0 (0.0%) | 0 (0.0%) |
| Construction & Extraction | 40 (100.0%) | 0 (0.0%) |
| Installation, Maintenance & Repair | 3 (100.0%) | 0 (0.0%) |
| Total (Category) | 43 (100.0%) | 0 (0.0%) |
| Total (Overall) | 915 (48.3%) | 978 (51.7%) |
Production, Transportation and Moving Occupations
The most common Production, Transportation and Moving occupations in Berwick are Material Moving (146 | 7.7%), Transportation (111 | 5.9%), and Production (110 | 5.8%).
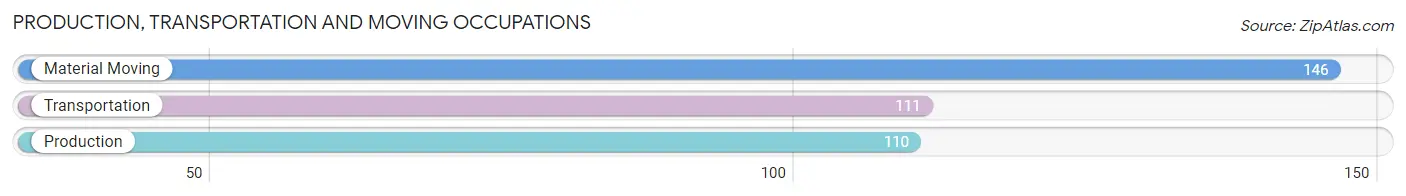
Production, Transportation and Moving Occupations by Sex
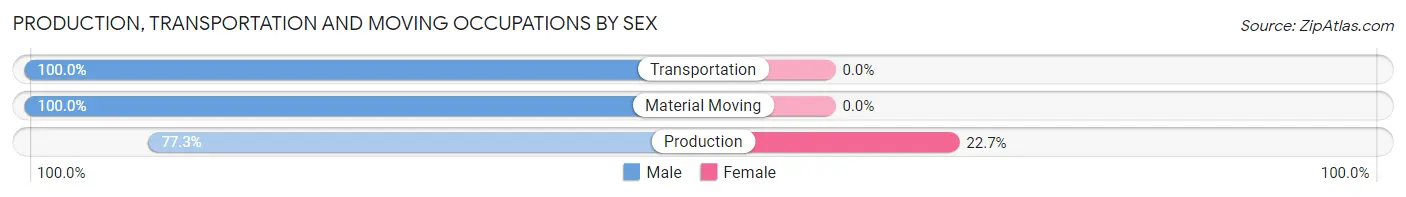
| Occupation | Male | Female |
| Production | 85 (77.3%) | 25 (22.7%) |
| Transportation | 111 (100.0%) | 0 (0.0%) |
| Material Moving | 146 (100.0%) | 0 (0.0%) |
| Total (Category) | 342 (93.2%) | 25 (6.8%) |
| Total (Overall) | 915 (48.3%) | 978 (51.7%) |
Employment Industries by Sex in Berwick
Employment Industries in Berwick
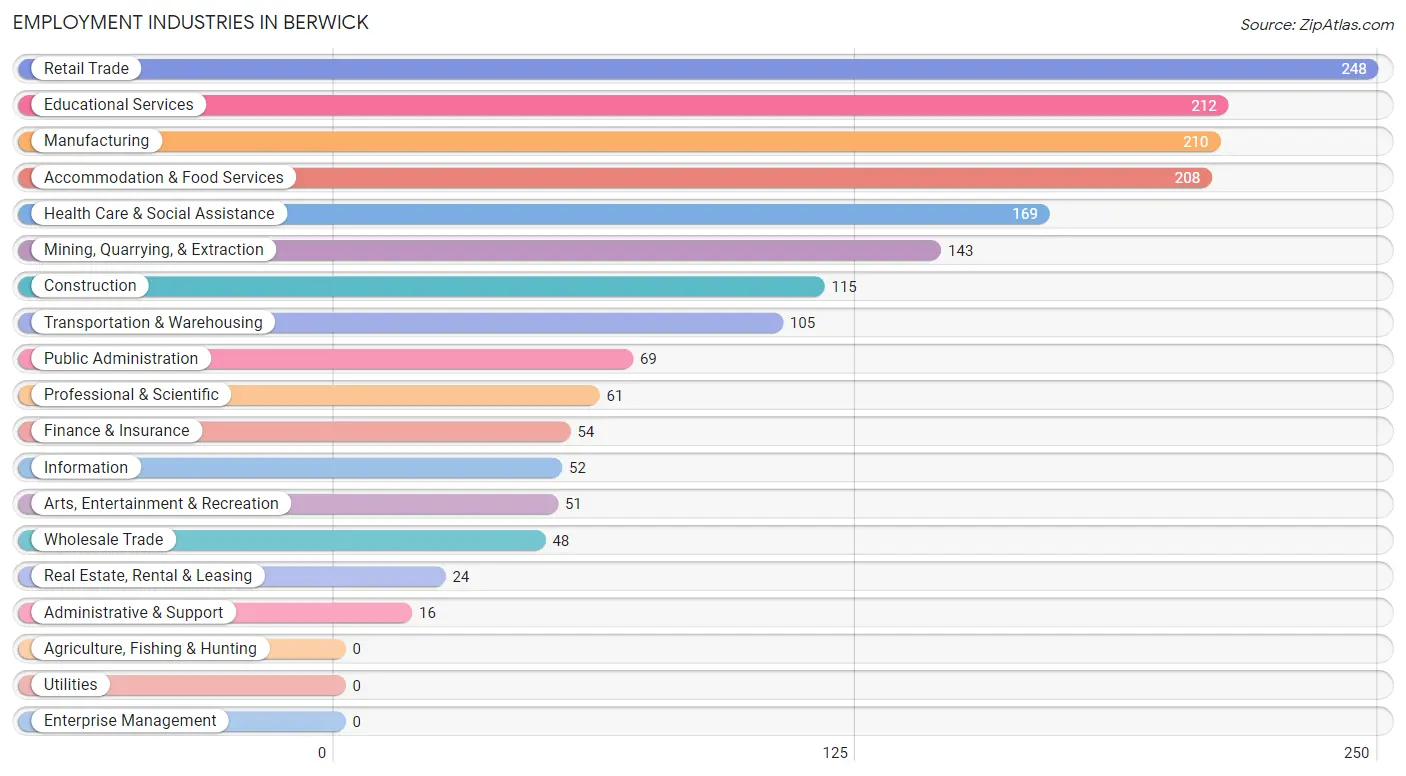
The major employment industries in Berwick include Retail Trade (248 | 13.1%), Educational Services (212 | 11.2%), Manufacturing (210 | 11.1%), Accommodation & Food Services (208 | 11.0%), and Health Care & Social Assistance (169 | 8.9%).
Employment Industries by Sex in Berwick
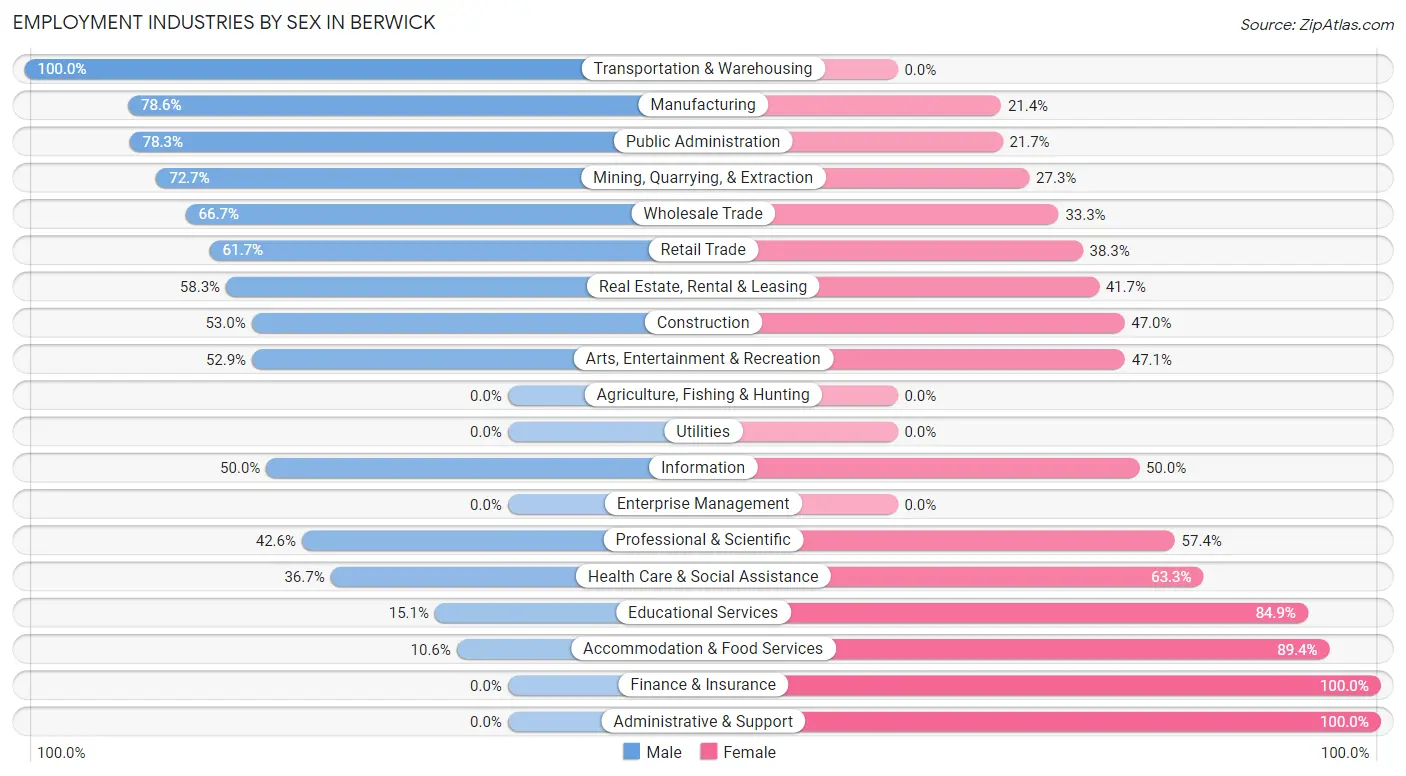
The Berwick industries that see more men than women are Transportation & Warehousing (100.0%), Manufacturing (78.6%), and Public Administration (78.3%), whereas the industries that tend to have a higher number of women are Finance & Insurance (100.0%), Administrative & Support (100.0%), and Accommodation & Food Services (89.4%).
| Industry | Male | Female |
| Agriculture, Fishing & Hunting | 0 (0.0%) | 0 (0.0%) |
| Mining, Quarrying, & Extraction | 104 (72.7%) | 39 (27.3%) |
| Construction | 61 (53.0%) | 54 (47.0%) |
| Manufacturing | 165 (78.6%) | 45 (21.4%) |
| Wholesale Trade | 32 (66.7%) | 16 (33.3%) |
| Retail Trade | 153 (61.7%) | 95 (38.3%) |
| Transportation & Warehousing | 105 (100.0%) | 0 (0.0%) |
| Utilities | 0 (0.0%) | 0 (0.0%) |
| Information | 26 (50.0%) | 26 (50.0%) |
| Finance & Insurance | 0 (0.0%) | 54 (100.0%) |
| Real Estate, Rental & Leasing | 14 (58.3%) | 10 (41.7%) |
| Professional & Scientific | 26 (42.6%) | 35 (57.4%) |
| Enterprise Management | 0 (0.0%) | 0 (0.0%) |
| Administrative & Support | 0 (0.0%) | 16 (100.0%) |
| Educational Services | 32 (15.1%) | 180 (84.9%) |
| Health Care & Social Assistance | 62 (36.7%) | 107 (63.3%) |
| Arts, Entertainment & Recreation | 27 (52.9%) | 24 (47.1%) |
| Accommodation & Food Services | 22 (10.6%) | 186 (89.4%) |
| Public Administration | 54 (78.3%) | 15 (21.7%) |
| Total | 915 (48.3%) | 978 (51.7%) |
Education in Berwick
School Enrollment in Berwick
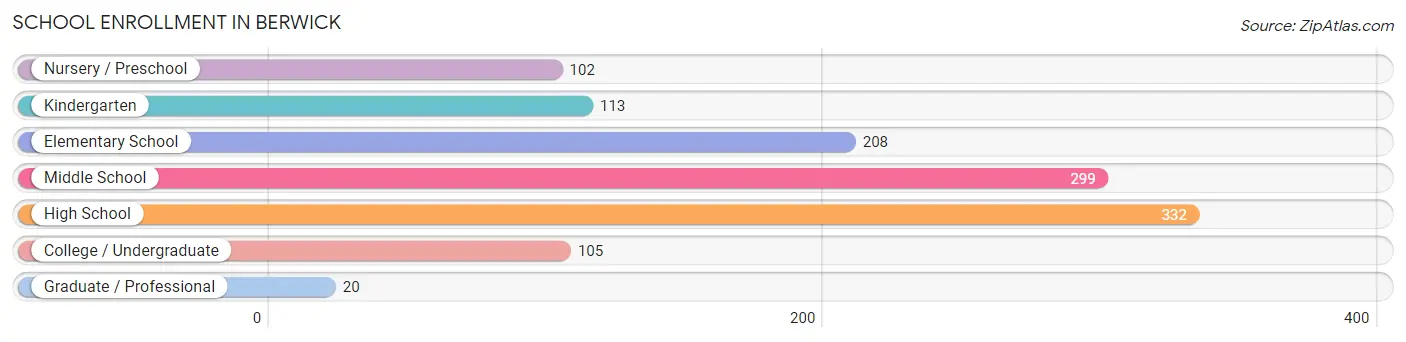
The most common levels of schooling among the 1,179 students in Berwick are high school (332 | 28.2%), middle school (299 | 25.4%), and elementary school (208 | 17.6%).
| School Level | # Students | % Students |
| Nursery / Preschool | 102 | 8.6% |
| Kindergarten | 113 | 9.6% |
| Elementary School | 208 | 17.6% |
| Middle School | 299 | 25.4% |
| High School | 332 | 28.2% |
| College / Undergraduate | 105 | 8.9% |
| Graduate / Professional | 20 | 1.7% |
| Total | 1,179 | 100.0% |
School Enrollment by Age by Funding Source in Berwick
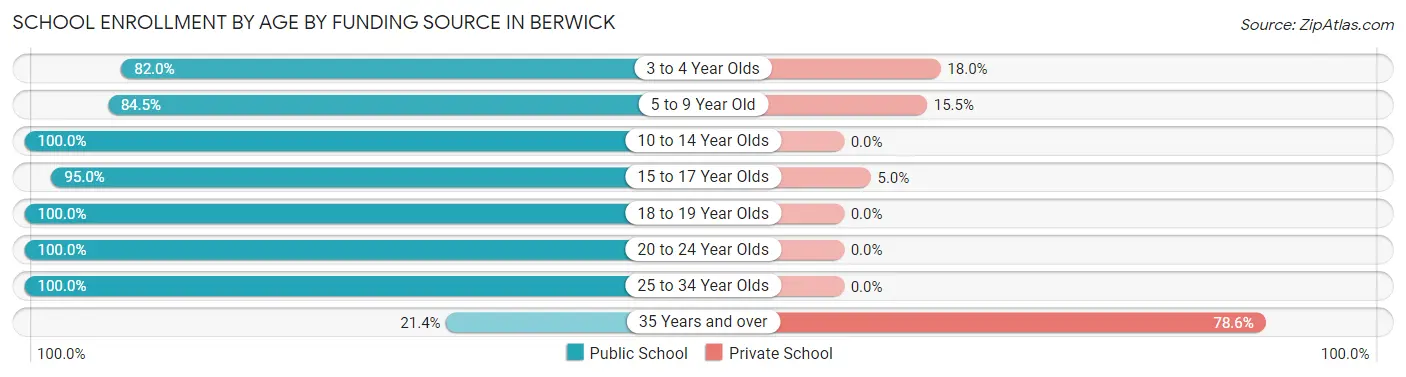
Out of a total of 1,179 students who are enrolled in schools in Berwick, 80 (6.8%) attend a private institution, while the remaining 1,099 (93.2%) are enrolled in public schools. The age group of 35 years and over has the highest likelihood of being enrolled in private schools, with 11 (78.6% in the age bracket) enrolled. Conversely, the age group of 10 to 14 year olds has the lowest likelihood of being enrolled in a private school, with 417 (100.0% in the age bracket) attending a public institution.
| Age Bracket | Public School | Private School |
| 3 to 4 Year Olds | 91 (82.0%) | 20 (18.0%) |
| 5 to 9 Year Old | 213 (84.5%) | 39 (15.5%) |
| 10 to 14 Year Olds | 417 (100.0%) | 0 (0.0%) |
| 15 to 17 Year Olds | 190 (95.0%) | 10 (5.0%) |
| 18 to 19 Year Olds | 26 (100.0%) | 0 (0.0%) |
| 20 to 24 Year Olds | 79 (100.0%) | 0 (0.0%) |
| 25 to 34 Year Olds | 80 (100.0%) | 0 (0.0%) |
| 35 Years and over | 3 (21.4%) | 11 (78.6%) |
| Total | 1,099 (93.2%) | 80 (6.8%) |
Educational Attainment by Field of Study in Berwick
Business (174 | 25.7%), education (171 | 25.2%), social sciences (96 | 14.2%), science & technology (67 | 9.9%), and arts & humanities (58 | 8.6%) are the most common fields of study among 678 individuals in Berwick who have obtained a bachelor's degree or higher.
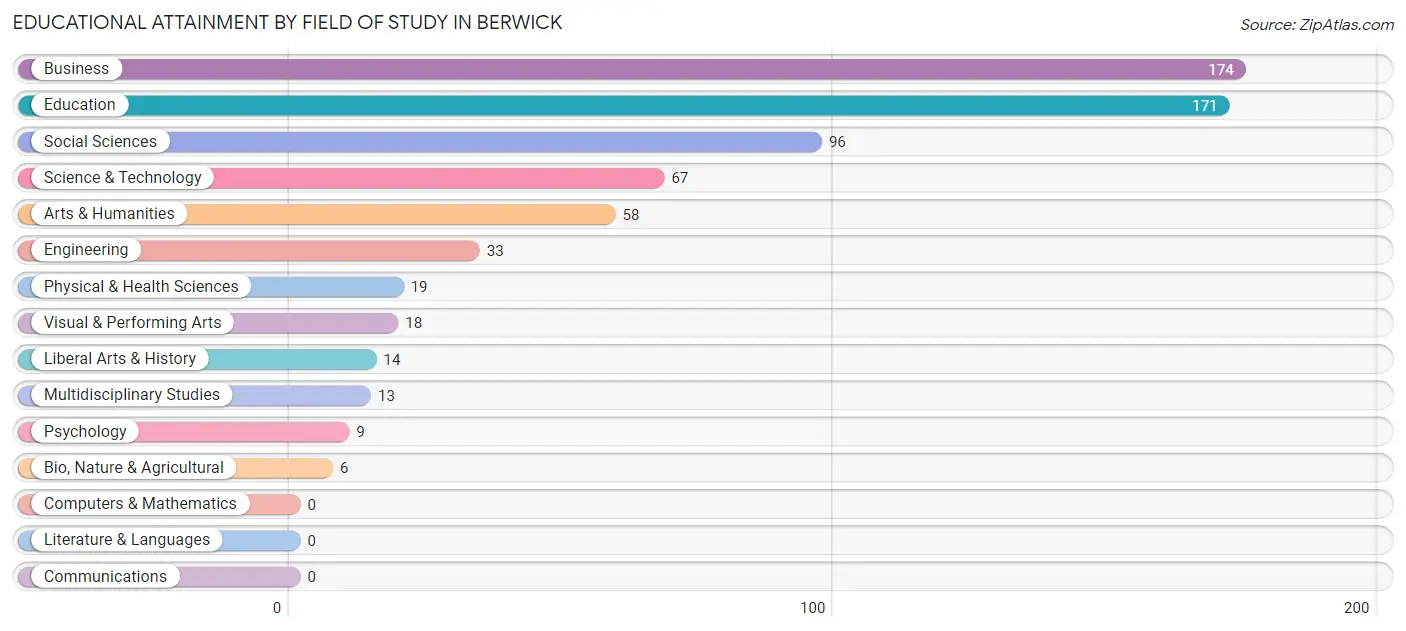
| Field of Study | # Graduates | % Graduates |
| Computers & Mathematics | 0 | 0.0% |
| Bio, Nature & Agricultural | 6 | 0.9% |
| Physical & Health Sciences | 19 | 2.8% |
| Psychology | 9 | 1.3% |
| Social Sciences | 96 | 14.2% |
| Engineering | 33 | 4.9% |
| Multidisciplinary Studies | 13 | 1.9% |
| Science & Technology | 67 | 9.9% |
| Business | 174 | 25.7% |
| Education | 171 | 25.2% |
| Literature & Languages | 0 | 0.0% |
| Liberal Arts & History | 14 | 2.1% |
| Visual & Performing Arts | 18 | 2.6% |
| Communications | 0 | 0.0% |
| Arts & Humanities | 58 | 8.6% |
| Total | 678 | 100.0% |
Transportation & Commute in Berwick
Vehicle Availability by Sex in Berwick
The most prevalent vehicle ownership categories in Berwick are males with 2 vehicles (422, accounting for 43.7%) and females with 2 vehicles (409, making up 43.7%).
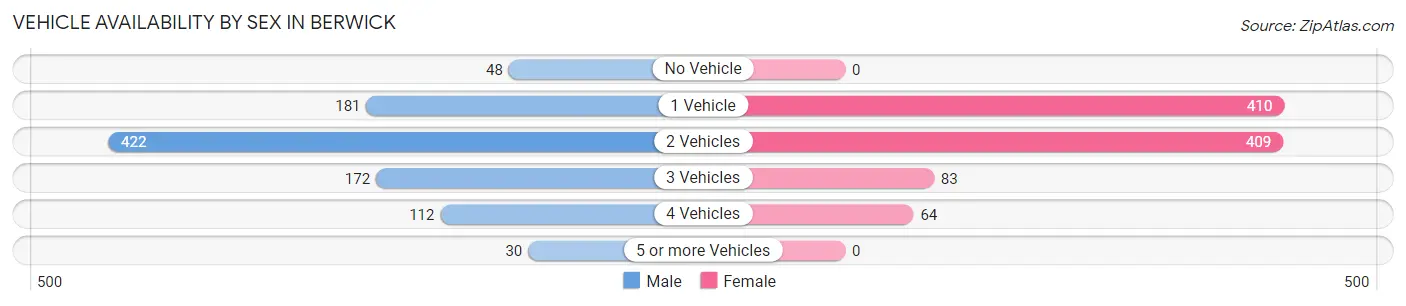
| Vehicles Available | Male | Female |
| No Vehicle | 48 (5.0%) | 0 (0.0%) |
| 1 Vehicle | 181 (18.8%) | 410 (42.4%) |
| 2 Vehicles | 422 (43.7%) | 409 (42.3%) |
| 3 Vehicles | 172 (17.8%) | 83 (8.6%) |
| 4 Vehicles | 112 (11.6%) | 64 (6.6%) |
| 5 or more Vehicles | 30 (3.1%) | 0 (0.0%) |
| Total | 965 (100.0%) | 966 (100.0%) |
Commute Time in Berwick
The most frequently occuring commute durations in Berwick are 15 to 19 minutes (511 commuters, 26.6%), 10 to 14 minutes (509 commuters, 26.5%), and 5 to 9 minutes (267 commuters, 13.9%).
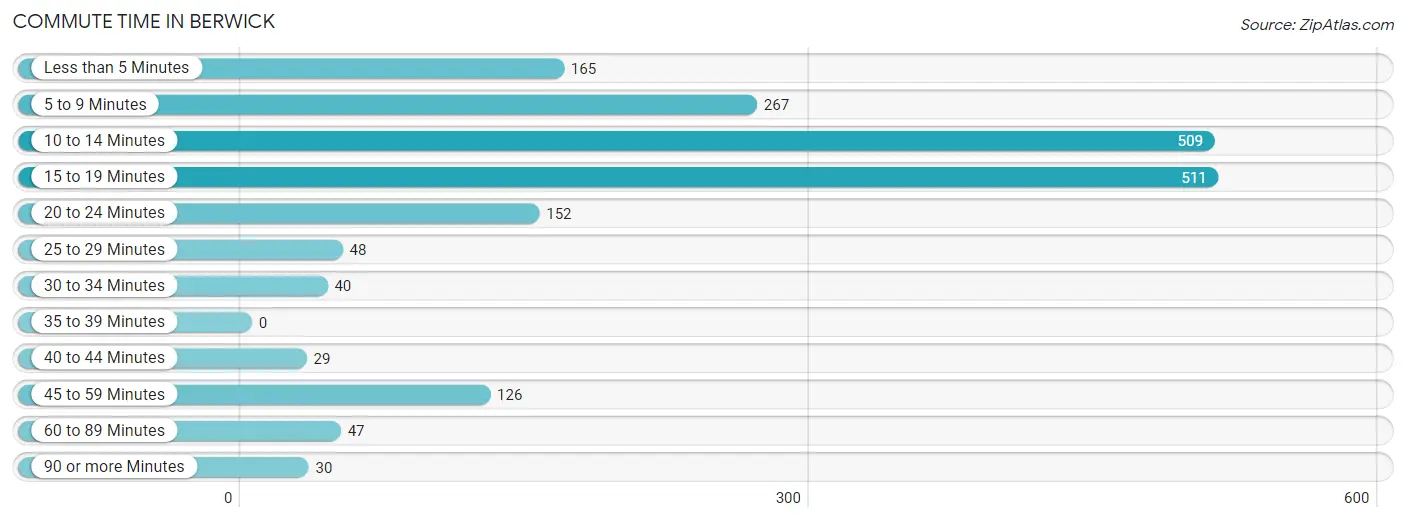
| Commute Time | # Commuters | % Commuters |
| Less than 5 Minutes | 165 | 8.6% |
| 5 to 9 Minutes | 267 | 13.9% |
| 10 to 14 Minutes | 509 | 26.5% |
| 15 to 19 Minutes | 511 | 26.6% |
| 20 to 24 Minutes | 152 | 7.9% |
| 25 to 29 Minutes | 48 | 2.5% |
| 30 to 34 Minutes | 40 | 2.1% |
| 35 to 39 Minutes | 0 | 0.0% |
| 40 to 44 Minutes | 29 | 1.5% |
| 45 to 59 Minutes | 126 | 6.6% |
| 60 to 89 Minutes | 47 | 2.4% |
| 90 or more Minutes | 30 | 1.6% |
Commute Time by Sex in Berwick
The most common commute times in Berwick are 15 to 19 minutes (332 commuters, 34.4%) for males and 10 to 14 minutes (259 commuters, 27.0%) for females.
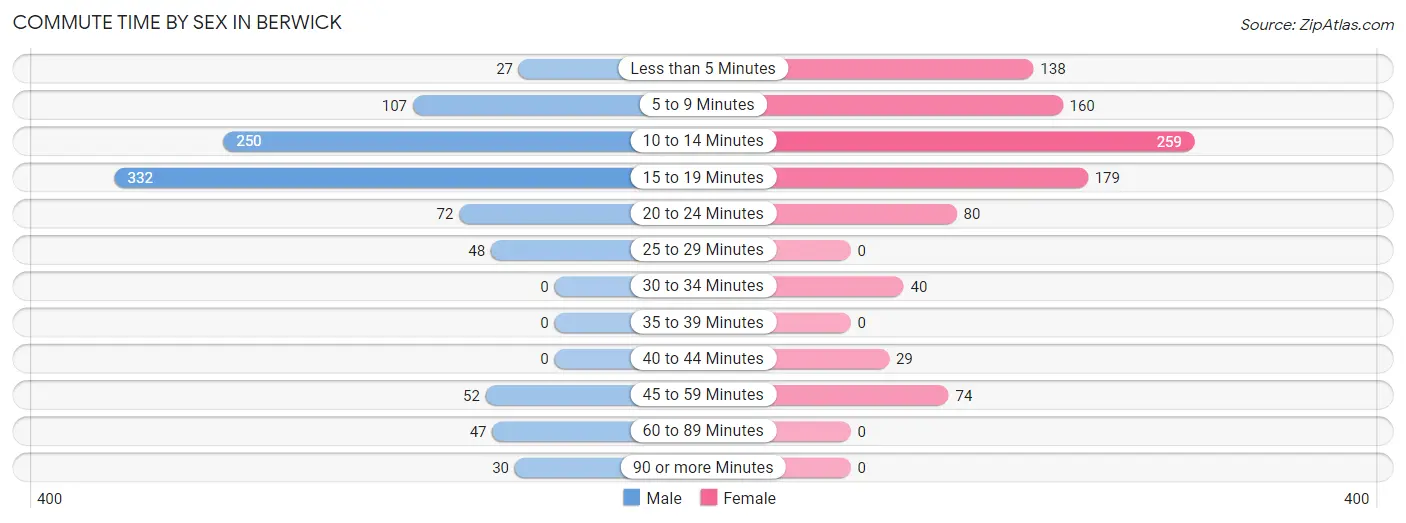
| Commute Time | Male | Female |
| Less than 5 Minutes | 27 (2.8%) | 138 (14.4%) |
| 5 to 9 Minutes | 107 (11.1%) | 160 (16.7%) |
| 10 to 14 Minutes | 250 (25.9%) | 259 (27.0%) |
| 15 to 19 Minutes | 332 (34.4%) | 179 (18.7%) |
| 20 to 24 Minutes | 72 (7.5%) | 80 (8.3%) |
| 25 to 29 Minutes | 48 (5.0%) | 0 (0.0%) |
| 30 to 34 Minutes | 0 (0.0%) | 40 (4.2%) |
| 35 to 39 Minutes | 0 (0.0%) | 0 (0.0%) |
| 40 to 44 Minutes | 0 (0.0%) | 29 (3.0%) |
| 45 to 59 Minutes | 52 (5.4%) | 74 (7.7%) |
| 60 to 89 Minutes | 47 (4.9%) | 0 (0.0%) |
| 90 or more Minutes | 30 (3.1%) | 0 (0.0%) |
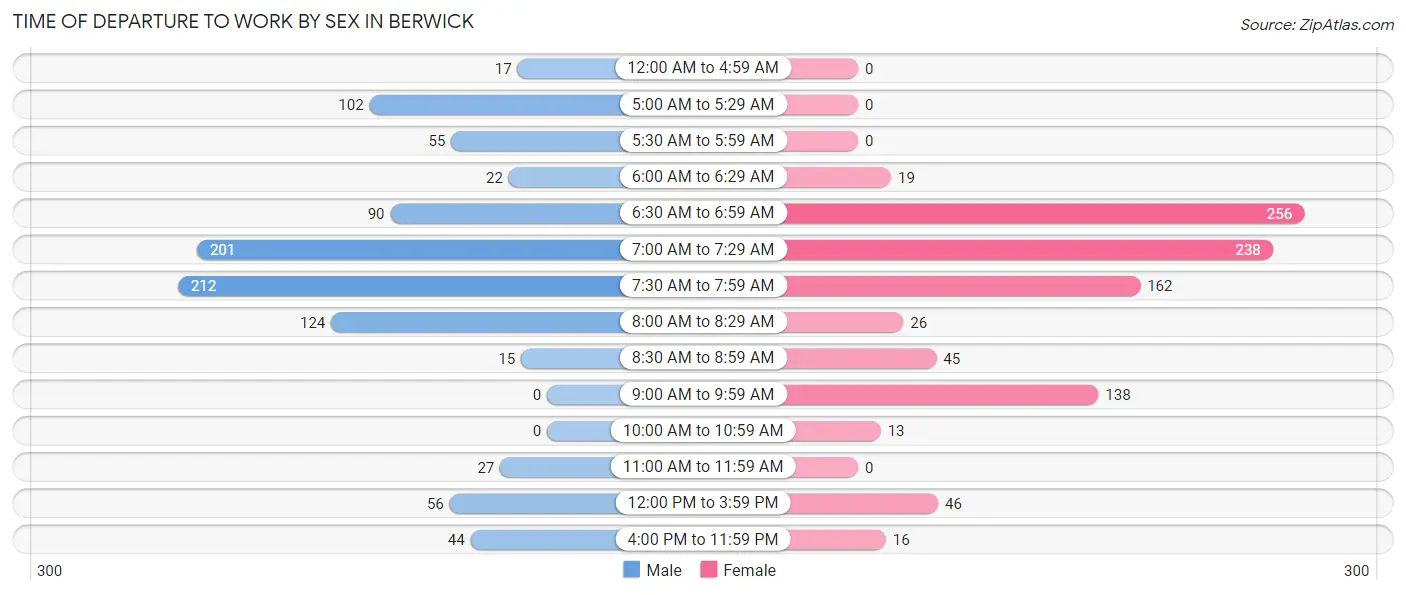
Time of Departure to Work by Sex in Berwick
The most frequent times of departure to work in Berwick are 7:30 AM to 7:59 AM (212, 22.0%) for males and 6:30 AM to 6:59 AM (256, 26.7%) for females.
| Time of Departure | Male | Female |
| 12:00 AM to 4:59 AM | 17 (1.8%) | 0 (0.0%) |
| 5:00 AM to 5:29 AM | 102 (10.6%) | 0 (0.0%) |
| 5:30 AM to 5:59 AM | 55 (5.7%) | 0 (0.0%) |
| 6:00 AM to 6:29 AM | 22 (2.3%) | 19 (2.0%) |
| 6:30 AM to 6:59 AM | 90 (9.3%) | 256 (26.7%) |
| 7:00 AM to 7:29 AM | 201 (20.8%) | 238 (24.8%) |
| 7:30 AM to 7:59 AM | 212 (22.0%) | 162 (16.9%) |
| 8:00 AM to 8:29 AM | 124 (12.9%) | 26 (2.7%) |
| 8:30 AM to 8:59 AM | 15 (1.5%) | 45 (4.7%) |
| 9:00 AM to 9:59 AM | 0 (0.0%) | 138 (14.4%) |
| 10:00 AM to 10:59 AM | 0 (0.0%) | 13 (1.4%) |
| 11:00 AM to 11:59 AM | 27 (2.8%) | 0 (0.0%) |
| 12:00 PM to 3:59 PM | 56 (5.8%) | 46 (4.8%) |
| 4:00 PM to 11:59 PM | 44 (4.6%) | 16 (1.7%) |
| Total | 965 (100.0%) | 959 (100.0%) |
Housing Occupancy in Berwick
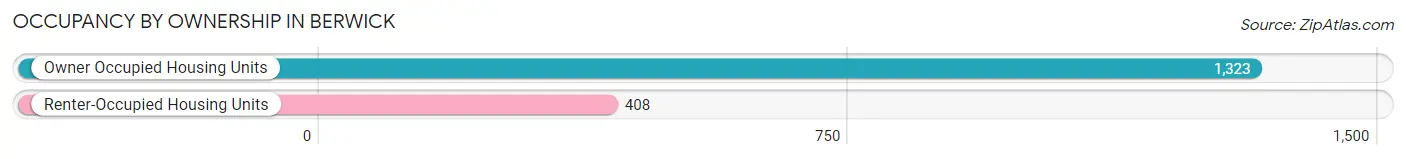
Occupancy by Ownership in Berwick
Of the total 1,731 dwellings in Berwick, owner-occupied units account for 1,323 (76.4%), while renter-occupied units make up 408 (23.6%).
| Occupancy | # Housing Units | % Housing Units |
| Owner Occupied Housing Units | 1,323 | 76.4% |
| Renter-Occupied Housing Units | 408 | 23.6% |
| Total Occupied Housing Units | 1,731 | 100.0% |
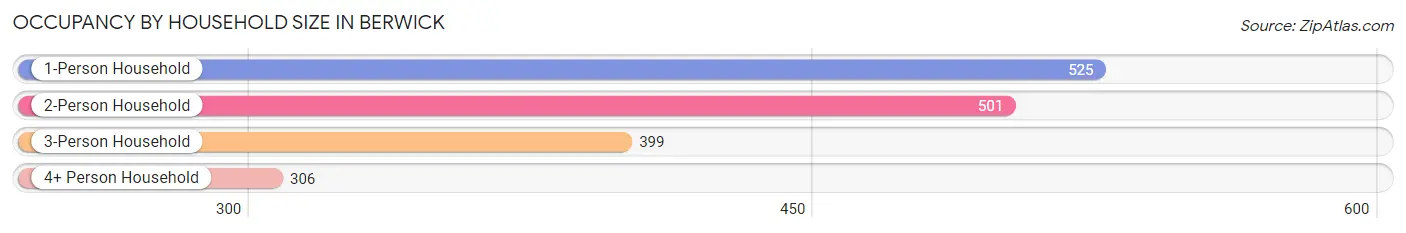
Occupancy by Household Size in Berwick
| Household Size | # Housing Units | % Housing Units |
| 1-Person Household | 525 | 30.3% |
| 2-Person Household | 501 | 28.9% |
| 3-Person Household | 399 | 23.1% |
| 4+ Person Household | 306 | 17.7% |
| Total Housing Units | 1,731 | 100.0% |
Occupancy by Ownership by Household Size in Berwick
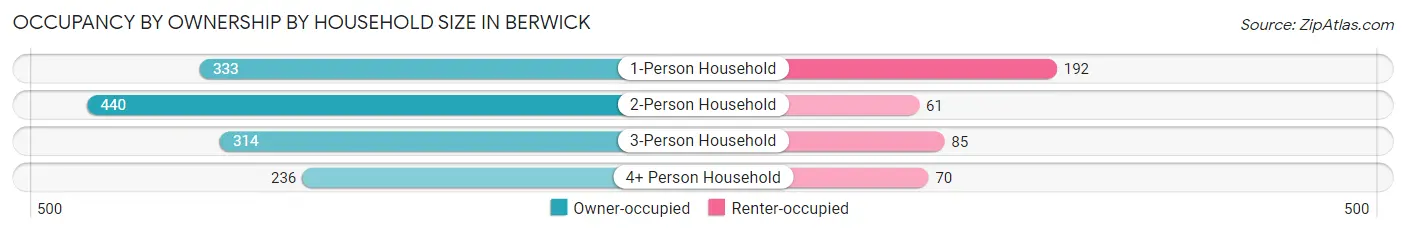
| Household Size | Owner-occupied | Renter-occupied |
| 1-Person Household | 333 (63.4%) | 192 (36.6%) |
| 2-Person Household | 440 (87.8%) | 61 (12.2%) |
| 3-Person Household | 314 (78.7%) | 85 (21.3%) |
| 4+ Person Household | 236 (77.1%) | 70 (22.9%) |
| Total Housing Units | 1,323 (76.4%) | 408 (23.6%) |
Occupancy by Educational Attainment in Berwick
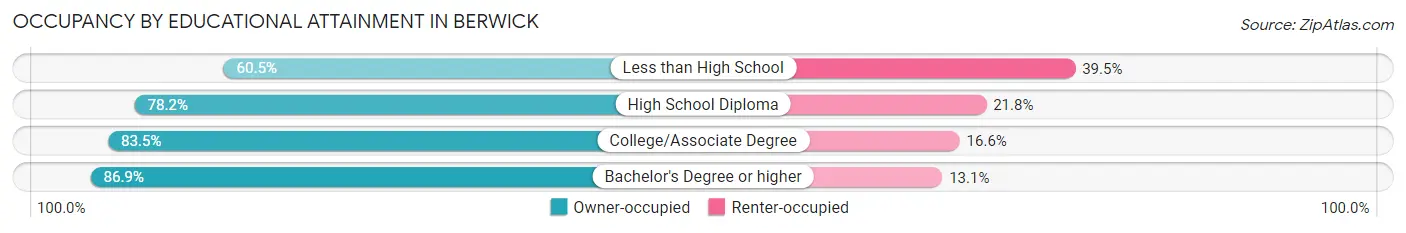
| Household Size | Owner-occupied | Renter-occupied |
| Less than High School | 276 (60.5%) | 180 (39.5%) |
| High School Diploma | 412 (78.2%) | 115 (21.8%) |
| College/Associate Degree | 363 (83.5%) | 72 (16.6%) |
| Bachelor's Degree or higher | 272 (86.9%) | 41 (13.1%) |
Occupancy by Age of Householder in Berwick
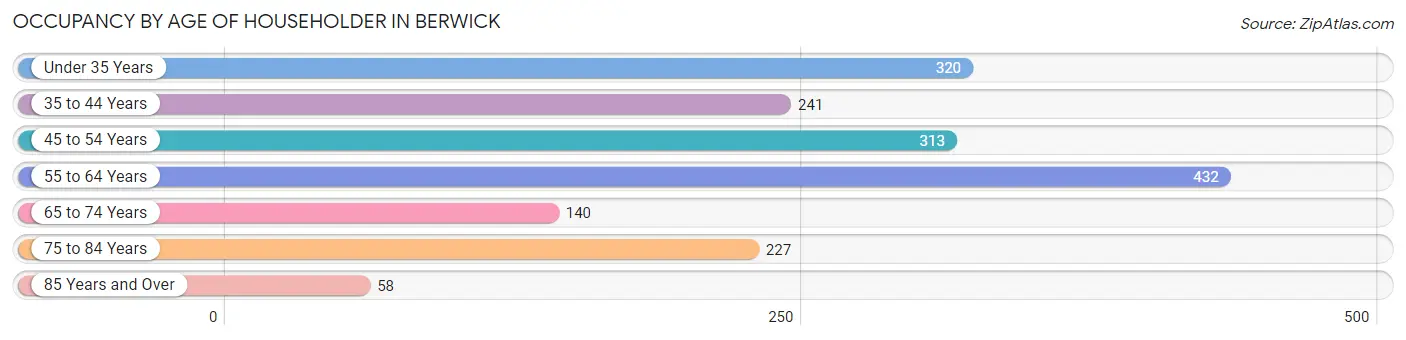
| Age Bracket | # Households | % Households |
| Under 35 Years | 320 | 18.5% |
| 35 to 44 Years | 241 | 13.9% |
| 45 to 54 Years | 313 | 18.1% |
| 55 to 64 Years | 432 | 25.0% |
| 65 to 74 Years | 140 | 8.1% |
| 75 to 84 Years | 227 | 13.1% |
| 85 Years and Over | 58 | 3.4% |
| Total | 1,731 | 100.0% |
Housing Finances in Berwick
Median Income by Occupancy in Berwick
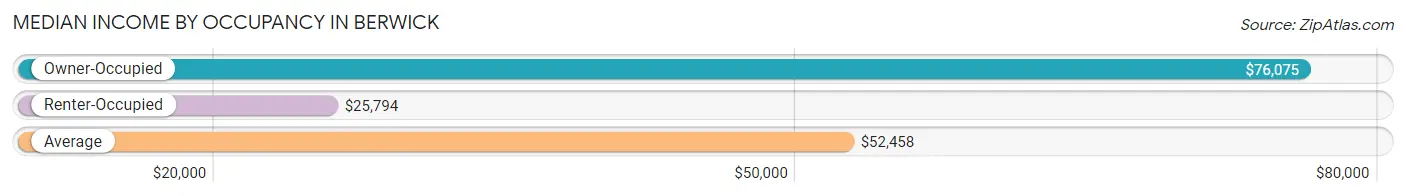
| Occupancy Type | # Households | Median Income |
| Owner-Occupied | 1,323 (76.4%) | $76,075 |
| Renter-Occupied | 408 (23.6%) | $25,794 |
| Average | 1,731 (100.0%) | $52,458 |
Occupancy by Householder Income Bracket in Berwick
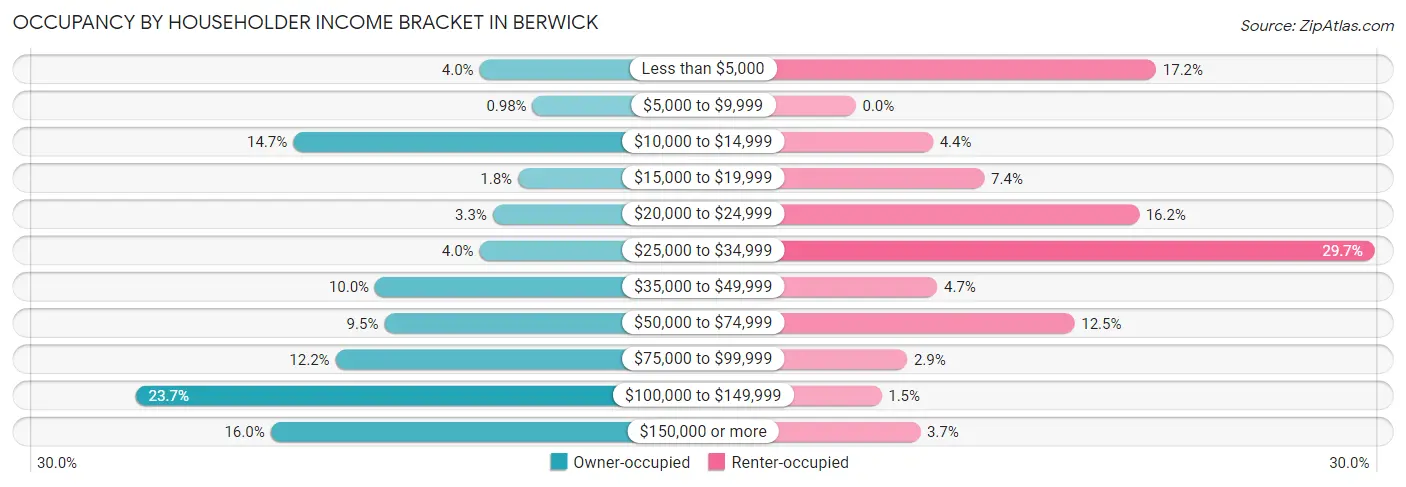
| Income Bracket | Owner-occupied | Renter-occupied |
| Less than $5,000 | 53 (4.0%) | 70 (17.2%) |
| $5,000 to $9,999 | 13 (1.0%) | 0 (0.0%) |
| $10,000 to $14,999 | 194 (14.7%) | 18 (4.4%) |
| $15,000 to $19,999 | 24 (1.8%) | 30 (7.3%) |
| $20,000 to $24,999 | 43 (3.3%) | 66 (16.2%) |
| $25,000 to $34,999 | 53 (4.0%) | 121 (29.7%) |
| $35,000 to $49,999 | 132 (10.0%) | 19 (4.7%) |
| $50,000 to $74,999 | 125 (9.5%) | 51 (12.5%) |
| $75,000 to $99,999 | 162 (12.2%) | 12 (2.9%) |
| $100,000 to $149,999 | 313 (23.7%) | 6 (1.5%) |
| $150,000 or more | 211 (16.0%) | 15 (3.7%) |
| Total | 1,323 (100.0%) | 408 (100.0%) |
Monthly Housing Cost Tiers in Berwick
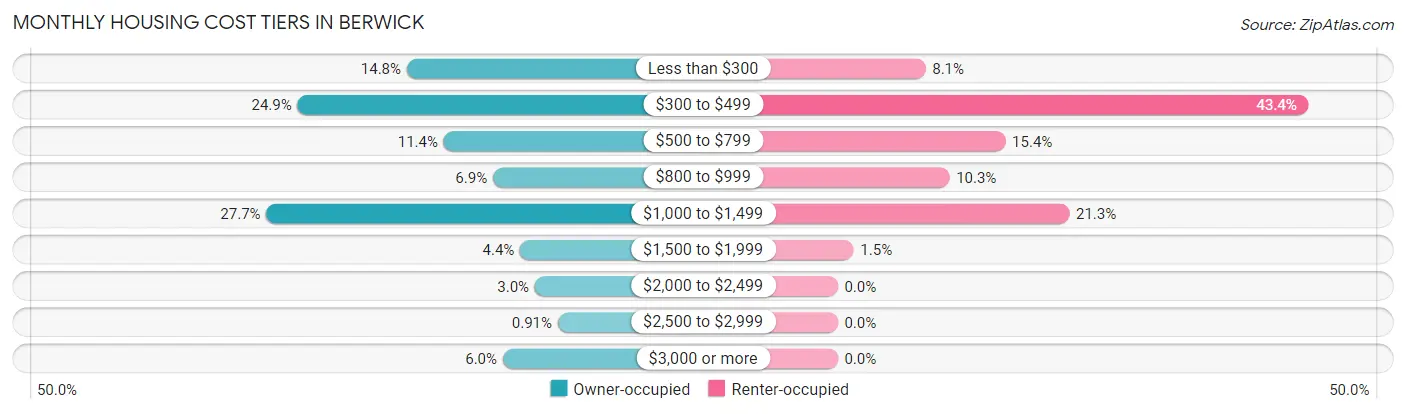
| Monthly Cost | Owner-occupied | Renter-occupied |
| Less than $300 | 196 (14.8%) | 33 (8.1%) |
| $300 to $499 | 329 (24.9%) | 177 (43.4%) |
| $500 to $799 | 151 (11.4%) | 63 (15.4%) |
| $800 to $999 | 91 (6.9%) | 42 (10.3%) |
| $1,000 to $1,499 | 367 (27.7%) | 87 (21.3%) |
| $1,500 to $1,999 | 58 (4.4%) | 6 (1.5%) |
| $2,000 to $2,499 | 40 (3.0%) | 0 (0.0%) |
| $2,500 to $2,999 | 12 (0.9%) | 0 (0.0%) |
| $3,000 or more | 79 (6.0%) | 0 (0.0%) |
| Total | 1,323 (100.0%) | 408 (100.0%) |
Physical Housing Characteristics in Berwick
Housing Structures in Berwick
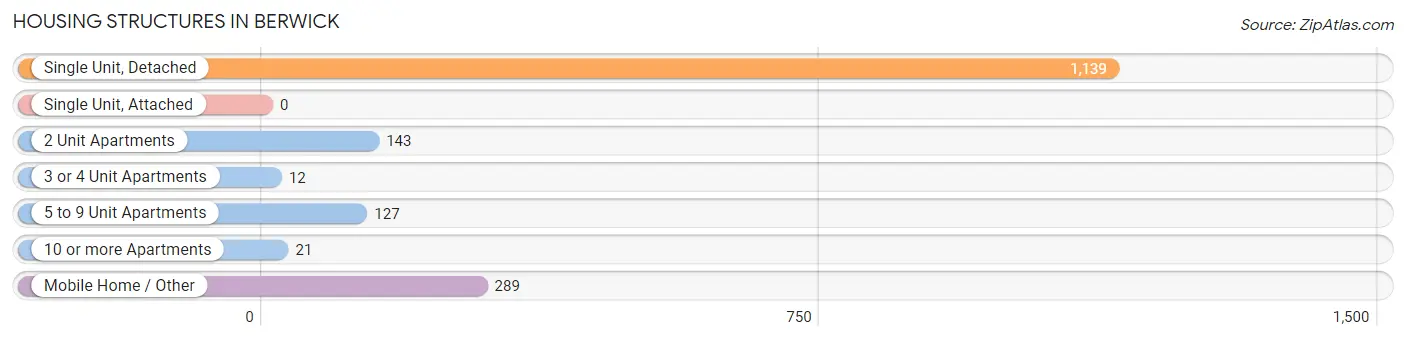
| Structure Type | # Housing Units | % Housing Units |
| Single Unit, Detached | 1,139 | 65.8% |
| Single Unit, Attached | 0 | 0.0% |
| 2 Unit Apartments | 143 | 8.3% |
| 3 or 4 Unit Apartments | 12 | 0.7% |
| 5 to 9 Unit Apartments | 127 | 7.3% |
| 10 or more Apartments | 21 | 1.2% |
| Mobile Home / Other | 289 | 16.7% |
| Total | 1,731 | 100.0% |
Housing Structures by Occupancy in Berwick
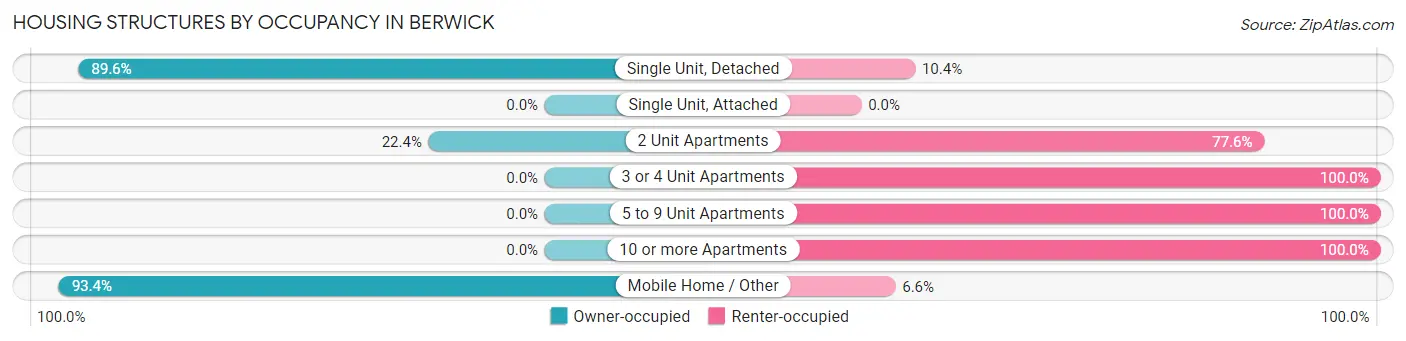
| Structure Type | Owner-occupied | Renter-occupied |
| Single Unit, Detached | 1,021 (89.6%) | 118 (10.4%) |
| Single Unit, Attached | 0 (0.0%) | 0 (0.0%) |
| 2 Unit Apartments | 32 (22.4%) | 111 (77.6%) |
| 3 or 4 Unit Apartments | 0 (0.0%) | 12 (100.0%) |
| 5 to 9 Unit Apartments | 0 (0.0%) | 127 (100.0%) |
| 10 or more Apartments | 0 (0.0%) | 21 (100.0%) |
| Mobile Home / Other | 270 (93.4%) | 19 (6.6%) |
| Total | 1,323 (76.4%) | 408 (23.6%) |
Housing Structures by Number of Rooms in Berwick
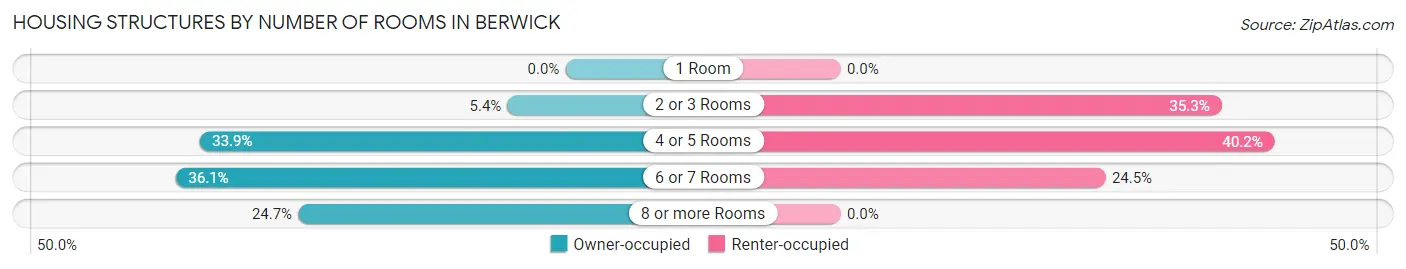
| Number of Rooms | Owner-occupied | Renter-occupied |
| 1 Room | 0 (0.0%) | 0 (0.0%) |
| 2 or 3 Rooms | 71 (5.4%) | 144 (35.3%) |
| 4 or 5 Rooms | 448 (33.9%) | 164 (40.2%) |
| 6 or 7 Rooms | 477 (36.0%) | 100 (24.5%) |
| 8 or more Rooms | 327 (24.7%) | 0 (0.0%) |
| Total | 1,323 (100.0%) | 408 (100.0%) |
Housing Structure by Heating Type in Berwick
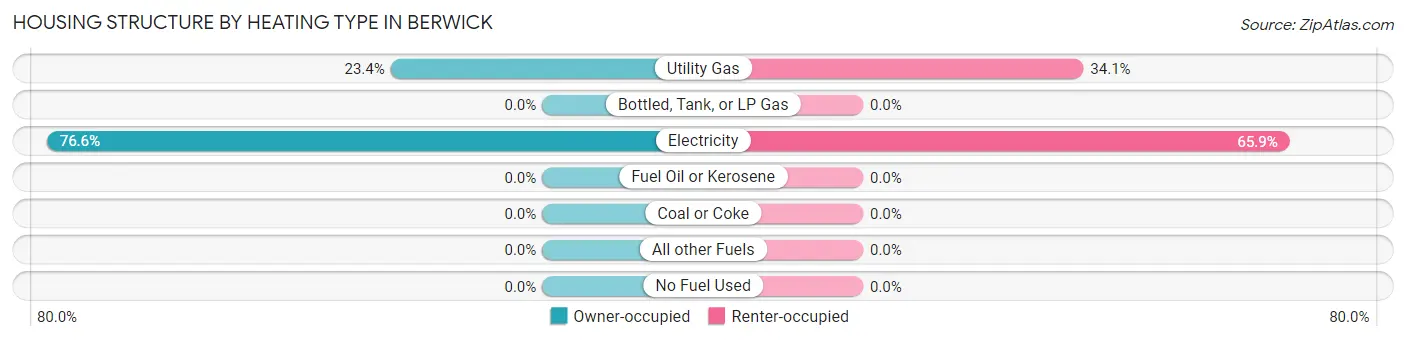
| Heating Type | Owner-occupied | Renter-occupied |
| Utility Gas | 310 (23.4%) | 139 (34.1%) |
| Bottled, Tank, or LP Gas | 0 (0.0%) | 0 (0.0%) |
| Electricity | 1,013 (76.6%) | 269 (65.9%) |
| Fuel Oil or Kerosene | 0 (0.0%) | 0 (0.0%) |
| Coal or Coke | 0 (0.0%) | 0 (0.0%) |
| All other Fuels | 0 (0.0%) | 0 (0.0%) |
| No Fuel Used | 0 (0.0%) | 0 (0.0%) |
| Total | 1,323 (100.0%) | 408 (100.0%) |
Household Vehicle Usage in Berwick
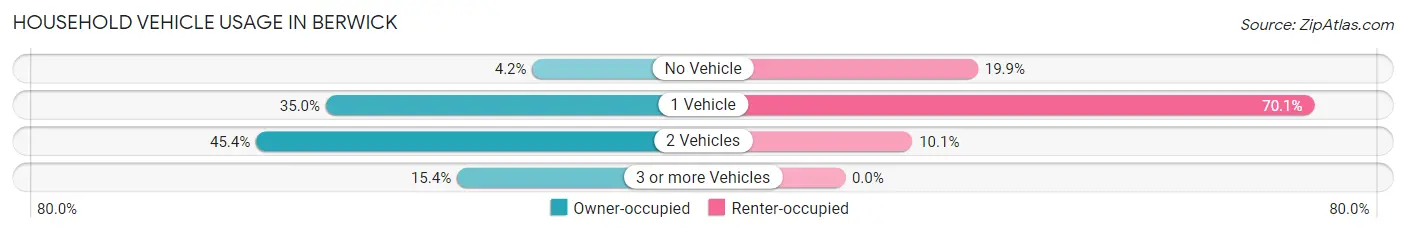
| Vehicles per Household | Owner-occupied | Renter-occupied |
| No Vehicle | 55 (4.2%) | 81 (19.9%) |
| 1 Vehicle | 463 (35.0%) | 286 (70.1%) |
| 2 Vehicles | 601 (45.4%) | 41 (10.1%) |
| 3 or more Vehicles | 204 (15.4%) | 0 (0.0%) |
| Total | 1,323 (100.0%) | 408 (100.0%) |
Real Estate & Mortgages in Berwick
Real Estate and Mortgage Overview in Berwick
| Characteristic | Without Mortgage | With Mortgage |
| Housing Units | 703 | 620 |
| Median Property Value | $102,200 | $197,400 |
| Median Household Income | $49,420 | $150 |
| Monthly Housing Costs | $353 | $79 |
| Real Estate Taxes | $495 | $92 |
Property Value by Mortgage Status in Berwick
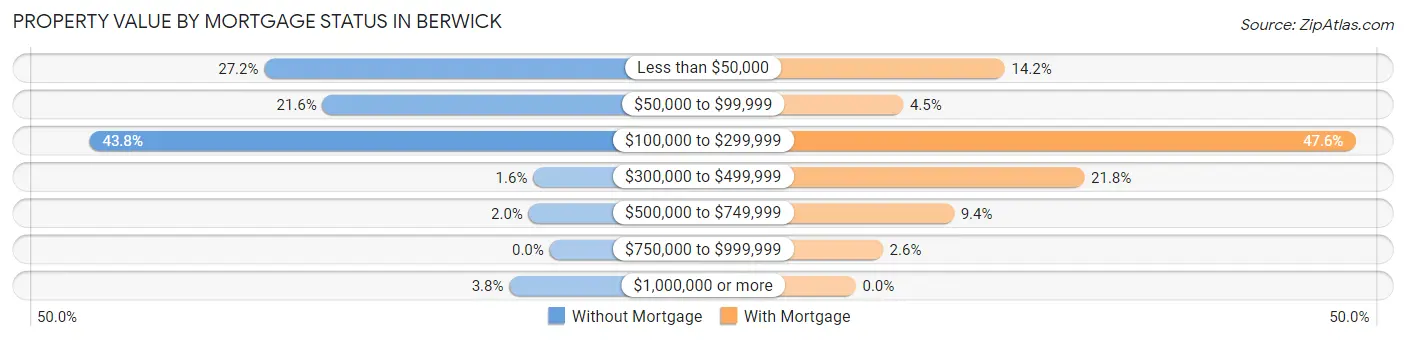
| Property Value | Without Mortgage | With Mortgage |
| Less than $50,000 | 191 (27.2%) | 88 (14.2%) |
| $50,000 to $99,999 | 152 (21.6%) | 28 (4.5%) |
| $100,000 to $299,999 | 308 (43.8%) | 295 (47.6%) |
| $300,000 to $499,999 | 11 (1.6%) | 135 (21.8%) |
| $500,000 to $749,999 | 14 (2.0%) | 58 (9.3%) |
| $750,000 to $999,999 | 0 (0.0%) | 16 (2.6%) |
| $1,000,000 or more | 27 (3.8%) | 0 (0.0%) |
| Total | 703 (100.0%) | 620 (100.0%) |
Household Income by Mortgage Status in Berwick
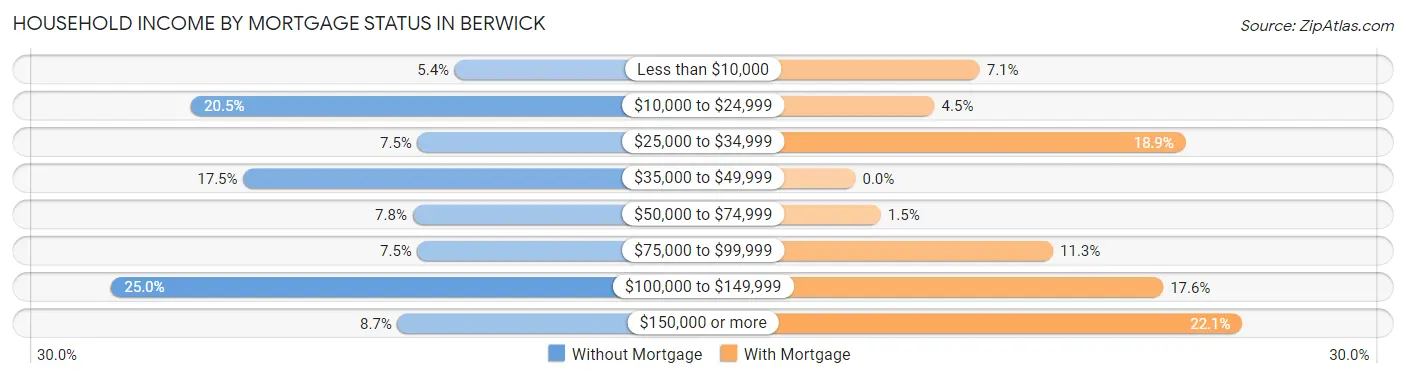
| Household Income | Without Mortgage | With Mortgage |
| Less than $10,000 | 38 (5.4%) | 44 (7.1%) |
| $10,000 to $24,999 | 144 (20.5%) | 28 (4.5%) |
| $25,000 to $34,999 | 53 (7.5%) | 117 (18.9%) |
| $35,000 to $49,999 | 123 (17.5%) | 0 (0.0%) |
| $50,000 to $74,999 | 55 (7.8%) | 9 (1.5%) |
| $75,000 to $99,999 | 53 (7.5%) | 70 (11.3%) |
| $100,000 to $149,999 | 176 (25.0%) | 109 (17.6%) |
| $150,000 or more | 61 (8.7%) | 137 (22.1%) |
| Total | 703 (100.0%) | 620 (100.0%) |
Property Value to Household Income Ratio in Berwick
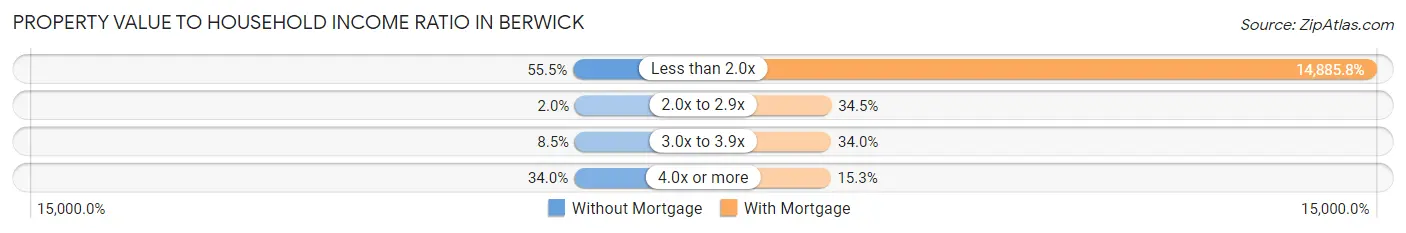
| Value-to-Income Ratio | Without Mortgage | With Mortgage |
| Less than 2.0x | 390 (55.5%) | 92,292 (14,885.8%) |
| 2.0x to 2.9x | 14 (2.0%) | 214 (34.5%) |
| 3.0x to 3.9x | 60 (8.5%) | 211 (34.0%) |
| 4.0x or more | 239 (34.0%) | 95 (15.3%) |
| Total | 703 (100.0%) | 620 (100.0%) |
Real Estate Taxes by Mortgage Status in Berwick
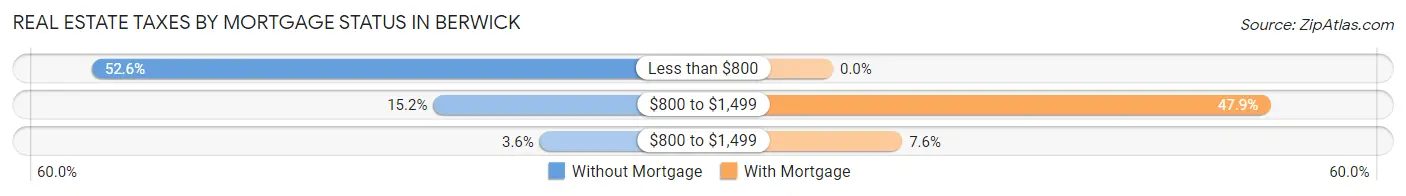
| Property Taxes | Without Mortgage | With Mortgage |
| Less than $800 | 370 (52.6%) | 0 (0.0%) |
| $800 to $1,499 | 107 (15.2%) | 297 (47.9%) |
| $800 to $1,499 | 25 (3.6%) | 47 (7.6%) |
| Total | 703 (100.0%) | 620 (100.0%) |
Health & Disability in Berwick
Health Insurance Coverage by Age in Berwick
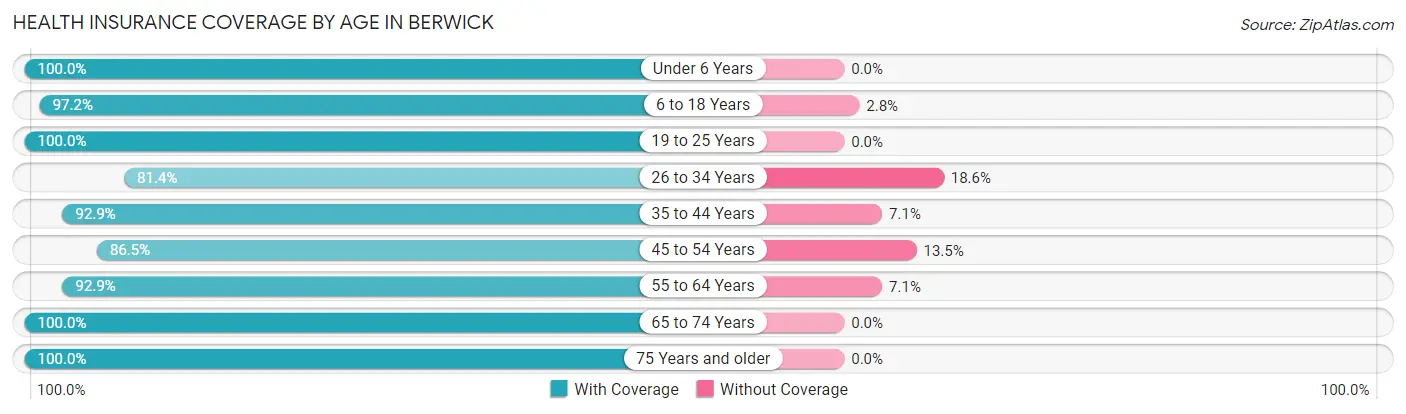
| Age Bracket | With Coverage | Without Coverage |
| Under 6 Years | 588 (100.0%) | 0 (0.0%) |
| 6 to 18 Years | 866 (97.2%) | 25 (2.8%) |
| 19 to 25 Years | 387 (100.0%) | 0 (0.0%) |
| 26 to 34 Years | 373 (81.4%) | 85 (18.6%) |
| 35 to 44 Years | 395 (92.9%) | 30 (7.1%) |
| 45 to 54 Years | 546 (86.5%) | 85 (13.5%) |
| 55 to 64 Years | 606 (92.9%) | 46 (7.1%) |
| 65 to 74 Years | 282 (100.0%) | 0 (0.0%) |
| 75 Years and older | 328 (100.0%) | 0 (0.0%) |
| Total | 4,371 (94.2%) | 271 (5.8%) |
Health Insurance Coverage by Citizenship Status in Berwick
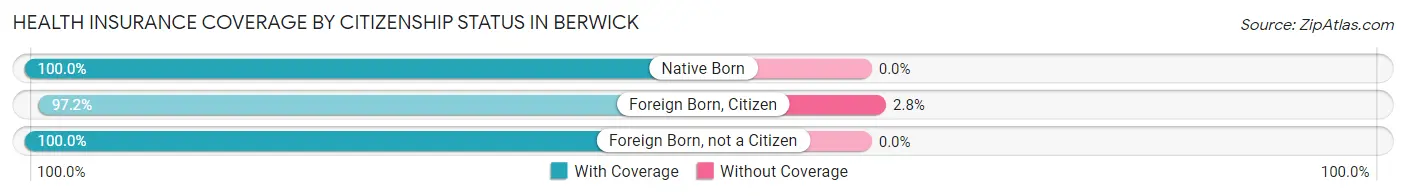
| Citizenship Status | With Coverage | Without Coverage |
| Native Born | 588 (100.0%) | 0 (0.0%) |
| Foreign Born, Citizen | 866 (97.2%) | 25 (2.8%) |
| Foreign Born, not a Citizen | 387 (100.0%) | 0 (0.0%) |
Health Insurance Coverage by Household Income in Berwick
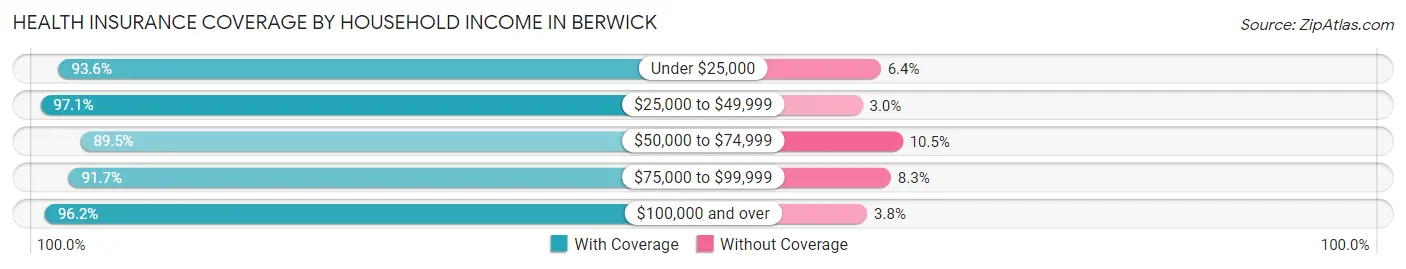
| Household Income | With Coverage | Without Coverage |
| Under $25,000 | 1,105 (93.6%) | 75 (6.4%) |
| $25,000 to $49,999 | 624 (97.1%) | 19 (2.9%) |
| $50,000 to $74,999 | 573 (89.5%) | 67 (10.5%) |
| $75,000 to $99,999 | 555 (91.7%) | 50 (8.3%) |
| $100,000 and over | 1,514 (96.2%) | 60 (3.8%) |
Public vs Private Health Insurance Coverage by Age in Berwick
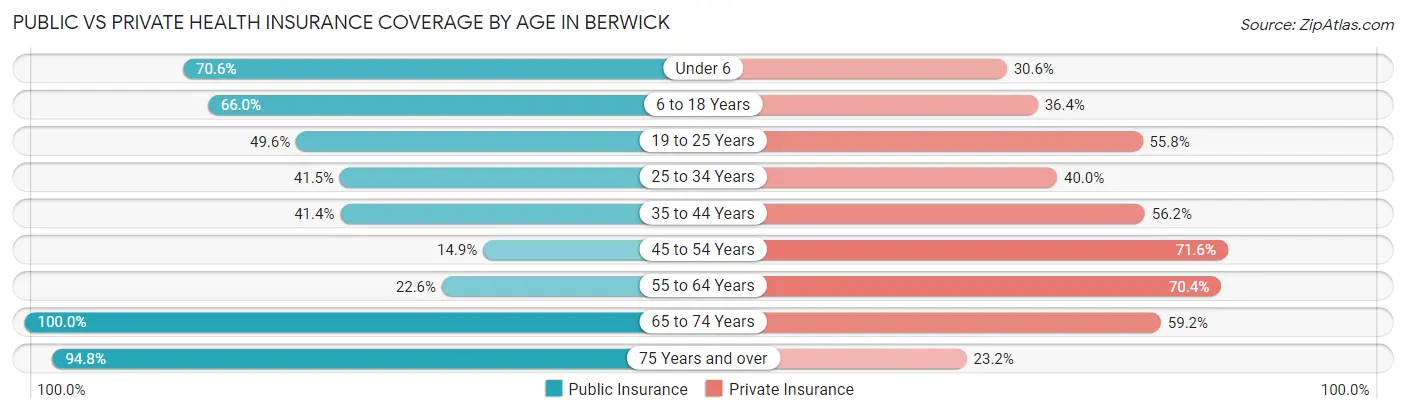
| Age Bracket | Public Insurance | Private Insurance |
| Under 6 | 415 (70.6%) | 180 (30.6%) |
| 6 to 18 Years | 588 (66.0%) | 324 (36.4%) |
| 19 to 25 Years | 192 (49.6%) | 216 (55.8%) |
| 25 to 34 Years | 190 (41.5%) | 183 (40.0%) |
| 35 to 44 Years | 176 (41.4%) | 239 (56.2%) |
| 45 to 54 Years | 94 (14.9%) | 452 (71.6%) |
| 55 to 64 Years | 147 (22.6%) | 459 (70.4%) |
| 65 to 74 Years | 282 (100.0%) | 167 (59.2%) |
| 75 Years and over | 311 (94.8%) | 76 (23.2%) |
| Total | 2,395 (51.6%) | 2,296 (49.5%) |
Disability Status by Sex by Age in Berwick
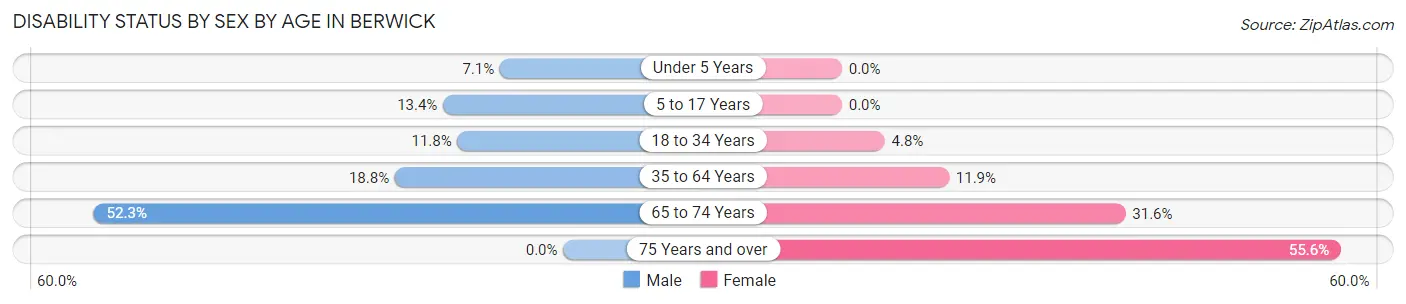
| Age Bracket | Male | Female |
| Under 5 Years | 28 (7.0%) | 0 (0.0%) |
| 5 to 17 Years | 55 (13.4%) | 0 (0.0%) |
| 18 to 34 Years | 49 (11.8%) | 24 (4.8%) |
| 35 to 64 Years | 141 (18.8%) | 114 (11.9%) |
| 65 to 74 Years | 68 (52.3%) | 48 (31.6%) |
| 75 Years and over | 0 (0.0%) | 149 (55.6%) |
Disability Class by Sex by Age in Berwick
Disability Class: Hearing Difficulty
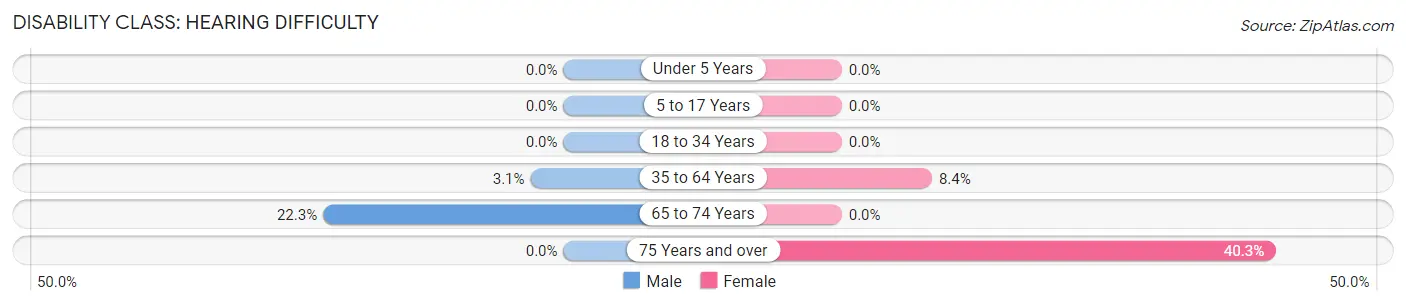
| Age Bracket | Male | Female |
| Under 5 Years | 0 (0.0%) | 0 (0.0%) |
| 5 to 17 Years | 0 (0.0%) | 0 (0.0%) |
| 18 to 34 Years | 0 (0.0%) | 0 (0.0%) |
| 35 to 64 Years | 23 (3.1%) | 80 (8.4%) |
| 65 to 74 Years | 29 (22.3%) | 0 (0.0%) |
| 75 Years and over | 0 (0.0%) | 108 (40.3%) |
Disability Class: Vision Difficulty
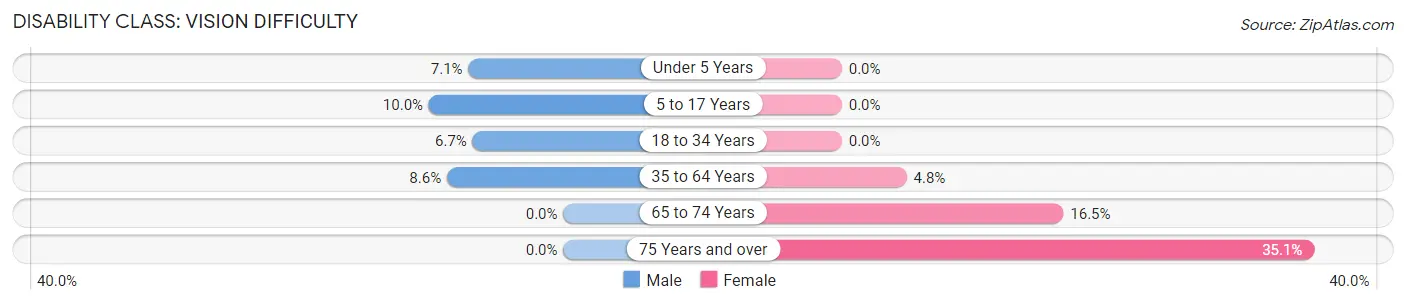
| Age Bracket | Male | Female |
| Under 5 Years | 28 (7.0%) | 0 (0.0%) |
| 5 to 17 Years | 41 (10.0%) | 0 (0.0%) |
| 18 to 34 Years | 28 (6.7%) | 0 (0.0%) |
| 35 to 64 Years | 65 (8.6%) | 46 (4.8%) |
| 65 to 74 Years | 0 (0.0%) | 25 (16.5%) |
| 75 Years and over | 0 (0.0%) | 94 (35.1%) |
Disability Class: Cognitive Difficulty
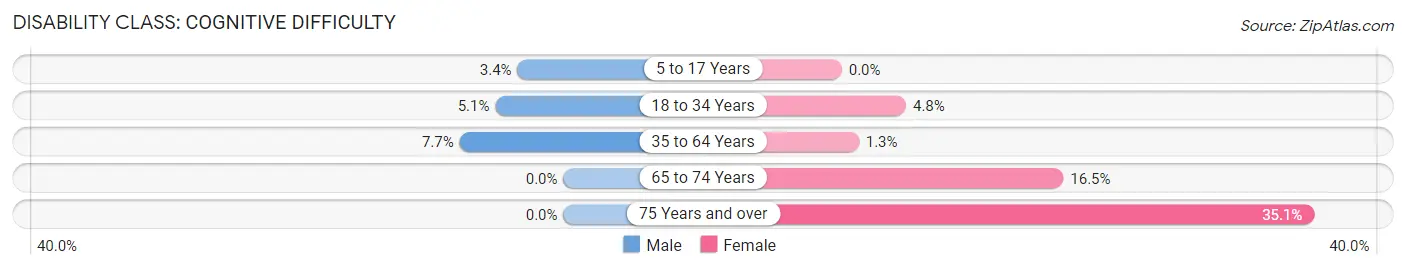
| Age Bracket | Male | Female |
| 5 to 17 Years | 14 (3.4%) | 0 (0.0%) |
| 18 to 34 Years | 21 (5.1%) | 24 (4.8%) |
| 35 to 64 Years | 58 (7.7%) | 12 (1.3%) |
| 65 to 74 Years | 0 (0.0%) | 25 (16.5%) |
| 75 Years and over | 0 (0.0%) | 94 (35.1%) |
Disability Class: Ambulatory Difficulty
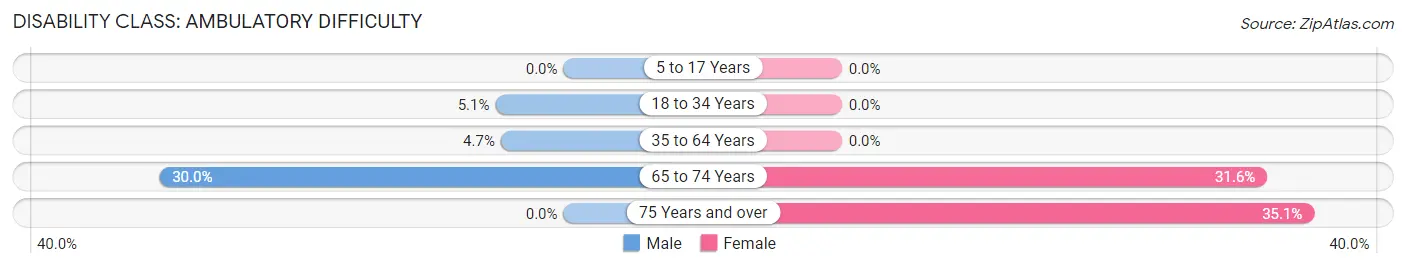
| Age Bracket | Male | Female |
| 5 to 17 Years | 0 (0.0%) | 0 (0.0%) |
| 18 to 34 Years | 21 (5.1%) | 0 (0.0%) |
| 35 to 64 Years | 35 (4.6%) | 0 (0.0%) |
| 65 to 74 Years | 39 (30.0%) | 48 (31.6%) |
| 75 Years and over | 0 (0.0%) | 94 (35.1%) |
Disability Class: Self-Care Difficulty
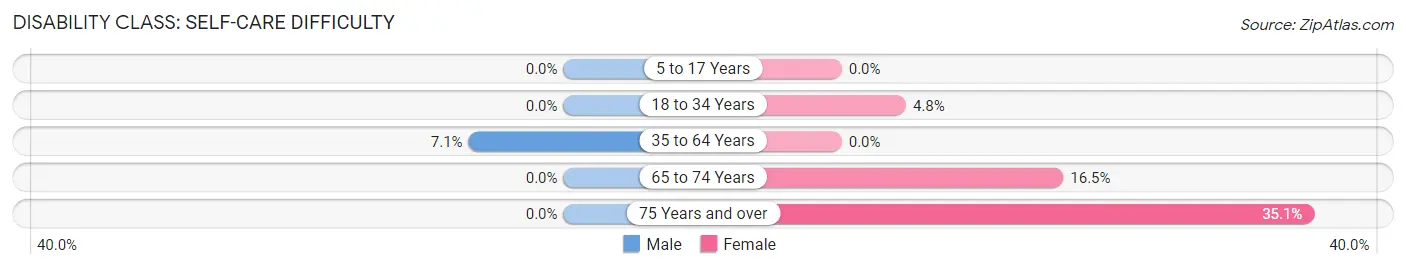
| Age Bracket | Male | Female |
| 5 to 17 Years | 0 (0.0%) | 0 (0.0%) |
| 18 to 34 Years | 0 (0.0%) | 24 (4.8%) |
| 35 to 64 Years | 53 (7.0%) | 0 (0.0%) |
| 65 to 74 Years | 0 (0.0%) | 25 (16.5%) |
| 75 Years and over | 0 (0.0%) | 94 (35.1%) |
Technology Access in Berwick
Computing Device Access in Berwick
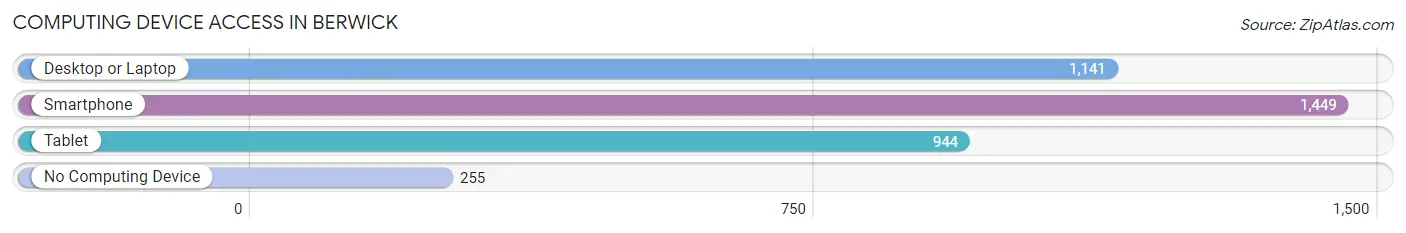
| Device Type | # Households | % Households |
| Desktop or Laptop | 1,141 | 65.9% |
| Smartphone | 1,449 | 83.7% |
| Tablet | 944 | 54.5% |
| No Computing Device | 255 | 14.7% |
| Total | 1,731 | 100.0% |
Internet Access in Berwick
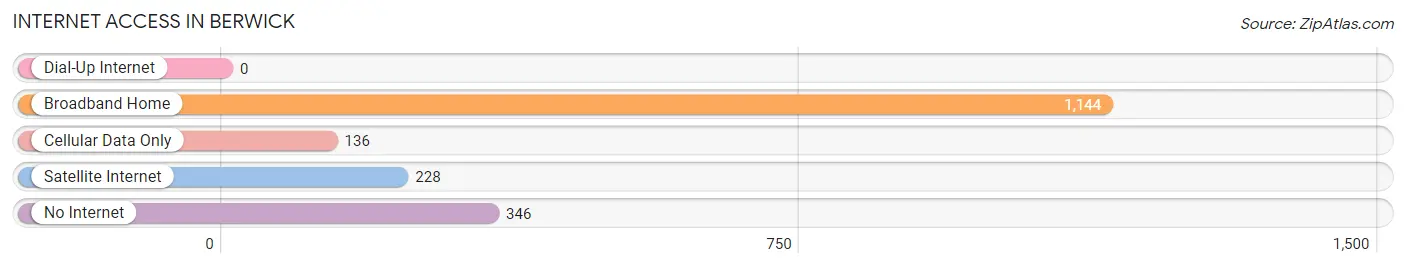
| Internet Type | # Households | % Households |
| Dial-Up Internet | 0 | 0.0% |
| Broadband Home | 1,144 | 66.1% |
| Cellular Data Only | 136 | 7.9% |
| Satellite Internet | 228 | 13.2% |
| No Internet | 346 | 20.0% |
| Total | 1,731 | 100.0% |
Berwick Summary
Berwick is a small town located in St. Mary Parish, Louisiana, United States. It is situated on the banks of the Atchafalaya River, approximately 25 miles south of Morgan City. The town has a population of approximately 4,000 people and is part of the Morgan City Micropolitan Statistical Area.
History
Berwick was founded in 1859 by a group of settlers from the nearby town of Franklin. The town was named after the Scottish town of Berwick-upon-Tweed, which was the birthplace of one of the settlers. The town quickly grew and by the late 19th century, it had become a major port for the shipping of cotton and other goods.
In the early 20th century, Berwick was a major center for the oil and gas industry. The town was home to several oil refineries and was the site of the first offshore oil drilling platform in the United States. The town also became a major center for the shrimping industry.
Geography
Berwick is located in St. Mary Parish, Louisiana, approximately 25 miles south of Morgan City. The town is situated on the banks of the Atchafalaya River and is surrounded by marshland and swamps. The town is located at an elevation of 8 feet above sea level.
Economy
Berwick’s economy is largely based on the oil and gas industry. The town is home to several oil refineries and is the site of the first offshore oil drilling platform in the United States. The town is also a major center for the shrimping industry.
In addition to the oil and gas industry, Berwick is also home to several manufacturing companies. The town is home to a number of boat and shipbuilding companies, as well as a number of food processing plants.
Demographics
As of the 2010 census, Berwick had a population of 4,000 people. The town has a median household income of $37,000 and a median family income of $45,000. The town has a poverty rate of 22.7%.
The town is predominantly white, with a population that is approximately 75% white. The town also has a small African American population, which makes up approximately 20% of the population. The town also has a small Hispanic population, which makes up approximately 5% of the population.
Conclusion
Berwick is a small town located in St. Mary Parish, Louisiana, United States. It is situated on the banks of the Atchafalaya River, approximately 25 miles south of Morgan City. The town has a population of approximately 4,000 people and is part of the Morgan City Micropolitan Statistical Area. The town’s economy is largely based on the oil and gas industry, as well as manufacturing and the shrimping industry. The town is predominantly white, with a population that is approximately 75% white. The town also has a small African American population, which makes up approximately 20% of the population, and a small Hispanic population, which makes up approximately 5% of the population.
Common Questions
What is Per Capita Income in Berwick?
Per Capita income in Berwick is $28,202.
What is the Median Family Income in Berwick?
Median Family Income in Berwick is $91,667.
What is the Median Household income in Berwick?
Median Household Income in Berwick is $52,458.
What is Income or Wage Gap in Berwick?
Income or Wage Gap in Berwick is 74.8%.
Women in Berwick earn 25.2 cents for every dollar earned by a man.
What is Inequality or Gini Index in Berwick?
Inequality or Gini Index in Berwick is 0.48.
What is the Total Population of Berwick?
Total Population of Berwick is 4,717.
What is the Total Male Population of Berwick?
Total Male Population of Berwick is 2,241.
What is the Total Female Population of Berwick?
Total Female Population of Berwick is 2,476.
What is the Ratio of Males per 100 Females in Berwick?
There are 90.51 Males per 100 Females in Berwick.
What is the Ratio of Females per 100 Males in Berwick?
There are 110.49 Females per 100 Males in Berwick.
What is the Median Population Age in Berwick?
Median Population Age in Berwick is 34.6 Years.
What is the Average Family Size in Berwick
Average Family Size in Berwick is 3.4 People.
What is the Average Household Size in Berwick
Average Household Size in Berwick is 2.7 People.
How Large is the Labor Force in Berwick?
There are 2,161 People in the Labor Forcein in Berwick.
What is the Percentage of People in the Labor Force in Berwick?
62.7% of People are in the Labor Force in Berwick.
What is the Unemployment Rate in Berwick?
Unemployment Rate in Berwick is 10.3%.