Franklinton, LA Map & Demographics
Franklinton Map
Franklinton Overview
$26,211
PER CAPITA INCOME
$40,903
AVG FAMILY INCOME
$31,645
AVG HOUSEHOLD INCOME
0.48
INEQUALITY / GINI INDEX
3,638
TOTAL POPULATION
2,115
MALE POPULATION
1,523
FEMALE POPULATION
138.87
MALES / 100 FEMALES
72.01
FEMALES / 100 MALES
39.5
MEDIAN AGE
3.0
AVG FAMILY SIZE
2.4
AVG HOUSEHOLD SIZE
1,651
LABOR FORCE [ PEOPLE ]
57.5%
PERCENT IN LABOR FORCE
4.2%
UNEMPLOYMENT RATE
Franklinton Zip Codes
Franklinton Area Codes
Income in Franklinton
Income Overview in Franklinton
Per Capita Income in Franklinton is $26,211, while median incomes of families and households are $40,903 and $31,645 respectively.
| Characteristic | Number | Measure |
| Per Capita Income | 3,638 | $26,211 |
| Median Family Income | 946 | $40,903 |
| Mean Family Income | 946 | $68,231 |
| Median Household Income | 1,373 | $31,645 |
| Mean Household Income | 1,373 | $63,141 |
| Income Deficit | 946 | $0 |
| Wage / Income Gap (%) | 3,638 | 0.00% |
| Wage / Income Gap ($) | 3,638 | 100.00¢ per $1 |
| Gini / Inequality Index | 3,638 | 0.48 |
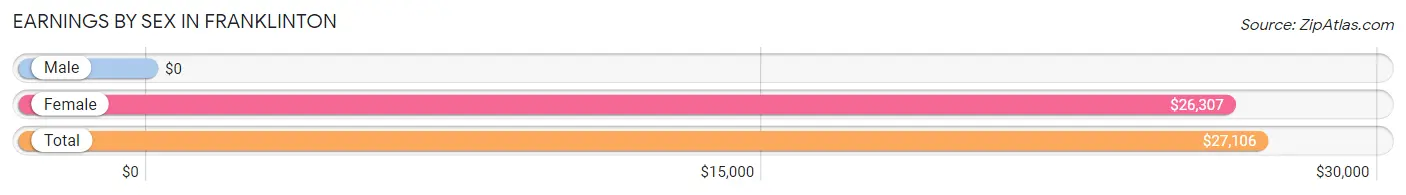
Earnings by Sex in Franklinton
| Sex | Number | Average Earnings |
| Male | 832 (49.2%) | $0 |
| Female | 859 (50.8%) | $26,307 |
| Total | 1,691 (100.0%) | $27,106 |
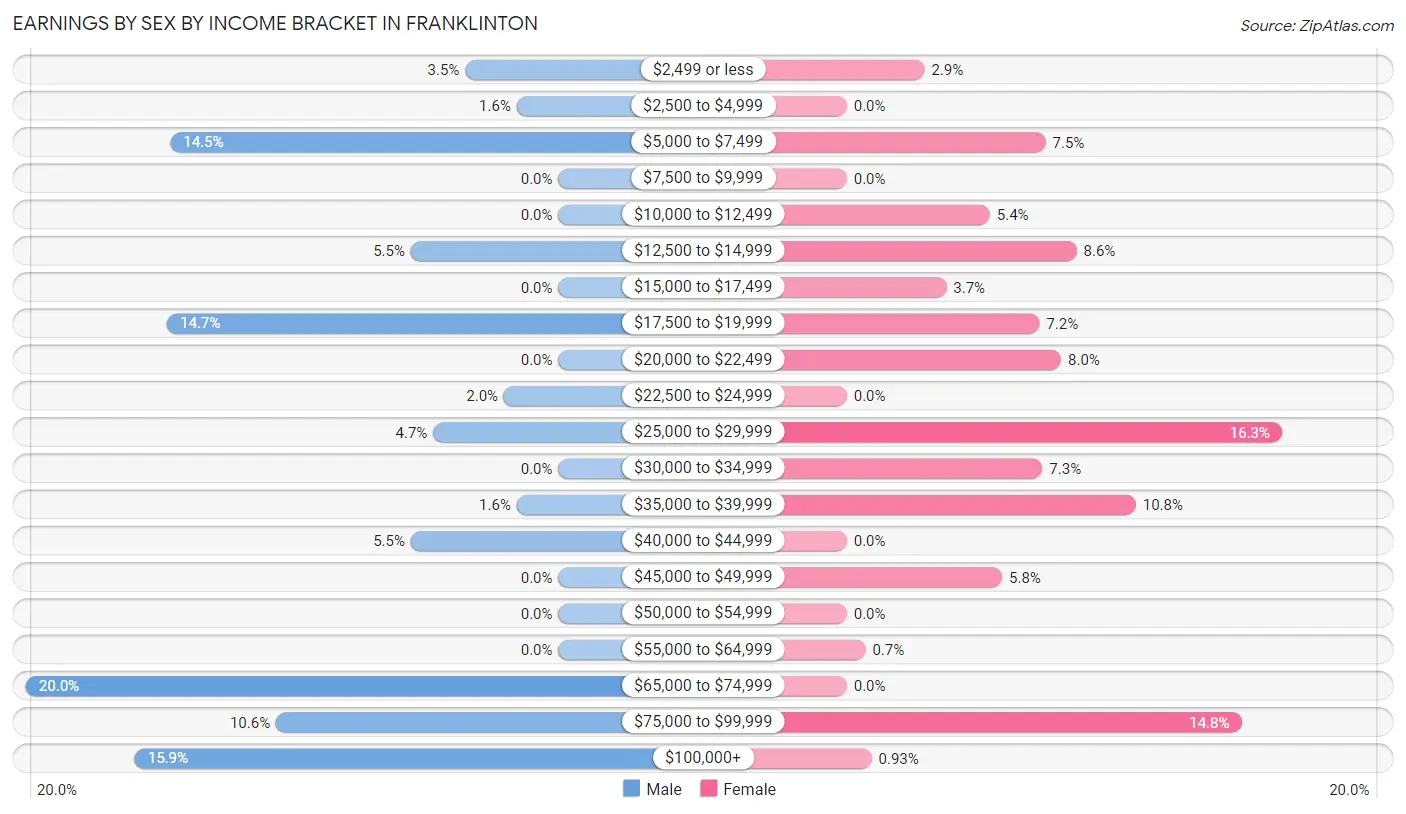
Earnings by Sex by Income Bracket in Franklinton
The most common earnings brackets in Franklinton are $65,000 to $74,999 for men (166 | 20.0%) and $25,000 to $29,999 for women (140 | 16.3%).
| Income | Male | Female |
| $2,499 or less | 29 (3.5%) | 25 (2.9%) |
| $2,500 to $4,999 | 13 (1.6%) | 0 (0.0%) |
| $5,000 to $7,499 | 121 (14.5%) | 64 (7.4%) |
| $7,500 to $9,999 | 0 (0.0%) | 0 (0.0%) |
| $10,000 to $12,499 | 0 (0.0%) | 46 (5.4%) |
| $12,500 to $14,999 | 46 (5.5%) | 74 (8.6%) |
| $15,000 to $17,499 | 0 (0.0%) | 32 (3.7%) |
| $17,500 to $19,999 | 122 (14.7%) | 62 (7.2%) |
| $20,000 to $22,499 | 0 (0.0%) | 69 (8.0%) |
| $22,500 to $24,999 | 17 (2.0%) | 0 (0.0%) |
| $25,000 to $29,999 | 39 (4.7%) | 140 (16.3%) |
| $30,000 to $34,999 | 0 (0.0%) | 63 (7.3%) |
| $35,000 to $39,999 | 13 (1.6%) | 93 (10.8%) |
| $40,000 to $44,999 | 46 (5.5%) | 0 (0.0%) |
| $45,000 to $49,999 | 0 (0.0%) | 50 (5.8%) |
| $50,000 to $54,999 | 0 (0.0%) | 0 (0.0%) |
| $55,000 to $64,999 | 0 (0.0%) | 6 (0.7%) |
| $65,000 to $74,999 | 166 (20.0%) | 0 (0.0%) |
| $75,000 to $99,999 | 88 (10.6%) | 127 (14.8%) |
| $100,000+ | 132 (15.9%) | 8 (0.9%) |
| Total | 832 (100.0%) | 859 (100.0%) |
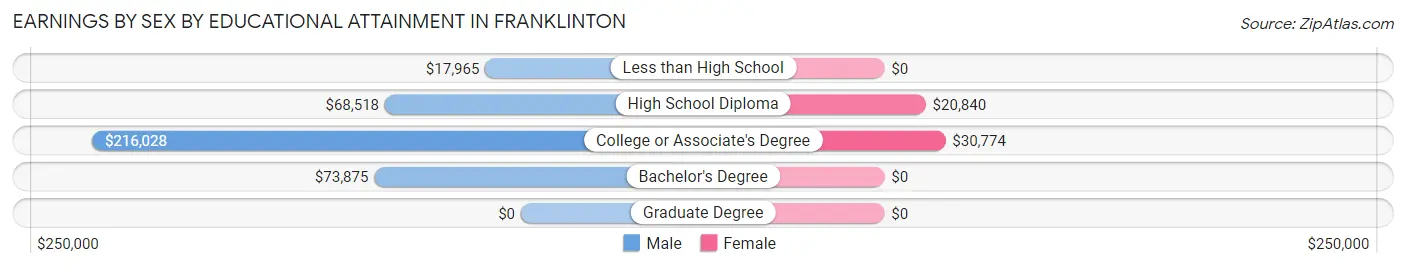
Earnings by Sex by Educational Attainment in Franklinton
Average earnings in Franklinton are $67,120 for men and $28,625 for women, a difference of 57.4%. Men with an educational attainment of college or associate's degree enjoy the highest average annual earnings of $216,028, while those with less than high school education earn the least with $17,965. Women with an educational attainment of college or associate's degree earn the most with the average annual earnings of $30,774, while those with high school diploma education have the smallest earnings of $20,840.
| Educational Attainment | Male Income | Female Income |
| Less than High School | $17,965 | $0 |
| High School Diploma | $68,518 | $20,840 |
| College or Associate's Degree | $216,028 | $30,774 |
| Bachelor's Degree | $73,875 | $0 |
| Graduate Degree | - | - |
| Total | $67,120 | $28,625 |
Family Income in Franklinton
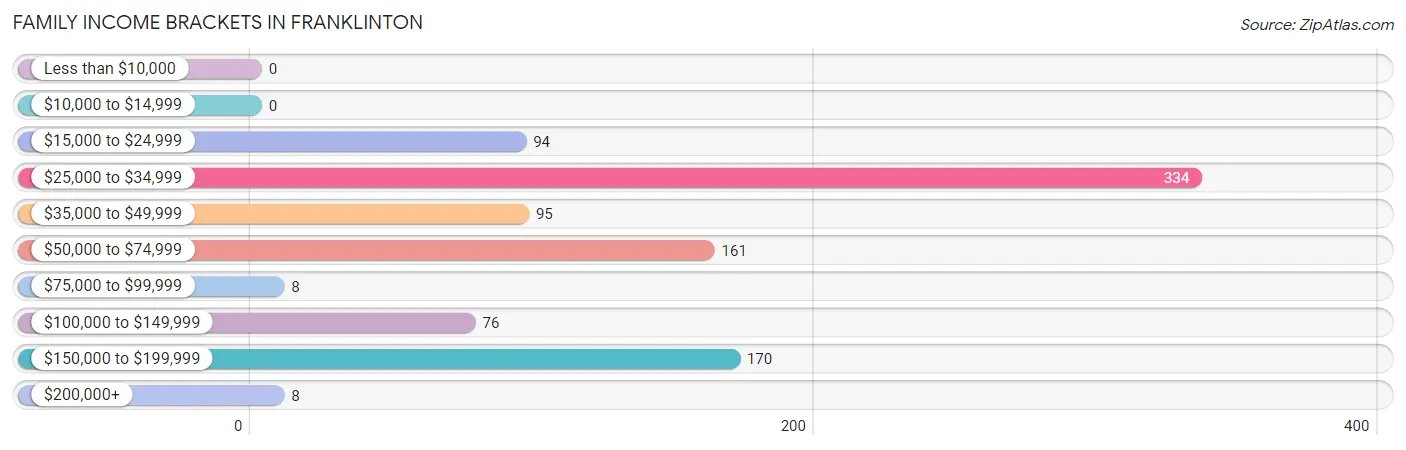
Family Income Brackets in Franklinton
According to the Franklinton family income data, there are 334 families falling into the $25,000 to $34,999 income range, which is the most common income bracket and makes up 35.3% of all families.
| Income Bracket | # Families | % Families |
| Less than $10,000 | 0 | 0.0% |
| $10,000 to $14,999 | 0 | 0.0% |
| $15,000 to $24,999 | 94 | 9.9% |
| $25,000 to $34,999 | 334 | 35.3% |
| $35,000 to $49,999 | 95 | 10.0% |
| $50,000 to $74,999 | 161 | 17.0% |
| $75,000 to $99,999 | 8 | 0.8% |
| $100,000 to $149,999 | 76 | 8.0% |
| $150,000 to $199,999 | 170 | 18.0% |
| $200,000+ | 8 | 0.8% |
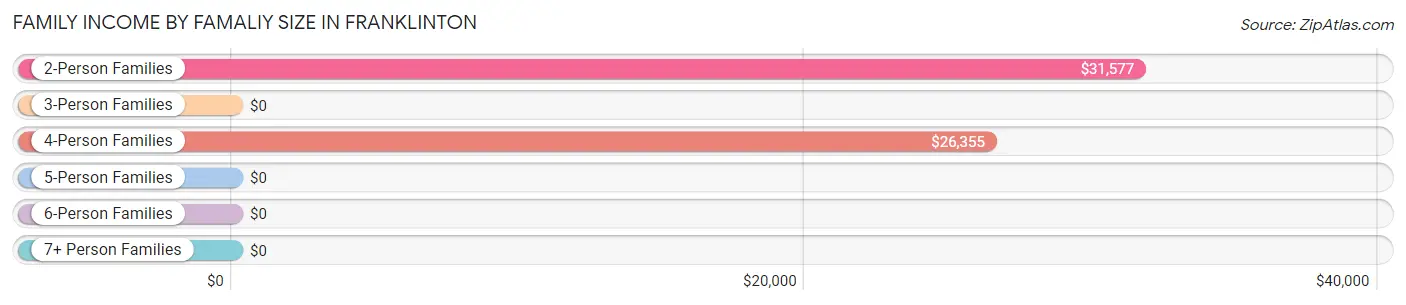
Family Income by Famaliy Size in Franklinton
2-person families (571 | 60.4%) account for the highest median family income in Franklinton with $31,577 per family, while 2-person families (571 | 60.4%) have the highest median income of $15,788 per family member.
| Income Bracket | # Families | Median Income |
| 2-Person Families | 571 (60.4%) | $31,577 |
| 3-Person Families | 152 (16.1%) | $0 |
| 4-Person Families | 103 (10.9%) | $26,355 |
| 5-Person Families | 100 (10.6%) | $0 |
| 6-Person Families | 20 (2.1%) | $0 |
| 7+ Person Families | 0 (0.0%) | $0 |
| Total | 946 (100.0%) | $40,903 |
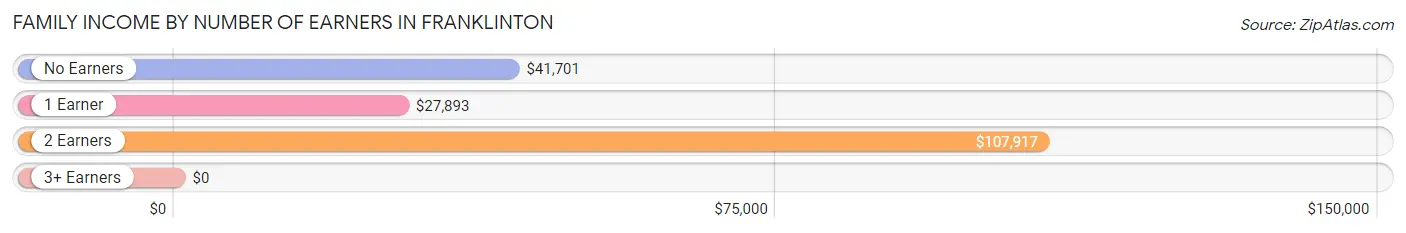
Family Income by Number of Earners in Franklinton
| Number of Earners | # Families | Median Income |
| No Earners | 99 (10.5%) | $41,701 |
| 1 Earner | 476 (50.3%) | $27,893 |
| 2 Earners | 322 (34.0%) | $107,917 |
| 3+ Earners | 49 (5.2%) | $0 |
| Total | 946 (100.0%) | $40,903 |
Household Income in Franklinton
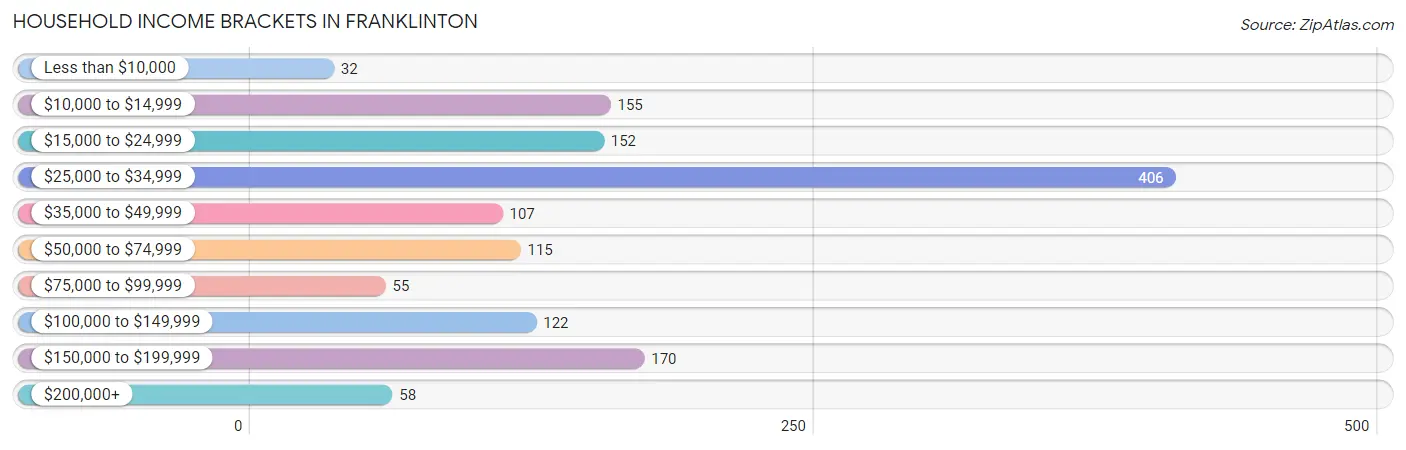
Household Income Brackets in Franklinton
With 406 households falling in the category, the $25,000 to $34,999 income range is the most frequent in Franklinton, accounting for 29.6% of all households. In contrast, only 32 households (2.3%) fall into the less than $10,000 income bracket, making it the least populous group.
| Income Bracket | # Households | % Households |
| Less than $10,000 | 32 | 2.3% |
| $10,000 to $14,999 | 155 | 11.3% |
| $15,000 to $24,999 | 152 | 11.1% |
| $25,000 to $34,999 | 406 | 29.6% |
| $35,000 to $49,999 | 107 | 7.8% |
| $50,000 to $74,999 | 115 | 8.4% |
| $75,000 to $99,999 | 55 | 4.0% |
| $100,000 to $149,999 | 122 | 8.9% |
| $150,000 to $199,999 | 170 | 12.4% |
| $200,000+ | 58 | 4.2% |
Household Income by Householder Age in Franklinton
The median household income in Franklinton is $31,645, with the highest median household income of $57,528 found in the 45 to 64 years age bracket for the primary householder. A total of 469 households (34.2%) fall into this category. Meanwhile, the 15 to 24 years age bracket for the primary householder has the lowest median household income of $0, with 86 households (6.3%) in this group.
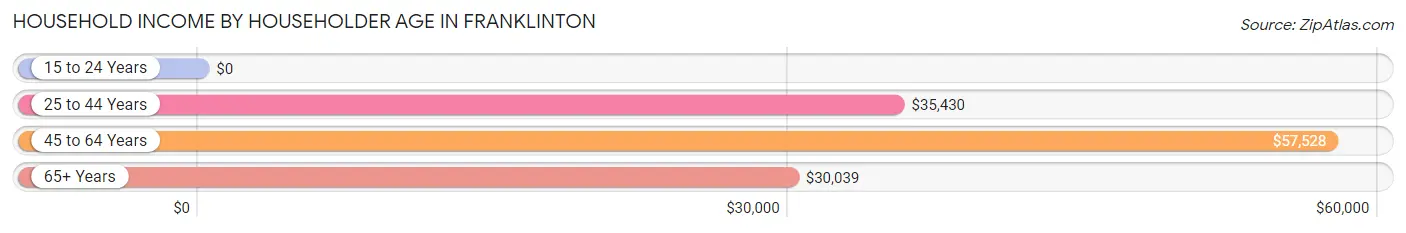
| Income Bracket | # Households | Median Income |
| 15 to 24 Years | 86 (6.3%) | $0 |
| 25 to 44 Years | 511 (37.2%) | $35,430 |
| 45 to 64 Years | 469 (34.2%) | $57,528 |
| 65+ Years | 307 (22.4%) | $30,039 |
| Total | 1,373 (100.0%) | $31,645 |
Poverty in Franklinton
Income Below Poverty by Sex and Age in Franklinton
With 23.4% poverty level for males and 31.0% for females among the residents of Franklinton, under 5 year old males and 18 to 24 year old females are the most vulnerable to poverty, with 210 males (100.0%) and 99 females (79.8%) in their respective age groups living below the poverty level.
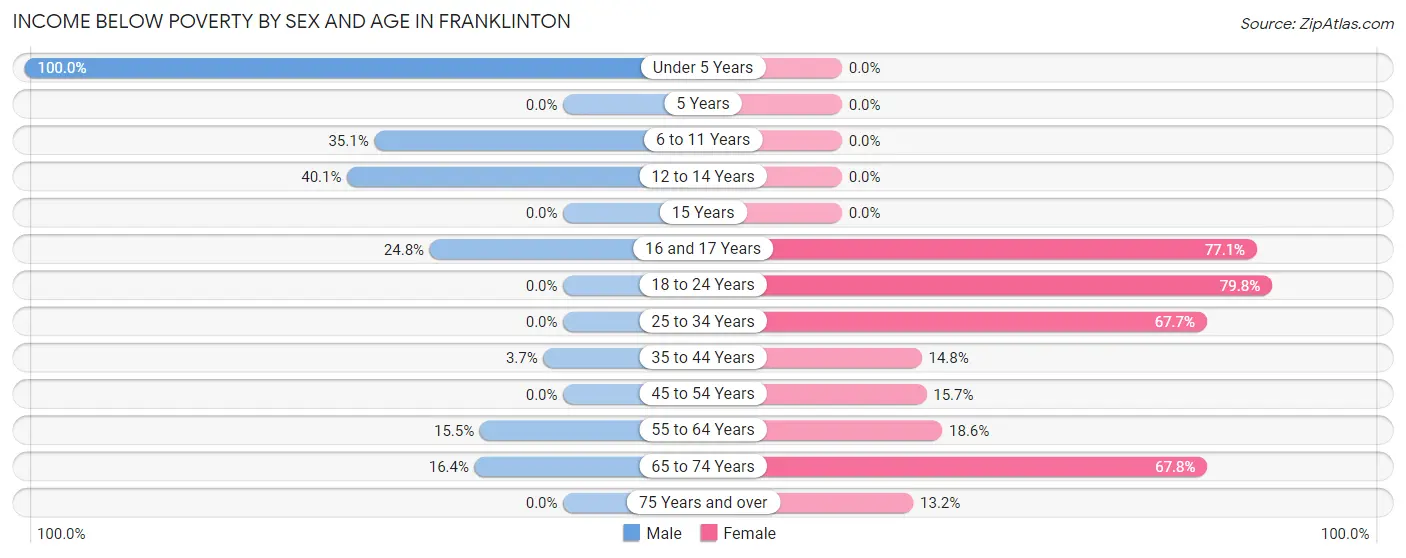
| Age Bracket | Male | Female |
| Under 5 Years | 210 (100.0%) | 0 (0.0%) |
| 5 Years | 0 (0.0%) | 0 (0.0%) |
| 6 to 11 Years | 54 (35.1%) | 0 (0.0%) |
| 12 to 14 Years | 75 (40.1%) | 0 (0.0%) |
| 15 Years | 0 (0.0%) | 0 (0.0%) |
| 16 and 17 Years | 27 (24.8%) | 47 (77.0%) |
| 18 to 24 Years | 0 (0.0%) | 99 (79.8%) |
| 25 to 34 Years | 0 (0.0%) | 84 (67.7%) |
| 35 to 44 Years | 10 (3.7%) | 58 (14.8%) |
| 45 to 54 Years | 0 (0.0%) | 8 (15.7%) |
| 55 to 64 Years | 32 (15.5%) | 54 (18.6%) |
| 65 to 74 Years | 36 (16.4%) | 97 (67.8%) |
| 75 Years and over | 0 (0.0%) | 9 (13.2%) |
| Total | 444 (23.4%) | 456 (31.0%) |
Income Above Poverty by Sex and Age in Franklinton
According to the poverty statistics in Franklinton, males aged 18 to 24 years and females aged under 5 years are the age groups that are most secure financially, with 100.0% of males and 100.0% of females in these age groups living above the poverty line.
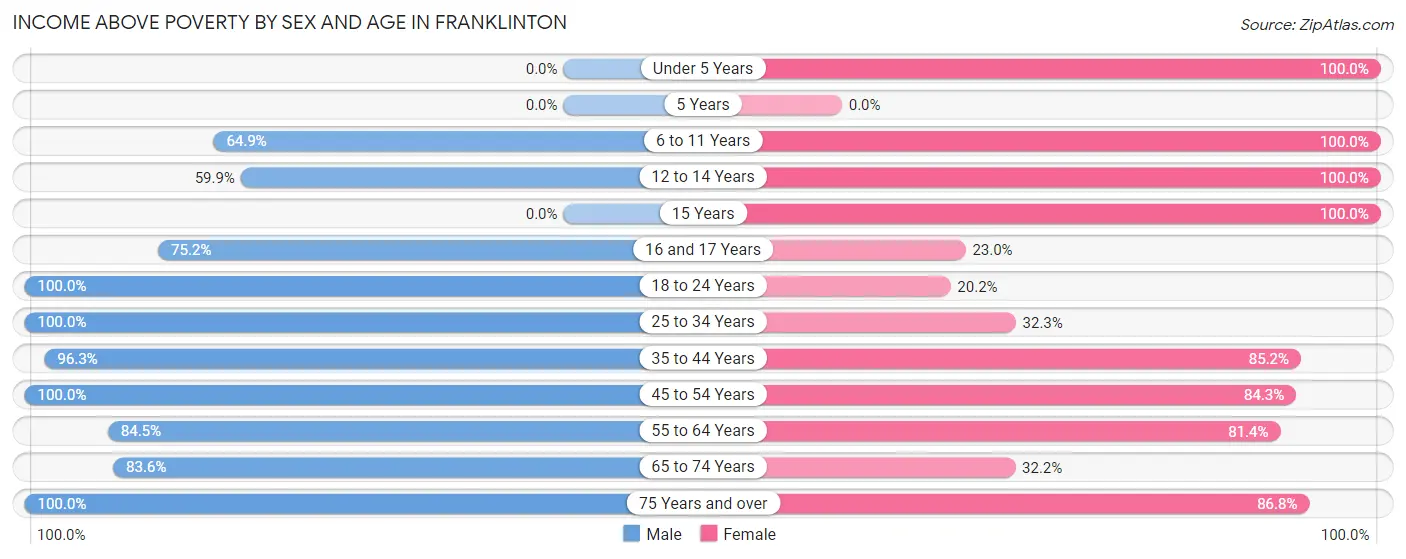
| Age Bracket | Male | Female |
| Under 5 Years | 0 (0.0%) | 11 (100.0%) |
| 5 Years | 0 (0.0%) | 0 (0.0%) |
| 6 to 11 Years | 100 (64.9%) | 18 (100.0%) |
| 12 to 14 Years | 112 (59.9%) | 136 (100.0%) |
| 15 Years | 0 (0.0%) | 51 (100.0%) |
| 16 and 17 Years | 82 (75.2%) | 14 (23.0%) |
| 18 to 24 Years | 146 (100.0%) | 25 (20.2%) |
| 25 to 34 Years | 108 (100.0%) | 40 (32.3%) |
| 35 to 44 Years | 262 (96.3%) | 334 (85.2%) |
| 45 to 54 Years | 237 (100.0%) | 43 (84.3%) |
| 55 to 64 Years | 175 (84.5%) | 236 (81.4%) |
| 65 to 74 Years | 183 (83.6%) | 46 (32.2%) |
| 75 Years and over | 44 (100.0%) | 59 (86.8%) |
| Total | 1,449 (76.5%) | 1,013 (69.0%) |
Income Below Poverty Among Married-Couple Families in Franklinton
The poverty statistics for married-couple families in Franklinton show that 6.5% or 27 of the total 414 families live below the poverty line. Families with 1 or 2 children have the highest poverty rate of 7.1%, comprising of 15 families. On the other hand, families with 3 or 4 children have the lowest poverty rate of 0.0%, which includes 0 families.
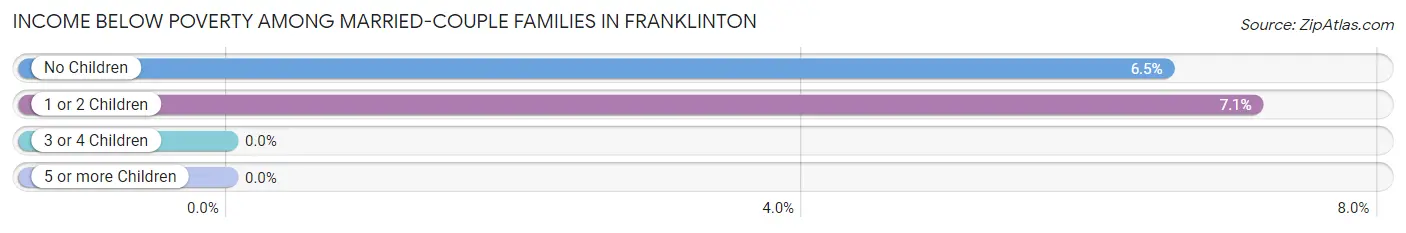
| Children | Above Poverty | Below Poverty |
| No Children | 172 (93.5%) | 12 (6.5%) |
| 1 or 2 Children | 195 (92.9%) | 15 (7.1%) |
| 3 or 4 Children | 20 (100.0%) | 0 (0.0%) |
| 5 or more Children | 0 (0.0%) | 0 (0.0%) |
| Total | 387 (93.5%) | 27 (6.5%) |
Income Below Poverty Among Single-Parent Households in Franklinton
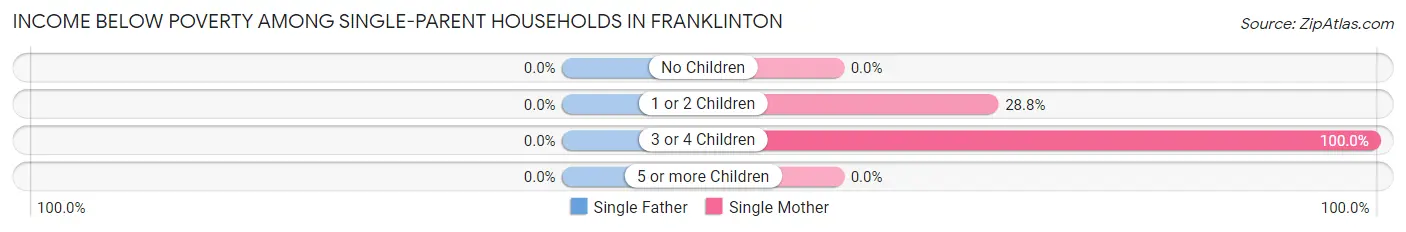
| Children | Single Father | Single Mother |
| No Children | 0 (0.0%) | 0 (0.0%) |
| 1 or 2 Children | 0 (0.0%) | 74 (28.8%) |
| 3 or 4 Children | 0 (0.0%) | 95 (100.0%) |
| 5 or more Children | 0 (0.0%) | 0 (0.0%) |
| Total | 0 (0.0%) | 169 (42.6%) |
Income Below Poverty Among Married-Couple vs Single-Parent Households in Franklinton
The poverty data for Franklinton shows that 27 of the married-couple family households (6.5%) and 169 of the single-parent households (31.8%) are living below the poverty level. Within the married-couple family households, those with 1 or 2 children have the highest poverty rate, with 15 households (7.1%) falling below the poverty line. Among the single-parent households, those with 3 or 4 children have the highest poverty rate, with 95 household (100.0%) living below poverty.
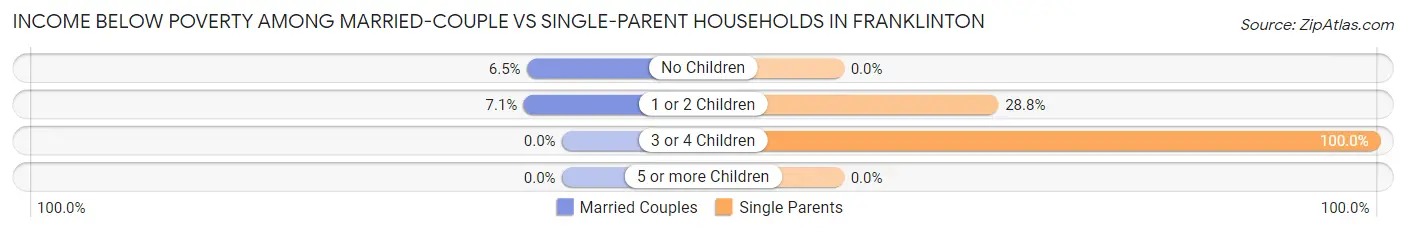
| Children | Married-Couple Families | Single-Parent Households |
| No Children | 12 (6.5%) | 0 (0.0%) |
| 1 or 2 Children | 15 (7.1%) | 74 (28.8%) |
| 3 or 4 Children | 0 (0.0%) | 95 (100.0%) |
| 5 or more Children | 0 (0.0%) | 0 (0.0%) |
| Total | 27 (6.5%) | 169 (31.8%) |
Race in Franklinton
The most populous races in Franklinton are Black / African American (1,955 | 53.7%), White / Caucasian (1,545 | 42.5%), and Two or more Races (131 | 3.6%).
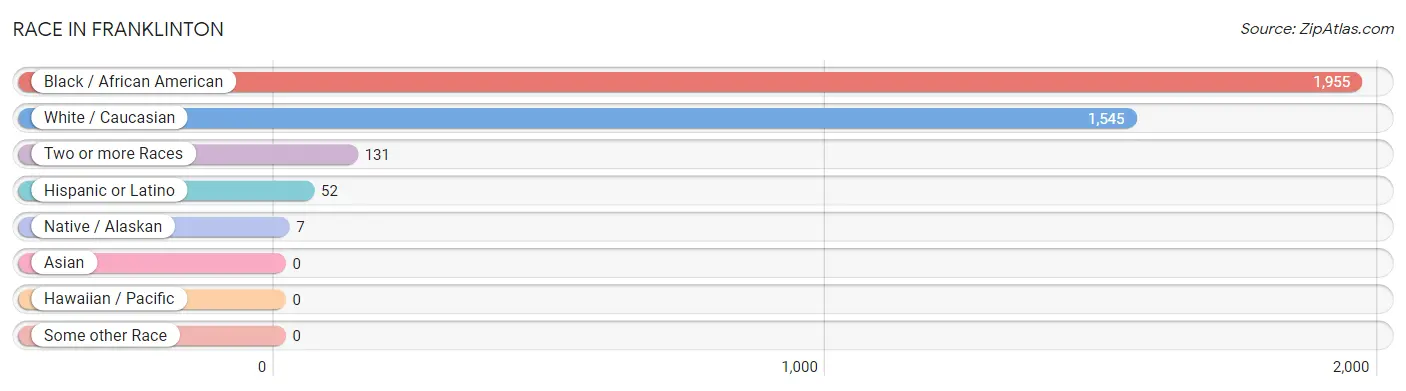
| Race | # Population | % Population |
| Asian | 0 | 0.0% |
| Black / African American | 1,955 | 53.7% |
| Hawaiian / Pacific | 0 | 0.0% |
| Hispanic or Latino | 52 | 1.4% |
| Native / Alaskan | 7 | 0.2% |
| White / Caucasian | 1,545 | 42.5% |
| Two or more Races | 131 | 3.6% |
| Some other Race | 0 | 0.0% |
| Total | 3,638 | 100.0% |
Ancestry in Franklinton
The most populous ancestries reported in Franklinton are Irish (490 | 13.5%), Italian (376 | 10.3%), German (242 | 6.7%), American (191 | 5.2%), and French (159 | 4.4%), together accounting for 40.1% of all Franklinton residents.
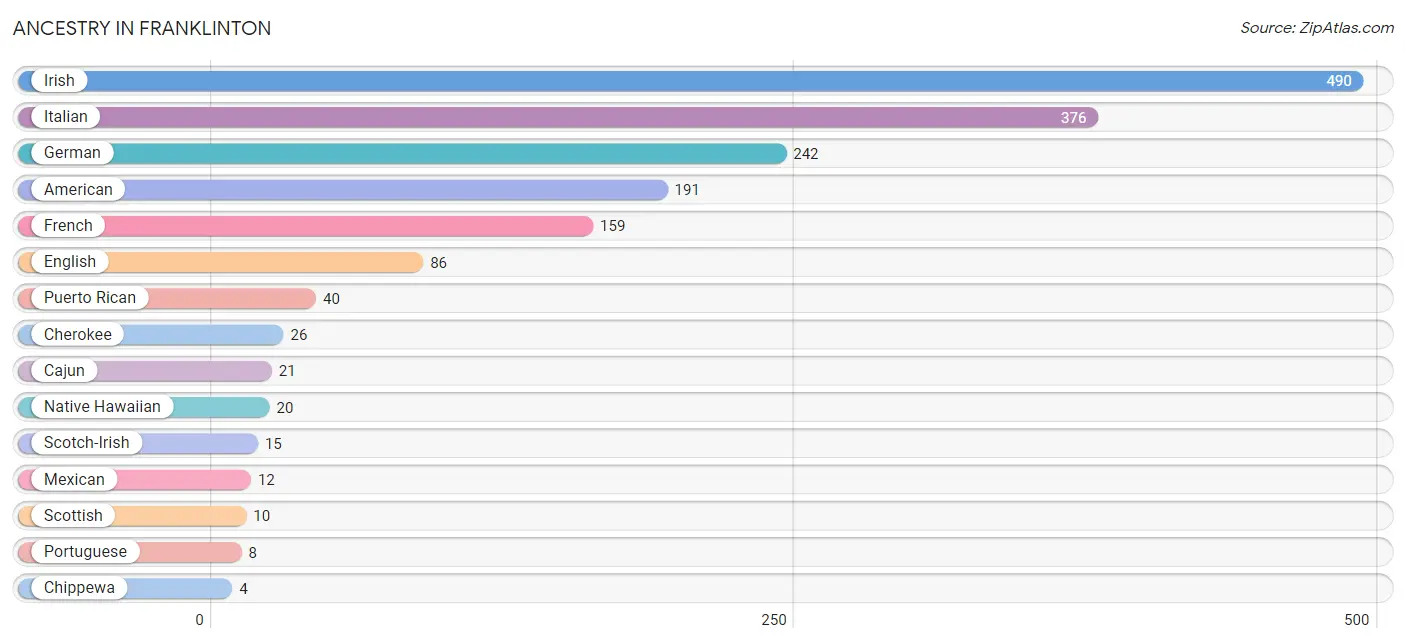
| Ancestry | # Population | % Population |
| American | 191 | 5.2% |
| Cajun | 21 | 0.6% |
| Cherokee | 26 | 0.7% |
| Chippewa | 4 | 0.1% |
| English | 86 | 2.4% |
| French | 159 | 4.4% |
| German | 242 | 6.7% |
| Irish | 490 | 13.5% |
| Italian | 376 | 10.3% |
| Mexican | 12 | 0.3% |
| Native Hawaiian | 20 | 0.5% |
| Portuguese | 8 | 0.2% |
| Puerto Rican | 40 | 1.1% |
| Scotch-Irish | 15 | 0.4% |
| Scottish | 10 | 0.3% |
| Sioux | 3 | 0.1% | View All 16 Rows |
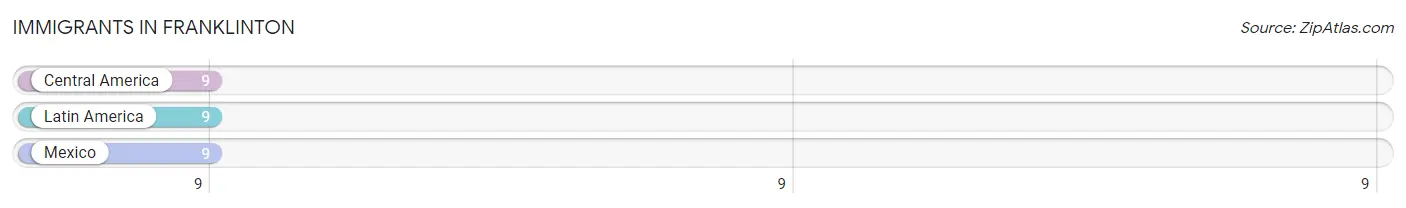
Immigrants in Franklinton
The most numerous immigrant groups reported in Franklinton came from Central America (9 | 0.3%), Latin America (9 | 0.3%), and Mexico (9 | 0.3%), together accounting for 0.7% of all Franklinton residents.
| Immigration Origin | # Population | % Population |
| Central America | 9 | 0.3% |
| Latin America | 9 | 0.3% |
| Mexico | 9 | 0.3% | View All 3 Rows |
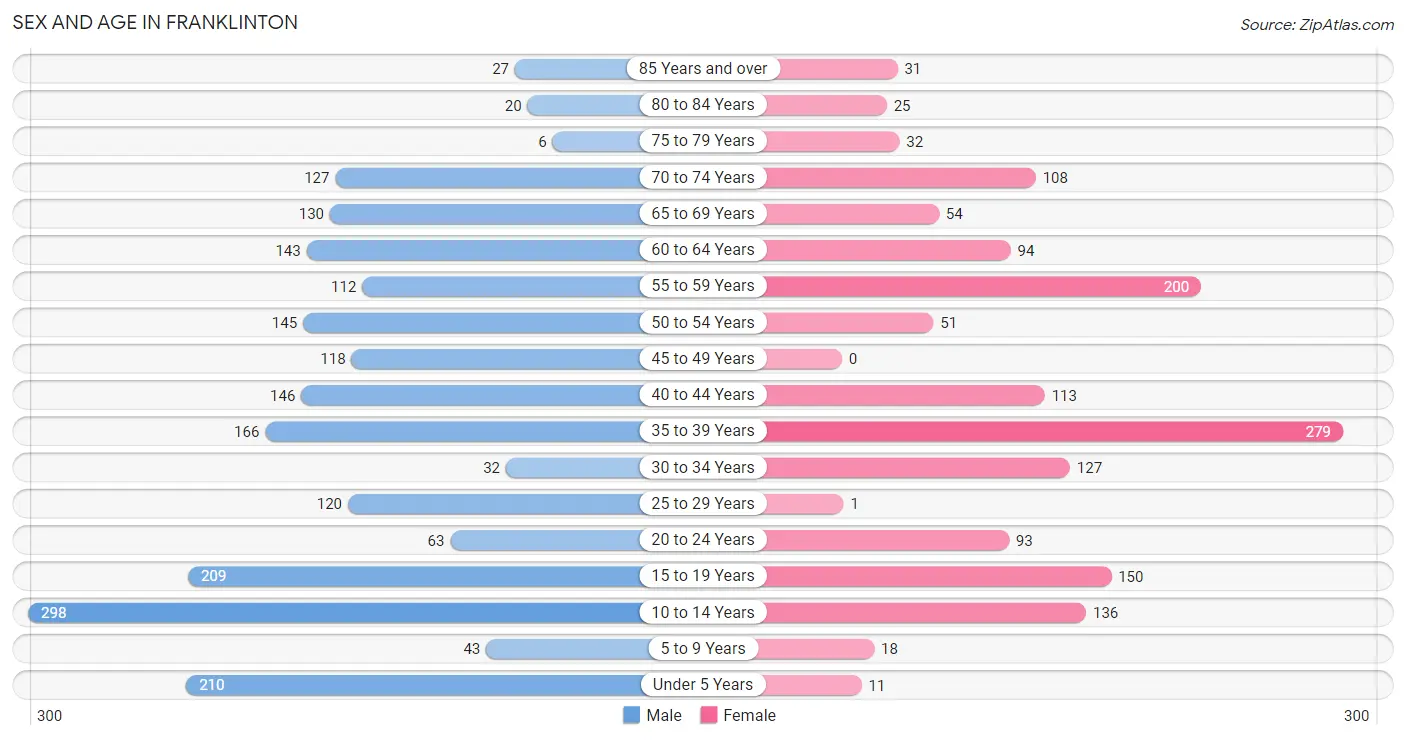
Sex and Age in Franklinton
Sex and Age in Franklinton
The most populous age groups in Franklinton are 10 to 14 Years (298 | 14.1%) for men and 35 to 39 Years (279 | 18.3%) for women.
| Age Bracket | Male | Female |
| Under 5 Years | 210 (9.9%) | 11 (0.7%) |
| 5 to 9 Years | 43 (2.0%) | 18 (1.2%) |
| 10 to 14 Years | 298 (14.1%) | 136 (8.9%) |
| 15 to 19 Years | 209 (9.9%) | 150 (9.9%) |
| 20 to 24 Years | 63 (3.0%) | 93 (6.1%) |
| 25 to 29 Years | 120 (5.7%) | 1 (0.1%) |
| 30 to 34 Years | 32 (1.5%) | 127 (8.3%) |
| 35 to 39 Years | 166 (7.9%) | 279 (18.3%) |
| 40 to 44 Years | 146 (6.9%) | 113 (7.4%) |
| 45 to 49 Years | 118 (5.6%) | 0 (0.0%) |
| 50 to 54 Years | 145 (6.9%) | 51 (3.4%) |
| 55 to 59 Years | 112 (5.3%) | 200 (13.1%) |
| 60 to 64 Years | 143 (6.8%) | 94 (6.2%) |
| 65 to 69 Years | 130 (6.1%) | 54 (3.5%) |
| 70 to 74 Years | 127 (6.0%) | 108 (7.1%) |
| 75 to 79 Years | 6 (0.3%) | 32 (2.1%) |
| 80 to 84 Years | 20 (0.9%) | 25 (1.6%) |
| 85 Years and over | 27 (1.3%) | 31 (2.0%) |
| Total | 2,115 (100.0%) | 1,523 (100.0%) |
Families and Households in Franklinton
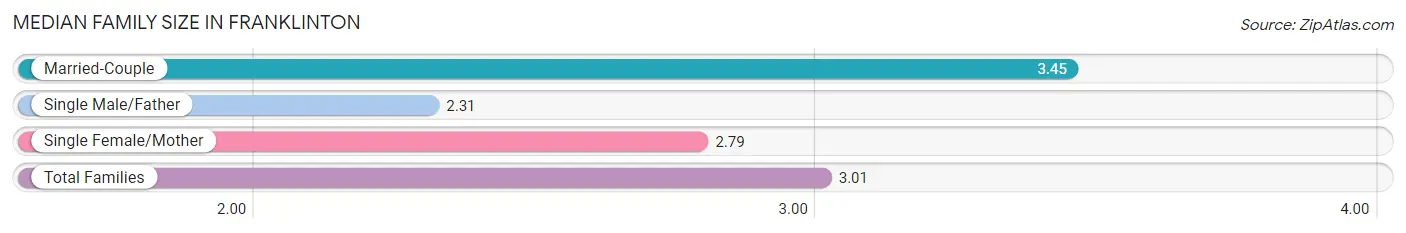
Median Family Size in Franklinton
The median family size in Franklinton is 3.01 persons per family, with married-couple families (414 | 43.8%) accounting for the largest median family size of 3.45 persons per family. On the other hand, single male/father families (135 | 14.3%) represent the smallest median family size with 2.31 persons per family.
| Family Type | # Families | Family Size |
| Married-Couple | 414 (43.8%) | 3.45 |
| Single Male/Father | 135 (14.3%) | 2.31 |
| Single Female/Mother | 397 (42.0%) | 2.79 |
| Total Families | 946 (100.0%) | 3.01 |
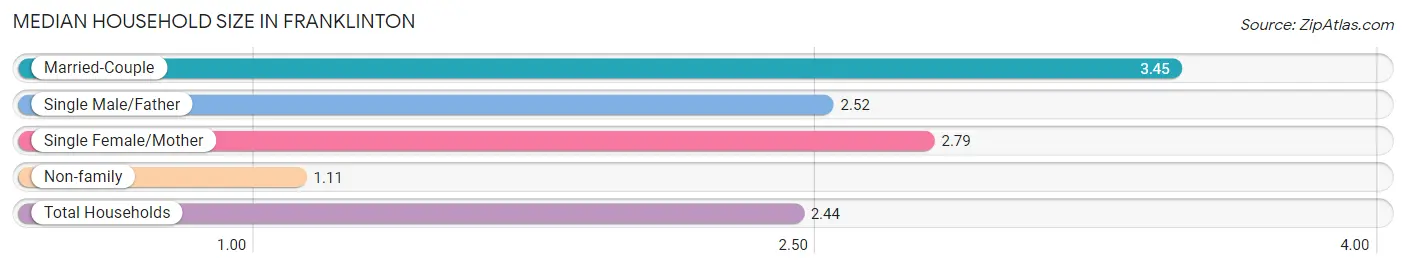
Median Household Size in Franklinton
The median household size in Franklinton is 2.44 persons per household, with married-couple households (414 | 30.1%) accounting for the largest median household size of 3.45 persons per household. non-family households (427 | 31.1%) represent the smallest median household size with 1.11 persons per household.
| Household Type | # Households | Household Size |
| Married-Couple | 414 (30.1%) | 3.45 |
| Single Male/Father | 135 (9.8%) | 2.52 |
| Single Female/Mother | 397 (28.9%) | 2.79 |
| Non-family | 427 (31.1%) | 1.11 |
| Total Households | 1,373 (100.0%) | 2.44 |
Household Size by Marriage Status in Franklinton
Out of a total of 1,373 households in Franklinton, 946 (68.9%) are family households, while 427 (31.1%) are nonfamily households. The most numerous type of family households are 2-person households, comprising 525, and the most common type of nonfamily households are 1-person households, comprising 387.
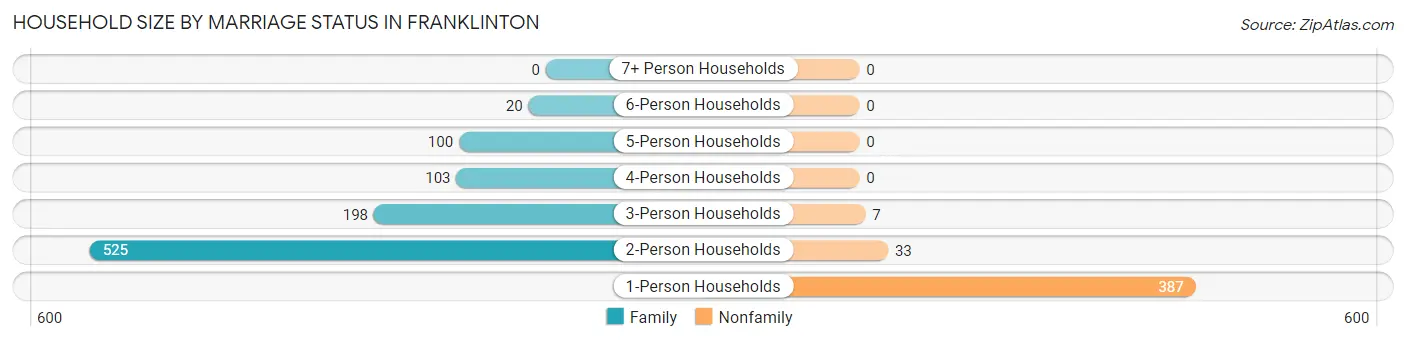
| Household Size | Family Households | Nonfamily Households |
| 1-Person Households | - | 387 (28.2%) |
| 2-Person Households | 525 (38.2%) | 33 (2.4%) |
| 3-Person Households | 198 (14.4%) | 7 (0.5%) |
| 4-Person Households | 103 (7.5%) | 0 (0.0%) |
| 5-Person Households | 100 (7.3%) | 0 (0.0%) |
| 6-Person Households | 20 (1.5%) | 0 (0.0%) |
| 7+ Person Households | 0 (0.0%) | 0 (0.0%) |
| Total | 946 (68.9%) | 427 (31.1%) |
Female Fertility in Franklinton
Fertility by Age in Franklinton
| Age Bracket | Women with Births | Births / 1,000 Women |
| 15 to 19 years | 0 (0.0%) | 0.0 |
| 20 to 34 years | 0 (0.0%) | 0.0 |
| 35 to 50 years | 0 (0.0%) | 0.0 |
| Total | 0 (0.0%) | 0.0 |
Fertility by Age by Marriage Status in Franklinton
| Age Bracket | Married | Unmarried |
| 15 to 19 years | 0 (0.0%) | 0 (0.0%) |
| 20 to 34 years | 0 (0.0%) | 0 (0.0%) |
| 35 to 50 years | 0 (0.0%) | 0 (0.0%) |
| Total | 0 (0.0%) | 0 (0.0%) |
Fertility by Education in Franklinton
| Educational Attainment | Women with Births | Births / 1,000 Women |
| Less than High School | 0 (0.0%) | 0.0 |
| High School Diploma | 0 (0.0%) | 0.0 |
| College or Associate's Degree | 0 (0.0%) | 0.0 |
| Bachelor's Degree | 0 (0.0%) | 0.0 |
| Graduate Degree | 0 (0.0%) | 0.0 |
| Total | 0 (0.0%) | 0.0 |
Fertility by Education by Marriage Status in Franklinton
| Educational Attainment | Married | Unmarried |
| Less than High School | 0 (0.0%) | 0 (0.0%) |
| High School Diploma | 0 (0.0%) | 0 (0.0%) |
| College or Associate's Degree | 0 (0.0%) | 0 (0.0%) |
| Bachelor's Degree | 0 (0.0%) | 0 (0.0%) |
| Graduate Degree | 0 (0.0%) | 0 (0.0%) |
| Total | 0 (0.0%) | 0 (0.0%) |
Employment Characteristics in Franklinton
Employment by Class of Employer in Franklinton
Among the 1,581 employed individuals in Franklinton, private company employees (1,095 | 69.3%), local government employees (272 | 17.2%), and self-employed (not incorporated) (95 | 6.0%) make up the most common classes of employment.
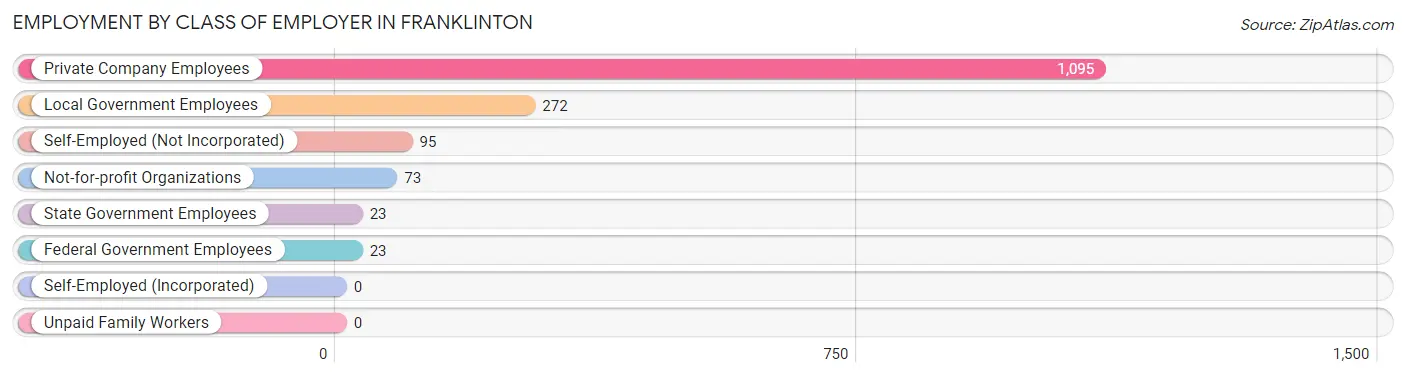
| Employer Class | # Employees | % Employees |
| Private Company Employees | 1,095 | 69.3% |
| Self-Employed (Incorporated) | 0 | 0.0% |
| Self-Employed (Not Incorporated) | 95 | 6.0% |
| Not-for-profit Organizations | 73 | 4.6% |
| Local Government Employees | 272 | 17.2% |
| State Government Employees | 23 | 1.5% |
| Federal Government Employees | 23 | 1.5% |
| Unpaid Family Workers | 0 | 0.0% |
| Total | 1,581 | 100.0% |
Employment Status by Age in Franklinton
According to the labor force statistics for Franklinton, out of the total population over 16 years of age (2,871), 57.5% or 1,651 individuals are in the labor force, with 4.2% or 69 of them unemployed. The age group with the highest labor force participation rate is 25 to 29 years, with 89.3% or 108 individuals in the labor force. Within the labor force, the 16 to 19 years age range has the highest percentage of unemployed individuals, with 12.9% or 18 of them being unemployed.
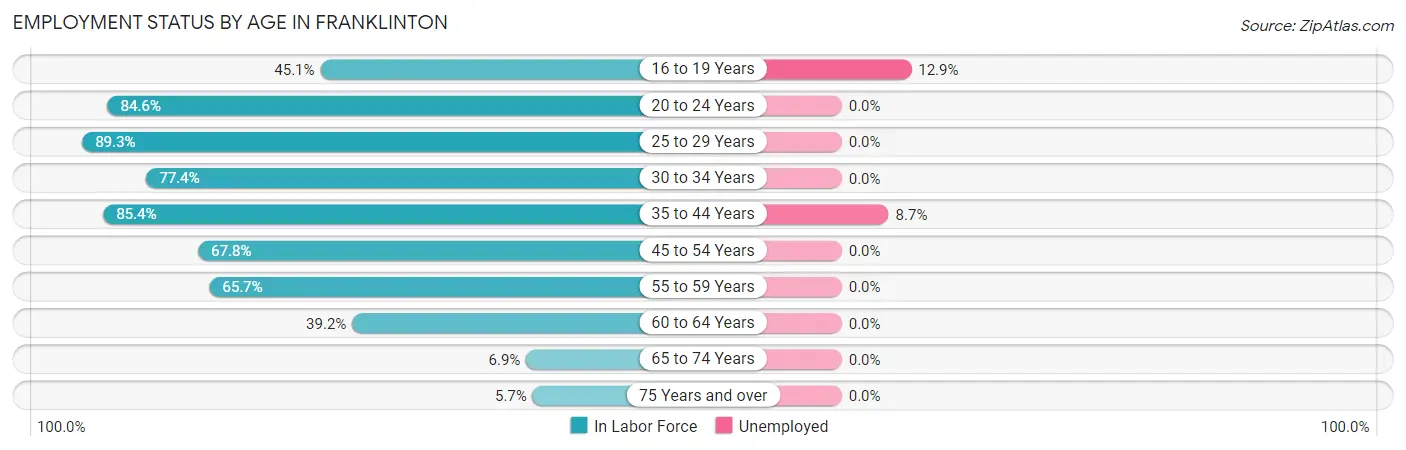
| Age Bracket | In Labor Force | Unemployed |
| 16 to 19 Years | 139 (45.1%) | 18 (12.9%) |
| 20 to 24 Years | 132 (84.6%) | 0 (0.0%) |
| 25 to 29 Years | 108 (89.3%) | 0 (0.0%) |
| 30 to 34 Years | 123 (77.4%) | 0 (0.0%) |
| 35 to 44 Years | 601 (85.4%) | 52 (8.7%) |
| 45 to 54 Years | 213 (67.8%) | 0 (0.0%) |
| 55 to 59 Years | 205 (65.7%) | 0 (0.0%) |
| 60 to 64 Years | 93 (39.2%) | 0 (0.0%) |
| 65 to 74 Years | 29 (6.9%) | 0 (0.0%) |
| 75 Years and over | 8 (5.7%) | 0 (0.0%) |
| Total | 1,651 (57.5%) | 69 (4.2%) |
Employment Status by Educational Attainment in Franklinton
According to labor force statistics for Franklinton, 72.7% of individuals (1,343) out of the total population between 25 and 64 years of age (1,847) are in the labor force, with 3.9% or 52 of them being unemployed. The group with the highest labor force participation rate are those with the educational attainment of college / associate degree, with 89.6% or 446 individuals in the labor force. Within the labor force, individuals with college / associate degree education have the highest percentage of unemployment, with 9.4% or 42 of them being unemployed.
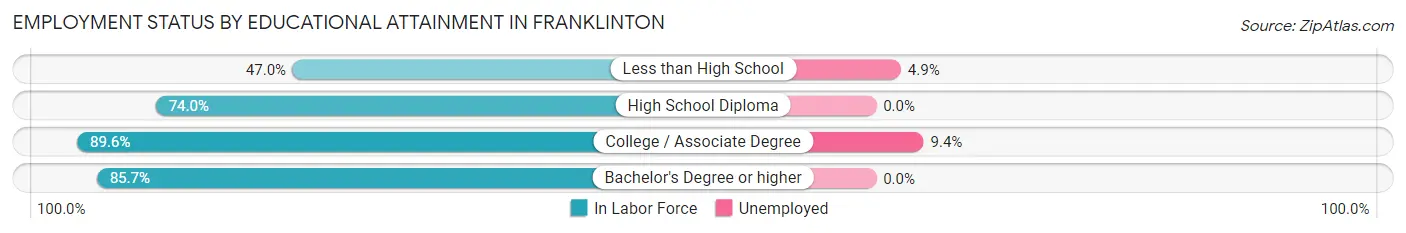
| Educational Attainment | In Labor Force | Unemployed |
| Less than High School | 203 (47.0%) | 21 (4.9%) |
| High School Diploma | 580 (74.0%) | 0 (0.0%) |
| College / Associate Degree | 446 (89.6%) | 47 (9.4%) |
| Bachelor's Degree or higher | 114 (85.7%) | 0 (0.0%) |
| Total | 1,343 (72.7%) | 72 (3.9%) |
Employment Occupations by Sex in Franklinton
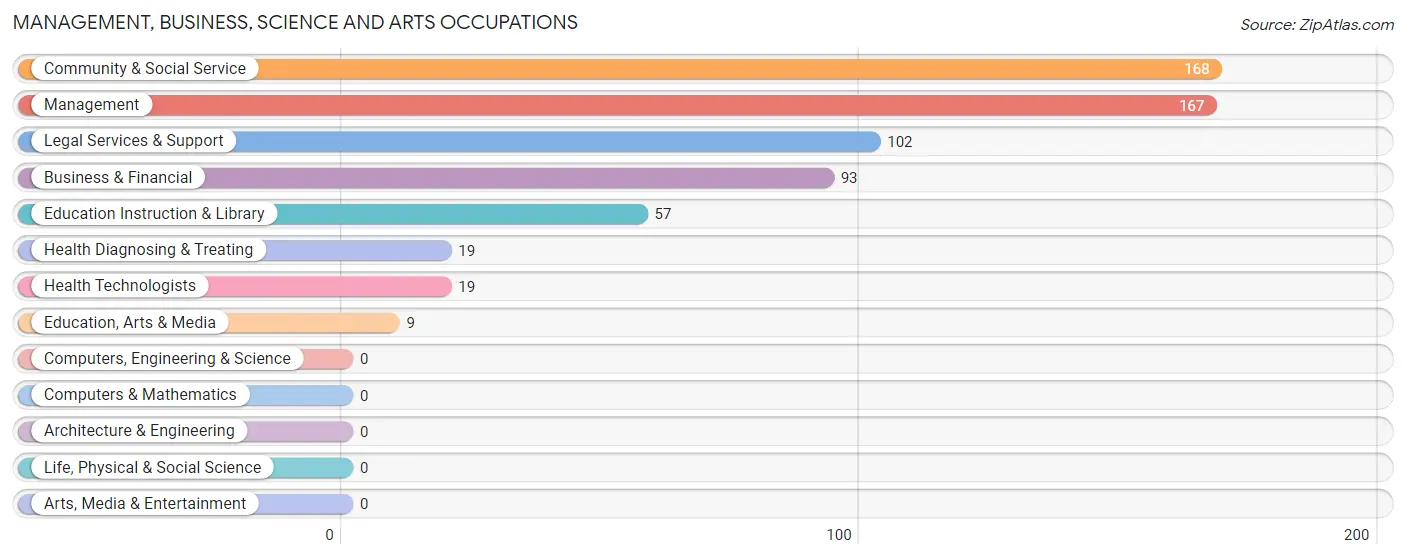
Management, Business, Science and Arts Occupations
The most common Management, Business, Science and Arts occupations in Franklinton are Community & Social Service (168 | 10.6%), Management (167 | 10.6%), Legal Services & Support (102 | 6.5%), Business & Financial (93 | 5.9%), and Education Instruction & Library (57 | 3.6%).
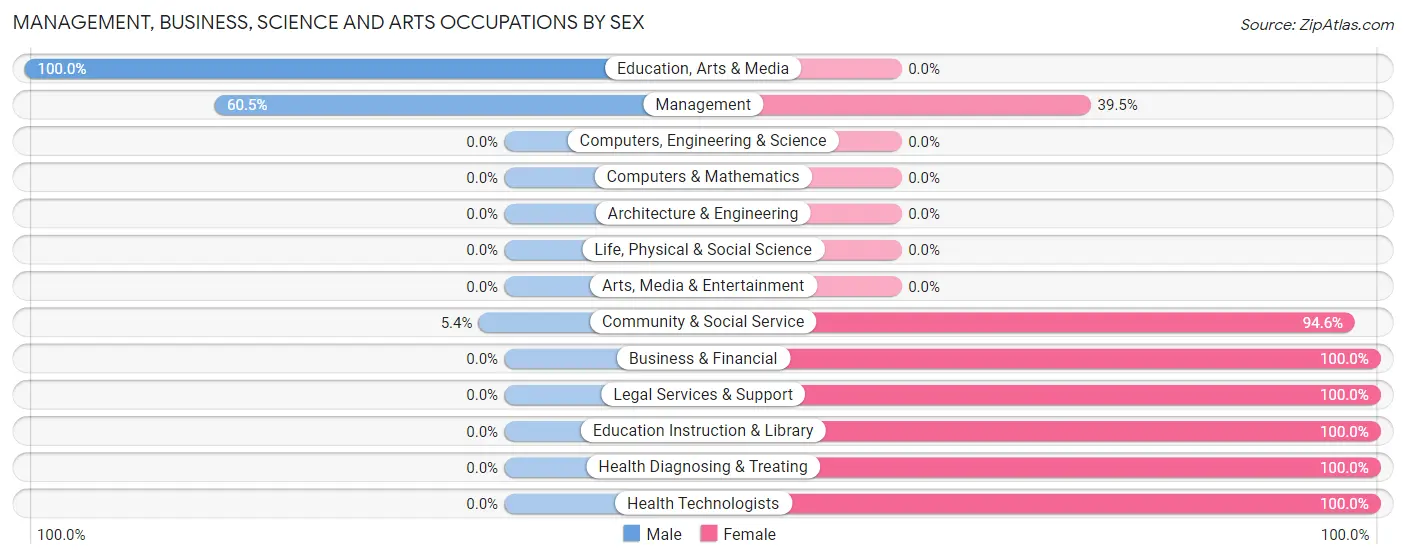
Management, Business, Science and Arts Occupations by Sex
Within the Management, Business, Science and Arts occupations in Franklinton, the most male-oriented occupations are Education, Arts & Media (100.0%), Management (60.5%), and Community & Social Service (5.4%), while the most female-oriented occupations are Business & Financial (100.0%), Legal Services & Support (100.0%), and Education Instruction & Library (100.0%).
| Occupation | Male | Female |
| Management | 101 (60.5%) | 66 (39.5%) |
| Business & Financial | 0 (0.0%) | 93 (100.0%) |
| Computers, Engineering & Science | 0 (0.0%) | 0 (0.0%) |
| Computers & Mathematics | 0 (0.0%) | 0 (0.0%) |
| Architecture & Engineering | 0 (0.0%) | 0 (0.0%) |
| Life, Physical & Social Science | 0 (0.0%) | 0 (0.0%) |
| Community & Social Service | 9 (5.4%) | 159 (94.6%) |
| Education, Arts & Media | 9 (100.0%) | 0 (0.0%) |
| Legal Services & Support | 0 (0.0%) | 102 (100.0%) |
| Education Instruction & Library | 0 (0.0%) | 57 (100.0%) |
| Arts, Media & Entertainment | 0 (0.0%) | 0 (0.0%) |
| Health Diagnosing & Treating | 0 (0.0%) | 19 (100.0%) |
| Health Technologists | 0 (0.0%) | 19 (100.0%) |
| Total (Category) | 110 (24.6%) | 337 (75.4%) |
| Total (Overall) | 729 (46.1%) | 852 (53.9%) |
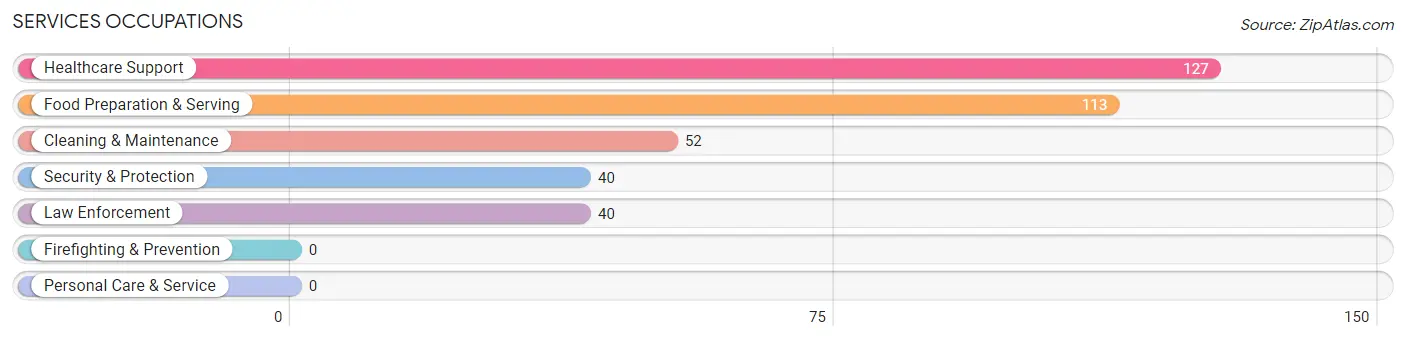
Services Occupations
The most common Services occupations in Franklinton are Healthcare Support (127 | 8.0%), Food Preparation & Serving (113 | 7.1%), Cleaning & Maintenance (52 | 3.3%), Security & Protection (40 | 2.5%), and Law Enforcement (40 | 2.5%).
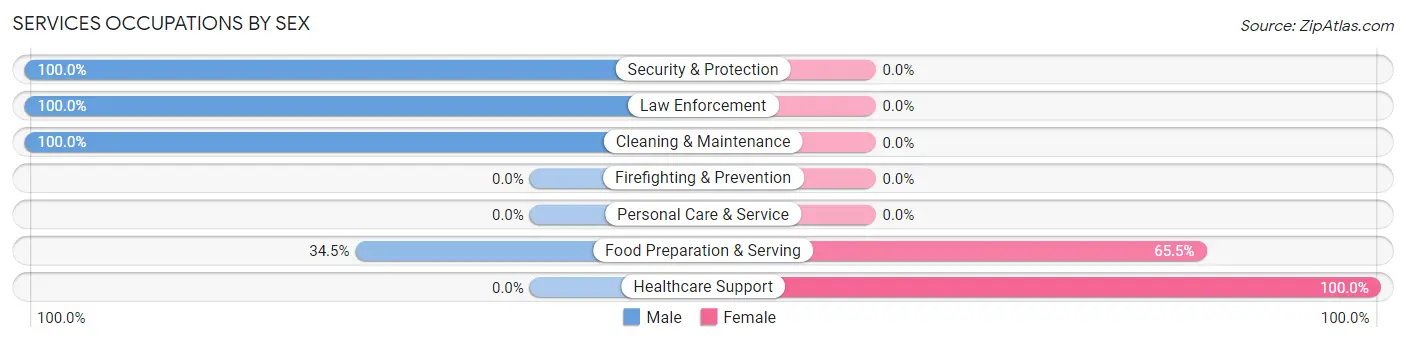
Services Occupations by Sex
Within the Services occupations in Franklinton, the most male-oriented occupations are Security & Protection (100.0%), Law Enforcement (100.0%), and Cleaning & Maintenance (100.0%), while the most female-oriented occupations are Healthcare Support (100.0%), and Food Preparation & Serving (65.5%).
| Occupation | Male | Female |
| Healthcare Support | 0 (0.0%) | 127 (100.0%) |
| Security & Protection | 40 (100.0%) | 0 (0.0%) |
| Firefighting & Prevention | 0 (0.0%) | 0 (0.0%) |
| Law Enforcement | 40 (100.0%) | 0 (0.0%) |
| Food Preparation & Serving | 39 (34.5%) | 74 (65.5%) |
| Cleaning & Maintenance | 52 (100.0%) | 0 (0.0%) |
| Personal Care & Service | 0 (0.0%) | 0 (0.0%) |
| Total (Category) | 131 (39.5%) | 201 (60.5%) |
| Total (Overall) | 729 (46.1%) | 852 (53.9%) |
Sales and Office Occupations
The most common Sales and Office occupations in Franklinton are Office & Administration (177 | 11.2%), and Sales & Related (124 | 7.8%).
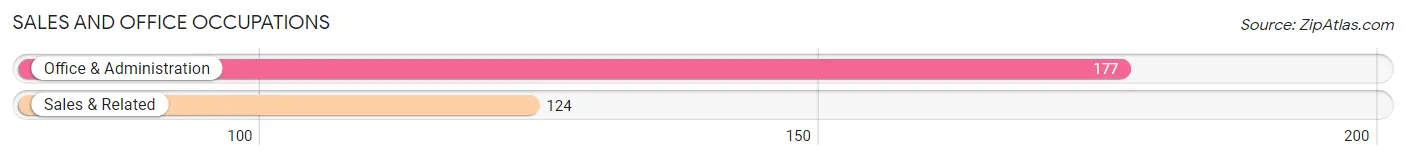
Sales and Office Occupations by Sex
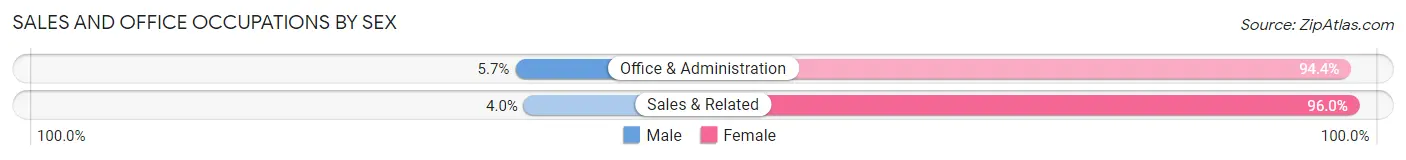
| Occupation | Male | Female |
| Sales & Related | 5 (4.0%) | 119 (96.0%) |
| Office & Administration | 10 (5.7%) | 167 (94.4%) |
| Total (Category) | 15 (5.0%) | 286 (95.0%) |
| Total (Overall) | 729 (46.1%) | 852 (53.9%) |
Natural Resources, Construction and Maintenance Occupations
The most common Natural Resources, Construction and Maintenance occupations in Franklinton are , and Construction & Extraction (185 | 11.7%).
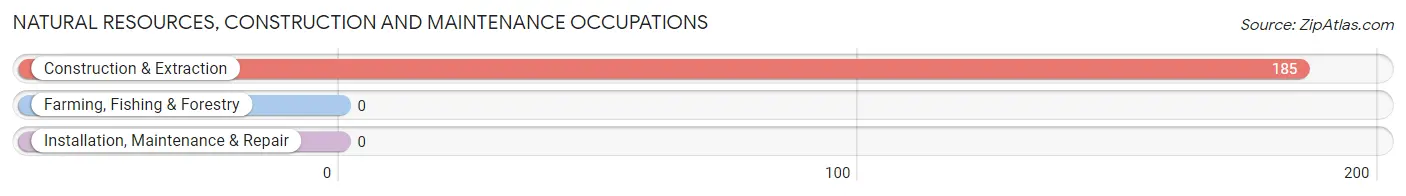
Natural Resources, Construction and Maintenance Occupations by Sex
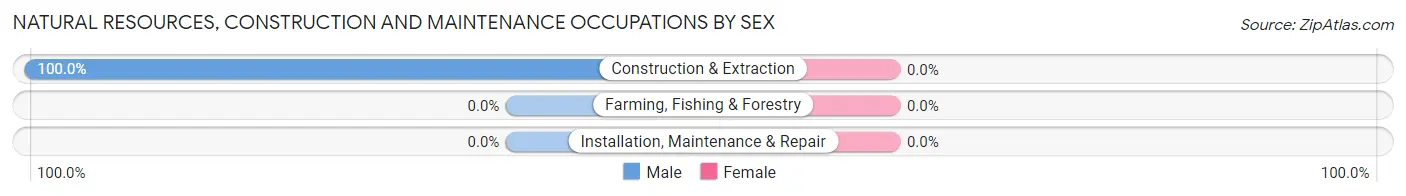
| Occupation | Male | Female |
| Farming, Fishing & Forestry | 0 (0.0%) | 0 (0.0%) |
| Construction & Extraction | 185 (100.0%) | 0 (0.0%) |
| Installation, Maintenance & Repair | 0 (0.0%) | 0 (0.0%) |
| Total (Category) | 185 (100.0%) | 0 (0.0%) |
| Total (Overall) | 729 (46.1%) | 852 (53.9%) |
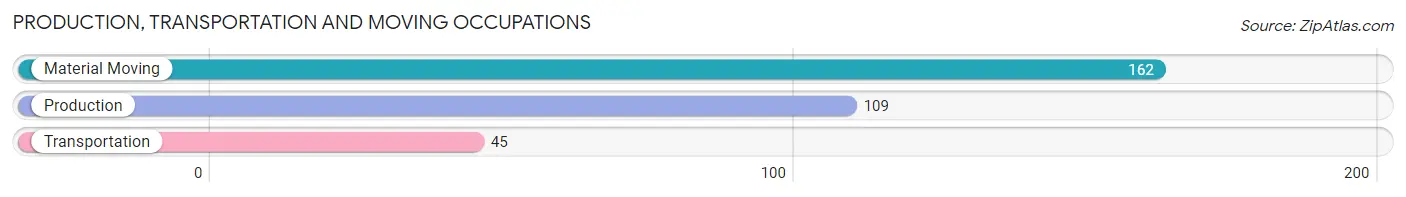
Production, Transportation and Moving Occupations
The most common Production, Transportation and Moving occupations in Franklinton are Material Moving (162 | 10.2%), Production (109 | 6.9%), and Transportation (45 | 2.9%).
Production, Transportation and Moving Occupations by Sex
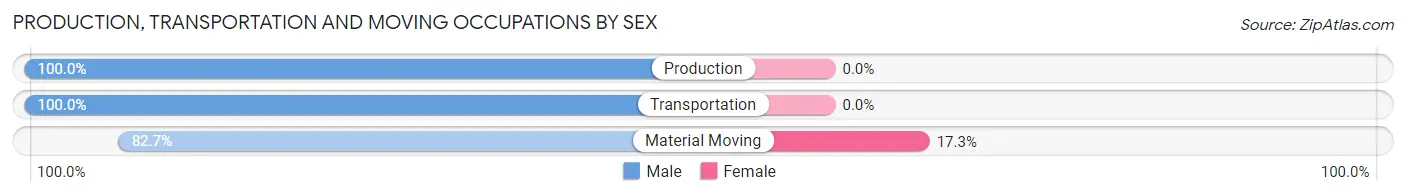
| Occupation | Male | Female |
| Production | 109 (100.0%) | 0 (0.0%) |
| Transportation | 45 (100.0%) | 0 (0.0%) |
| Material Moving | 134 (82.7%) | 28 (17.3%) |
| Total (Category) | 288 (91.1%) | 28 (8.9%) |
| Total (Overall) | 729 (46.1%) | 852 (53.9%) |
Employment Industries by Sex in Franklinton
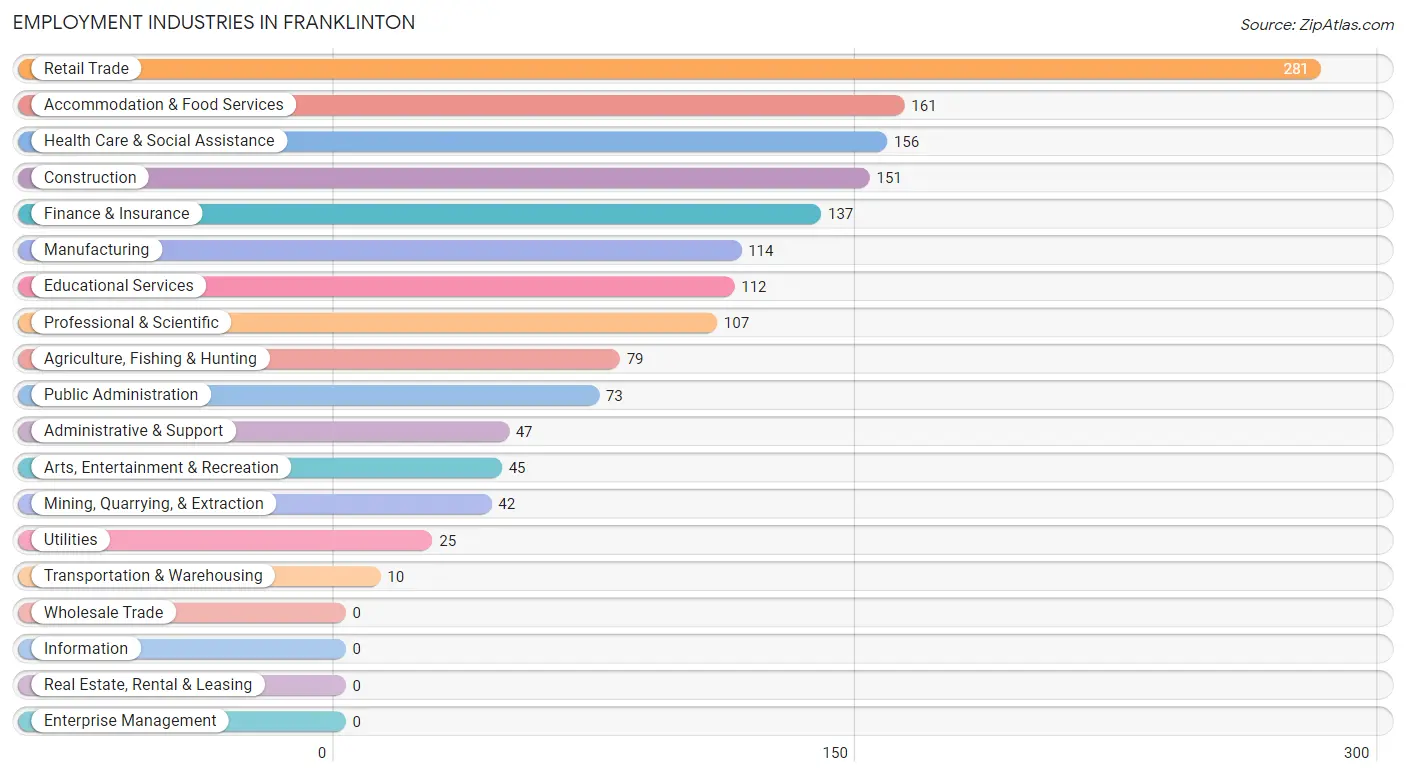
Employment Industries in Franklinton
The major employment industries in Franklinton include Retail Trade (281 | 17.8%), Accommodation & Food Services (161 | 10.2%), Health Care & Social Assistance (156 | 9.9%), Construction (151 | 9.6%), and Finance & Insurance (137 | 8.7%).
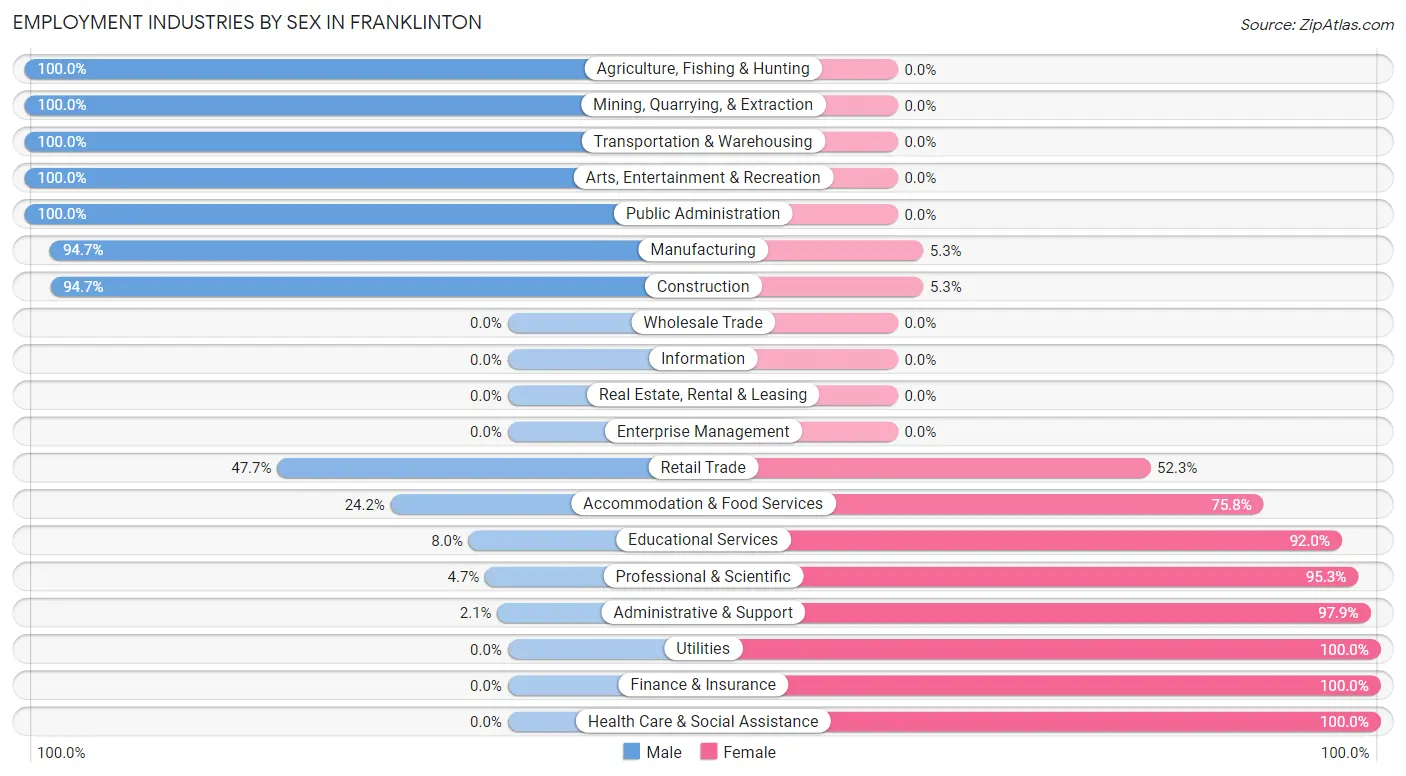
Employment Industries by Sex in Franklinton
The Franklinton industries that see more men than women are Agriculture, Fishing & Hunting (100.0%), Mining, Quarrying, & Extraction (100.0%), and Transportation & Warehousing (100.0%), whereas the industries that tend to have a higher number of women are Utilities (100.0%), Finance & Insurance (100.0%), and Health Care & Social Assistance (100.0%).
| Industry | Male | Female |
| Agriculture, Fishing & Hunting | 79 (100.0%) | 0 (0.0%) |
| Mining, Quarrying, & Extraction | 42 (100.0%) | 0 (0.0%) |
| Construction | 143 (94.7%) | 8 (5.3%) |
| Manufacturing | 108 (94.7%) | 6 (5.3%) |
| Wholesale Trade | 0 (0.0%) | 0 (0.0%) |
| Retail Trade | 134 (47.7%) | 147 (52.3%) |
| Transportation & Warehousing | 10 (100.0%) | 0 (0.0%) |
| Utilities | 0 (0.0%) | 25 (100.0%) |
| Information | 0 (0.0%) | 0 (0.0%) |
| Finance & Insurance | 0 (0.0%) | 137 (100.0%) |
| Real Estate, Rental & Leasing | 0 (0.0%) | 0 (0.0%) |
| Professional & Scientific | 5 (4.7%) | 102 (95.3%) |
| Enterprise Management | 0 (0.0%) | 0 (0.0%) |
| Administrative & Support | 1 (2.1%) | 46 (97.9%) |
| Educational Services | 9 (8.0%) | 103 (92.0%) |
| Health Care & Social Assistance | 0 (0.0%) | 156 (100.0%) |
| Arts, Entertainment & Recreation | 45 (100.0%) | 0 (0.0%) |
| Accommodation & Food Services | 39 (24.2%) | 122 (75.8%) |
| Public Administration | 73 (100.0%) | 0 (0.0%) |
| Total | 729 (46.1%) | 852 (53.9%) |
Education in Franklinton
School Enrollment in Franklinton
The most common levels of schooling among the 822 students in Franklinton are high school (324 | 39.4%), middle school (322 | 39.2%), and elementary school (70 | 8.5%).
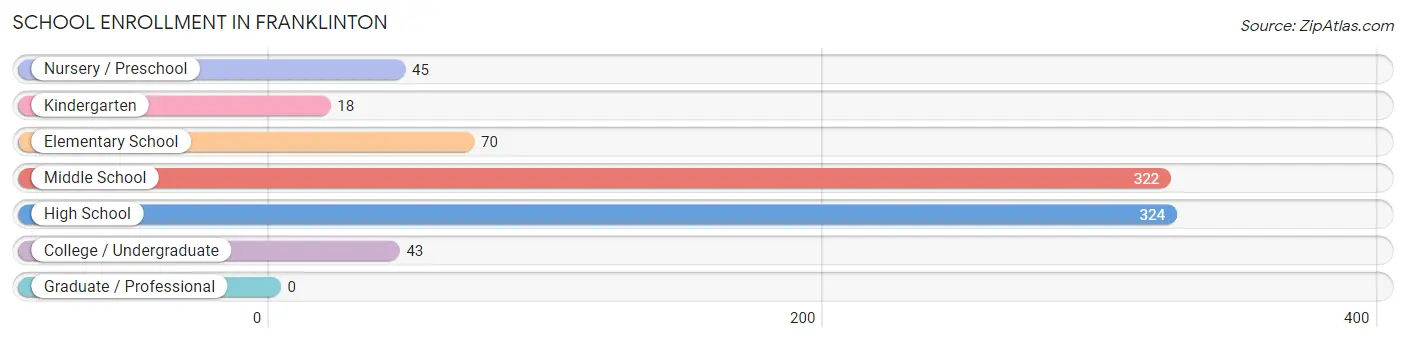
| School Level | # Students | % Students |
| Nursery / Preschool | 45 | 5.5% |
| Kindergarten | 18 | 2.2% |
| Elementary School | 70 | 8.5% |
| Middle School | 322 | 39.2% |
| High School | 324 | 39.4% |
| College / Undergraduate | 43 | 5.2% |
| Graduate / Professional | 0 | 0.0% |
| Total | 822 | 100.0% |
School Enrollment by Age by Funding Source in Franklinton
Out of a total of 822 students who are enrolled in schools in Franklinton, 29 (3.5%) attend a private institution, while the remaining 793 (96.5%) are enrolled in public schools. The age group of 5 to 9 year old has the highest likelihood of being enrolled in private schools, with 18 (29.5% in the age bracket) enrolled. Conversely, the age group of 10 to 14 year olds has the lowest likelihood of being enrolled in a private school, with 434 (100.0% in the age bracket) attending a public institution.
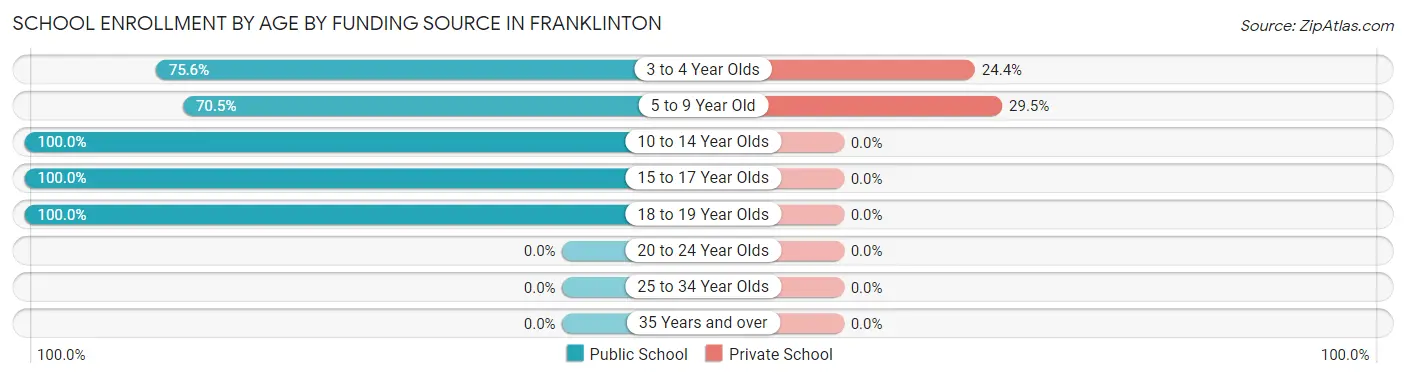
| Age Bracket | Public School | Private School |
| 3 to 4 Year Olds | 34 (75.6%) | 11 (24.4%) |
| 5 to 9 Year Old | 43 (70.5%) | 18 (29.5%) |
| 10 to 14 Year Olds | 434 (100.0%) | 0 (0.0%) |
| 15 to 17 Year Olds | 208 (100.0%) | 0 (0.0%) |
| 18 to 19 Year Olds | 74 (100.0%) | 0 (0.0%) |
| 20 to 24 Year Olds | 0 (0.0%) | 0 (0.0%) |
| 25 to 34 Year Olds | 0 (0.0%) | 0 (0.0%) |
| 35 Years and over | 0 (0.0%) | 0 (0.0%) |
| Total | 793 (96.5%) | 29 (3.5%) |
Educational Attainment by Field of Study in Franklinton
Business (74 | 39.6%), communications (40 | 21.4%), science & technology (28 | 15.0%), arts & humanities (19 | 10.2%), and education (14 | 7.5%) are the most common fields of study among 187 individuals in Franklinton who have obtained a bachelor's degree or higher.
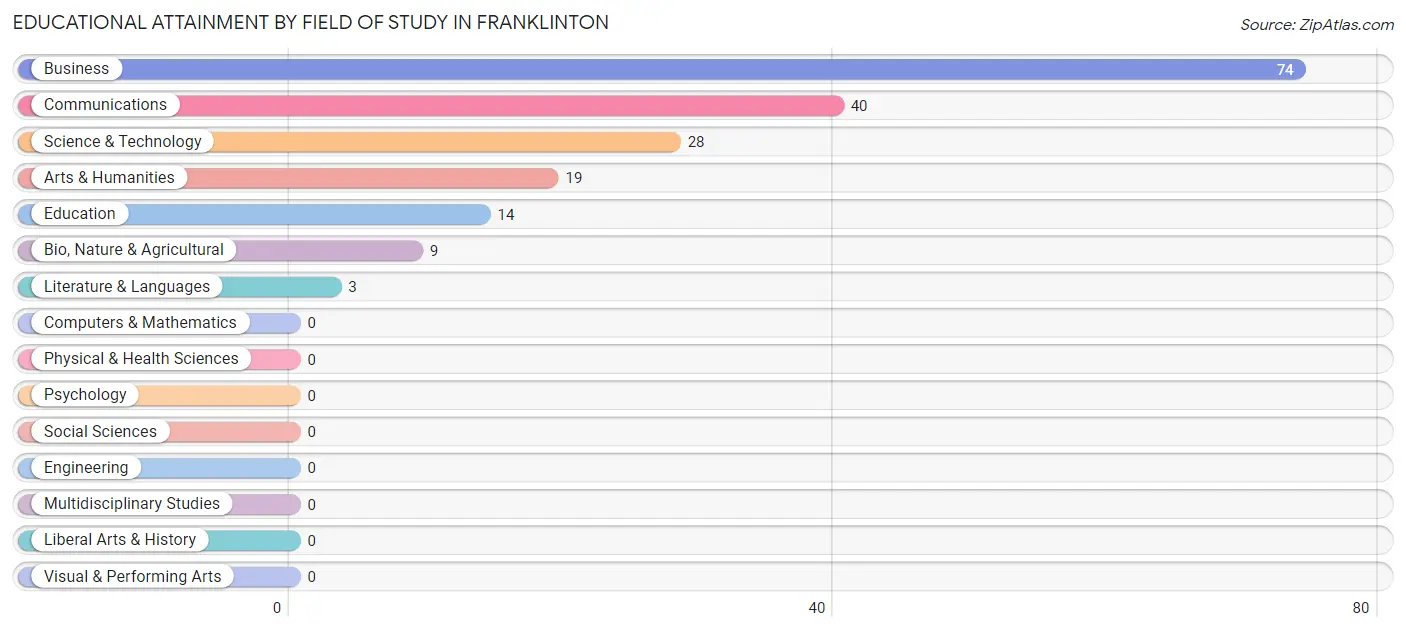
| Field of Study | # Graduates | % Graduates |
| Computers & Mathematics | 0 | 0.0% |
| Bio, Nature & Agricultural | 9 | 4.8% |
| Physical & Health Sciences | 0 | 0.0% |
| Psychology | 0 | 0.0% |
| Social Sciences | 0 | 0.0% |
| Engineering | 0 | 0.0% |
| Multidisciplinary Studies | 0 | 0.0% |
| Science & Technology | 28 | 15.0% |
| Business | 74 | 39.6% |
| Education | 14 | 7.5% |
| Literature & Languages | 3 | 1.6% |
| Liberal Arts & History | 0 | 0.0% |
| Visual & Performing Arts | 0 | 0.0% |
| Communications | 40 | 21.4% |
| Arts & Humanities | 19 | 10.2% |
| Total | 187 | 100.0% |
Transportation & Commute in Franklinton
Vehicle Availability by Sex in Franklinton
The most prevalent vehicle ownership categories in Franklinton are males with 2 vehicles (210, accounting for 28.8%) and females with 2 vehicles (299, making up 24.6%).
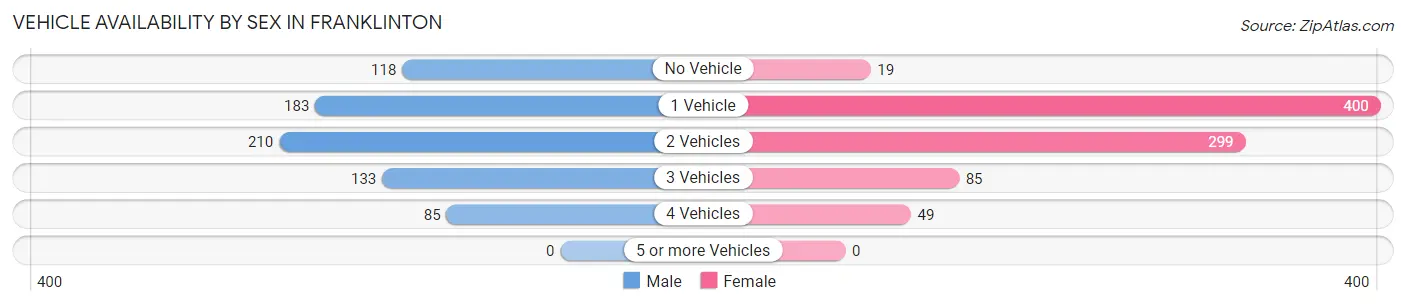
| Vehicles Available | Male | Female |
| No Vehicle | 118 (16.2%) | 19 (2.2%) |
| 1 Vehicle | 183 (25.1%) | 400 (46.9%) |
| 2 Vehicles | 210 (28.8%) | 299 (35.1%) |
| 3 Vehicles | 133 (18.2%) | 85 (10.0%) |
| 4 Vehicles | 85 (11.7%) | 49 (5.8%) |
| 5 or more Vehicles | 0 (0.0%) | 0 (0.0%) |
| Total | 729 (100.0%) | 852 (100.0%) |
Commute Time in Franklinton
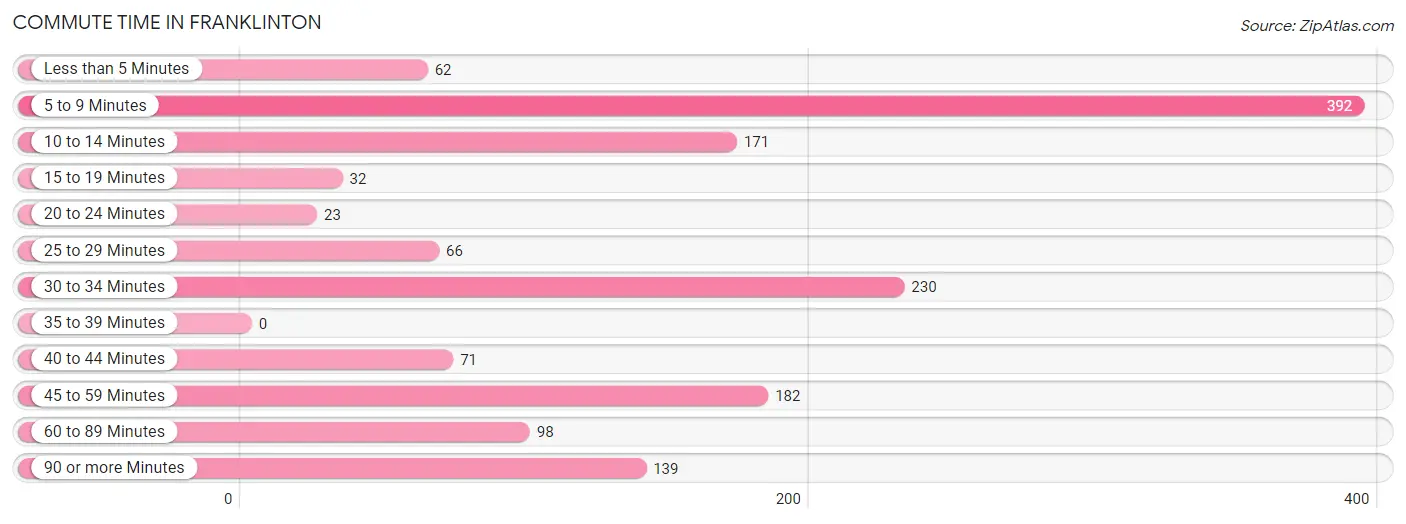
The most frequently occuring commute durations in Franklinton are 5 to 9 minutes (392 commuters, 26.7%), 30 to 34 minutes (230 commuters, 15.7%), and 45 to 59 minutes (182 commuters, 12.4%).
| Commute Time | # Commuters | % Commuters |
| Less than 5 Minutes | 62 | 4.2% |
| 5 to 9 Minutes | 392 | 26.7% |
| 10 to 14 Minutes | 171 | 11.7% |
| 15 to 19 Minutes | 32 | 2.2% |
| 20 to 24 Minutes | 23 | 1.6% |
| 25 to 29 Minutes | 66 | 4.5% |
| 30 to 34 Minutes | 230 | 15.7% |
| 35 to 39 Minutes | 0 | 0.0% |
| 40 to 44 Minutes | 71 | 4.8% |
| 45 to 59 Minutes | 182 | 12.4% |
| 60 to 89 Minutes | 98 | 6.7% |
| 90 or more Minutes | 139 | 9.5% |
Commute Time by Sex in Franklinton
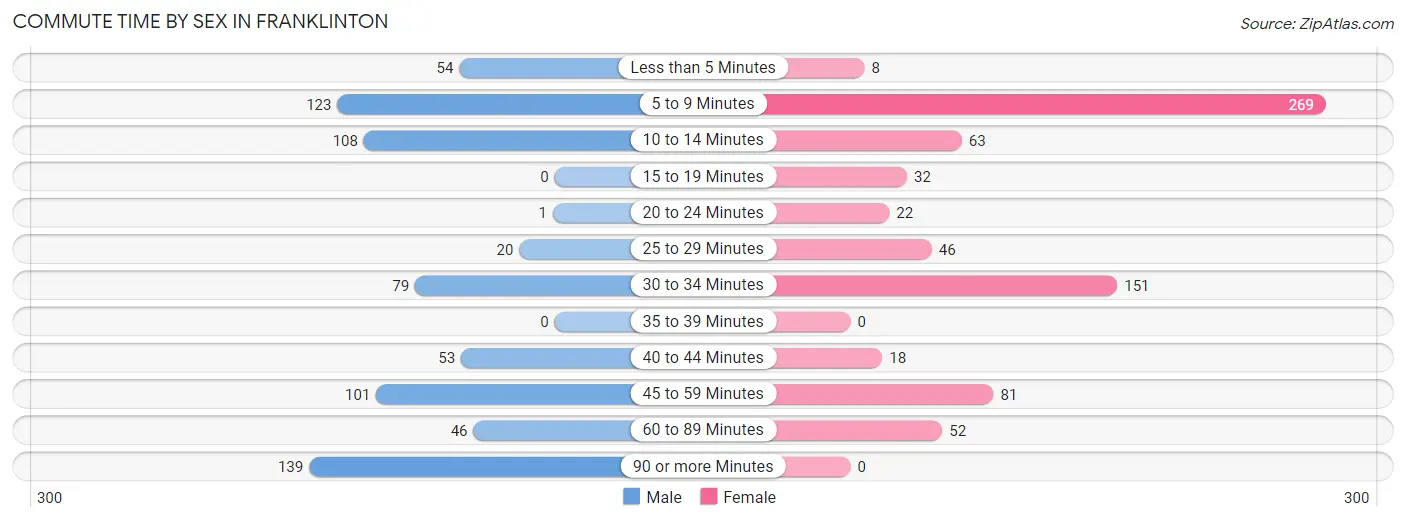
The most common commute times in Franklinton are 90 or more minutes (139 commuters, 19.2%) for males and 5 to 9 minutes (269 commuters, 36.2%) for females.
| Commute Time | Male | Female |
| Less than 5 Minutes | 54 (7.5%) | 8 (1.1%) |
| 5 to 9 Minutes | 123 (17.0%) | 269 (36.2%) |
| 10 to 14 Minutes | 108 (14.9%) | 63 (8.5%) |
| 15 to 19 Minutes | 0 (0.0%) | 32 (4.3%) |
| 20 to 24 Minutes | 1 (0.1%) | 22 (3.0%) |
| 25 to 29 Minutes | 20 (2.8%) | 46 (6.2%) |
| 30 to 34 Minutes | 79 (10.9%) | 151 (20.3%) |
| 35 to 39 Minutes | 0 (0.0%) | 0 (0.0%) |
| 40 to 44 Minutes | 53 (7.3%) | 18 (2.4%) |
| 45 to 59 Minutes | 101 (14.0%) | 81 (10.9%) |
| 60 to 89 Minutes | 46 (6.4%) | 52 (7.0%) |
| 90 or more Minutes | 139 (19.2%) | 0 (0.0%) |
Time of Departure to Work by Sex in Franklinton
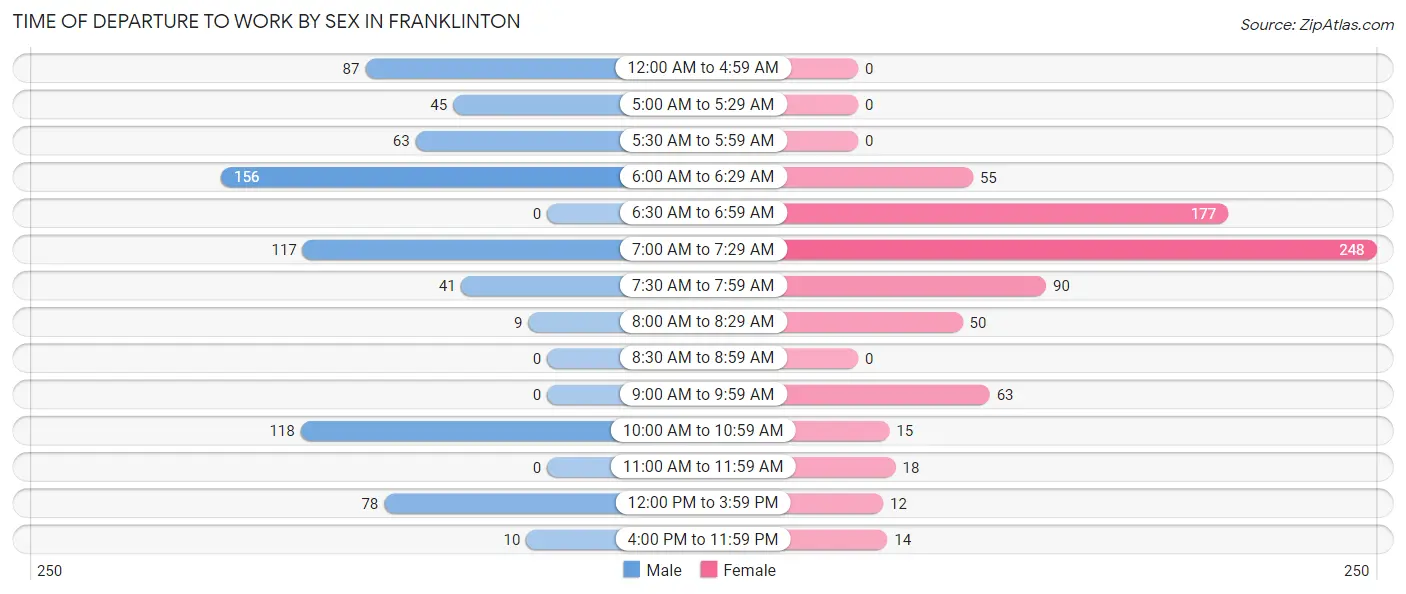
The most frequent times of departure to work in Franklinton are 6:00 AM to 6:29 AM (156, 21.5%) for males and 7:00 AM to 7:29 AM (248, 33.4%) for females.
| Time of Departure | Male | Female |
| 12:00 AM to 4:59 AM | 87 (12.0%) | 0 (0.0%) |
| 5:00 AM to 5:29 AM | 45 (6.2%) | 0 (0.0%) |
| 5:30 AM to 5:59 AM | 63 (8.7%) | 0 (0.0%) |
| 6:00 AM to 6:29 AM | 156 (21.5%) | 55 (7.4%) |
| 6:30 AM to 6:59 AM | 0 (0.0%) | 177 (23.8%) |
| 7:00 AM to 7:29 AM | 117 (16.2%) | 248 (33.4%) |
| 7:30 AM to 7:59 AM | 41 (5.7%) | 90 (12.1%) |
| 8:00 AM to 8:29 AM | 9 (1.2%) | 50 (6.7%) |
| 8:30 AM to 8:59 AM | 0 (0.0%) | 0 (0.0%) |
| 9:00 AM to 9:59 AM | 0 (0.0%) | 63 (8.5%) |
| 10:00 AM to 10:59 AM | 118 (16.3%) | 15 (2.0%) |
| 11:00 AM to 11:59 AM | 0 (0.0%) | 18 (2.4%) |
| 12:00 PM to 3:59 PM | 78 (10.8%) | 12 (1.6%) |
| 4:00 PM to 11:59 PM | 10 (1.4%) | 14 (1.9%) |
| Total | 724 (100.0%) | 742 (100.0%) |
Housing Occupancy in Franklinton
Occupancy by Ownership in Franklinton
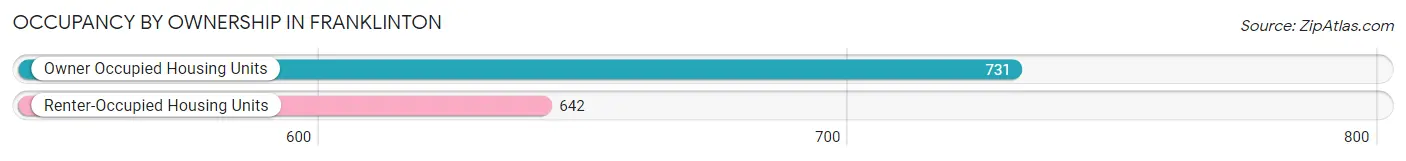
Of the total 1,373 dwellings in Franklinton, owner-occupied units account for 731 (53.2%), while renter-occupied units make up 642 (46.8%).
| Occupancy | # Housing Units | % Housing Units |
| Owner Occupied Housing Units | 731 | 53.2% |
| Renter-Occupied Housing Units | 642 | 46.8% |
| Total Occupied Housing Units | 1,373 | 100.0% |
Occupancy by Household Size in Franklinton
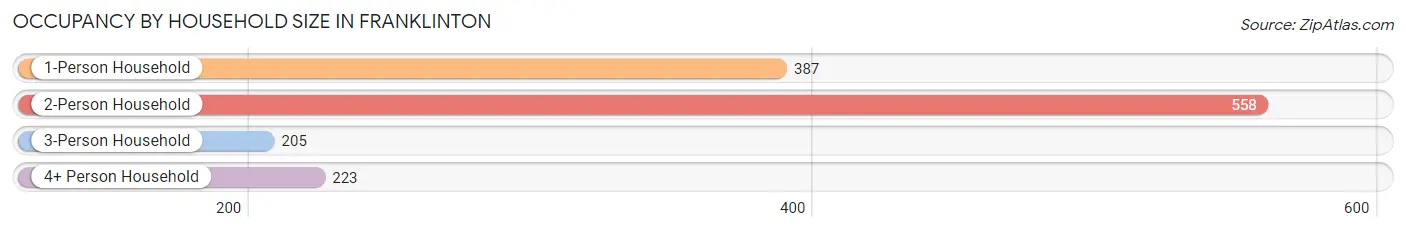
| Household Size | # Housing Units | % Housing Units |
| 1-Person Household | 387 | 28.2% |
| 2-Person Household | 558 | 40.6% |
| 3-Person Household | 205 | 14.9% |
| 4+ Person Household | 223 | 16.2% |
| Total Housing Units | 1,373 | 100.0% |
Occupancy by Ownership by Household Size in Franklinton
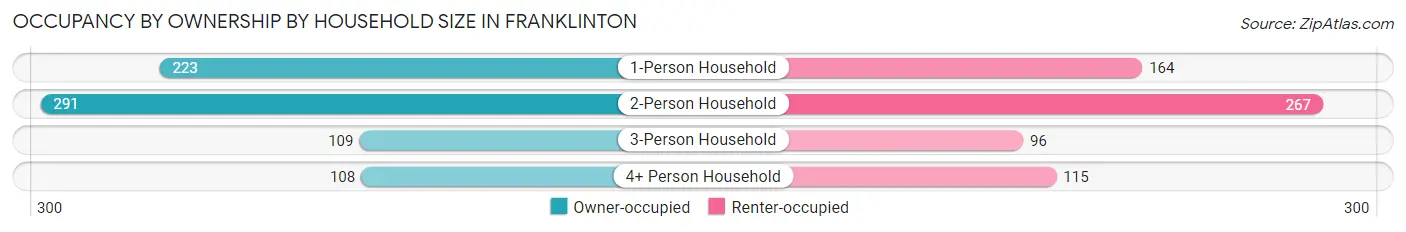
| Household Size | Owner-occupied | Renter-occupied |
| 1-Person Household | 223 (57.6%) | 164 (42.4%) |
| 2-Person Household | 291 (52.1%) | 267 (47.8%) |
| 3-Person Household | 109 (53.2%) | 96 (46.8%) |
| 4+ Person Household | 108 (48.4%) | 115 (51.6%) |
| Total Housing Units | 731 (53.2%) | 642 (46.8%) |
Occupancy by Educational Attainment in Franklinton
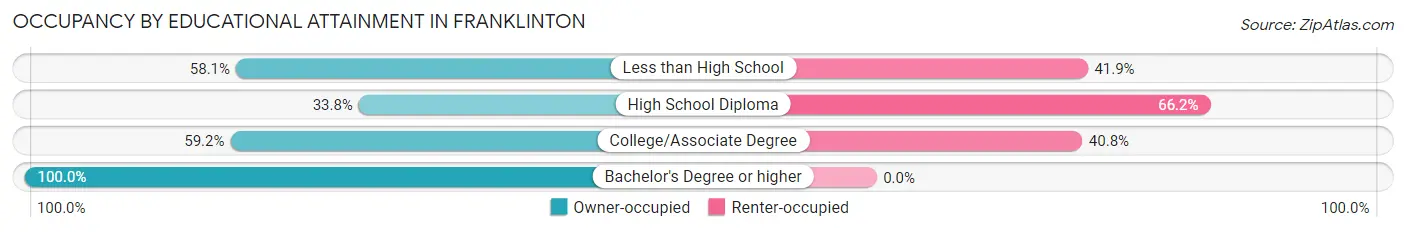
| Household Size | Owner-occupied | Renter-occupied |
| Less than High School | 154 (58.1%) | 111 (41.9%) |
| High School Diploma | 160 (33.8%) | 314 (66.2%) |
| College/Associate Degree | 315 (59.2%) | 217 (40.8%) |
| Bachelor's Degree or higher | 102 (100.0%) | 0 (0.0%) |
Occupancy by Age of Householder in Franklinton
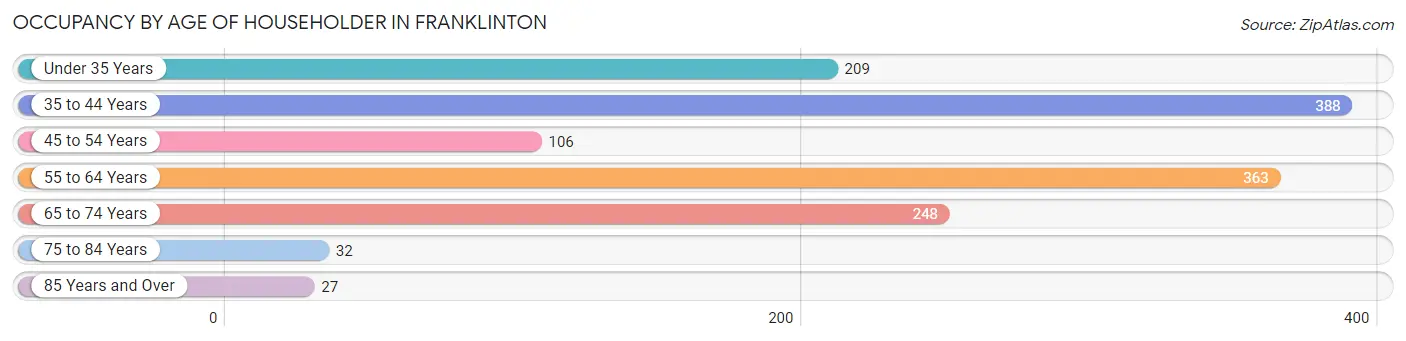
| Age Bracket | # Households | % Households |
| Under 35 Years | 209 | 15.2% |
| 35 to 44 Years | 388 | 28.3% |
| 45 to 54 Years | 106 | 7.7% |
| 55 to 64 Years | 363 | 26.4% |
| 65 to 74 Years | 248 | 18.1% |
| 75 to 84 Years | 32 | 2.3% |
| 85 Years and Over | 27 | 2.0% |
| Total | 1,373 | 100.0% |
Housing Finances in Franklinton
Median Income by Occupancy in Franklinton
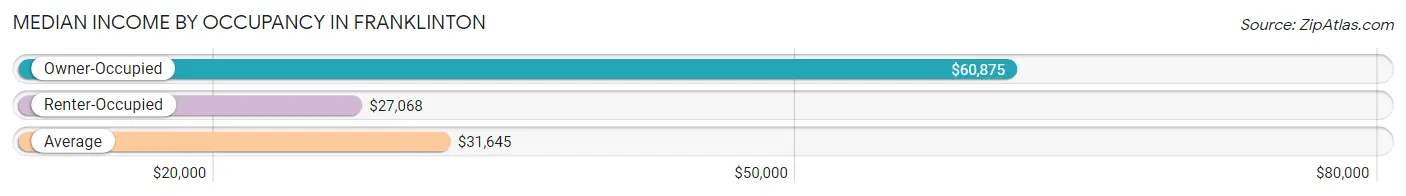
| Occupancy Type | # Households | Median Income |
| Owner-Occupied | 731 (53.2%) | $60,875 |
| Renter-Occupied | 642 (46.8%) | $27,068 |
| Average | 1,373 (100.0%) | $31,645 |
Occupancy by Householder Income Bracket in Franklinton
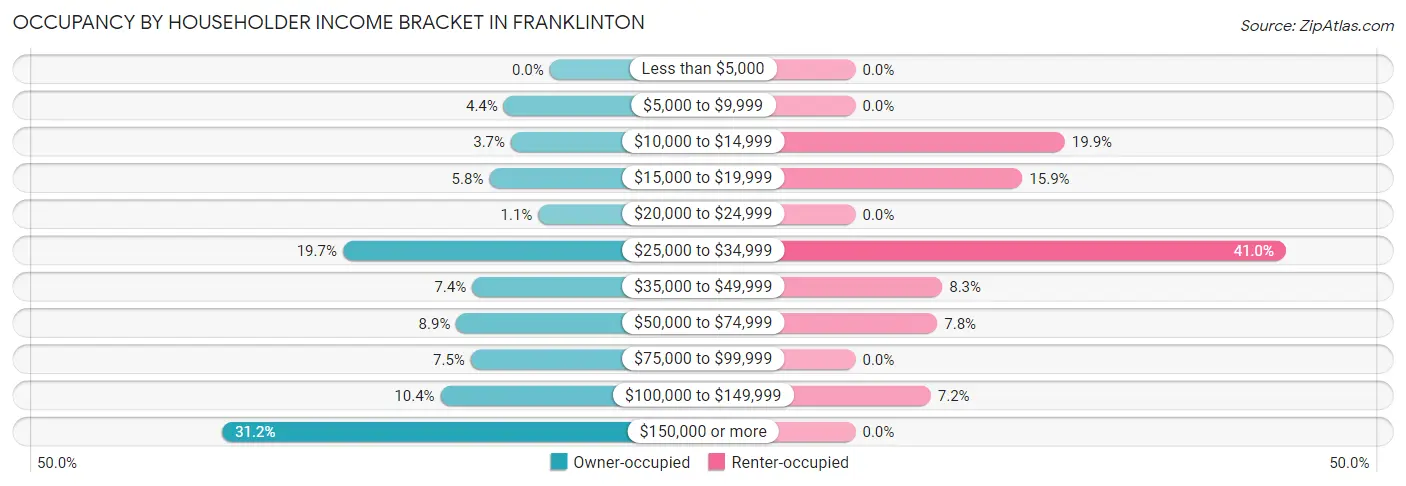
| Income Bracket | Owner-occupied | Renter-occupied |
| Less than $5,000 | 0 (0.0%) | 0 (0.0%) |
| $5,000 to $9,999 | 32 (4.4%) | 0 (0.0%) |
| $10,000 to $14,999 | 27 (3.7%) | 128 (19.9%) |
| $15,000 to $19,999 | 42 (5.8%) | 102 (15.9%) |
| $20,000 to $24,999 | 8 (1.1%) | 0 (0.0%) |
| $25,000 to $34,999 | 144 (19.7%) | 263 (41.0%) |
| $35,000 to $49,999 | 54 (7.4%) | 53 (8.3%) |
| $50,000 to $74,999 | 65 (8.9%) | 50 (7.8%) |
| $75,000 to $99,999 | 55 (7.5%) | 0 (0.0%) |
| $100,000 to $149,999 | 76 (10.4%) | 46 (7.2%) |
| $150,000 or more | 228 (31.2%) | 0 (0.0%) |
| Total | 731 (100.0%) | 642 (100.0%) |
Monthly Housing Cost Tiers in Franklinton
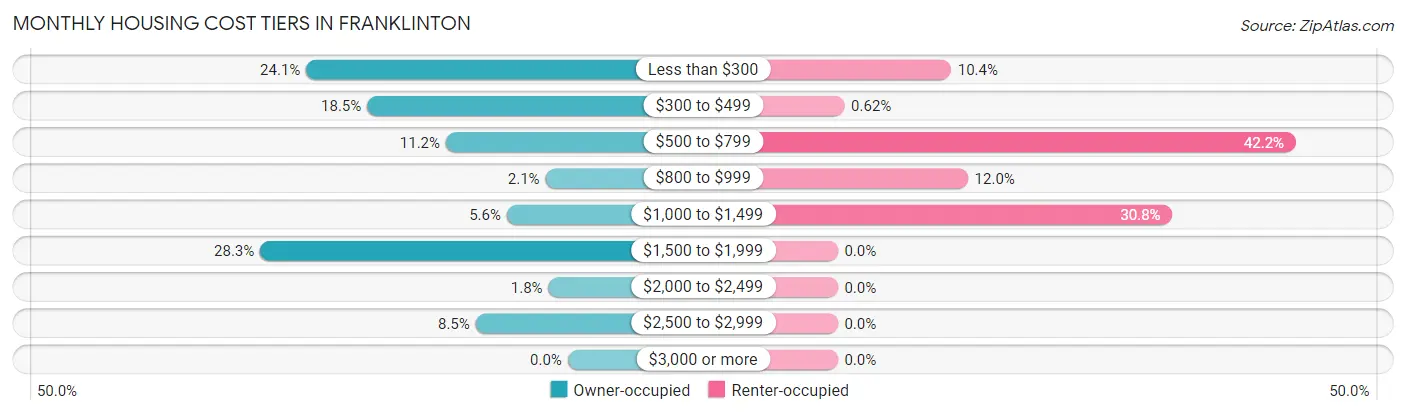
| Monthly Cost | Owner-occupied | Renter-occupied |
| Less than $300 | 176 (24.1%) | 67 (10.4%) |
| $300 to $499 | 135 (18.5%) | 4 (0.6%) |
| $500 to $799 | 82 (11.2%) | 271 (42.2%) |
| $800 to $999 | 15 (2.1%) | 77 (12.0%) |
| $1,000 to $1,499 | 41 (5.6%) | 198 (30.8%) |
| $1,500 to $1,999 | 207 (28.3%) | 0 (0.0%) |
| $2,000 to $2,499 | 13 (1.8%) | 0 (0.0%) |
| $2,500 to $2,999 | 62 (8.5%) | 0 (0.0%) |
| $3,000 or more | 0 (0.0%) | 0 (0.0%) |
| Total | 731 (100.0%) | 642 (100.0%) |
Physical Housing Characteristics in Franklinton
Housing Structures in Franklinton
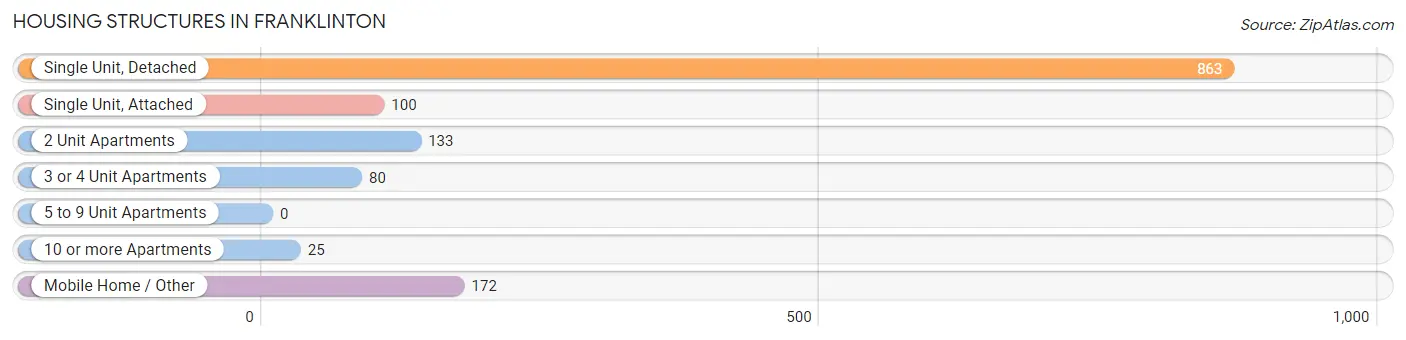
| Structure Type | # Housing Units | % Housing Units |
| Single Unit, Detached | 863 | 62.9% |
| Single Unit, Attached | 100 | 7.3% |
| 2 Unit Apartments | 133 | 9.7% |
| 3 or 4 Unit Apartments | 80 | 5.8% |
| 5 to 9 Unit Apartments | 0 | 0.0% |
| 10 or more Apartments | 25 | 1.8% |
| Mobile Home / Other | 172 | 12.5% |
| Total | 1,373 | 100.0% |
Housing Structures by Occupancy in Franklinton
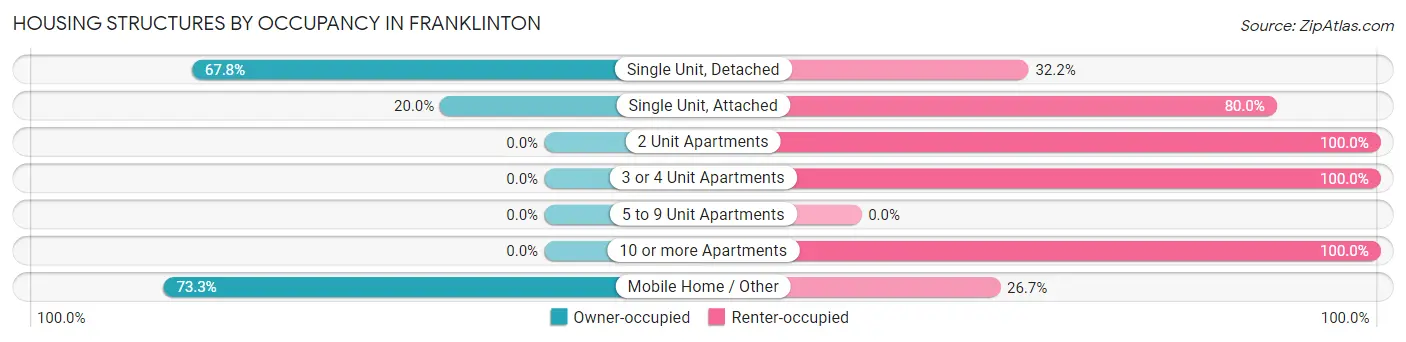
| Structure Type | Owner-occupied | Renter-occupied |
| Single Unit, Detached | 585 (67.8%) | 278 (32.2%) |
| Single Unit, Attached | 20 (20.0%) | 80 (80.0%) |
| 2 Unit Apartments | 0 (0.0%) | 133 (100.0%) |
| 3 or 4 Unit Apartments | 0 (0.0%) | 80 (100.0%) |
| 5 to 9 Unit Apartments | 0 (0.0%) | 0 (0.0%) |
| 10 or more Apartments | 0 (0.0%) | 25 (100.0%) |
| Mobile Home / Other | 126 (73.3%) | 46 (26.7%) |
| Total | 731 (53.2%) | 642 (46.8%) |
Housing Structures by Number of Rooms in Franklinton
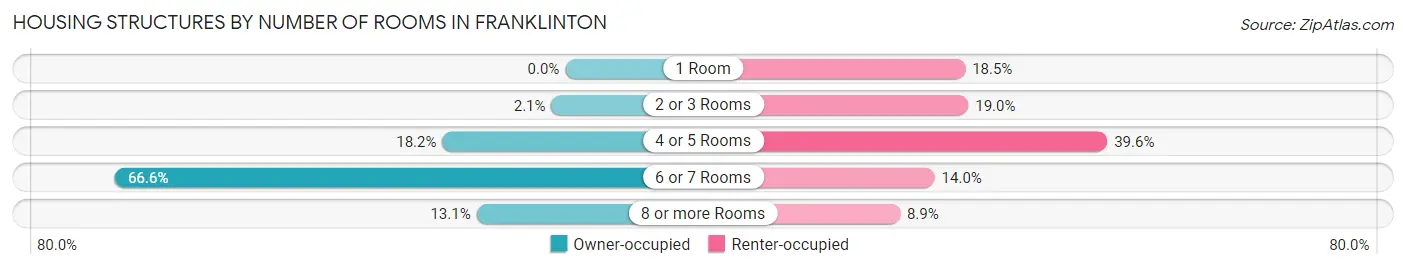
| Number of Rooms | Owner-occupied | Renter-occupied |
| 1 Room | 0 (0.0%) | 119 (18.5%) |
| 2 or 3 Rooms | 15 (2.1%) | 122 (19.0%) |
| 4 or 5 Rooms | 133 (18.2%) | 254 (39.6%) |
| 6 or 7 Rooms | 487 (66.6%) | 90 (14.0%) |
| 8 or more Rooms | 96 (13.1%) | 57 (8.9%) |
| Total | 731 (100.0%) | 642 (100.0%) |
Housing Structure by Heating Type in Franklinton
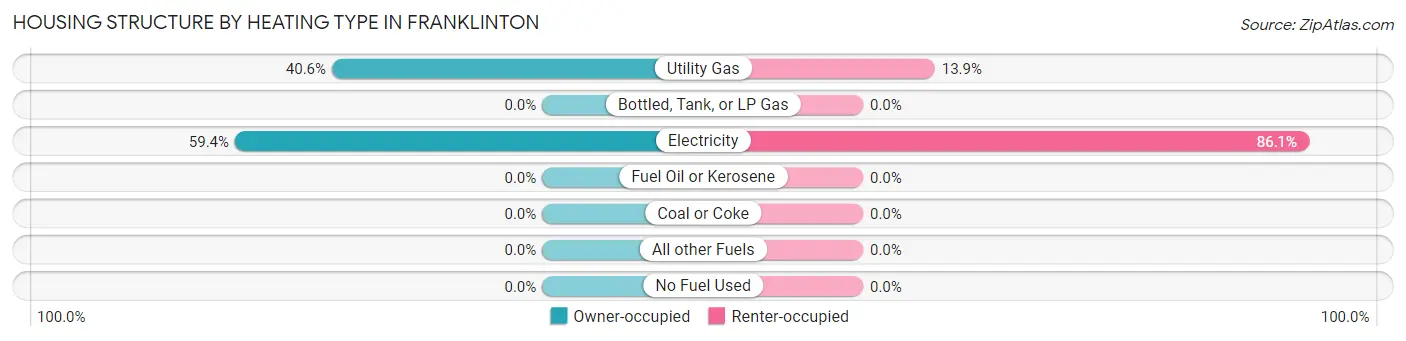
| Heating Type | Owner-occupied | Renter-occupied |
| Utility Gas | 297 (40.6%) | 89 (13.9%) |
| Bottled, Tank, or LP Gas | 0 (0.0%) | 0 (0.0%) |
| Electricity | 434 (59.4%) | 553 (86.1%) |
| Fuel Oil or Kerosene | 0 (0.0%) | 0 (0.0%) |
| Coal or Coke | 0 (0.0%) | 0 (0.0%) |
| All other Fuels | 0 (0.0%) | 0 (0.0%) |
| No Fuel Used | 0 (0.0%) | 0 (0.0%) |
| Total | 731 (100.0%) | 642 (100.0%) |
Household Vehicle Usage in Franklinton
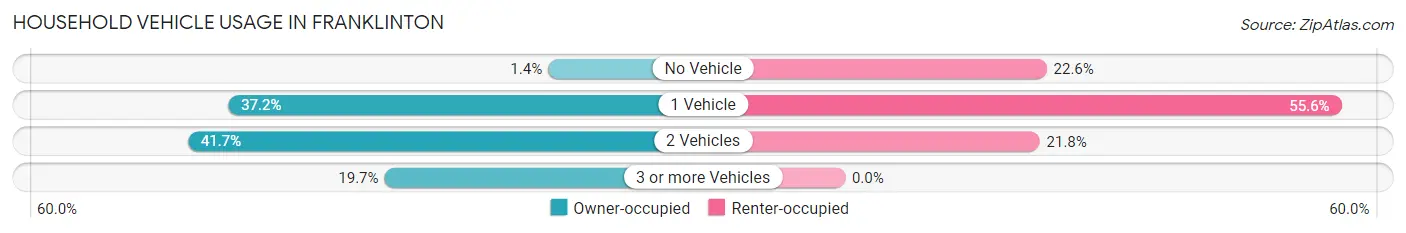
| Vehicles per Household | Owner-occupied | Renter-occupied |
| No Vehicle | 10 (1.4%) | 145 (22.6%) |
| 1 Vehicle | 272 (37.2%) | 357 (55.6%) |
| 2 Vehicles | 305 (41.7%) | 140 (21.8%) |
| 3 or more Vehicles | 144 (19.7%) | 0 (0.0%) |
| Total | 731 (100.0%) | 642 (100.0%) |
Real Estate & Mortgages in Franklinton
Real Estate and Mortgage Overview in Franklinton
| Characteristic | Without Mortgage | With Mortgage |
| Housing Units | 354 | 377 |
| Median Property Value | $94,000 | $285,900 |
| Median Household Income | $57,778 | $218 |
| Monthly Housing Costs | $304 | $0 |
| Real Estate Taxes | $199 | $0 |
Property Value by Mortgage Status in Franklinton
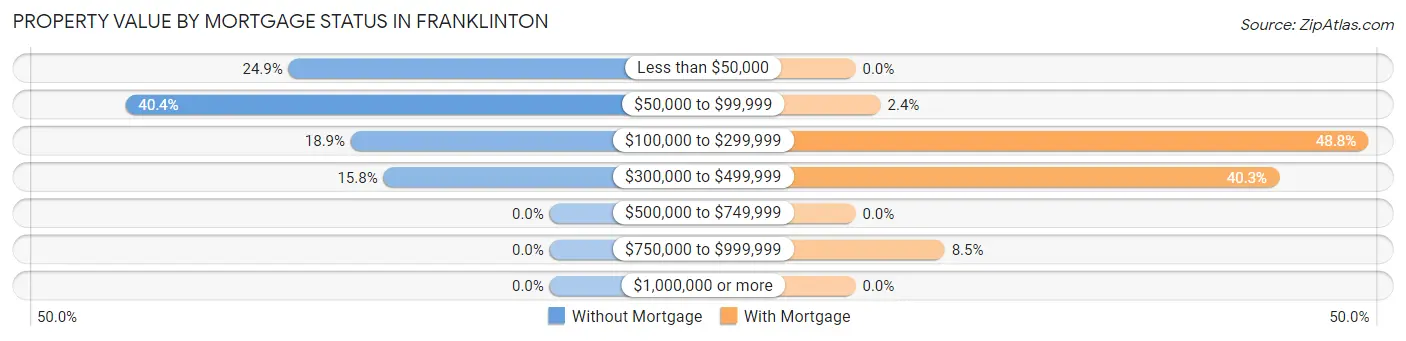
| Property Value | Without Mortgage | With Mortgage |
| Less than $50,000 | 88 (24.9%) | 0 (0.0%) |
| $50,000 to $99,999 | 143 (40.4%) | 9 (2.4%) |
| $100,000 to $299,999 | 67 (18.9%) | 184 (48.8%) |
| $300,000 to $499,999 | 56 (15.8%) | 152 (40.3%) |
| $500,000 to $749,999 | 0 (0.0%) | 0 (0.0%) |
| $750,000 to $999,999 | 0 (0.0%) | 32 (8.5%) |
| $1,000,000 or more | 0 (0.0%) | 0 (0.0%) |
| Total | 354 (100.0%) | 377 (100.0%) |
Household Income by Mortgage Status in Franklinton
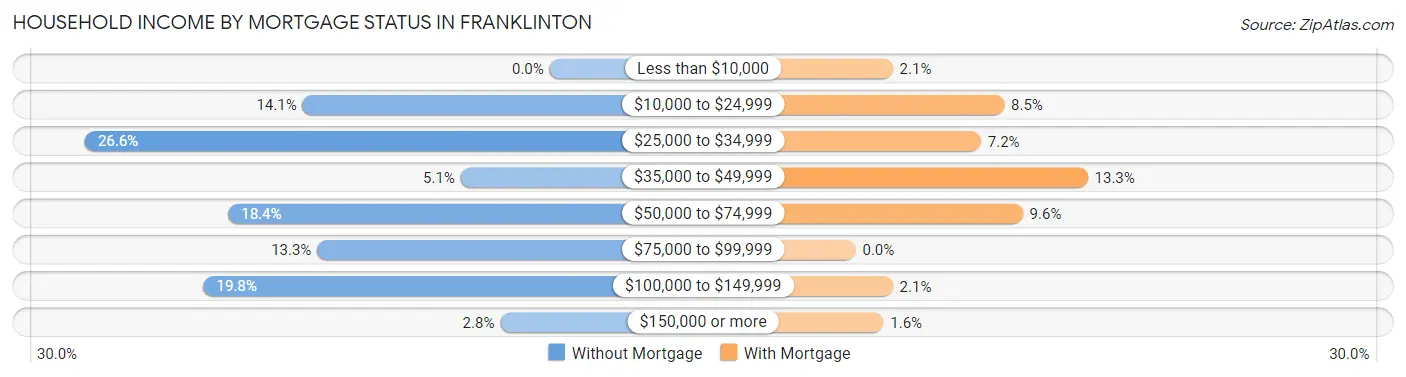
| Household Income | Without Mortgage | With Mortgage |
| Less than $10,000 | 0 (0.0%) | 8 (2.1%) |
| $10,000 to $24,999 | 50 (14.1%) | 32 (8.5%) |
| $25,000 to $34,999 | 94 (26.6%) | 27 (7.2%) |
| $35,000 to $49,999 | 18 (5.1%) | 50 (13.3%) |
| $50,000 to $74,999 | 65 (18.4%) | 36 (9.6%) |
| $75,000 to $99,999 | 47 (13.3%) | 0 (0.0%) |
| $100,000 to $149,999 | 70 (19.8%) | 8 (2.1%) |
| $150,000 or more | 10 (2.8%) | 6 (1.6%) |
| Total | 354 (100.0%) | 377 (100.0%) |
Property Value to Household Income Ratio in Franklinton
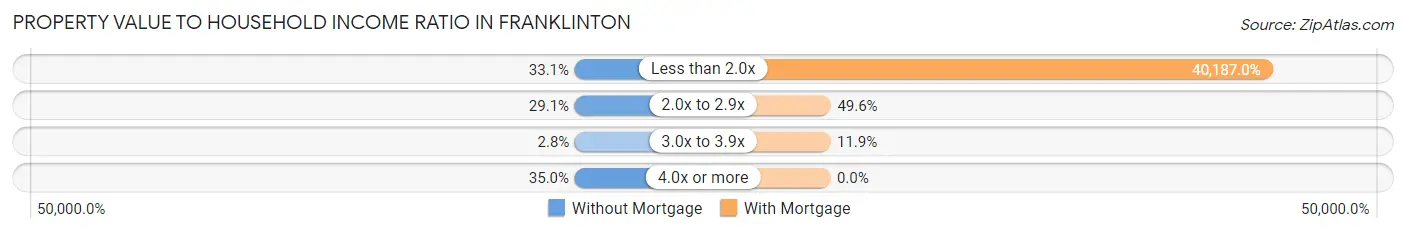
| Value-to-Income Ratio | Without Mortgage | With Mortgage |
| Less than 2.0x | 117 (33.1%) | 151,505 (40,187.0%) |
| 2.0x to 2.9x | 103 (29.1%) | 187 (49.6%) |
| 3.0x to 3.9x | 10 (2.8%) | 45 (11.9%) |
| 4.0x or more | 124 (35.0%) | 0 (0.0%) |
| Total | 354 (100.0%) | 377 (100.0%) |
Real Estate Taxes by Mortgage Status in Franklinton
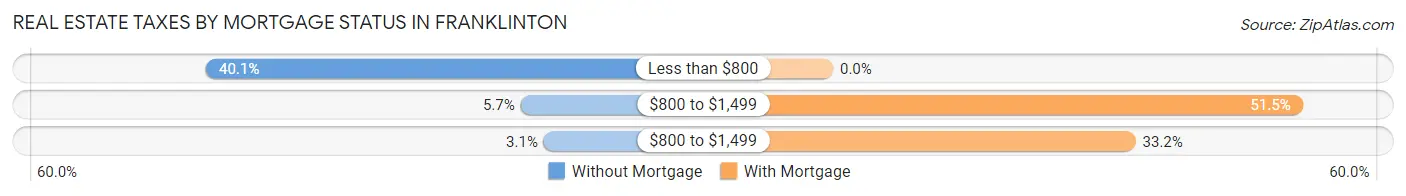
| Property Taxes | Without Mortgage | With Mortgage |
| Less than $800 | 142 (40.1%) | 0 (0.0%) |
| $800 to $1,499 | 20 (5.7%) | 194 (51.5%) |
| $800 to $1,499 | 11 (3.1%) | 125 (33.2%) |
| Total | 354 (100.0%) | 377 (100.0%) |
Health & Disability in Franklinton
Health Insurance Coverage by Age in Franklinton
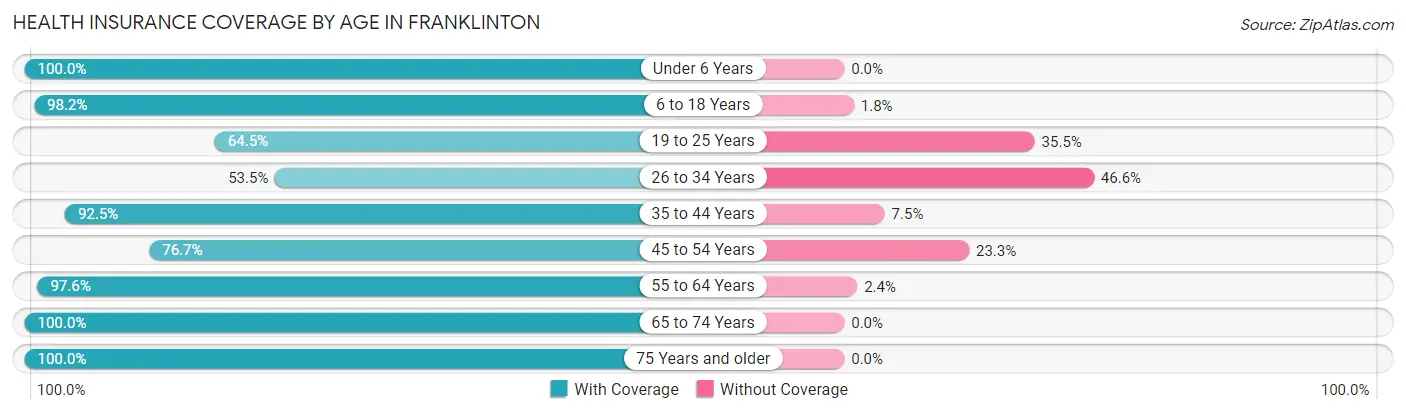
| Age Bracket | With Coverage | Without Coverage |
| Under 6 Years | 221 (100.0%) | 0 (0.0%) |
| 6 to 18 Years | 772 (98.2%) | 14 (1.8%) |
| 19 to 25 Years | 129 (64.5%) | 71 (35.5%) |
| 26 to 34 Years | 124 (53.4%) | 108 (46.6%) |
| 35 to 44 Years | 614 (92.5%) | 50 (7.5%) |
| 45 to 54 Years | 221 (76.7%) | 67 (23.3%) |
| 55 to 64 Years | 485 (97.6%) | 12 (2.4%) |
| 65 to 74 Years | 362 (100.0%) | 0 (0.0%) |
| 75 Years and older | 112 (100.0%) | 0 (0.0%) |
| Total | 3,040 (90.4%) | 322 (9.6%) |
Health Insurance Coverage by Citizenship Status in Franklinton
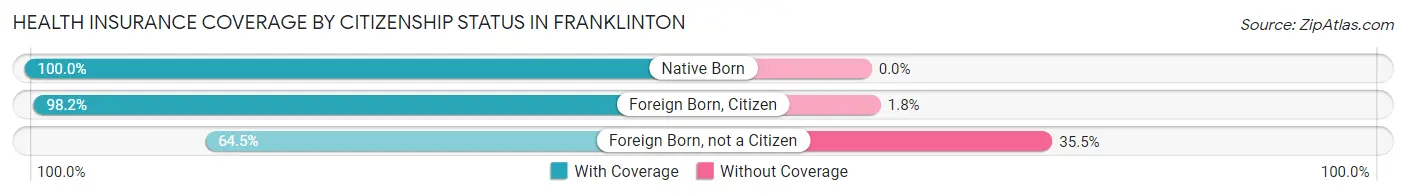
| Citizenship Status | With Coverage | Without Coverage |
| Native Born | 221 (100.0%) | 0 (0.0%) |
| Foreign Born, Citizen | 772 (98.2%) | 14 (1.8%) |
| Foreign Born, not a Citizen | 129 (64.5%) | 71 (35.5%) |
Health Insurance Coverage by Household Income in Franklinton
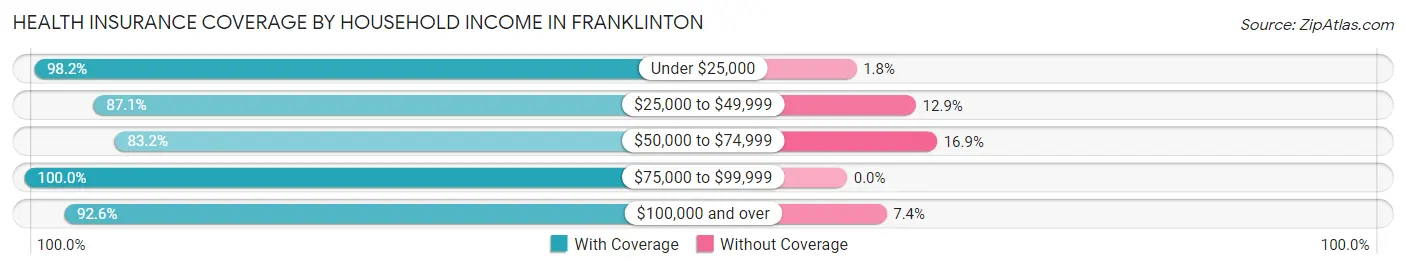
| Household Income | With Coverage | Without Coverage |
| Under $25,000 | 446 (98.2%) | 8 (1.8%) |
| $25,000 to $49,999 | 1,276 (87.1%) | 189 (12.9%) |
| $50,000 to $74,999 | 227 (83.2%) | 46 (16.9%) |
| $75,000 to $99,999 | 92 (100.0%) | 0 (0.0%) |
| $100,000 and over | 988 (92.6%) | 79 (7.4%) |
Public vs Private Health Insurance Coverage by Age in Franklinton
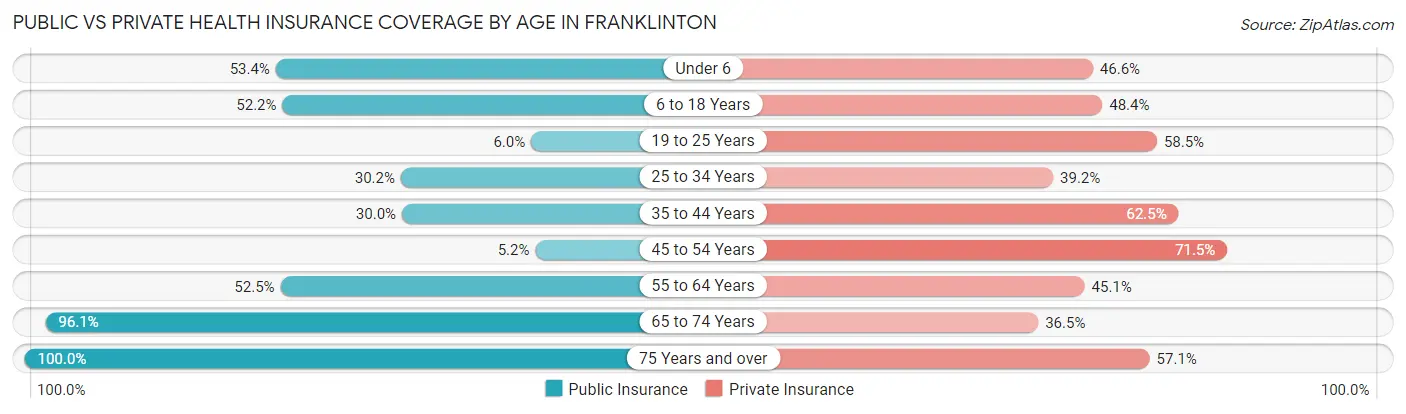
| Age Bracket | Public Insurance | Private Insurance |
| Under 6 | 118 (53.4%) | 103 (46.6%) |
| 6 to 18 Years | 410 (52.2%) | 380 (48.3%) |
| 19 to 25 Years | 12 (6.0%) | 117 (58.5%) |
| 25 to 34 Years | 70 (30.2%) | 91 (39.2%) |
| 35 to 44 Years | 199 (30.0%) | 415 (62.5%) |
| 45 to 54 Years | 15 (5.2%) | 206 (71.5%) |
| 55 to 64 Years | 261 (52.5%) | 224 (45.1%) |
| 65 to 74 Years | 348 (96.1%) | 132 (36.5%) |
| 75 Years and over | 112 (100.0%) | 64 (57.1%) |
| Total | 1,545 (46.0%) | 1,732 (51.5%) |
Disability Status by Sex by Age in Franklinton
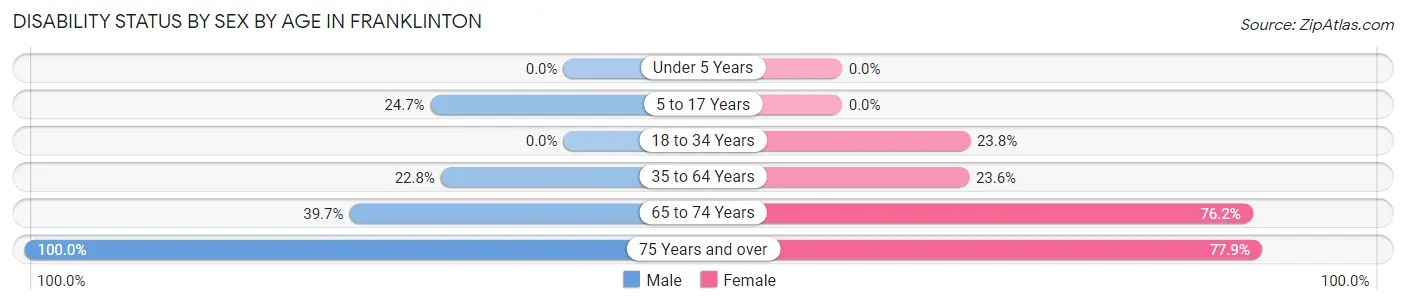
| Age Bracket | Male | Female |
| Under 5 Years | 0 (0.0%) | 0 (0.0%) |
| 5 to 17 Years | 111 (24.7%) | 0 (0.0%) |
| 18 to 34 Years | 0 (0.0%) | 59 (23.8%) |
| 35 to 64 Years | 163 (22.8%) | 173 (23.6%) |
| 65 to 74 Years | 87 (39.7%) | 109 (76.2%) |
| 75 Years and over | 44 (100.0%) | 53 (77.9%) |
Disability Class by Sex by Age in Franklinton
Disability Class: Hearing Difficulty
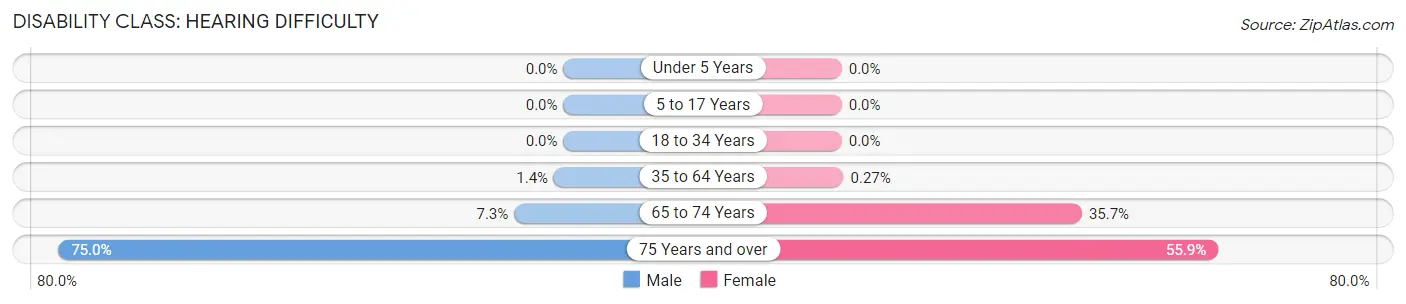
| Age Bracket | Male | Female |
| Under 5 Years | 0 (0.0%) | 0 (0.0%) |
| 5 to 17 Years | 0 (0.0%) | 0 (0.0%) |
| 18 to 34 Years | 0 (0.0%) | 0 (0.0%) |
| 35 to 64 Years | 10 (1.4%) | 2 (0.3%) |
| 65 to 74 Years | 16 (7.3%) | 51 (35.7%) |
| 75 Years and over | 33 (75.0%) | 38 (55.9%) |
Disability Class: Vision Difficulty
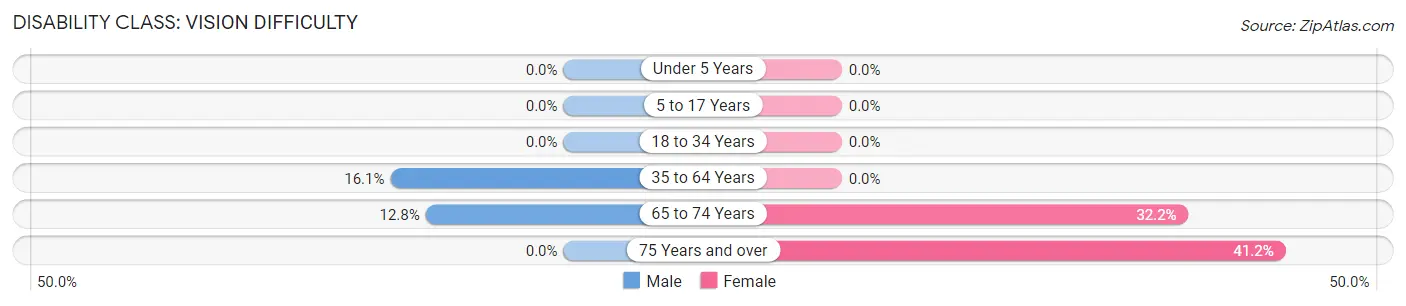
| Age Bracket | Male | Female |
| Under 5 Years | 0 (0.0%) | 0 (0.0%) |
| 5 to 17 Years | 0 (0.0%) | 0 (0.0%) |
| 18 to 34 Years | 0 (0.0%) | 0 (0.0%) |
| 35 to 64 Years | 115 (16.1%) | 0 (0.0%) |
| 65 to 74 Years | 28 (12.8%) | 46 (32.2%) |
| 75 Years and over | 0 (0.0%) | 28 (41.2%) |
Disability Class: Cognitive Difficulty
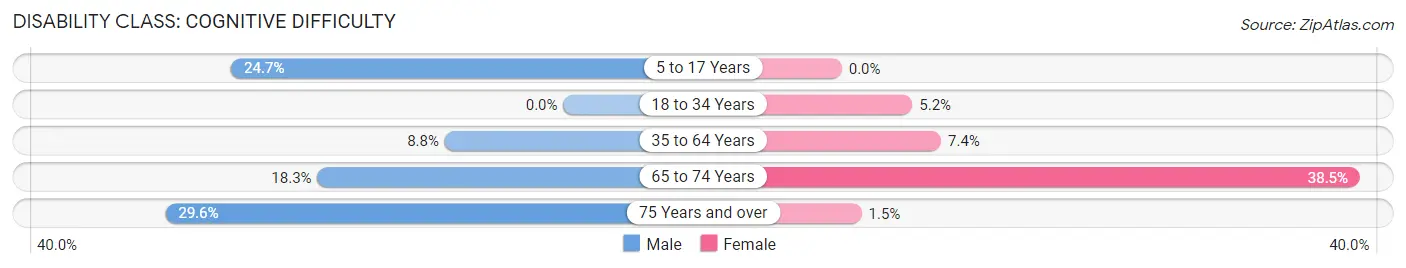
| Age Bracket | Male | Female |
| 5 to 17 Years | 111 (24.7%) | 0 (0.0%) |
| 18 to 34 Years | 0 (0.0%) | 13 (5.2%) |
| 35 to 64 Years | 63 (8.8%) | 54 (7.4%) |
| 65 to 74 Years | 40 (18.3%) | 55 (38.5%) |
| 75 Years and over | 13 (29.5%) | 1 (1.5%) |
Disability Class: Ambulatory Difficulty
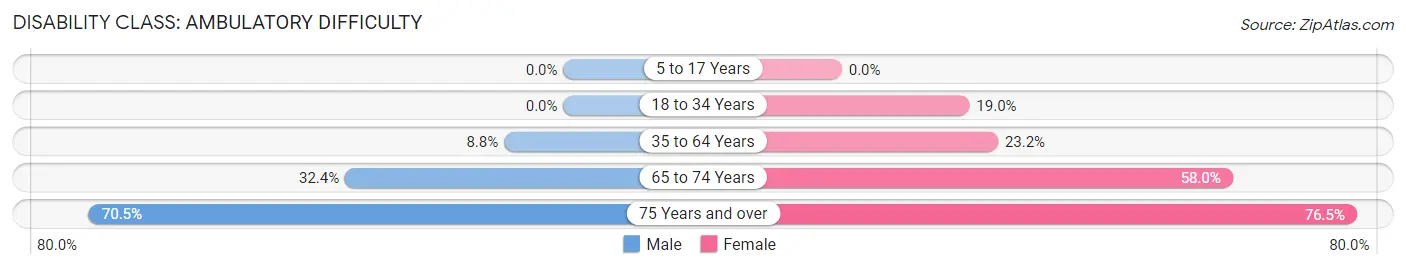
| Age Bracket | Male | Female |
| 5 to 17 Years | 0 (0.0%) | 0 (0.0%) |
| 18 to 34 Years | 0 (0.0%) | 47 (19.0%) |
| 35 to 64 Years | 63 (8.8%) | 170 (23.2%) |
| 65 to 74 Years | 71 (32.4%) | 83 (58.0%) |
| 75 Years and over | 31 (70.5%) | 52 (76.5%) |
Disability Class: Self-Care Difficulty
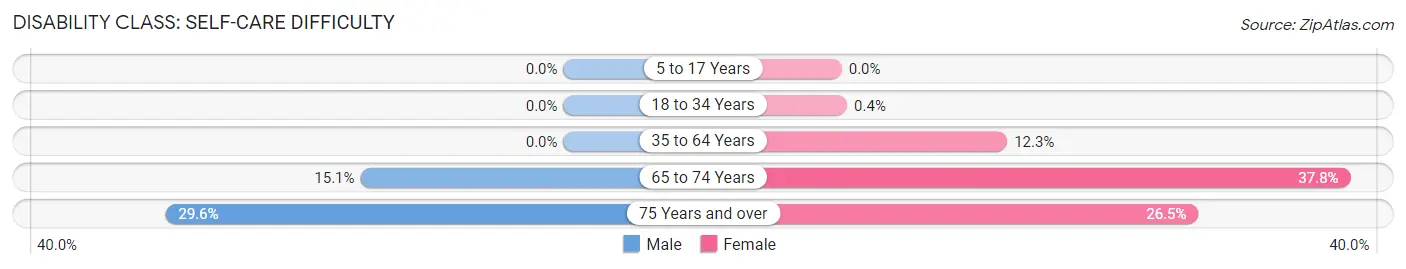
| Age Bracket | Male | Female |
| 5 to 17 Years | 0 (0.0%) | 0 (0.0%) |
| 18 to 34 Years | 0 (0.0%) | 1 (0.4%) |
| 35 to 64 Years | 0 (0.0%) | 90 (12.3%) |
| 65 to 74 Years | 33 (15.1%) | 54 (37.8%) |
| 75 Years and over | 13 (29.5%) | 18 (26.5%) |
Technology Access in Franklinton
Computing Device Access in Franklinton
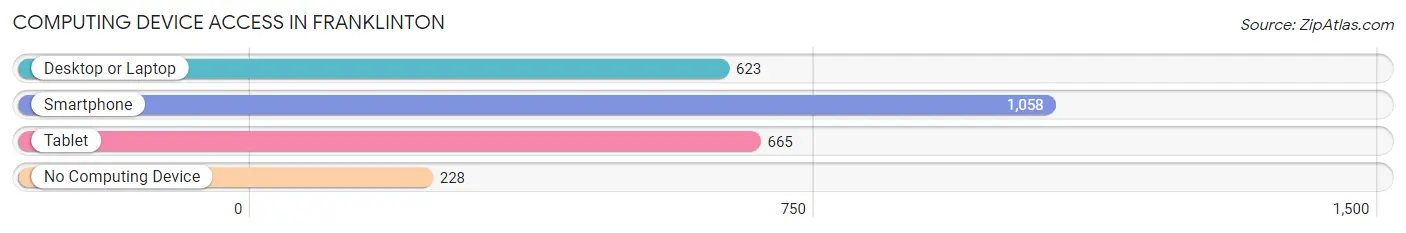
| Device Type | # Households | % Households |
| Desktop or Laptop | 623 | 45.4% |
| Smartphone | 1,058 | 77.1% |
| Tablet | 665 | 48.4% |
| No Computing Device | 228 | 16.6% |
| Total | 1,373 | 100.0% |
Internet Access in Franklinton
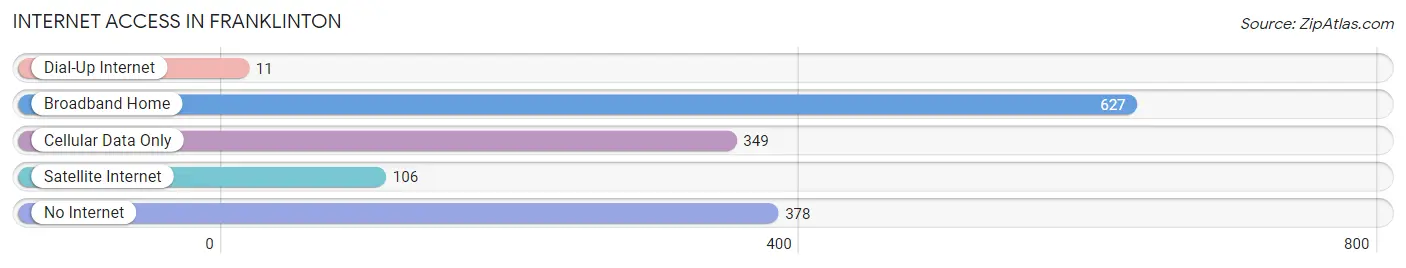
| Internet Type | # Households | % Households |
| Dial-Up Internet | 11 | 0.8% |
| Broadband Home | 627 | 45.7% |
| Cellular Data Only | 349 | 25.4% |
| Satellite Internet | 106 | 7.7% |
| No Internet | 378 | 27.5% |
| Total | 1,373 | 100.0% |
Franklinton Summary
Franklinton, Louisiana is a small town located in Washington Parish, in the southeastern part of the state. It is situated on the banks of the Bogue Chitto River, about 40 miles north of New Orleans. The town was founded in 1819 and named after Benjamin Franklin, one of the Founding Fathers of the United States.
History
Franklinton was founded in 1819 by a group of settlers from North Carolina. The town was named after Benjamin Franklin, one of the Founding Fathers of the United States. The town was originally a farming community, and the main crops were cotton, corn, and sweet potatoes. The town was also known for its lumber industry, which was a major source of income for the town.
In the late 1800s, the town began to grow and develop. The railroad was built through the town, and the first bank was established in 1891. The town also had a newspaper, the Franklinton Times, which was published from 1891 to 1895.
In the early 1900s, the town began to decline. The lumber industry had declined, and the railroad had been moved to a different location. The population of the town decreased, and the town began to become a ghost town.
In the late 1900s, the town began to experience a revival. The population began to increase, and new businesses began to open. The town also began to attract tourists, and the town began to experience a resurgence.
Geography
Franklinton is located in Washington Parish, in the southeastern part of the state. It is situated on the banks of the Bogue Chitto River, about 40 miles north of New Orleans. The town is located in a rural area, and the terrain is mostly flat. The town is surrounded by forests and swamps, and the climate is humid and subtropical.
Economy
The economy of Franklinton is largely based on agriculture and tourism. The town is home to several farms, which produce cotton, corn, and sweet potatoes. The town is also home to several tourist attractions, such as the Bogue Chitto State Park and the Franklinton Historical Museum.
The town is also home to several small businesses, such as restaurants, shops, and hotels. The town is also home to several manufacturing companies, which produce furniture, clothing, and other products.
Demographics
As of the 2010 census, the population of Franklinton was 2,717. The population is mostly white (90.2%), with a small percentage of African Americans (7.2%) and Hispanics (2.6%). The median household income is $31,250, and the median age is 38.
Conclusion
Franklinton, Louisiana is a small town located in Washington Parish, in the southeastern part of the state. It was founded in 1819 and named after Benjamin Franklin, one of the Founding Fathers of the United States. The town is largely based on agriculture and tourism, and the population is mostly white. The town is home to several tourist attractions, such as the Bogue Chitto State Park and the Franklinton Historical Museum. The town is also home to several small businesses, such as restaurants, shops, and hotels.
Common Questions
What is Per Capita Income in Franklinton?
Per Capita income in Franklinton is $26,211.
What is the Median Family Income in Franklinton?
Median Family Income in Franklinton is $40,903.
What is the Median Household income in Franklinton?
Median Household Income in Franklinton is $31,645.
What is Inequality or Gini Index in Franklinton?
Inequality or Gini Index in Franklinton is 0.48.
What is the Total Population of Franklinton?
Total Population of Franklinton is 3,638.
What is the Total Male Population of Franklinton?
Total Male Population of Franklinton is 2,115.
What is the Total Female Population of Franklinton?
Total Female Population of Franklinton is 1,523.
What is the Ratio of Males per 100 Females in Franklinton?
There are 138.87 Males per 100 Females in Franklinton.
What is the Ratio of Females per 100 Males in Franklinton?
There are 72.01 Females per 100 Males in Franklinton.
What is the Median Population Age in Franklinton?
Median Population Age in Franklinton is 39.5 Years.
What is the Average Family Size in Franklinton
Average Family Size in Franklinton is 3.0 People.
What is the Average Household Size in Franklinton
Average Household Size in Franklinton is 2.4 People.
How Large is the Labor Force in Franklinton?
There are 1,651 People in the Labor Forcein in Franklinton.
What is the Percentage of People in the Labor Force in Franklinton?
57.5% of People are in the Labor Force in Franklinton.
What is the Unemployment Rate in Franklinton?
Unemployment Rate in Franklinton is 4.2%.