Cankton, LA Map & Demographics
Cankton Map
Cankton Overview
$24,827
PER CAPITA INCOME
$43,594
AVG FAMILY INCOME
0.43
INEQUALITY / GINI INDEX
576
TOTAL POPULATION
240
MALE POPULATION
336
FEMALE POPULATION
71.43
MALES / 100 FEMALES
140.00
FEMALES / 100 MALES
29.2
MEDIAN AGE
3.0
AVG FAMILY SIZE
2.8
AVG HOUSEHOLD SIZE
256
LABOR FORCE [ PEOPLE ]
62.3%
PERCENT IN LABOR FORCE
Cankton Area Codes
Income in Cankton
Income Overview in Cankton
| Characteristic | Number | Measure |
| Per Capita Income | 576 | $24,827 |
| Median Family Income | 151 | $43,594 |
| Mean Family Income | 151 | $63,435 |
| Median Household Income | 206 | $0 |
| Mean Household Income | 206 | $65,074 |
| Income Deficit | 151 | $0 |
| Wage / Income Gap (%) | 576 | 0.00% |
| Wage / Income Gap ($) | 576 | 100.00¢ per $1 |
| Gini / Inequality Index | 576 | 0.43 |
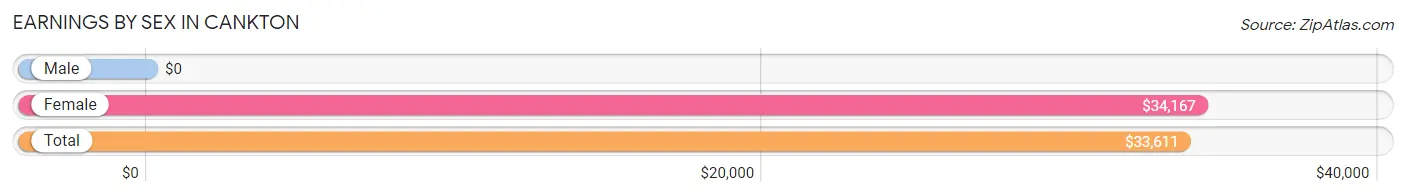
Earnings by Sex in Cankton
| Sex | Number | Average Earnings |
| Male | 148 (57.8%) | $0 |
| Female | 108 (42.2%) | $34,167 |
| Total | 256 (100.0%) | $33,611 |
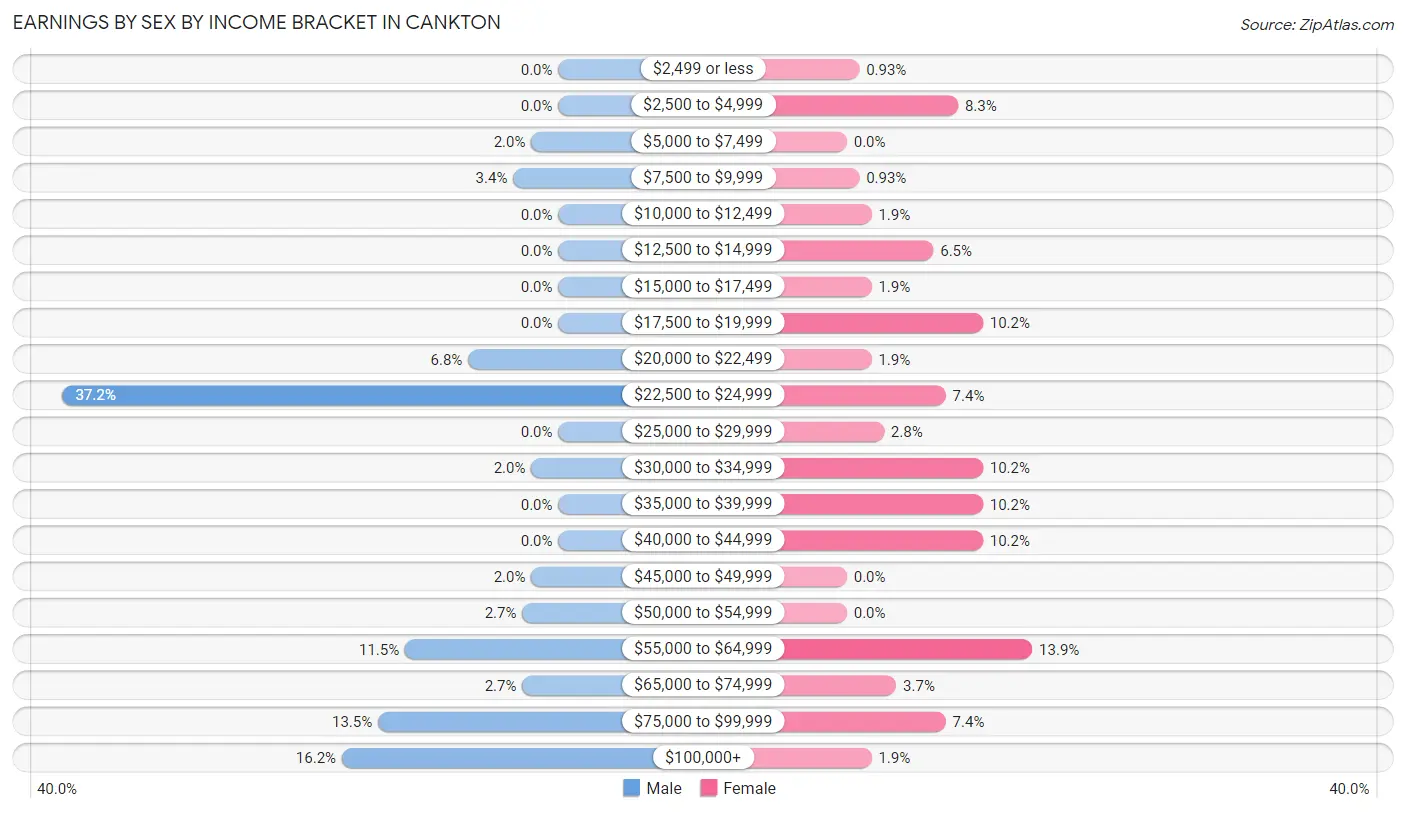
Earnings by Sex by Income Bracket in Cankton
The most common earnings brackets in Cankton are $22,500 to $24,999 for men (55 | 37.2%) and $55,000 to $64,999 for women (15 | 13.9%).
| Income | Male | Female |
| $2,499 or less | 0 (0.0%) | 1 (0.9%) |
| $2,500 to $4,999 | 0 (0.0%) | 9 (8.3%) |
| $5,000 to $7,499 | 3 (2.0%) | 0 (0.0%) |
| $7,500 to $9,999 | 5 (3.4%) | 1 (0.9%) |
| $10,000 to $12,499 | 0 (0.0%) | 2 (1.8%) |
| $12,500 to $14,999 | 0 (0.0%) | 7 (6.5%) |
| $15,000 to $17,499 | 0 (0.0%) | 2 (1.8%) |
| $17,500 to $19,999 | 0 (0.0%) | 11 (10.2%) |
| $20,000 to $22,499 | 10 (6.8%) | 2 (1.8%) |
| $22,500 to $24,999 | 55 (37.2%) | 8 (7.4%) |
| $25,000 to $29,999 | 0 (0.0%) | 3 (2.8%) |
| $30,000 to $34,999 | 3 (2.0%) | 11 (10.2%) |
| $35,000 to $39,999 | 0 (0.0%) | 11 (10.2%) |
| $40,000 to $44,999 | 0 (0.0%) | 11 (10.2%) |
| $45,000 to $49,999 | 3 (2.0%) | 0 (0.0%) |
| $50,000 to $54,999 | 4 (2.7%) | 0 (0.0%) |
| $55,000 to $64,999 | 17 (11.5%) | 15 (13.9%) |
| $65,000 to $74,999 | 4 (2.7%) | 4 (3.7%) |
| $75,000 to $99,999 | 20 (13.5%) | 8 (7.4%) |
| $100,000+ | 24 (16.2%) | 2 (1.8%) |
| Total | 148 (100.0%) | 108 (100.0%) |
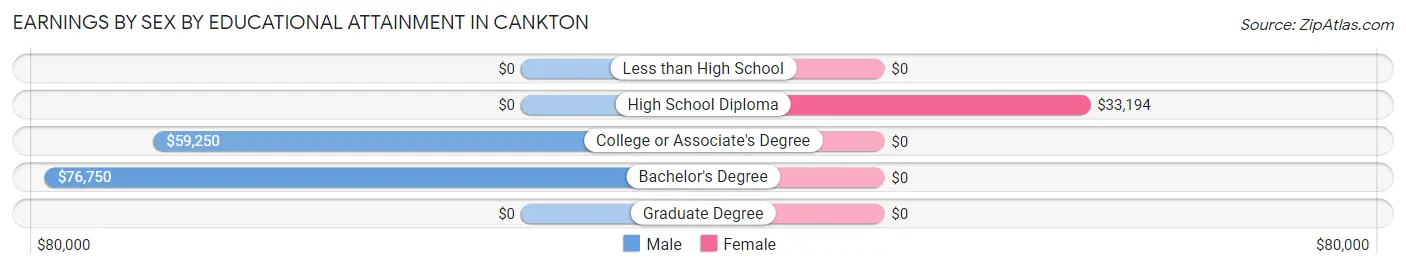
Earnings by Sex by Educational Attainment in Cankton
Average earnings in Cankton are $73,750 for men and $34,861 for women, a difference of 52.7%. Men with an educational attainment of bachelor's degree enjoy the highest average annual earnings of $76,750, while those with college or associate's degree education earn the least with $59,250. Women with an educational attainment of high school diploma earn the most with the average annual earnings of $33,194, while those with high school diploma education have the smallest earnings of $33,194.
| Educational Attainment | Male Income | Female Income |
| Less than High School | - | - |
| High School Diploma | - | - |
| College or Associate's Degree | $59,250 | $0 |
| Bachelor's Degree | $76,750 | $0 |
| Graduate Degree | - | - |
| Total | $73,750 | $34,861 |
Family Income in Cankton
Family Income Brackets in Cankton
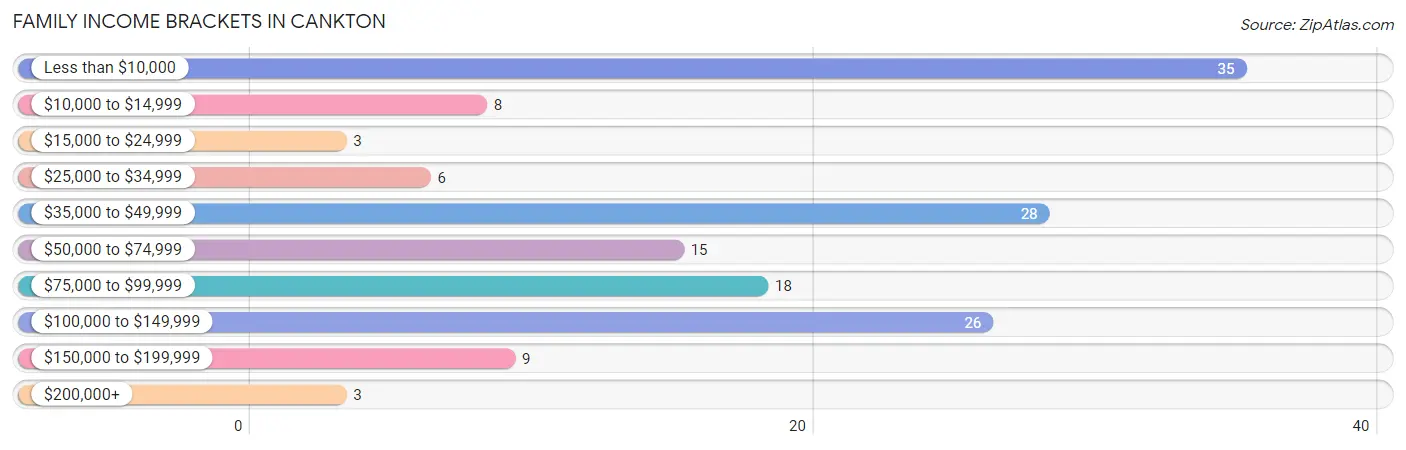
According to the Cankton family income data, there are 35 families falling into the less than $10,000 income range, which is the most common income bracket and makes up 23.2% of all families. Conversely, the $15,000 to $24,999 income bracket is the least frequent group with only 3 families (2.0%) belonging to this category.
| Income Bracket | # Families | % Families |
| Less than $10,000 | 35 | 23.2% |
| $10,000 to $14,999 | 8 | 5.3% |
| $15,000 to $24,999 | 3 | 2.0% |
| $25,000 to $34,999 | 6 | 4.0% |
| $35,000 to $49,999 | 28 | 18.5% |
| $50,000 to $74,999 | 15 | 9.9% |
| $75,000 to $99,999 | 18 | 11.9% |
| $100,000 to $149,999 | 26 | 17.2% |
| $150,000 to $199,999 | 9 | 6.0% |
| $200,000+ | 3 | 2.0% |
Family Income by Famaliy Size in Cankton
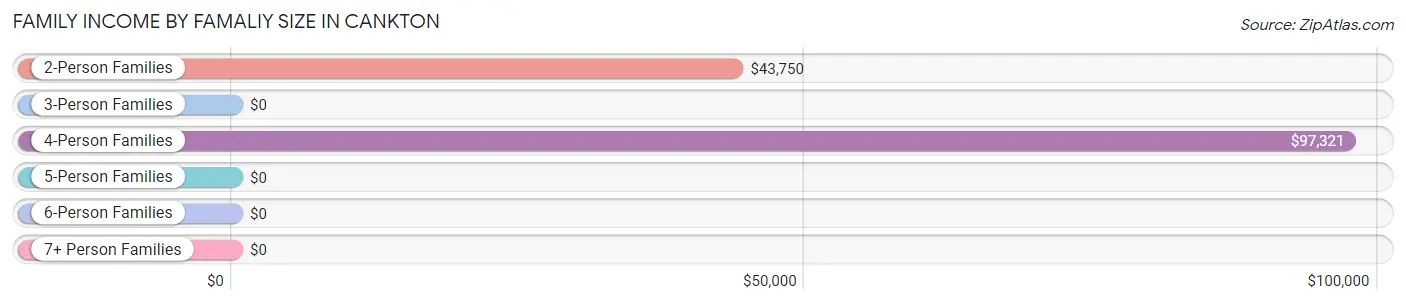
4-person families (13 | 8.6%) account for the highest median family income in Cankton with $97,321 per family, while 4-person families (13 | 8.6%) have the highest median income of $24,330 per family member.
| Income Bracket | # Families | Median Income |
| 2-Person Families | 68 (45.0%) | $43,750 |
| 3-Person Families | 66 (43.7%) | $0 |
| 4-Person Families | 13 (8.6%) | $97,321 |
| 5-Person Families | 3 (2.0%) | $0 |
| 6-Person Families | 1 (0.7%) | $0 |
| 7+ Person Families | 0 (0.0%) | $0 |
| Total | 151 (100.0%) | $43,594 |
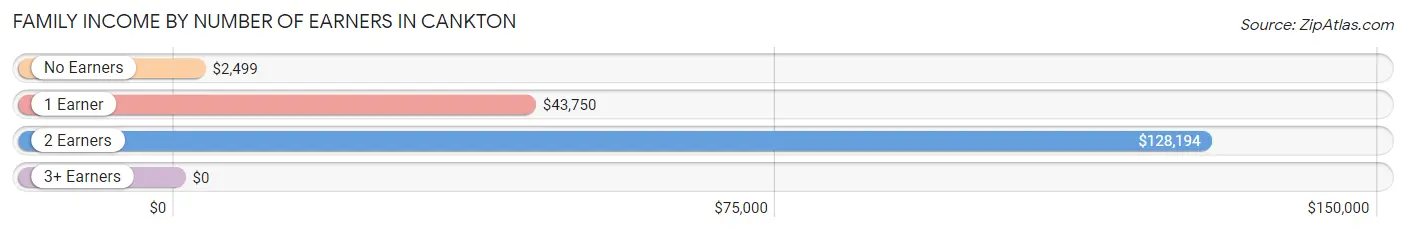
Family Income by Number of Earners in Cankton
| Number of Earners | # Families | Median Income |
| No Earners | 45 (29.8%) | $2,499 |
| 1 Earner | 54 (35.8%) | $43,750 |
| 2 Earners | 51 (33.8%) | $128,194 |
| 3+ Earners | 1 (0.7%) | $0 |
| Total | 151 (100.0%) | $43,594 |
Household Income in Cankton
Household Income Brackets in Cankton
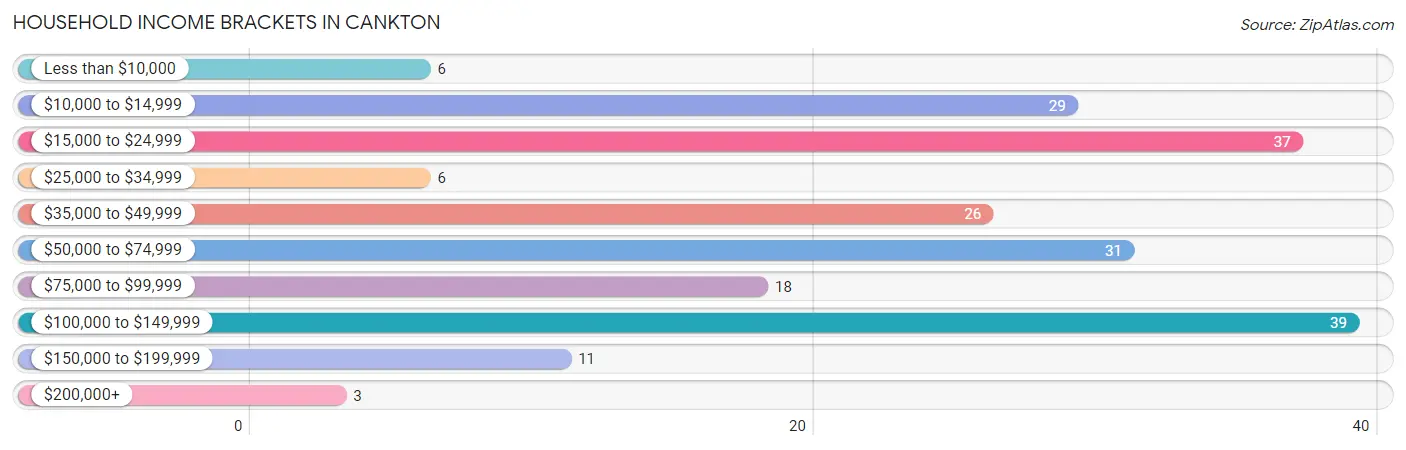
With 39 households falling in the category, the $100,000 to $149,999 income range is the most frequent in Cankton, accounting for 18.9% of all households. In contrast, only 3 households (1.5%) fall into the $200,000+ income bracket, making it the least populous group.
| Income Bracket | # Households | % Households |
| Less than $10,000 | 6 | 2.9% |
| $10,000 to $14,999 | 29 | 14.1% |
| $15,000 to $24,999 | 37 | 18.0% |
| $25,000 to $34,999 | 6 | 2.9% |
| $35,000 to $49,999 | 26 | 12.6% |
| $50,000 to $74,999 | 31 | 15.0% |
| $75,000 to $99,999 | 18 | 8.7% |
| $100,000 to $149,999 | 39 | 18.9% |
| $150,000 to $199,999 | 11 | 5.3% |
| $200,000+ | 3 | 1.5% |
Household Income by Householder Age in Cankton
The median household income in Cankton is $0, with the highest median household income of $105,417 found in the 25 to 44 years age bracket for the primary householder. A total of 59 households (28.6%) fall into this category. Meanwhile, the 15 to 24 years age bracket for the primary householder has the lowest median household income of $0, with 32 households (15.5%) in this group.
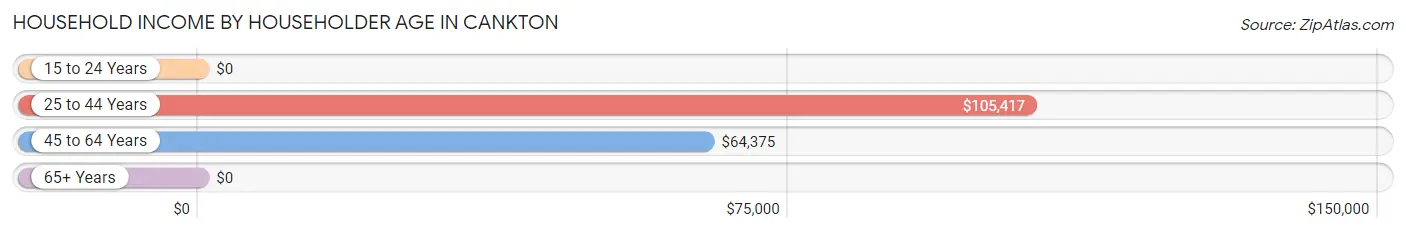
| Income Bracket | # Households | Median Income |
| 15 to 24 Years | 32 (15.5%) | $0 |
| 25 to 44 Years | 59 (28.6%) | $105,417 |
| 45 to 64 Years | 61 (29.6%) | $64,375 |
| 65+ Years | 54 (26.2%) | $0 |
| Total | 206 (100.0%) | $0 |
Poverty in Cankton
Income Below Poverty by Sex and Age in Cankton
With 5.8% poverty level for males and 49.1% for females among the residents of Cankton, 6 to 11 year old males and 18 to 24 year old females are the most vulnerable to poverty, with 4 males (66.7%) and 36 females (97.3%) in their respective age groups living below the poverty level.
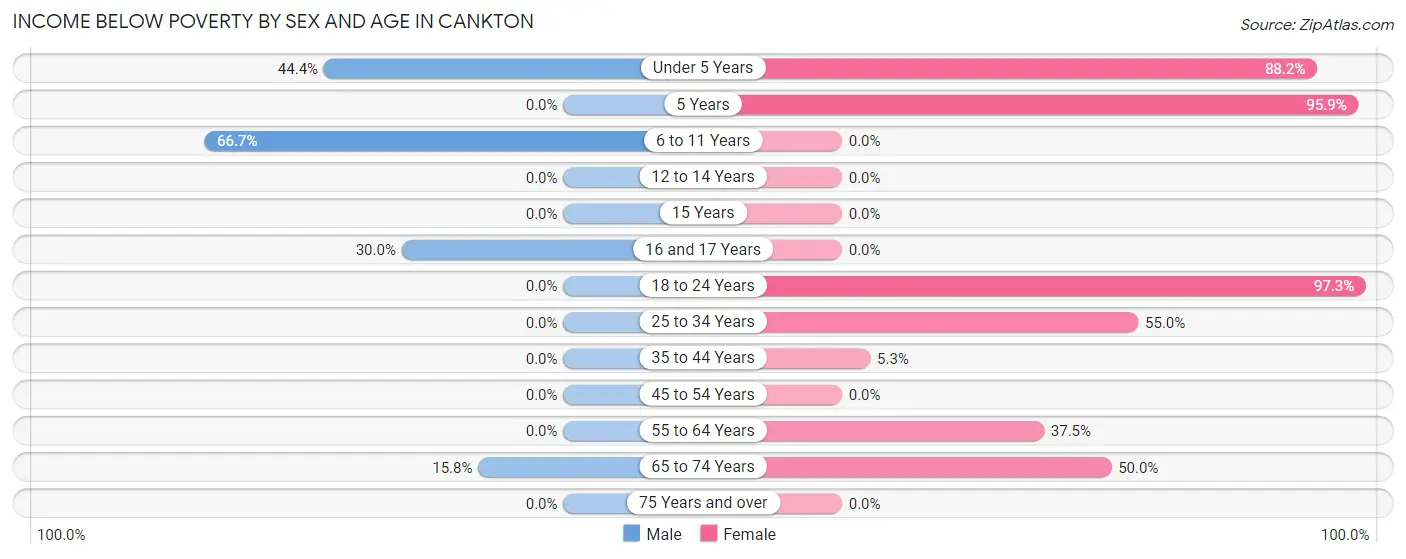
| Age Bracket | Male | Female |
| Under 5 Years | 4 (44.4%) | 45 (88.2%) |
| 5 Years | 0 (0.0%) | 47 (95.9%) |
| 6 to 11 Years | 4 (66.7%) | 0 (0.0%) |
| 12 to 14 Years | 0 (0.0%) | 0 (0.0%) |
| 15 Years | 0 (0.0%) | 0 (0.0%) |
| 16 and 17 Years | 3 (30.0%) | 0 (0.0%) |
| 18 to 24 Years | 0 (0.0%) | 36 (97.3%) |
| 25 to 34 Years | 0 (0.0%) | 11 (55.0%) |
| 35 to 44 Years | 0 (0.0%) | 3 (5.3%) |
| 45 to 54 Years | 0 (0.0%) | 0 (0.0%) |
| 55 to 64 Years | 0 (0.0%) | 6 (37.5%) |
| 65 to 74 Years | 3 (15.8%) | 17 (50.0%) |
| 75 Years and over | 0 (0.0%) | 0 (0.0%) |
| Total | 14 (5.8%) | 165 (49.1%) |
Income Above Poverty by Sex and Age in Cankton
According to the poverty statistics in Cankton, males aged 12 to 14 years and females aged 6 to 11 years are the age groups that are most secure financially, with 100.0% of males and 100.0% of females in these age groups living above the poverty line.
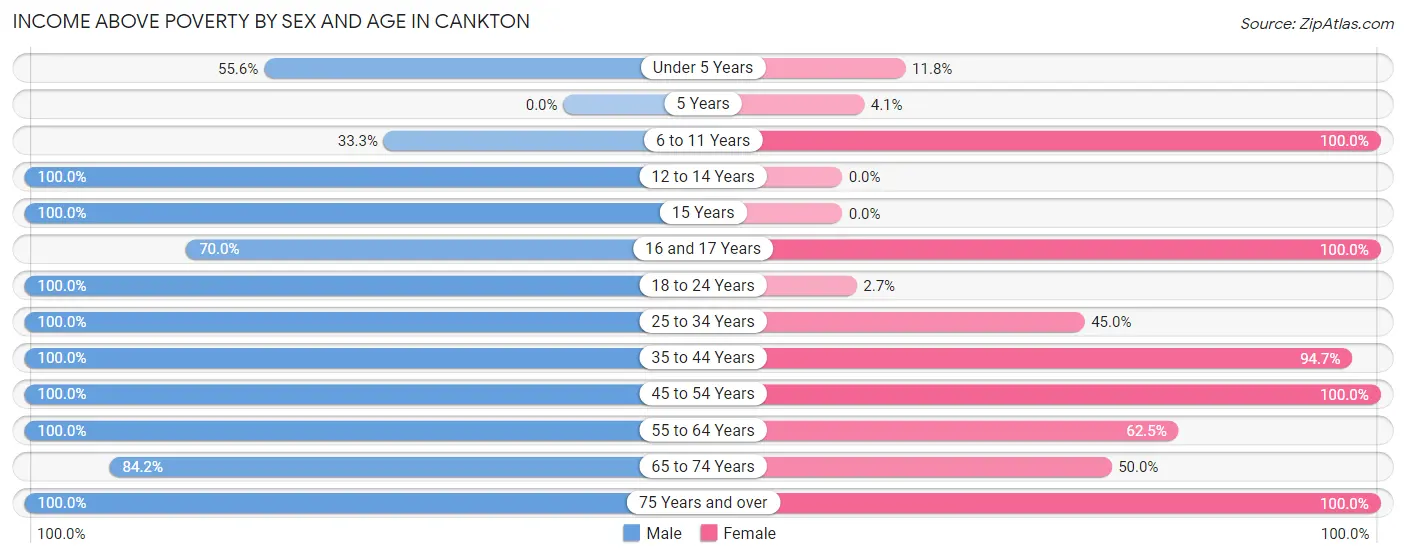
| Age Bracket | Male | Female |
| Under 5 Years | 5 (55.6%) | 6 (11.8%) |
| 5 Years | 0 (0.0%) | 2 (4.1%) |
| 6 to 11 Years | 2 (33.3%) | 23 (100.0%) |
| 12 to 14 Years | 25 (100.0%) | 0 (0.0%) |
| 15 Years | 2 (100.0%) | 0 (0.0%) |
| 16 and 17 Years | 7 (70.0%) | 7 (100.0%) |
| 18 to 24 Years | 60 (100.0%) | 1 (2.7%) |
| 25 to 34 Years | 23 (100.0%) | 9 (45.0%) |
| 35 to 44 Years | 18 (100.0%) | 54 (94.7%) |
| 45 to 54 Years | 40 (100.0%) | 22 (100.0%) |
| 55 to 64 Years | 18 (100.0%) | 10 (62.5%) |
| 65 to 74 Years | 16 (84.2%) | 17 (50.0%) |
| 75 Years and over | 10 (100.0%) | 20 (100.0%) |
| Total | 226 (94.2%) | 171 (50.9%) |
Income Below Poverty Among Married-Couple Families in Cankton
The poverty statistics for married-couple families in Cankton show that 3.5% or 3 of the total 86 families live below the poverty line. Families with no children have the highest poverty rate of 6.7%, comprising of 3 families. On the other hand, families with 1 or 2 children have the lowest poverty rate of 0.0%, which includes 0 families.
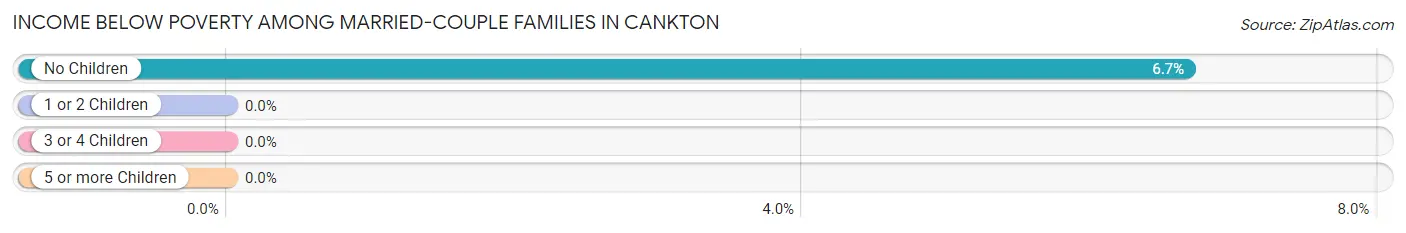
| Children | Above Poverty | Below Poverty |
| No Children | 42 (93.3%) | 3 (6.7%) |
| 1 or 2 Children | 40 (100.0%) | 0 (0.0%) |
| 3 or 4 Children | 1 (100.0%) | 0 (0.0%) |
| 5 or more Children | 0 (0.0%) | 0 (0.0%) |
| Total | 83 (96.5%) | 3 (3.5%) |
Income Below Poverty Among Single-Parent Households in Cankton
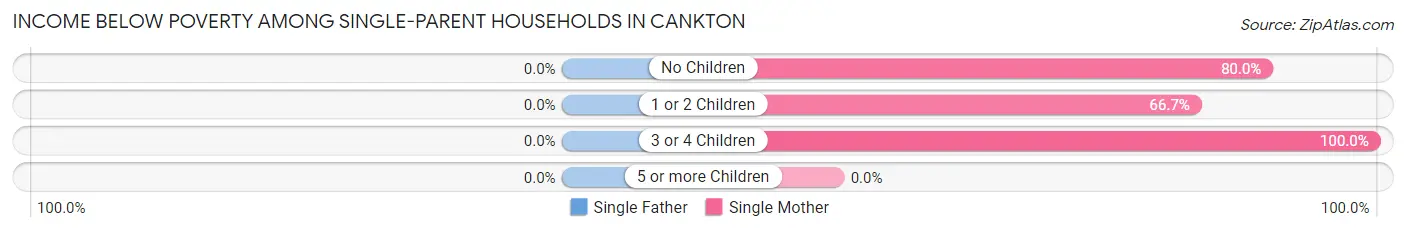
| Children | Single Father | Single Mother |
| No Children | 0 (0.0%) | 8 (80.0%) |
| 1 or 2 Children | 0 (0.0%) | 32 (66.7%) |
| 3 or 4 Children | 0 (0.0%) | 3 (100.0%) |
| 5 or more Children | 0 (0.0%) | 0 (0.0%) |
| Total | 0 (0.0%) | 43 (70.5%) |
Income Below Poverty Among Married-Couple vs Single-Parent Households in Cankton
The poverty data for Cankton shows that 3 of the married-couple family households (3.5%) and 43 of the single-parent households (66.1%) are living below the poverty level. Within the married-couple family households, those with no children have the highest poverty rate, with 3 households (6.7%) falling below the poverty line. Among the single-parent households, those with 3 or 4 children have the highest poverty rate, with 3 household (100.0%) living below poverty.
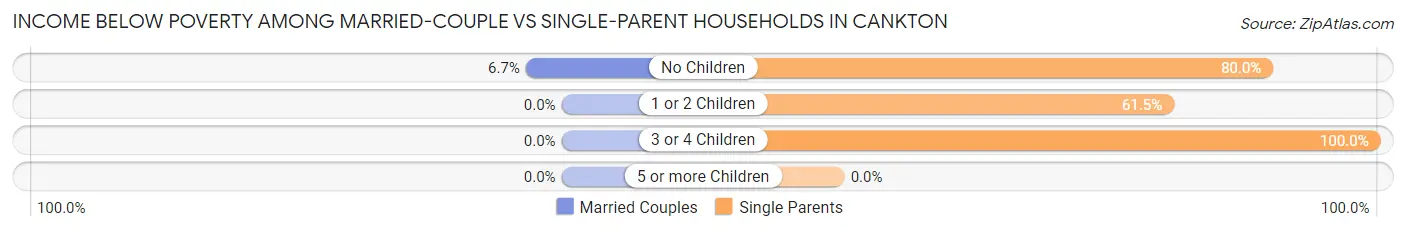
| Children | Married-Couple Families | Single-Parent Households |
| No Children | 3 (6.7%) | 8 (80.0%) |
| 1 or 2 Children | 0 (0.0%) | 32 (61.5%) |
| 3 or 4 Children | 0 (0.0%) | 3 (100.0%) |
| 5 or more Children | 0 (0.0%) | 0 (0.0%) |
| Total | 3 (3.5%) | 43 (66.1%) |
Race in Cankton
The most populous races in Cankton are White / Caucasian (513 | 89.1%), Black / African American (45 | 7.8%), and Hispanic or Latino (18 | 3.1%).
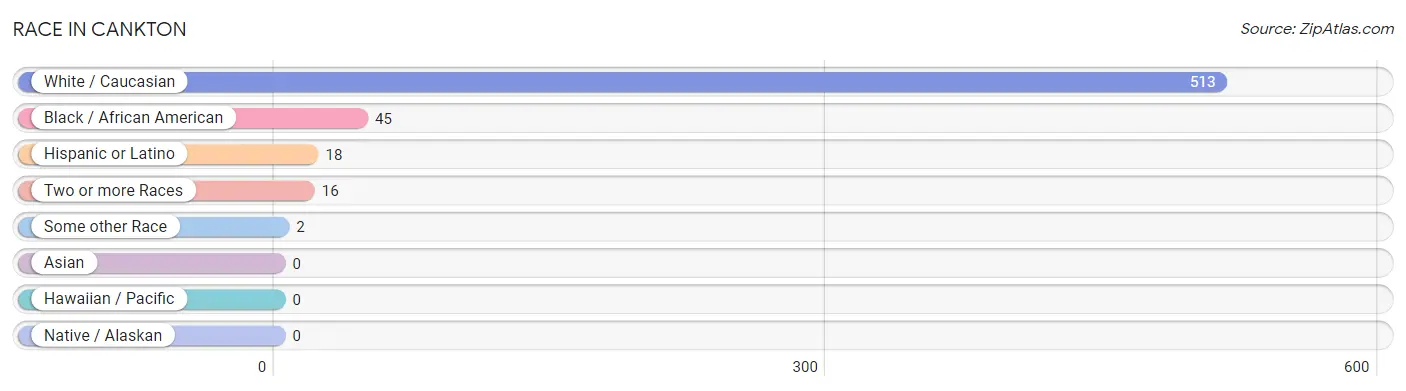
| Race | # Population | % Population |
| Asian | 0 | 0.0% |
| Black / African American | 45 | 7.8% |
| Hawaiian / Pacific | 0 | 0.0% |
| Hispanic or Latino | 18 | 3.1% |
| Native / Alaskan | 0 | 0.0% |
| White / Caucasian | 513 | 89.1% |
| Two or more Races | 16 | 2.8% |
| Some other Race | 2 | 0.4% |
| Total | 576 | 100.0% |
Ancestry in Cankton
The most populous ancestries reported in Cankton are French Canadian (269 | 46.7%), German (75 | 13.0%), French (59 | 10.2%), English (23 | 4.0%), and American (22 | 3.8%), together accounting for 77.8% of all Cankton residents.
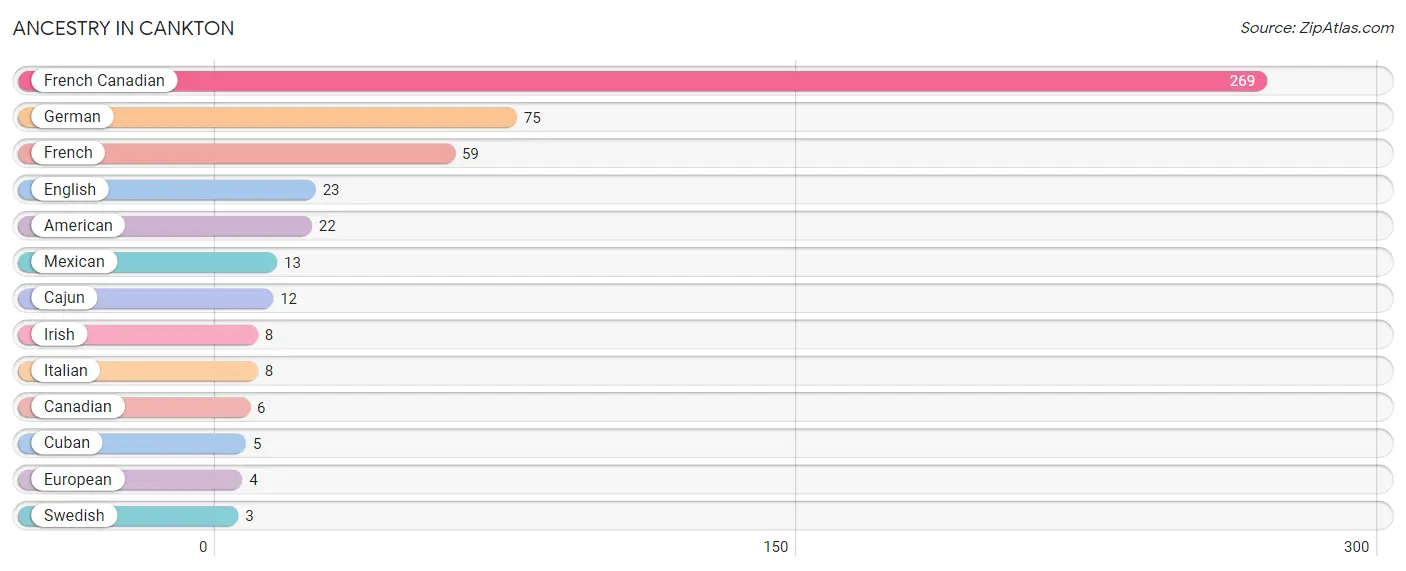
| Ancestry | # Population | % Population |
| American | 22 | 3.8% |
| Cajun | 12 | 2.1% |
| Canadian | 6 | 1.0% |
| Cuban | 5 | 0.9% |
| English | 23 | 4.0% |
| European | 4 | 0.7% |
| French | 59 | 10.2% |
| French Canadian | 269 | 46.7% |
| German | 75 | 13.0% |
| Irish | 8 | 1.4% |
| Italian | 8 | 1.4% |
| Mexican | 13 | 2.3% |
| Swedish | 3 | 0.5% | View All 13 Rows |
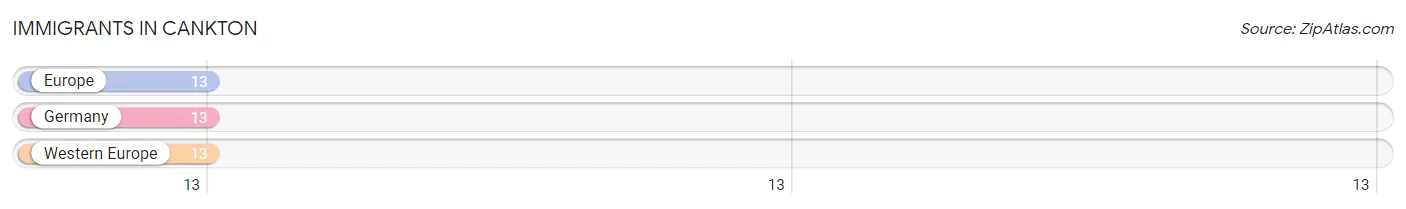
Immigrants in Cankton
The most numerous immigrant groups reported in Cankton came from Europe (13 | 2.3%), Germany (13 | 2.3%), and Western Europe (13 | 2.3%), together accounting for 6.8% of all Cankton residents.
| Immigration Origin | # Population | % Population |
| Europe | 13 | 2.3% |
| Germany | 13 | 2.3% |
| Western Europe | 13 | 2.3% | View All 3 Rows |
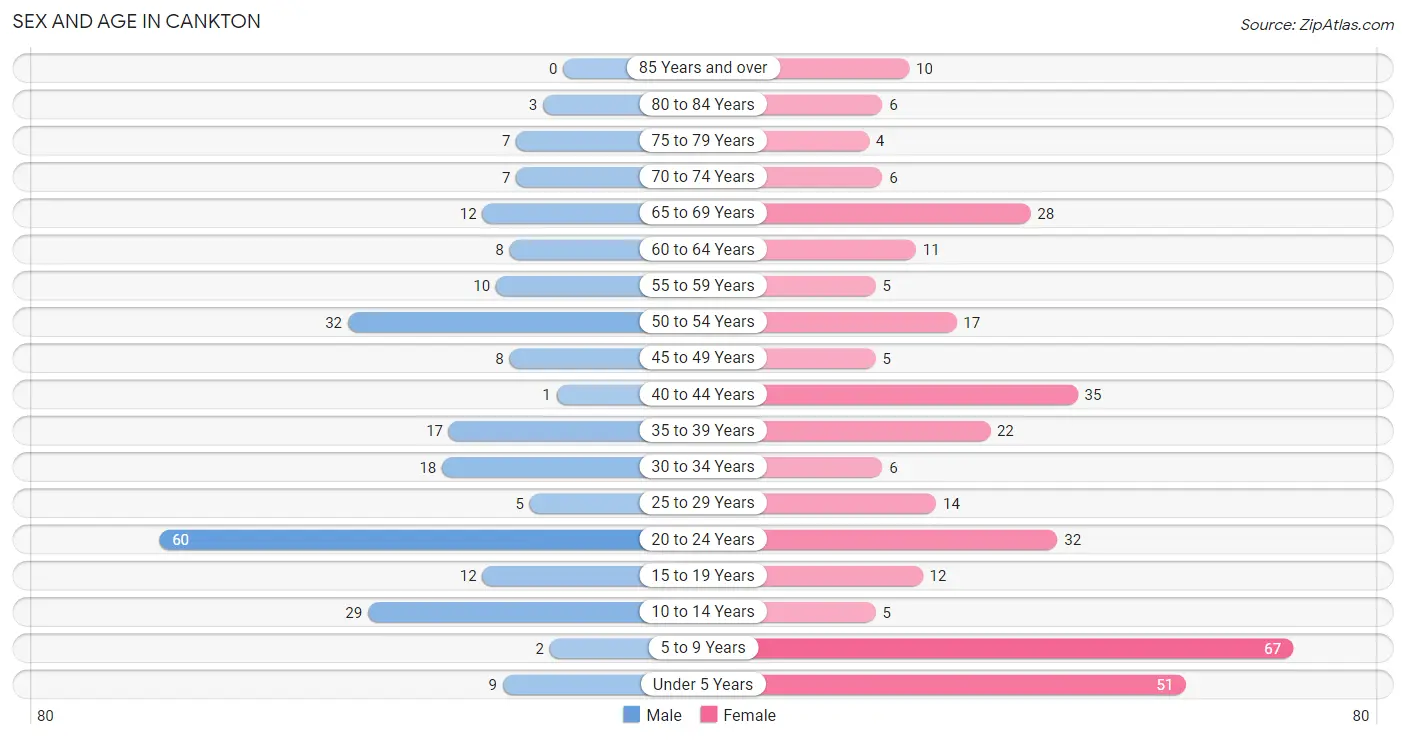
Sex and Age in Cankton
Sex and Age in Cankton
The most populous age groups in Cankton are 20 to 24 Years (60 | 25.0%) for men and 5 to 9 Years (67 | 19.9%) for women.
| Age Bracket | Male | Female |
| Under 5 Years | 9 (3.7%) | 51 (15.2%) |
| 5 to 9 Years | 2 (0.8%) | 67 (19.9%) |
| 10 to 14 Years | 29 (12.1%) | 5 (1.5%) |
| 15 to 19 Years | 12 (5.0%) | 12 (3.6%) |
| 20 to 24 Years | 60 (25.0%) | 32 (9.5%) |
| 25 to 29 Years | 5 (2.1%) | 14 (4.2%) |
| 30 to 34 Years | 18 (7.5%) | 6 (1.8%) |
| 35 to 39 Years | 17 (7.1%) | 22 (6.6%) |
| 40 to 44 Years | 1 (0.4%) | 35 (10.4%) |
| 45 to 49 Years | 8 (3.3%) | 5 (1.5%) |
| 50 to 54 Years | 32 (13.3%) | 17 (5.1%) |
| 55 to 59 Years | 10 (4.2%) | 5 (1.5%) |
| 60 to 64 Years | 8 (3.3%) | 11 (3.3%) |
| 65 to 69 Years | 12 (5.0%) | 28 (8.3%) |
| 70 to 74 Years | 7 (2.9%) | 6 (1.8%) |
| 75 to 79 Years | 7 (2.9%) | 4 (1.2%) |
| 80 to 84 Years | 3 (1.3%) | 6 (1.8%) |
| 85 Years and over | 0 (0.0%) | 10 (3.0%) |
| Total | 240 (100.0%) | 336 (100.0%) |
Families and Households in Cankton
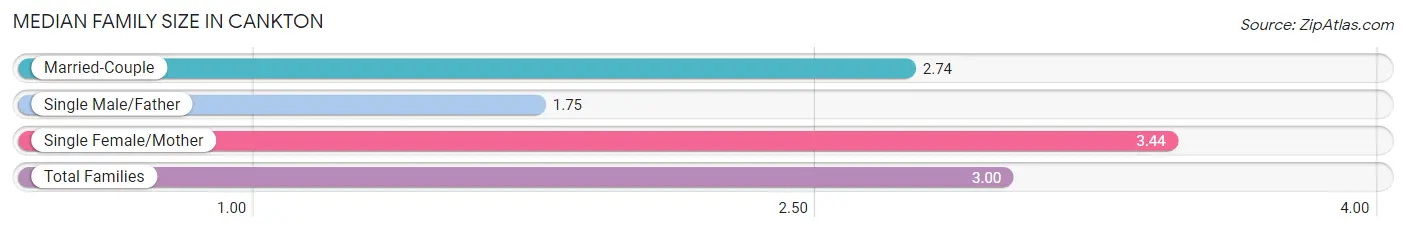
Median Family Size in Cankton
The median family size in Cankton is 3.00 persons per family, with single female/mother families (61 | 40.4%) accounting for the largest median family size of 3.44 persons per family. On the other hand, single male/father families (4 | 2.6%) represent the smallest median family size with 1.75 persons per family.
| Family Type | # Families | Family Size |
| Married-Couple | 86 (57.0%) | 2.74 |
| Single Male/Father | 4 (2.6%) | 1.75 |
| Single Female/Mother | 61 (40.4%) | 3.44 |
| Total Families | 151 (100.0%) | 3.00 |
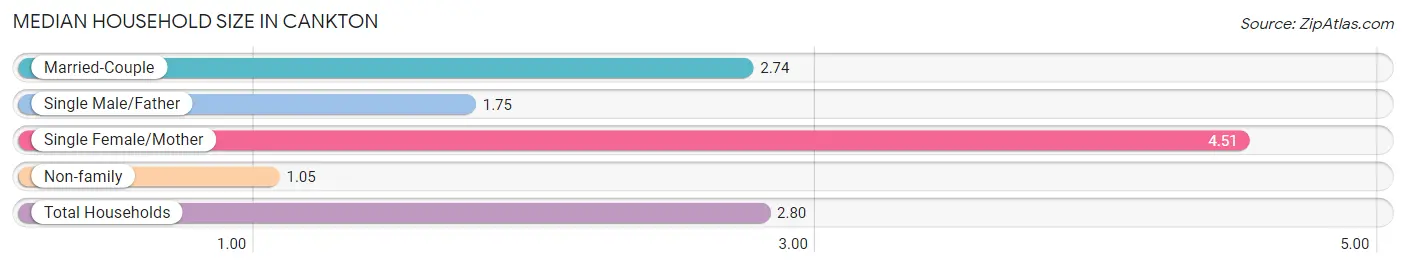
Median Household Size in Cankton
The median household size in Cankton is 2.80 persons per household, with single female/mother households (61 | 29.6%) accounting for the largest median household size of 4.51 persons per household. non-family households (55 | 26.7%) represent the smallest median household size with 1.05 persons per household.
| Household Type | # Households | Household Size |
| Married-Couple | 86 (41.7%) | 2.74 |
| Single Male/Father | 4 (1.9%) | 1.75 |
| Single Female/Mother | 61 (29.6%) | 4.51 |
| Non-family | 55 (26.7%) | 1.05 |
| Total Households | 206 (100.0%) | 2.80 |
Household Size by Marriage Status in Cankton
Out of a total of 206 households in Cankton, 151 (73.3%) are family households, while 55 (26.7%) are nonfamily households. The most numerous type of family households are 2-person households, comprising 60, and the most common type of nonfamily households are 1-person households, comprising 52.
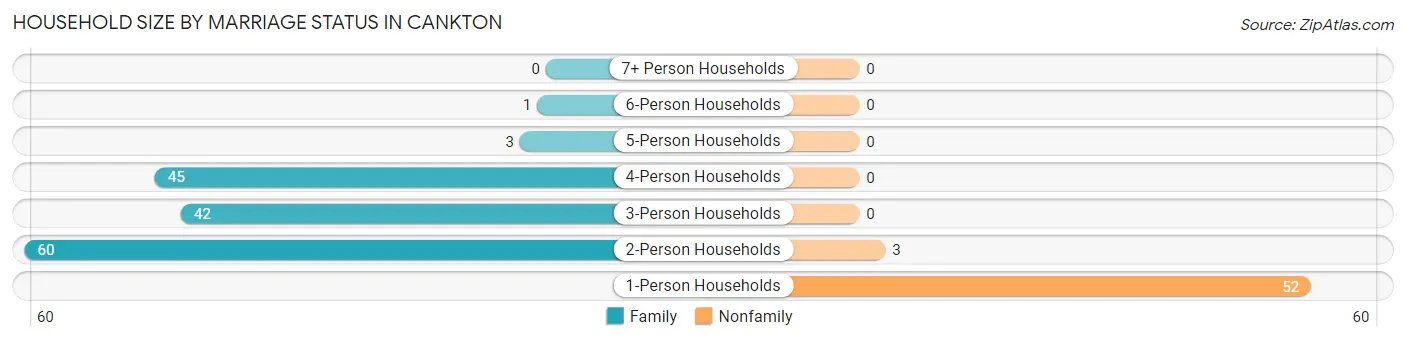
| Household Size | Family Households | Nonfamily Households |
| 1-Person Households | - | 52 (25.2%) |
| 2-Person Households | 60 (29.1%) | 3 (1.5%) |
| 3-Person Households | 42 (20.4%) | 0 (0.0%) |
| 4-Person Households | 45 (21.8%) | 0 (0.0%) |
| 5-Person Households | 3 (1.5%) | 0 (0.0%) |
| 6-Person Households | 1 (0.5%) | 0 (0.0%) |
| 7+ Person Households | 0 (0.0%) | 0 (0.0%) |
| Total | 151 (73.3%) | 55 (26.7%) |
Female Fertility in Cankton
Fertility by Age in Cankton
Average fertility rate in Cankton is 87.0 births per 1,000 women. Women in the age bracket of 20 to 34 years have the highest fertility rate with 212.0 births per 1,000 women. Women in the age bracket of 20 to 34 years acount for 100.0% of all women with births.
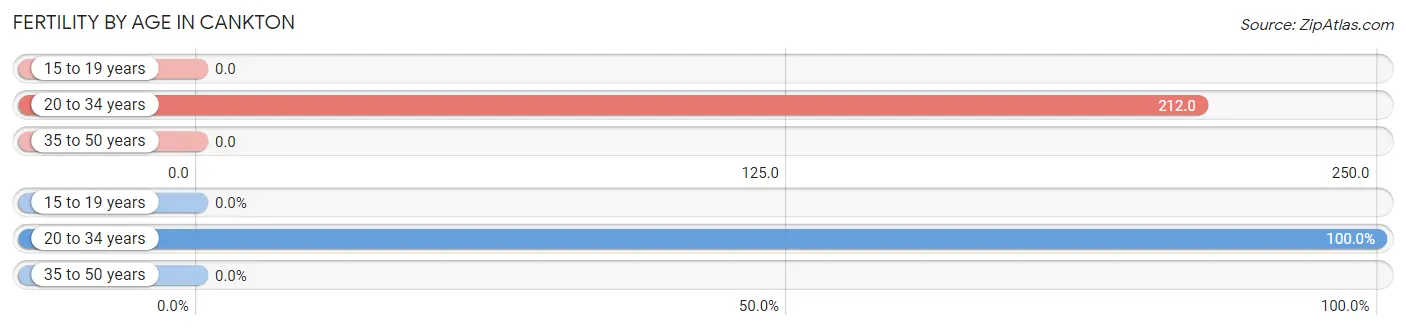
| Age Bracket | Women with Births | Births / 1,000 Women |
| 15 to 19 years | 0 (0.0%) | 0.0 |
| 20 to 34 years | 11 (100.0%) | 212.0 |
| 35 to 50 years | 0 (0.0%) | 0.0 |
| Total | 11 (100.0%) | 87.0 |
Fertility by Age by Marriage Status in Cankton
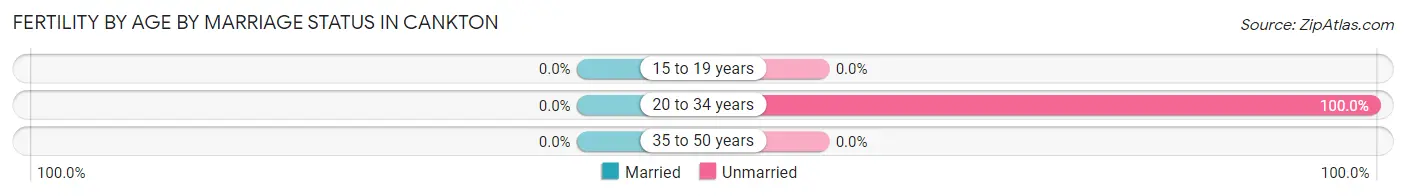
| Age Bracket | Married | Unmarried |
| 15 to 19 years | 0 (0.0%) | 0 (0.0%) |
| 20 to 34 years | 0 (0.0%) | 11 (100.0%) |
| 35 to 50 years | 0 (0.0%) | 0 (0.0%) |
| Total | 0 (0.0%) | 11 (100.0%) |
Fertility by Education in Cankton
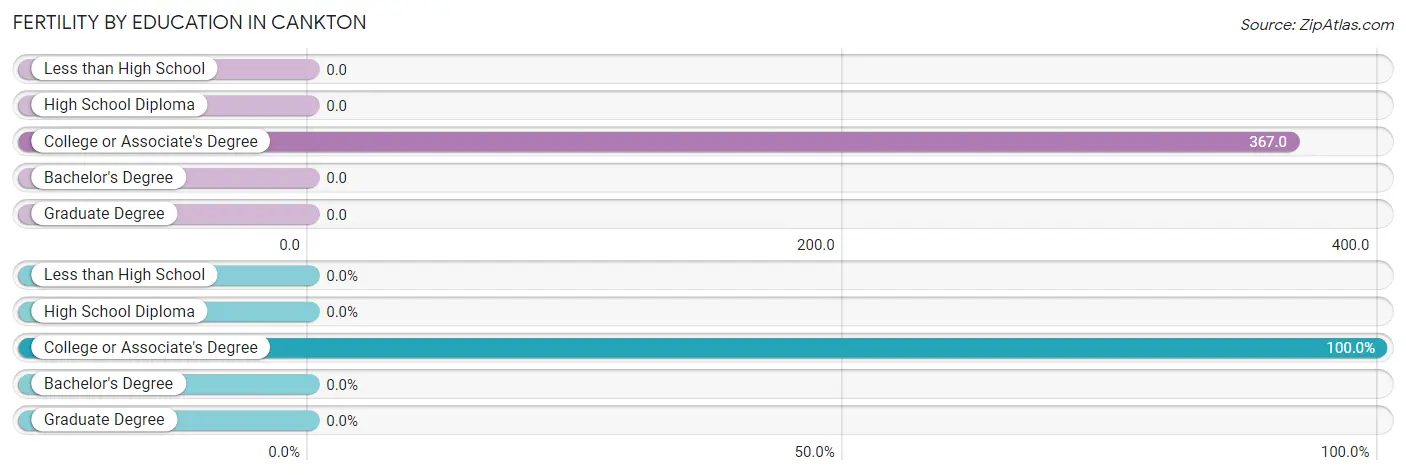
| Educational Attainment | Women with Births | Births / 1,000 Women |
| Less than High School | 0 (0.0%) | 0.0 |
| High School Diploma | 0 (0.0%) | 0.0 |
| College or Associate's Degree | 11 (100.0%) | 367.0 |
| Bachelor's Degree | 0 (0.0%) | 0.0 |
| Graduate Degree | 0 (0.0%) | 0.0 |
| Total | 11 (100.0%) | 87.0 |
Fertility by Education by Marriage Status in Cankton
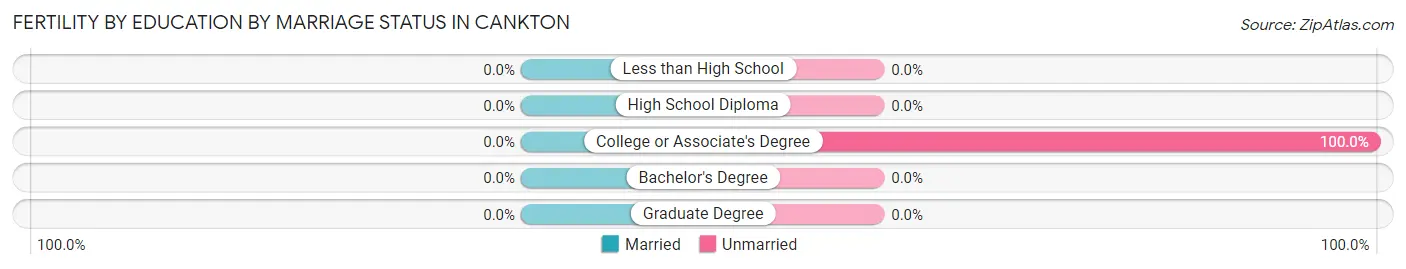
| Educational Attainment | Married | Unmarried |
| Less than High School | 0 (0.0%) | 0 (0.0%) |
| High School Diploma | 0 (0.0%) | 0 (0.0%) |
| College or Associate's Degree | 0 (0.0%) | 11 (100.0%) |
| Bachelor's Degree | 0 (0.0%) | 0 (0.0%) |
| Graduate Degree | 0 (0.0%) | 0 (0.0%) |
| Total | 0 (0.0%) | 11 (100.0%) |
Employment Characteristics in Cankton
Employment by Class of Employer in Cankton
Among the 256 employed individuals in Cankton, private company employees (211 | 82.4%), local government employees (25 | 9.8%), and self-employed (incorporated) (8 | 3.1%) make up the most common classes of employment.
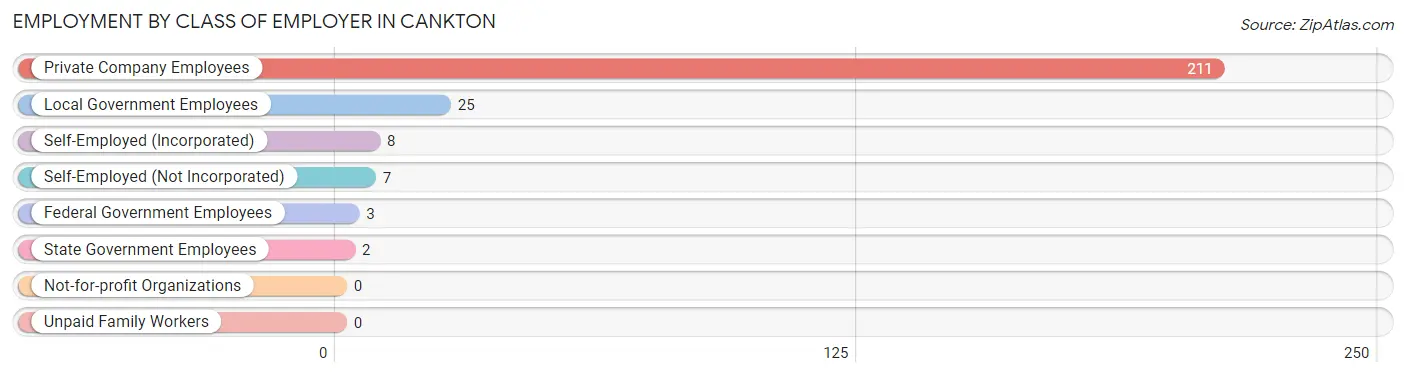
| Employer Class | # Employees | % Employees |
| Private Company Employees | 211 | 82.4% |
| Self-Employed (Incorporated) | 8 | 3.1% |
| Self-Employed (Not Incorporated) | 7 | 2.7% |
| Not-for-profit Organizations | 0 | 0.0% |
| Local Government Employees | 25 | 9.8% |
| State Government Employees | 2 | 0.8% |
| Federal Government Employees | 3 | 1.2% |
| Unpaid Family Workers | 0 | 0.0% |
| Total | 256 | 100.0% |
Employment Status by Age in Cankton
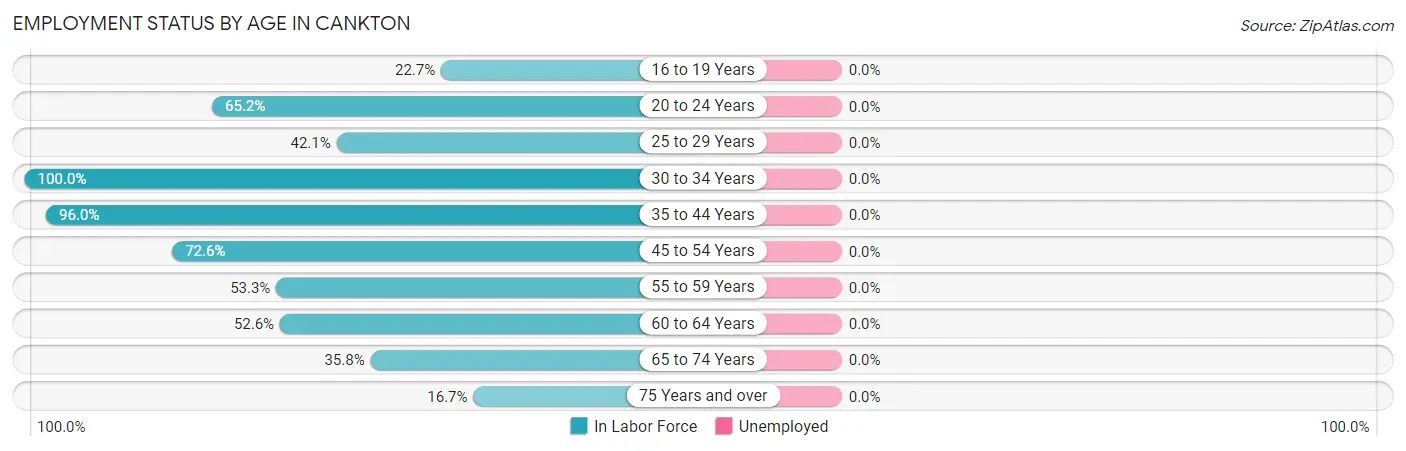
| Age Bracket | In Labor Force | Unemployed |
| 16 to 19 Years | 5 (22.7%) | 0 (0.0%) |
| 20 to 24 Years | 60 (65.2%) | 0 (0.0%) |
| 25 to 29 Years | 8 (42.1%) | 0 (0.0%) |
| 30 to 34 Years | 24 (100.0%) | 0 (0.0%) |
| 35 to 44 Years | 72 (96.0%) | 0 (0.0%) |
| 45 to 54 Years | 45 (72.6%) | 0 (0.0%) |
| 55 to 59 Years | 8 (53.3%) | 0 (0.0%) |
| 60 to 64 Years | 10 (52.6%) | 0 (0.0%) |
| 65 to 74 Years | 19 (35.8%) | 0 (0.0%) |
| 75 Years and over | 5 (16.7%) | 0 (0.0%) |
| Total | 256 (62.3%) | 0 (0.0%) |
Employment Status by Educational Attainment in Cankton
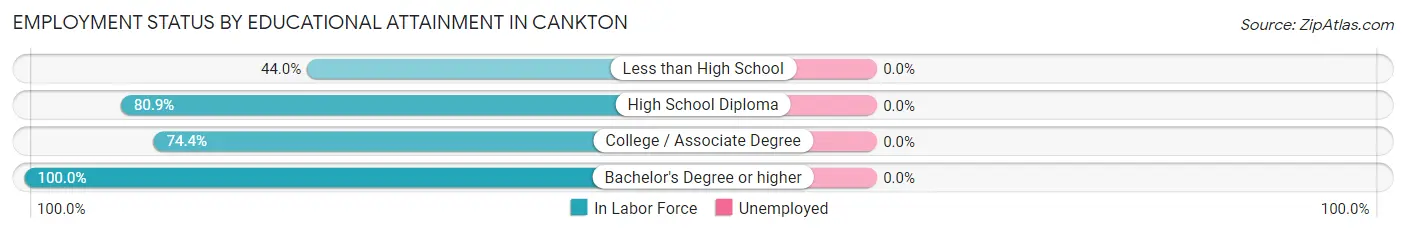
| Educational Attainment | In Labor Force | Unemployed |
| Less than High School | 11 (44.0%) | 0 (0.0%) |
| High School Diploma | 93 (80.9%) | 0 (0.0%) |
| College / Associate Degree | 32 (74.4%) | 0 (0.0%) |
| Bachelor's Degree or higher | 31 (100.0%) | 0 (0.0%) |
| Total | 167 (78.0%) | 0 (0.0%) |
Employment Occupations by Sex in Cankton
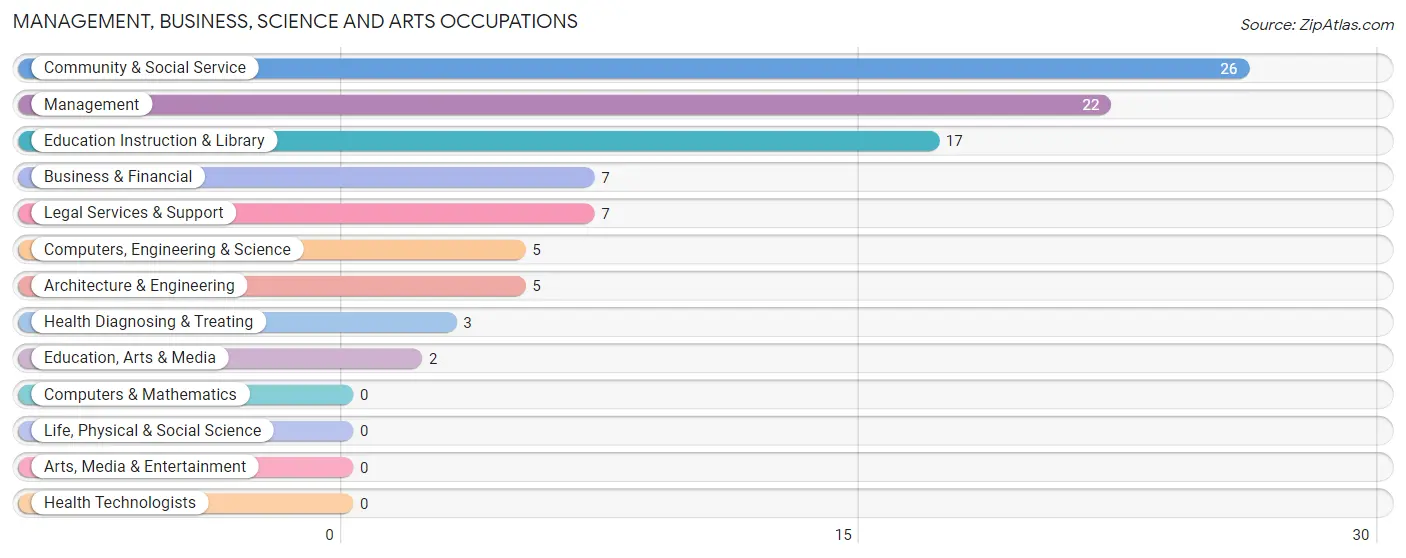
Management, Business, Science and Arts Occupations
The most common Management, Business, Science and Arts occupations in Cankton are Community & Social Service (26 | 10.3%), Management (22 | 8.7%), Education Instruction & Library (17 | 6.7%), Business & Financial (7 | 2.8%), and Legal Services & Support (7 | 2.8%).
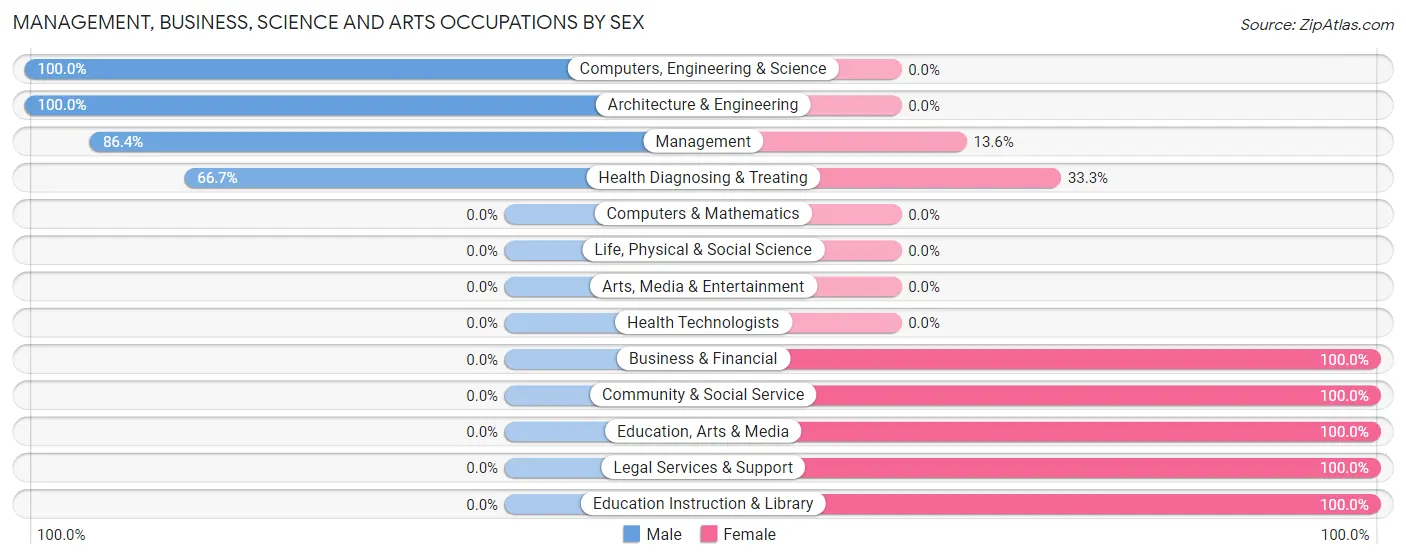
Management, Business, Science and Arts Occupations by Sex
Within the Management, Business, Science and Arts occupations in Cankton, the most male-oriented occupations are Computers, Engineering & Science (100.0%), Architecture & Engineering (100.0%), and Management (86.4%), while the most female-oriented occupations are Business & Financial (100.0%), Community & Social Service (100.0%), and Education, Arts & Media (100.0%).
| Occupation | Male | Female |
| Management | 19 (86.4%) | 3 (13.6%) |
| Business & Financial | 0 (0.0%) | 7 (100.0%) |
| Computers, Engineering & Science | 5 (100.0%) | 0 (0.0%) |
| Computers & Mathematics | 0 (0.0%) | 0 (0.0%) |
| Architecture & Engineering | 5 (100.0%) | 0 (0.0%) |
| Life, Physical & Social Science | 0 (0.0%) | 0 (0.0%) |
| Community & Social Service | 0 (0.0%) | 26 (100.0%) |
| Education, Arts & Media | 0 (0.0%) | 2 (100.0%) |
| Legal Services & Support | 0 (0.0%) | 7 (100.0%) |
| Education Instruction & Library | 0 (0.0%) | 17 (100.0%) |
| Arts, Media & Entertainment | 0 (0.0%) | 0 (0.0%) |
| Health Diagnosing & Treating | 2 (66.7%) | 1 (33.3%) |
| Health Technologists | 0 (0.0%) | 0 (0.0%) |
| Total (Category) | 26 (41.3%) | 37 (58.7%) |
| Total (Overall) | 145 (57.3%) | 108 (42.7%) |
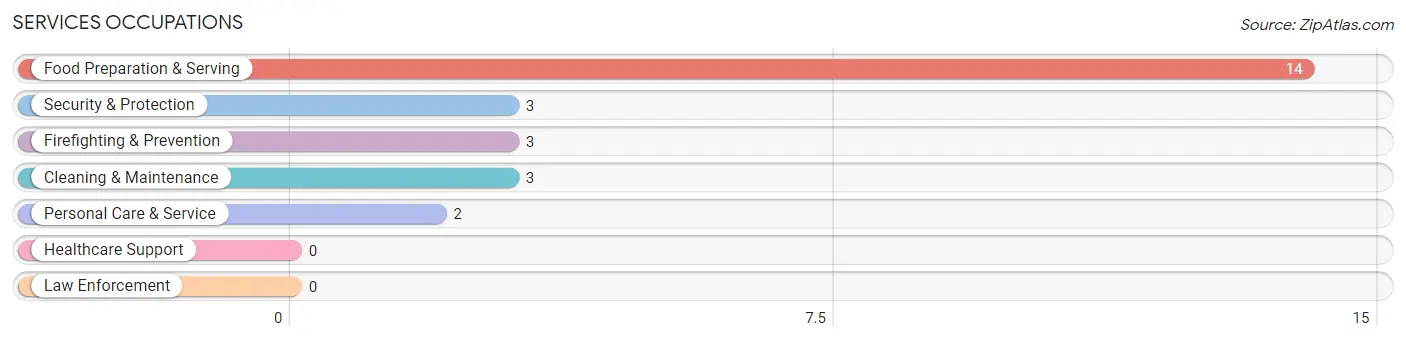
Services Occupations
The most common Services occupations in Cankton are Food Preparation & Serving (14 | 5.5%), Security & Protection (3 | 1.2%), Firefighting & Prevention (3 | 1.2%), Cleaning & Maintenance (3 | 1.2%), and Personal Care & Service (2 | 0.8%).
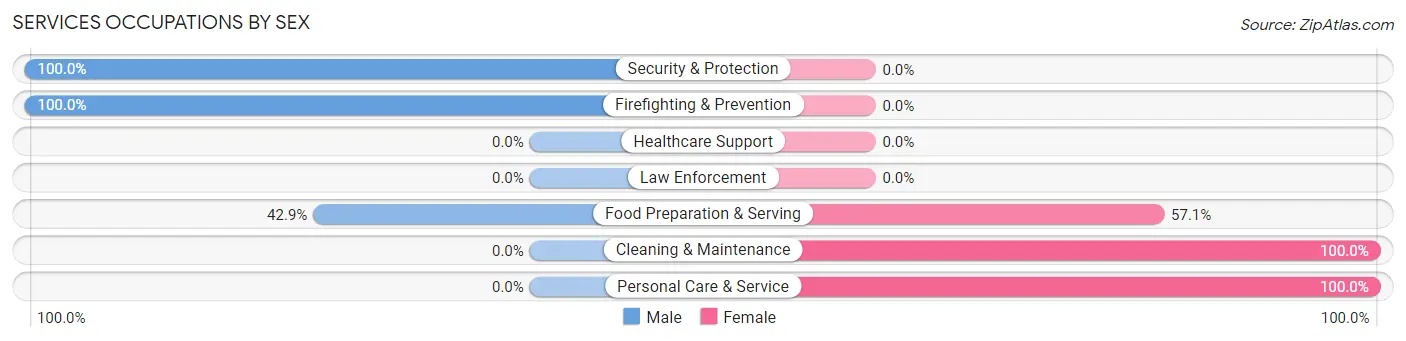
Services Occupations by Sex
Within the Services occupations in Cankton, the most male-oriented occupations are Security & Protection (100.0%), Firefighting & Prevention (100.0%), and Food Preparation & Serving (42.9%), while the most female-oriented occupations are Cleaning & Maintenance (100.0%), Personal Care & Service (100.0%), and Food Preparation & Serving (57.1%).
| Occupation | Male | Female |
| Healthcare Support | 0 (0.0%) | 0 (0.0%) |
| Security & Protection | 3 (100.0%) | 0 (0.0%) |
| Firefighting & Prevention | 3 (100.0%) | 0 (0.0%) |
| Law Enforcement | 0 (0.0%) | 0 (0.0%) |
| Food Preparation & Serving | 6 (42.9%) | 8 (57.1%) |
| Cleaning & Maintenance | 0 (0.0%) | 3 (100.0%) |
| Personal Care & Service | 0 (0.0%) | 2 (100.0%) |
| Total (Category) | 9 (40.9%) | 13 (59.1%) |
| Total (Overall) | 145 (57.3%) | 108 (42.7%) |
Sales and Office Occupations
The most common Sales and Office occupations in Cankton are Office & Administration (42 | 16.6%), and Sales & Related (25 | 9.9%).
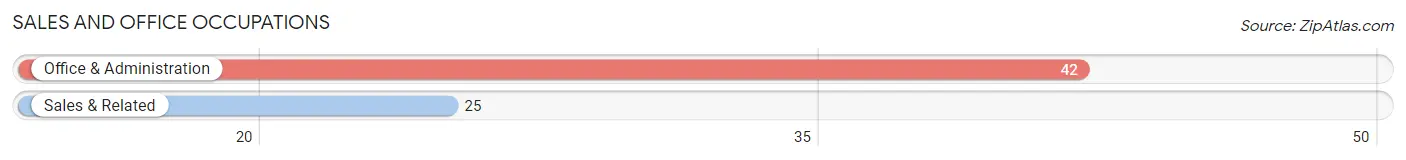
Sales and Office Occupations by Sex
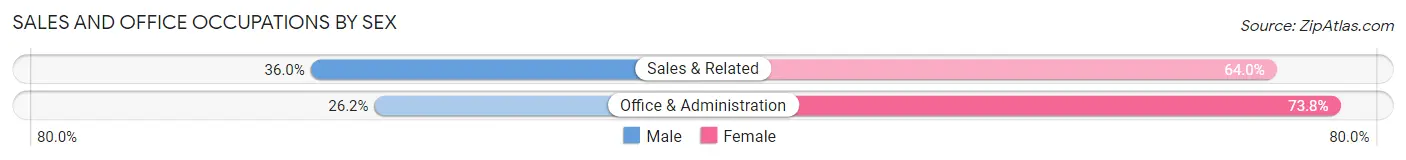
| Occupation | Male | Female |
| Sales & Related | 9 (36.0%) | 16 (64.0%) |
| Office & Administration | 11 (26.2%) | 31 (73.8%) |
| Total (Category) | 20 (29.8%) | 47 (70.2%) |
| Total (Overall) | 145 (57.3%) | 108 (42.7%) |
Natural Resources, Construction and Maintenance Occupations
The most common Natural Resources, Construction and Maintenance occupations in Cankton are Construction & Extraction (14 | 5.5%), and Installation, Maintenance & Repair (12 | 4.7%).
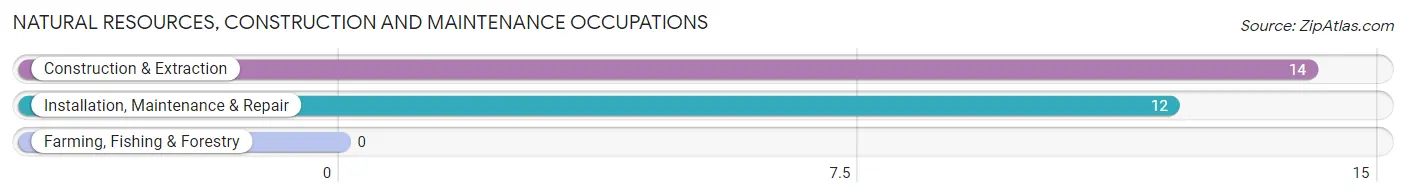
Natural Resources, Construction and Maintenance Occupations by Sex
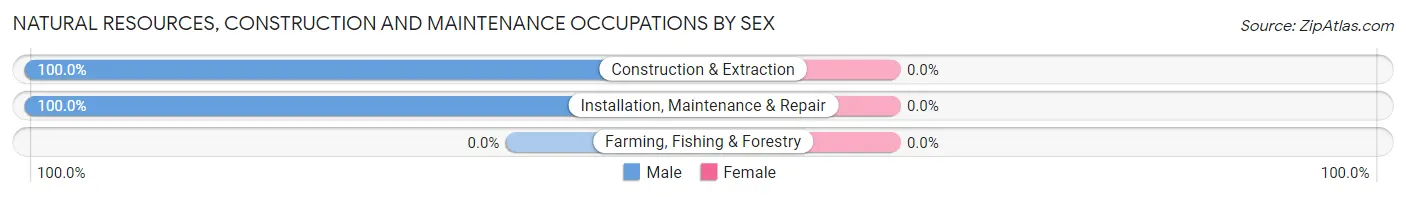
| Occupation | Male | Female |
| Farming, Fishing & Forestry | 0 (0.0%) | 0 (0.0%) |
| Construction & Extraction | 14 (100.0%) | 0 (0.0%) |
| Installation, Maintenance & Repair | 12 (100.0%) | 0 (0.0%) |
| Total (Category) | 26 (100.0%) | 0 (0.0%) |
| Total (Overall) | 145 (57.3%) | 108 (42.7%) |
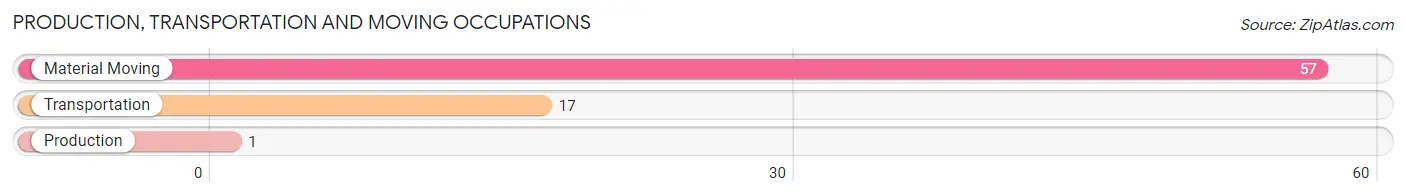
Production, Transportation and Moving Occupations
The most common Production, Transportation and Moving occupations in Cankton are Material Moving (57 | 22.5%), Transportation (17 | 6.7%), and Production (1 | 0.4%).
Production, Transportation and Moving Occupations by Sex
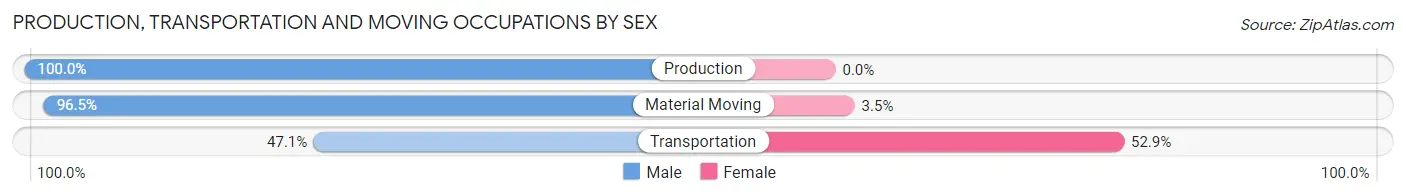
| Occupation | Male | Female |
| Production | 1 (100.0%) | 0 (0.0%) |
| Transportation | 8 (47.1%) | 9 (52.9%) |
| Material Moving | 55 (96.5%) | 2 (3.5%) |
| Total (Category) | 64 (85.3%) | 11 (14.7%) |
| Total (Overall) | 145 (57.3%) | 108 (42.7%) |
Employment Industries by Sex in Cankton
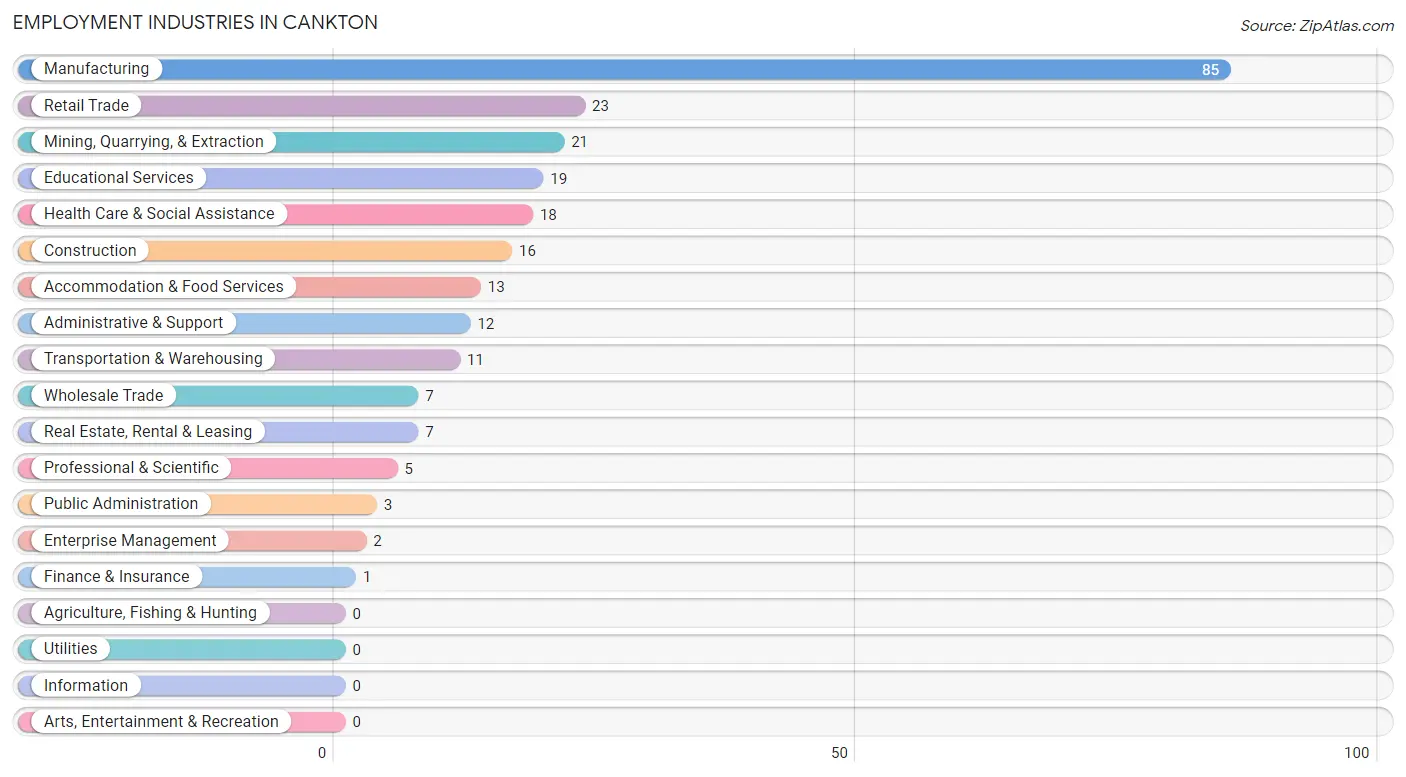
Employment Industries in Cankton
The major employment industries in Cankton include Manufacturing (85 | 33.6%), Retail Trade (23 | 9.1%), Mining, Quarrying, & Extraction (21 | 8.3%), Educational Services (19 | 7.5%), and Health Care & Social Assistance (18 | 7.1%).
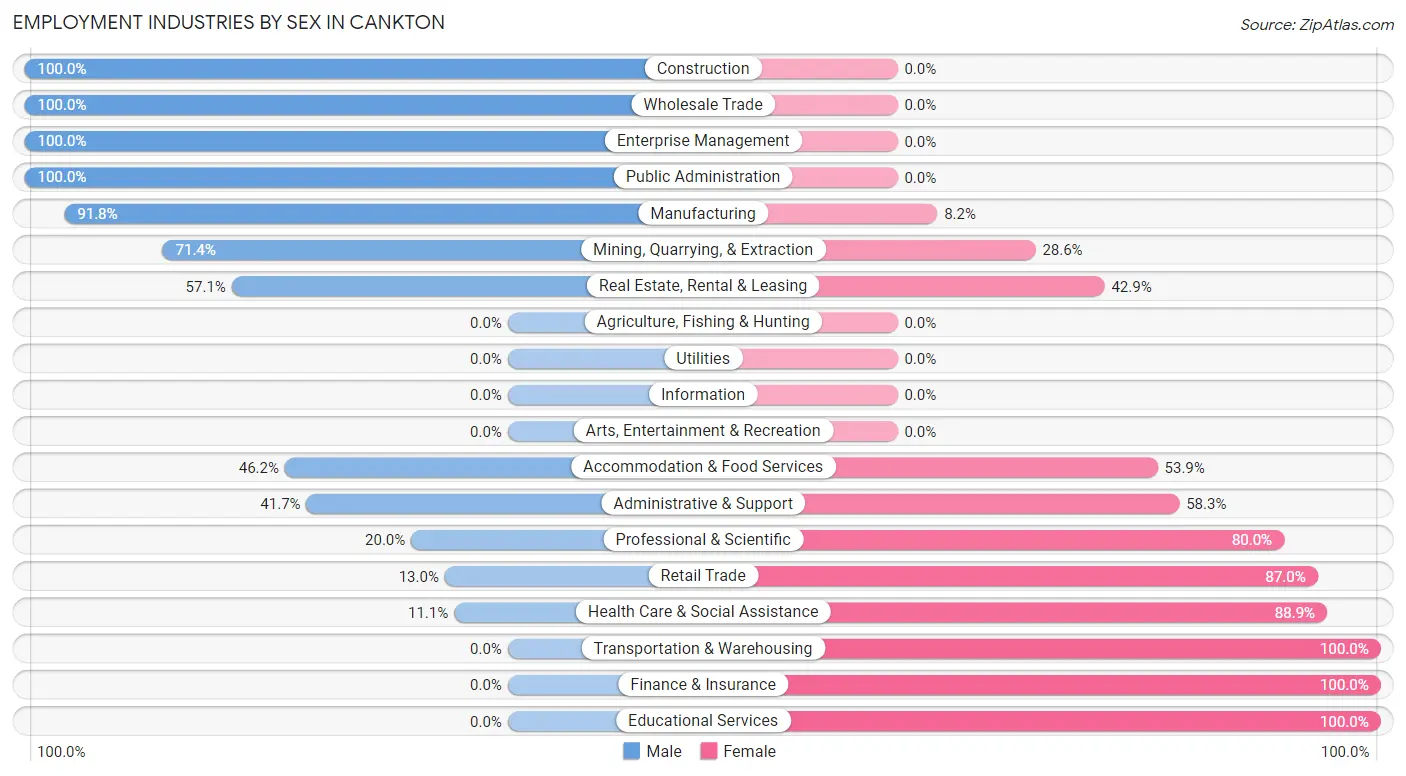
Employment Industries by Sex in Cankton
The Cankton industries that see more men than women are Construction (100.0%), Wholesale Trade (100.0%), and Enterprise Management (100.0%), whereas the industries that tend to have a higher number of women are Transportation & Warehousing (100.0%), Finance & Insurance (100.0%), and Educational Services (100.0%).
| Industry | Male | Female |
| Agriculture, Fishing & Hunting | 0 (0.0%) | 0 (0.0%) |
| Mining, Quarrying, & Extraction | 15 (71.4%) | 6 (28.6%) |
| Construction | 16 (100.0%) | 0 (0.0%) |
| Manufacturing | 78 (91.8%) | 7 (8.2%) |
| Wholesale Trade | 7 (100.0%) | 0 (0.0%) |
| Retail Trade | 3 (13.0%) | 20 (87.0%) |
| Transportation & Warehousing | 0 (0.0%) | 11 (100.0%) |
| Utilities | 0 (0.0%) | 0 (0.0%) |
| Information | 0 (0.0%) | 0 (0.0%) |
| Finance & Insurance | 0 (0.0%) | 1 (100.0%) |
| Real Estate, Rental & Leasing | 4 (57.1%) | 3 (42.9%) |
| Professional & Scientific | 1 (20.0%) | 4 (80.0%) |
| Enterprise Management | 2 (100.0%) | 0 (0.0%) |
| Administrative & Support | 5 (41.7%) | 7 (58.3%) |
| Educational Services | 0 (0.0%) | 19 (100.0%) |
| Health Care & Social Assistance | 2 (11.1%) | 16 (88.9%) |
| Arts, Entertainment & Recreation | 0 (0.0%) | 0 (0.0%) |
| Accommodation & Food Services | 6 (46.2%) | 7 (53.8%) |
| Public Administration | 3 (100.0%) | 0 (0.0%) |
| Total | 145 (57.3%) | 108 (42.7%) |
Education in Cankton
School Enrollment in Cankton
The most common levels of schooling among the 184 students in Cankton are nursery / preschool (51 | 27.7%), kindergarten (49 | 26.6%), and middle school (34 | 18.5%).
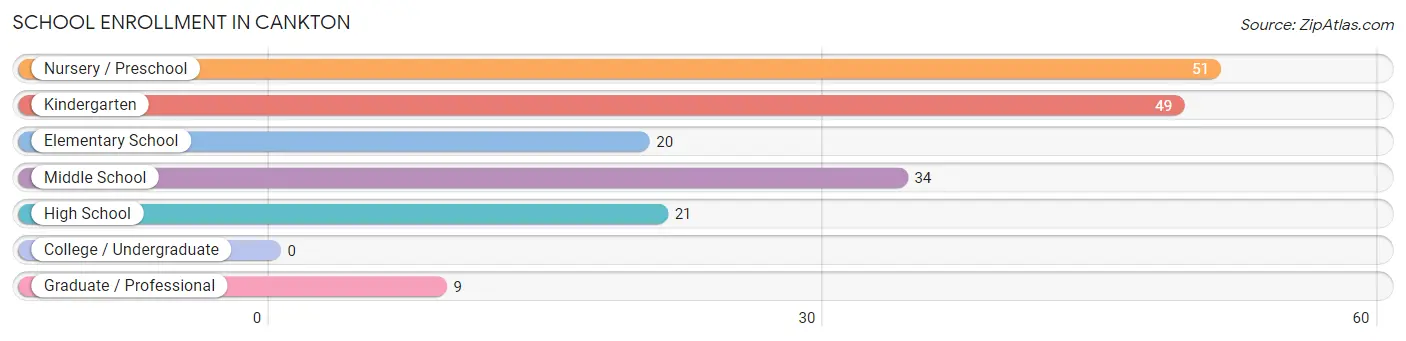
| School Level | # Students | % Students |
| Nursery / Preschool | 51 | 27.7% |
| Kindergarten | 49 | 26.6% |
| Elementary School | 20 | 10.9% |
| Middle School | 34 | 18.5% |
| High School | 21 | 11.4% |
| College / Undergraduate | 0 | 0.0% |
| Graduate / Professional | 9 | 4.9% |
| Total | 184 | 100.0% |
School Enrollment by Age by Funding Source in Cankton
Out of a total of 184 students who are enrolled in schools in Cankton, 20 (10.9%) attend a private institution, while the remaining 164 (89.1%) are enrolled in public schools. The age group of 35 years and over has the highest likelihood of being enrolled in private schools, with 9 (100.0% in the age bracket) enrolled. Conversely, the age group of 10 to 14 year olds has the lowest likelihood of being enrolled in a private school, with 34 (100.0% in the age bracket) attending a public institution.
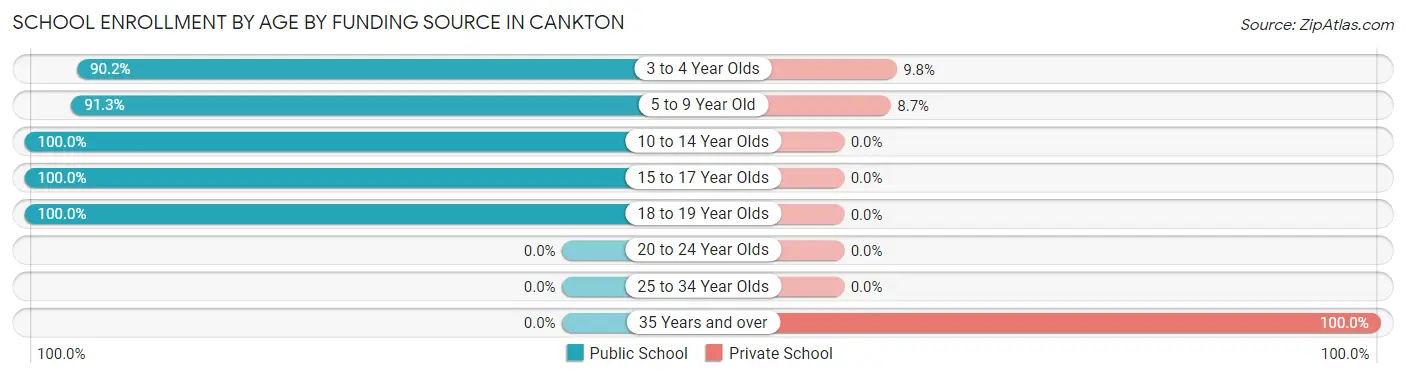
| Age Bracket | Public School | Private School |
| 3 to 4 Year Olds | 46 (90.2%) | 5 (9.8%) |
| 5 to 9 Year Old | 63 (91.3%) | 6 (8.7%) |
| 10 to 14 Year Olds | 34 (100.0%) | 0 (0.0%) |
| 15 to 17 Year Olds | 16 (100.0%) | 0 (0.0%) |
| 18 to 19 Year Olds | 5 (100.0%) | 0 (0.0%) |
| 20 to 24 Year Olds | 0 (0.0%) | 0 (0.0%) |
| 25 to 34 Year Olds | 0 (0.0%) | 0 (0.0%) |
| 35 Years and over | 0 (0.0%) | 9 (100.0%) |
| Total | 164 (89.1%) | 20 (10.9%) |
Educational Attainment by Field of Study in Cankton
Education (24 | 50.0%), business (10 | 20.8%), physical & health sciences (6 | 12.5%), engineering (4 | 8.3%), and science & technology (2 | 4.2%) are the most common fields of study among 48 individuals in Cankton who have obtained a bachelor's degree or higher.
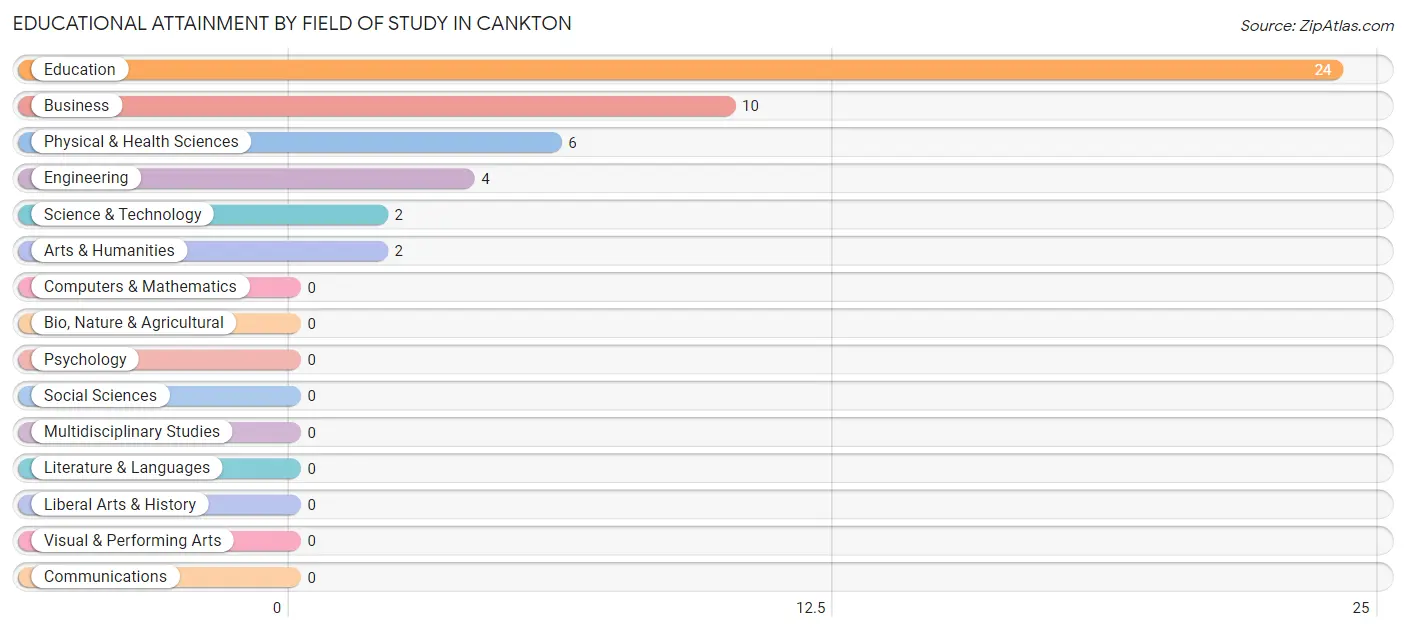
| Field of Study | # Graduates | % Graduates |
| Computers & Mathematics | 0 | 0.0% |
| Bio, Nature & Agricultural | 0 | 0.0% |
| Physical & Health Sciences | 6 | 12.5% |
| Psychology | 0 | 0.0% |
| Social Sciences | 0 | 0.0% |
| Engineering | 4 | 8.3% |
| Multidisciplinary Studies | 0 | 0.0% |
| Science & Technology | 2 | 4.2% |
| Business | 10 | 20.8% |
| Education | 24 | 50.0% |
| Literature & Languages | 0 | 0.0% |
| Liberal Arts & History | 0 | 0.0% |
| Visual & Performing Arts | 0 | 0.0% |
| Communications | 0 | 0.0% |
| Arts & Humanities | 2 | 4.2% |
| Total | 48 | 100.0% |
Transportation & Commute in Cankton
Vehicle Availability by Sex in Cankton
The most prevalent vehicle ownership categories in Cankton are males with 2 vehicles (115, accounting for 77.7%) and females with 2 vehicles (60, making up 106.5%).
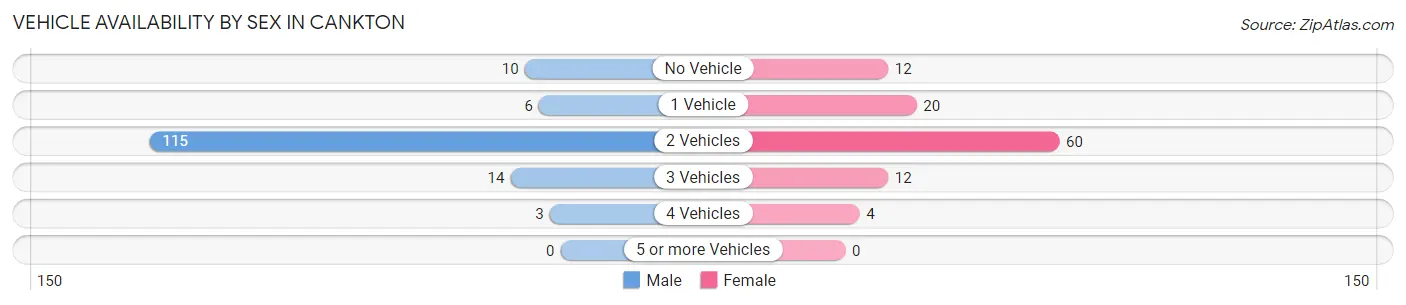
| Vehicles Available | Male | Female |
| No Vehicle | 10 (6.8%) | 12 (11.1%) |
| 1 Vehicle | 6 (4.1%) | 20 (18.5%) |
| 2 Vehicles | 115 (77.7%) | 60 (55.6%) |
| 3 Vehicles | 14 (9.5%) | 12 (11.1%) |
| 4 Vehicles | 3 (2.0%) | 4 (3.7%) |
| 5 or more Vehicles | 0 (0.0%) | 0 (0.0%) |
| Total | 148 (100.0%) | 108 (100.0%) |
Commute Time in Cankton
The most frequently occuring commute durations in Cankton are 10 to 14 minutes (72 commuters, 29.5%), 30 to 34 minutes (55 commuters, 22.5%), and 20 to 24 minutes (39 commuters, 16.0%).
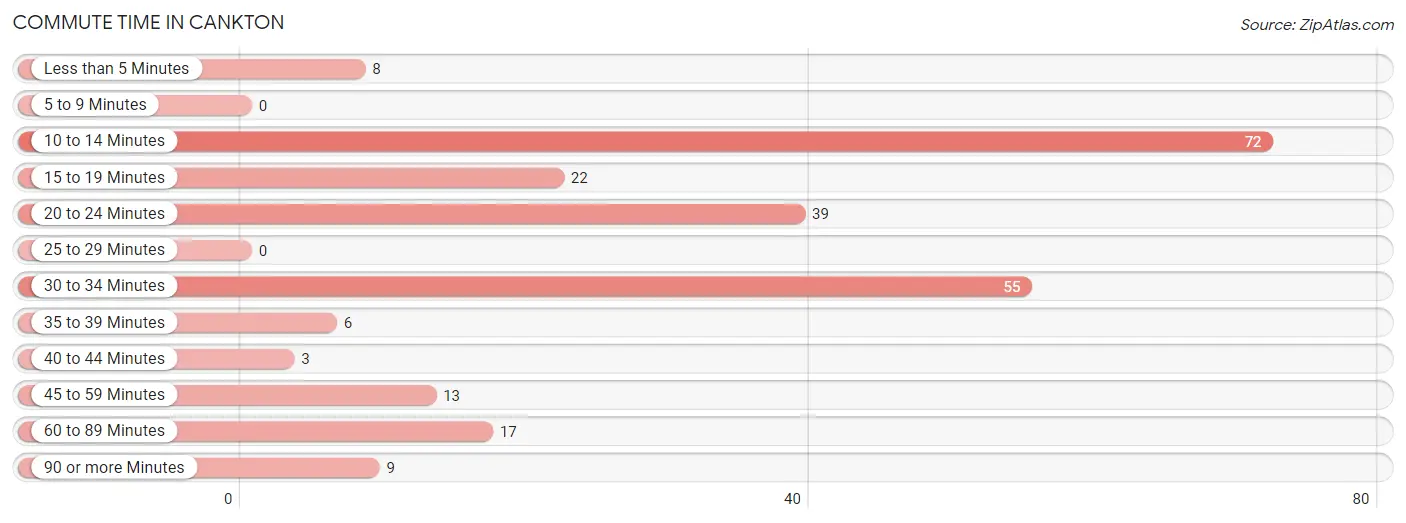
| Commute Time | # Commuters | % Commuters |
| Less than 5 Minutes | 8 | 3.3% |
| 5 to 9 Minutes | 0 | 0.0% |
| 10 to 14 Minutes | 72 | 29.5% |
| 15 to 19 Minutes | 22 | 9.0% |
| 20 to 24 Minutes | 39 | 16.0% |
| 25 to 29 Minutes | 0 | 0.0% |
| 30 to 34 Minutes | 55 | 22.5% |
| 35 to 39 Minutes | 6 | 2.5% |
| 40 to 44 Minutes | 3 | 1.2% |
| 45 to 59 Minutes | 13 | 5.3% |
| 60 to 89 Minutes | 17 | 7.0% |
| 90 or more Minutes | 9 | 3.7% |
Commute Time by Sex in Cankton
The most common commute times in Cankton are 10 to 14 minutes (65 commuters, 44.5%) for males and 20 to 24 minutes (32 commuters, 32.7%) for females.
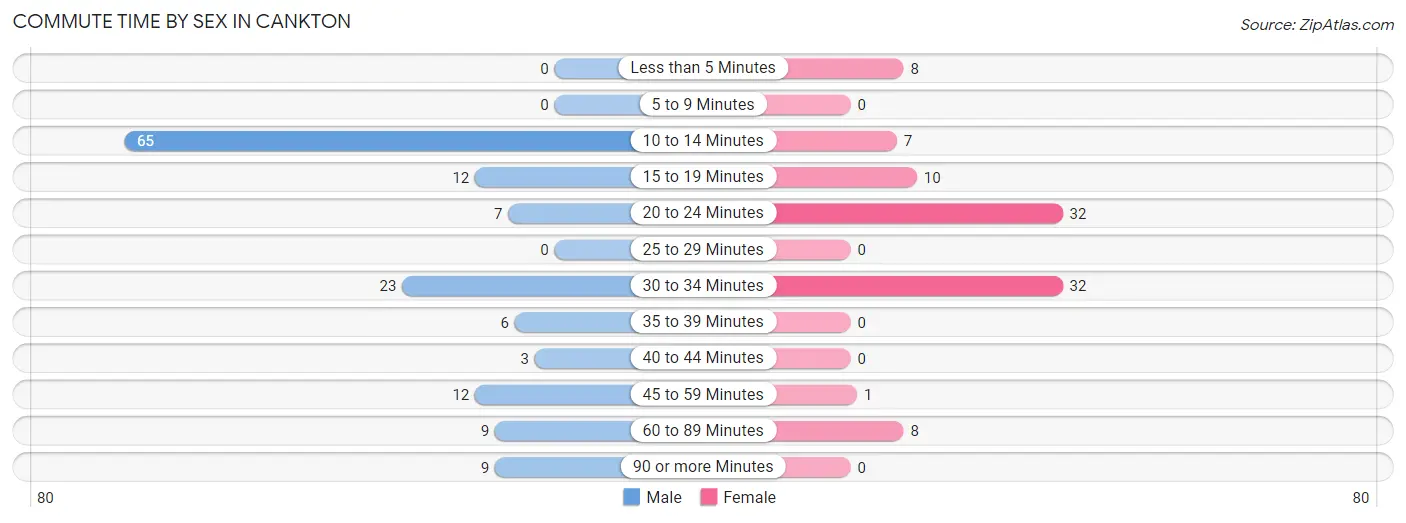
| Commute Time | Male | Female |
| Less than 5 Minutes | 0 (0.0%) | 8 (8.2%) |
| 5 to 9 Minutes | 0 (0.0%) | 0 (0.0%) |
| 10 to 14 Minutes | 65 (44.5%) | 7 (7.1%) |
| 15 to 19 Minutes | 12 (8.2%) | 10 (10.2%) |
| 20 to 24 Minutes | 7 (4.8%) | 32 (32.7%) |
| 25 to 29 Minutes | 0 (0.0%) | 0 (0.0%) |
| 30 to 34 Minutes | 23 (15.8%) | 32 (32.7%) |
| 35 to 39 Minutes | 6 (4.1%) | 0 (0.0%) |
| 40 to 44 Minutes | 3 (2.1%) | 0 (0.0%) |
| 45 to 59 Minutes | 12 (8.2%) | 1 (1.0%) |
| 60 to 89 Minutes | 9 (6.2%) | 8 (8.2%) |
| 90 or more Minutes | 9 (6.2%) | 0 (0.0%) |
Time of Departure to Work by Sex in Cankton
The most frequent times of departure to work in Cankton are 7:00 AM to 7:29 AM (84, 57.5%) for males and 7:30 AM to 7:59 AM (25, 25.5%) for females.
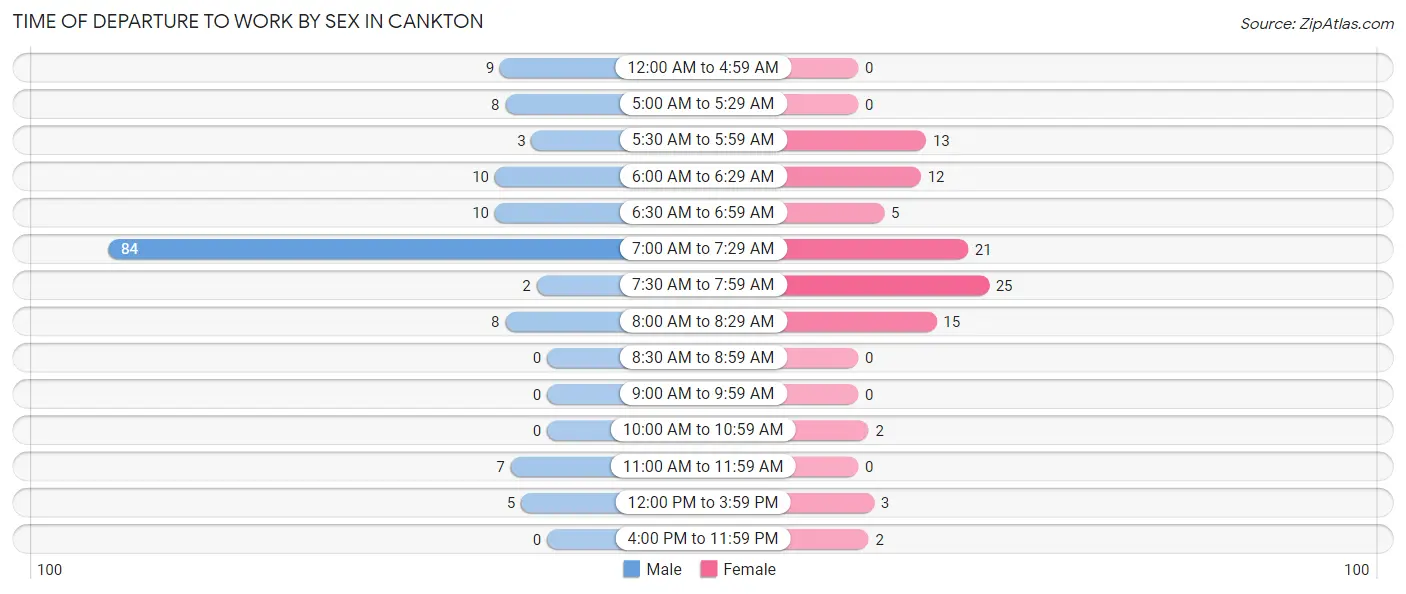
| Time of Departure | Male | Female |
| 12:00 AM to 4:59 AM | 9 (6.2%) | 0 (0.0%) |
| 5:00 AM to 5:29 AM | 8 (5.5%) | 0 (0.0%) |
| 5:30 AM to 5:59 AM | 3 (2.1%) | 13 (13.3%) |
| 6:00 AM to 6:29 AM | 10 (6.9%) | 12 (12.2%) |
| 6:30 AM to 6:59 AM | 10 (6.9%) | 5 (5.1%) |
| 7:00 AM to 7:29 AM | 84 (57.5%) | 21 (21.4%) |
| 7:30 AM to 7:59 AM | 2 (1.4%) | 25 (25.5%) |
| 8:00 AM to 8:29 AM | 8 (5.5%) | 15 (15.3%) |
| 8:30 AM to 8:59 AM | 0 (0.0%) | 0 (0.0%) |
| 9:00 AM to 9:59 AM | 0 (0.0%) | 0 (0.0%) |
| 10:00 AM to 10:59 AM | 0 (0.0%) | 2 (2.0%) |
| 11:00 AM to 11:59 AM | 7 (4.8%) | 0 (0.0%) |
| 12:00 PM to 3:59 PM | 5 (3.4%) | 3 (3.1%) |
| 4:00 PM to 11:59 PM | 0 (0.0%) | 2 (2.0%) |
| Total | 146 (100.0%) | 98 (100.0%) |
Housing Occupancy in Cankton
Occupancy by Ownership in Cankton
Of the total 206 dwellings in Cankton, owner-occupied units account for 186 (90.3%), while renter-occupied units make up 20 (9.7%).
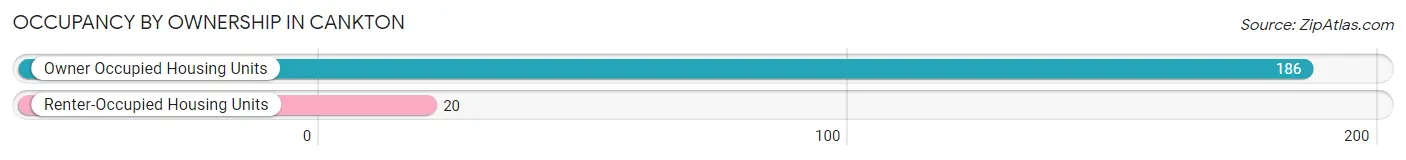
| Occupancy | # Housing Units | % Housing Units |
| Owner Occupied Housing Units | 186 | 90.3% |
| Renter-Occupied Housing Units | 20 | 9.7% |
| Total Occupied Housing Units | 206 | 100.0% |
Occupancy by Household Size in Cankton
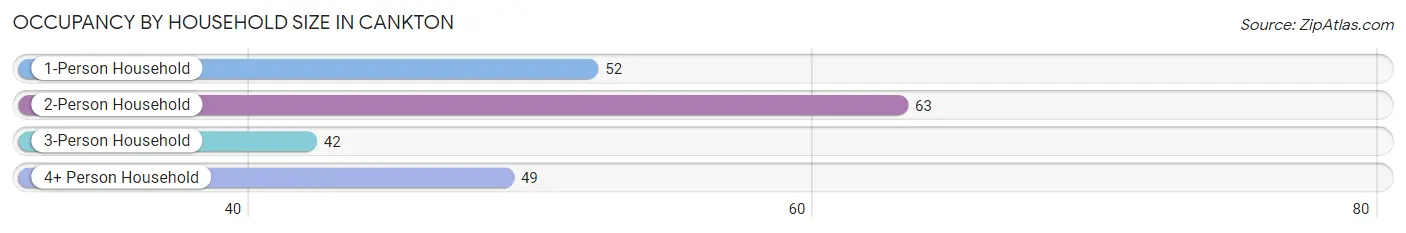
| Household Size | # Housing Units | % Housing Units |
| 1-Person Household | 52 | 25.2% |
| 2-Person Household | 63 | 30.6% |
| 3-Person Household | 42 | 20.4% |
| 4+ Person Household | 49 | 23.8% |
| Total Housing Units | 206 | 100.0% |
Occupancy by Ownership by Household Size in Cankton
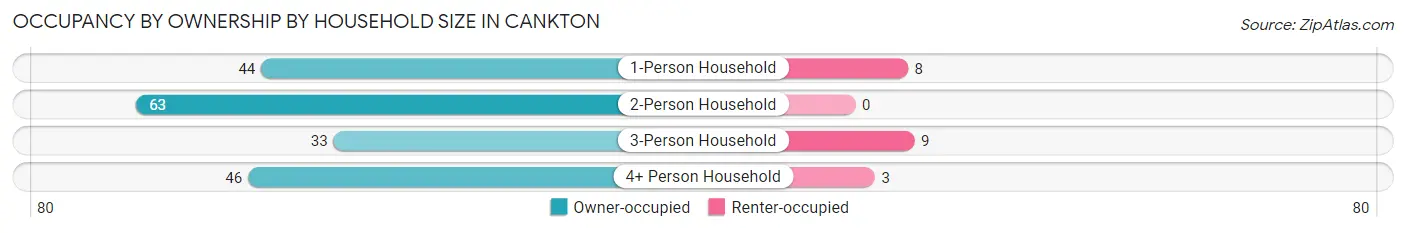
| Household Size | Owner-occupied | Renter-occupied |
| 1-Person Household | 44 (84.6%) | 8 (15.4%) |
| 2-Person Household | 63 (100.0%) | 0 (0.0%) |
| 3-Person Household | 33 (78.6%) | 9 (21.4%) |
| 4+ Person Household | 46 (93.9%) | 3 (6.1%) |
| Total Housing Units | 186 (90.3%) | 20 (9.7%) |
Occupancy by Educational Attainment in Cankton
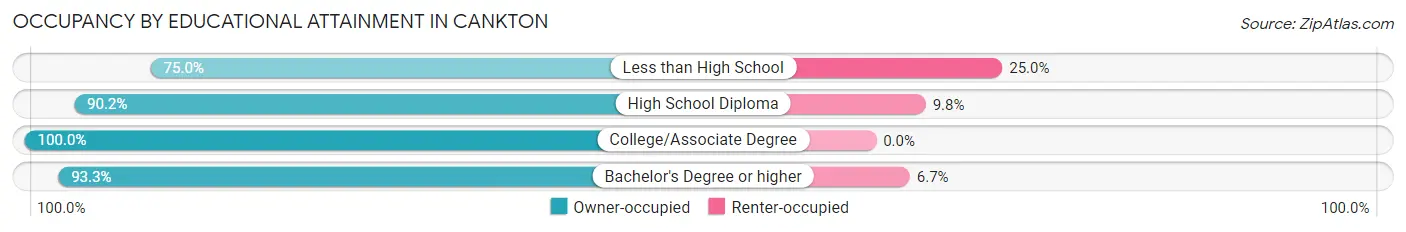
| Household Size | Owner-occupied | Renter-occupied |
| Less than High School | 21 (75.0%) | 7 (25.0%) |
| High School Diploma | 101 (90.2%) | 11 (9.8%) |
| College/Associate Degree | 36 (100.0%) | 0 (0.0%) |
| Bachelor's Degree or higher | 28 (93.3%) | 2 (6.7%) |
Occupancy by Age of Householder in Cankton
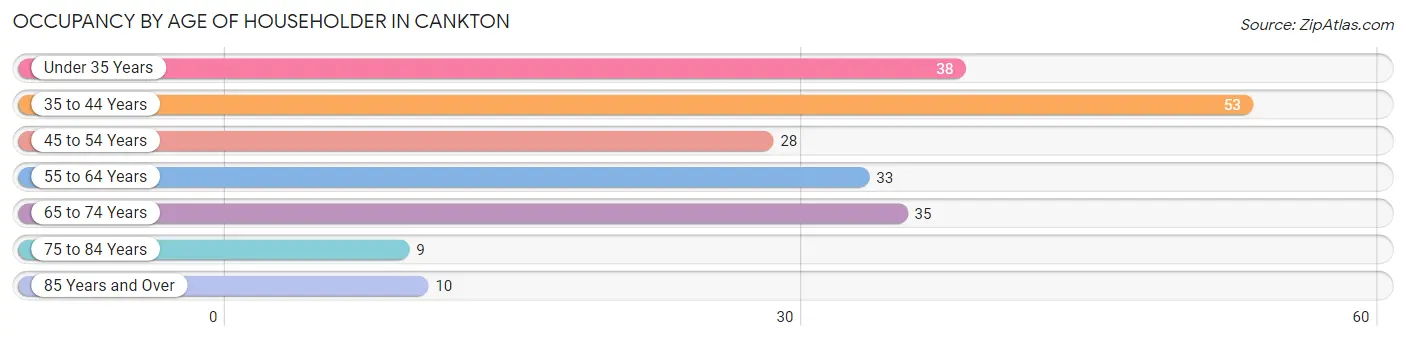
| Age Bracket | # Households | % Households |
| Under 35 Years | 38 | 18.4% |
| 35 to 44 Years | 53 | 25.7% |
| 45 to 54 Years | 28 | 13.6% |
| 55 to 64 Years | 33 | 16.0% |
| 65 to 74 Years | 35 | 17.0% |
| 75 to 84 Years | 9 | 4.4% |
| 85 Years and Over | 10 | 4.9% |
| Total | 206 | 100.0% |
Housing Finances in Cankton
Median Income by Occupancy in Cankton
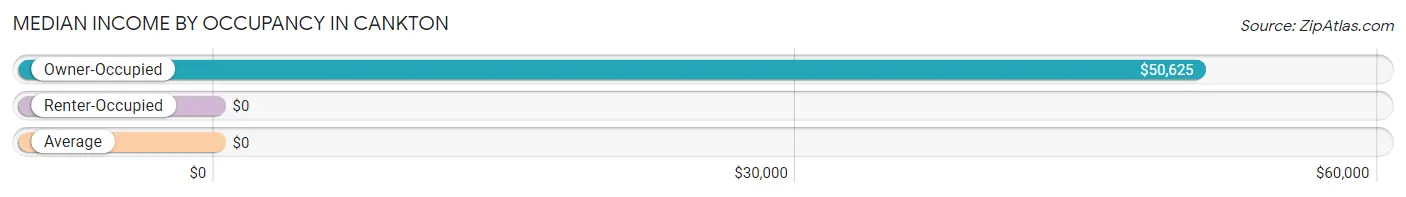
| Occupancy Type | # Households | Median Income |
| Owner-Occupied | 186 (90.3%) | $50,625 |
| Renter-Occupied | 20 (9.7%) | $0 |
| Average | 206 (100.0%) | $0 |
Occupancy by Householder Income Bracket in Cankton
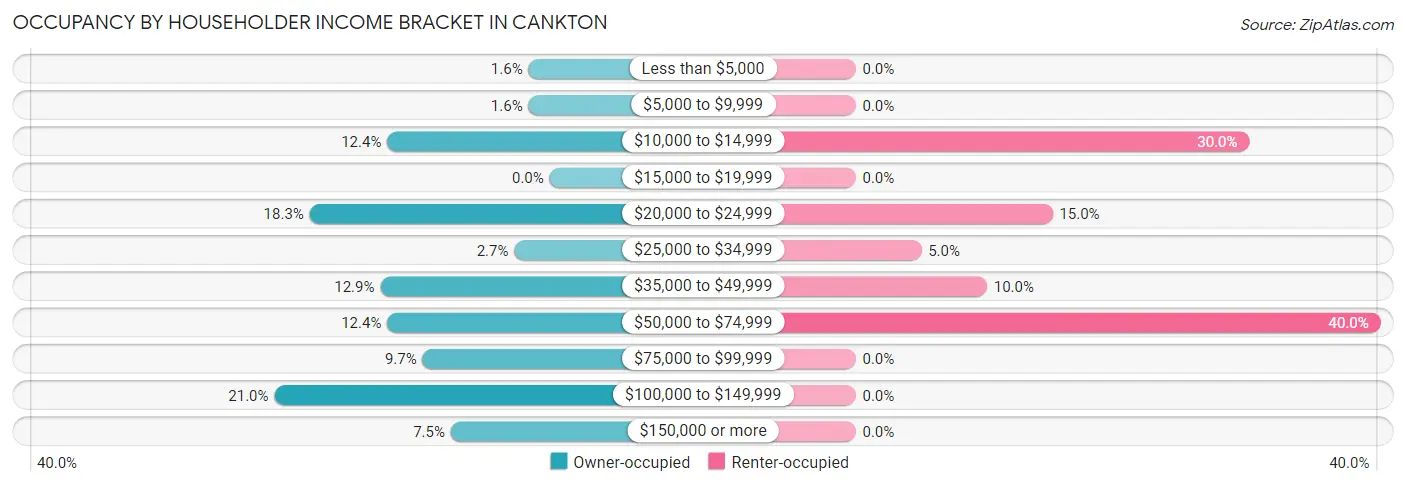
| Income Bracket | Owner-occupied | Renter-occupied |
| Less than $5,000 | 3 (1.6%) | 0 (0.0%) |
| $5,000 to $9,999 | 3 (1.6%) | 0 (0.0%) |
| $10,000 to $14,999 | 23 (12.4%) | 6 (30.0%) |
| $15,000 to $19,999 | 0 (0.0%) | 0 (0.0%) |
| $20,000 to $24,999 | 34 (18.3%) | 3 (15.0%) |
| $25,000 to $34,999 | 5 (2.7%) | 1 (5.0%) |
| $35,000 to $49,999 | 24 (12.9%) | 2 (10.0%) |
| $50,000 to $74,999 | 23 (12.4%) | 8 (40.0%) |
| $75,000 to $99,999 | 18 (9.7%) | 0 (0.0%) |
| $100,000 to $149,999 | 39 (21.0%) | 0 (0.0%) |
| $150,000 or more | 14 (7.5%) | 0 (0.0%) |
| Total | 186 (100.0%) | 20 (100.0%) |
Monthly Housing Cost Tiers in Cankton
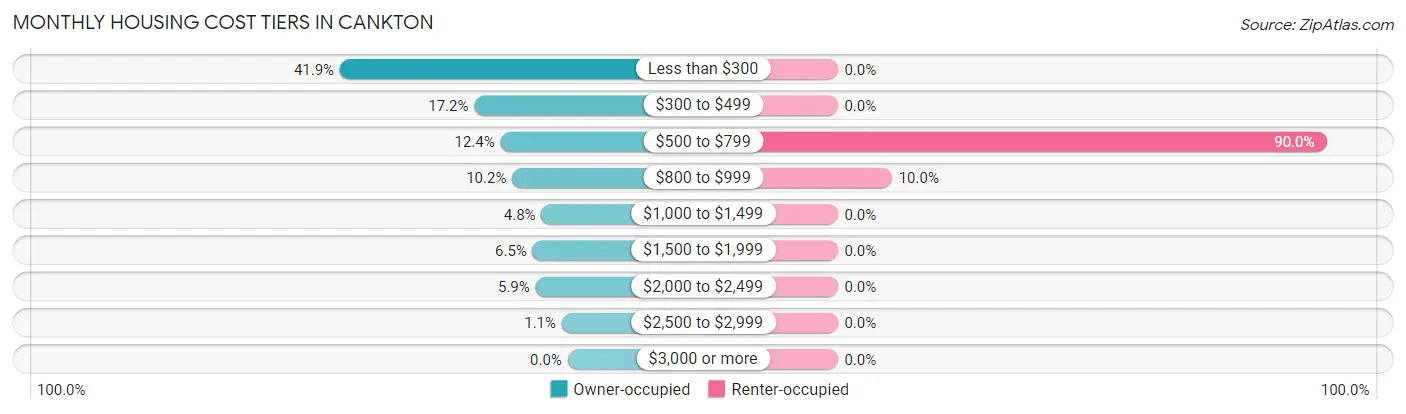
| Monthly Cost | Owner-occupied | Renter-occupied |
| Less than $300 | 78 (41.9%) | 0 (0.0%) |
| $300 to $499 | 32 (17.2%) | 0 (0.0%) |
| $500 to $799 | 23 (12.4%) | 18 (90.0%) |
| $800 to $999 | 19 (10.2%) | 2 (10.0%) |
| $1,000 to $1,499 | 9 (4.8%) | 0 (0.0%) |
| $1,500 to $1,999 | 12 (6.5%) | 0 (0.0%) |
| $2,000 to $2,499 | 11 (5.9%) | 0 (0.0%) |
| $2,500 to $2,999 | 2 (1.1%) | 0 (0.0%) |
| $3,000 or more | 0 (0.0%) | 0 (0.0%) |
| Total | 186 (100.0%) | 20 (100.0%) |
Physical Housing Characteristics in Cankton
Housing Structures in Cankton
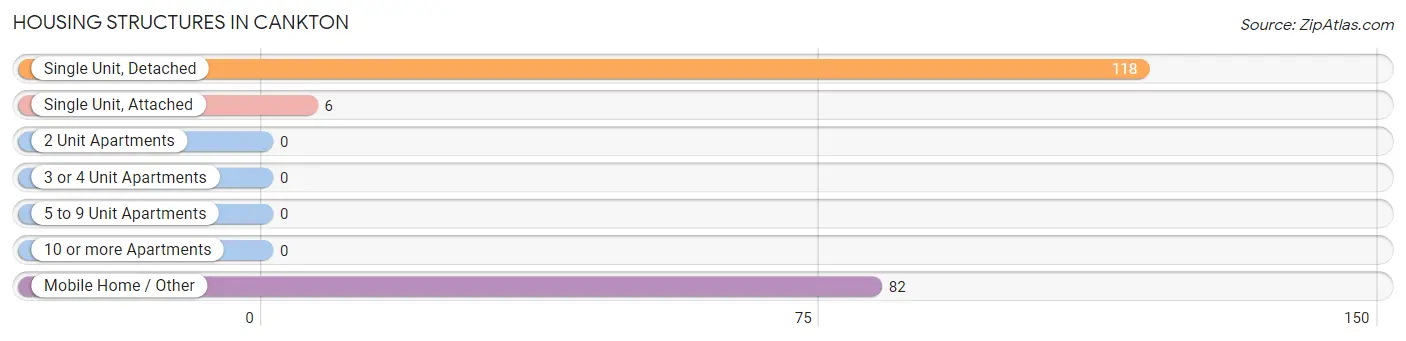
| Structure Type | # Housing Units | % Housing Units |
| Single Unit, Detached | 118 | 57.3% |
| Single Unit, Attached | 6 | 2.9% |
| 2 Unit Apartments | 0 | 0.0% |
| 3 or 4 Unit Apartments | 0 | 0.0% |
| 5 to 9 Unit Apartments | 0 | 0.0% |
| 10 or more Apartments | 0 | 0.0% |
| Mobile Home / Other | 82 | 39.8% |
| Total | 206 | 100.0% |
Housing Structures by Occupancy in Cankton
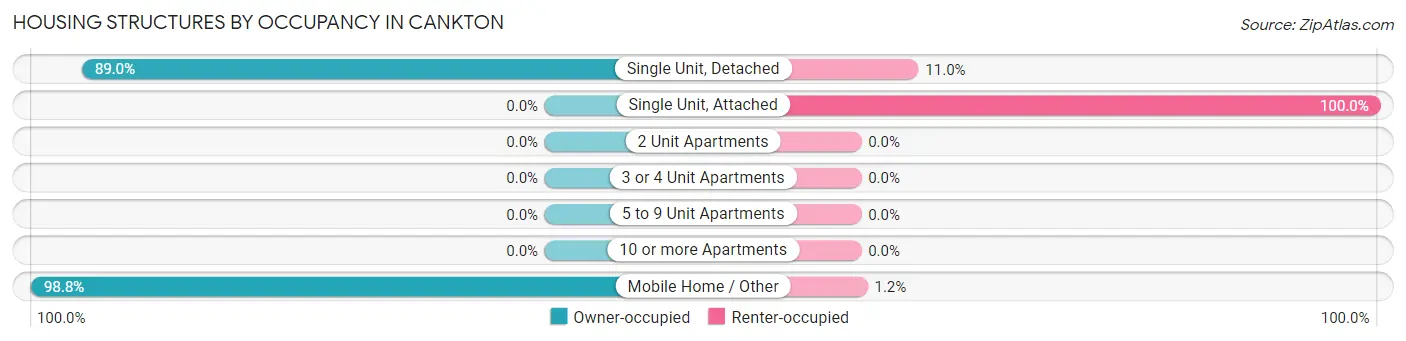
| Structure Type | Owner-occupied | Renter-occupied |
| Single Unit, Detached | 105 (89.0%) | 13 (11.0%) |
| Single Unit, Attached | 0 (0.0%) | 6 (100.0%) |
| 2 Unit Apartments | 0 (0.0%) | 0 (0.0%) |
| 3 or 4 Unit Apartments | 0 (0.0%) | 0 (0.0%) |
| 5 to 9 Unit Apartments | 0 (0.0%) | 0 (0.0%) |
| 10 or more Apartments | 0 (0.0%) | 0 (0.0%) |
| Mobile Home / Other | 81 (98.8%) | 1 (1.2%) |
| Total | 186 (90.3%) | 20 (9.7%) |
Housing Structures by Number of Rooms in Cankton
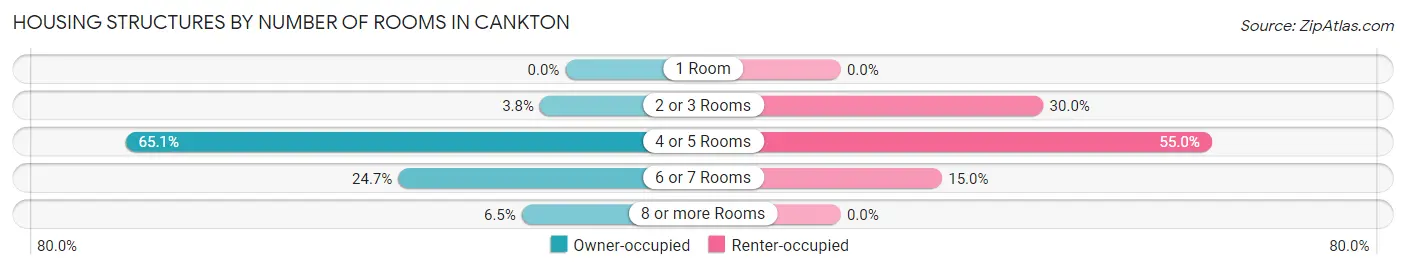
| Number of Rooms | Owner-occupied | Renter-occupied |
| 1 Room | 0 (0.0%) | 0 (0.0%) |
| 2 or 3 Rooms | 7 (3.8%) | 6 (30.0%) |
| 4 or 5 Rooms | 121 (65.0%) | 11 (55.0%) |
| 6 or 7 Rooms | 46 (24.7%) | 3 (15.0%) |
| 8 or more Rooms | 12 (6.5%) | 0 (0.0%) |
| Total | 186 (100.0%) | 20 (100.0%) |
Housing Structure by Heating Type in Cankton
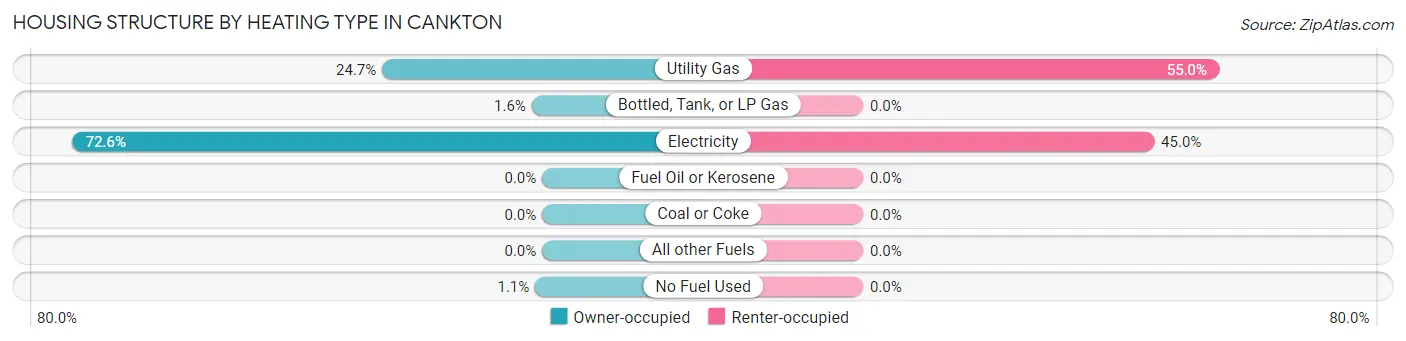
| Heating Type | Owner-occupied | Renter-occupied |
| Utility Gas | 46 (24.7%) | 11 (55.0%) |
| Bottled, Tank, or LP Gas | 3 (1.6%) | 0 (0.0%) |
| Electricity | 135 (72.6%) | 9 (45.0%) |
| Fuel Oil or Kerosene | 0 (0.0%) | 0 (0.0%) |
| Coal or Coke | 0 (0.0%) | 0 (0.0%) |
| All other Fuels | 0 (0.0%) | 0 (0.0%) |
| No Fuel Used | 2 (1.1%) | 0 (0.0%) |
| Total | 186 (100.0%) | 20 (100.0%) |
Household Vehicle Usage in Cankton
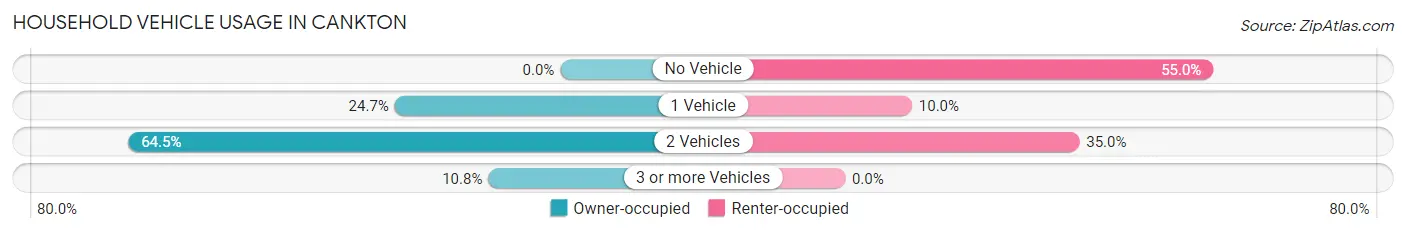
| Vehicles per Household | Owner-occupied | Renter-occupied |
| No Vehicle | 0 (0.0%) | 11 (55.0%) |
| 1 Vehicle | 46 (24.7%) | 2 (10.0%) |
| 2 Vehicles | 120 (64.5%) | 7 (35.0%) |
| 3 or more Vehicles | 20 (10.7%) | 0 (0.0%) |
| Total | 186 (100.0%) | 20 (100.0%) |
Real Estate & Mortgages in Cankton
Real Estate and Mortgage Overview in Cankton
| Characteristic | Without Mortgage | With Mortgage |
| Housing Units | 122 | 64 |
| Median Property Value | $65,000 | $158,300 |
| Median Household Income | $40,000 | $10 |
| Monthly Housing Costs | $265 | $0 |
| Real Estate Taxes | $199 | $32 |
Property Value by Mortgage Status in Cankton
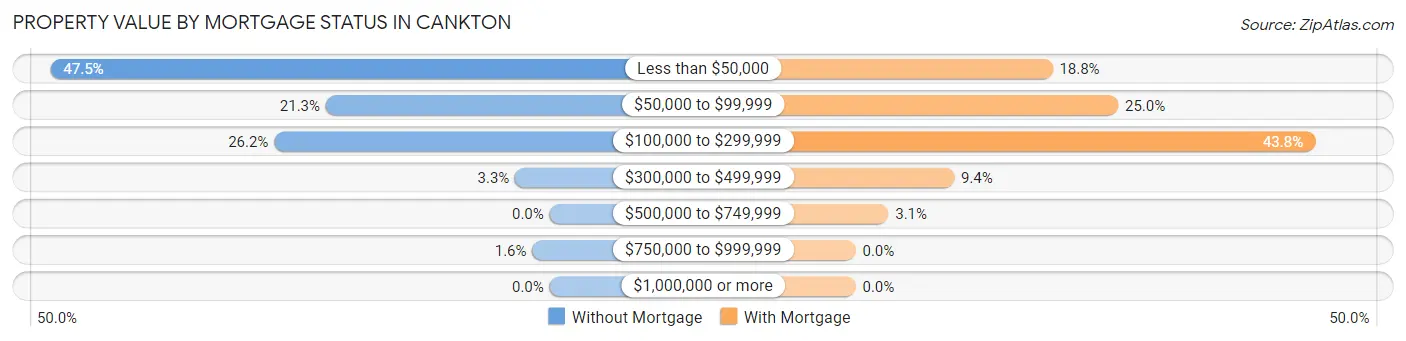
| Property Value | Without Mortgage | With Mortgage |
| Less than $50,000 | 58 (47.5%) | 12 (18.8%) |
| $50,000 to $99,999 | 26 (21.3%) | 16 (25.0%) |
| $100,000 to $299,999 | 32 (26.2%) | 28 (43.8%) |
| $300,000 to $499,999 | 4 (3.3%) | 6 (9.4%) |
| $500,000 to $749,999 | 0 (0.0%) | 2 (3.1%) |
| $750,000 to $999,999 | 2 (1.6%) | 0 (0.0%) |
| $1,000,000 or more | 0 (0.0%) | 0 (0.0%) |
| Total | 122 (100.0%) | 64 (100.0%) |
Household Income by Mortgage Status in Cankton
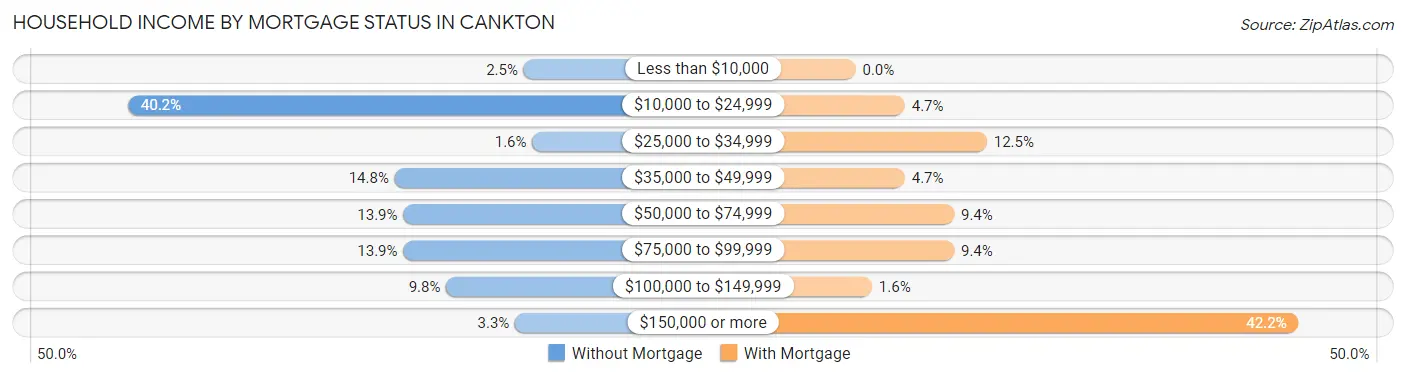
| Household Income | Without Mortgage | With Mortgage |
| Less than $10,000 | 3 (2.5%) | 0 (0.0%) |
| $10,000 to $24,999 | 49 (40.2%) | 3 (4.7%) |
| $25,000 to $34,999 | 2 (1.6%) | 8 (12.5%) |
| $35,000 to $49,999 | 18 (14.7%) | 3 (4.7%) |
| $50,000 to $74,999 | 17 (13.9%) | 6 (9.4%) |
| $75,000 to $99,999 | 17 (13.9%) | 6 (9.4%) |
| $100,000 to $149,999 | 12 (9.8%) | 1 (1.6%) |
| $150,000 or more | 4 (3.3%) | 27 (42.2%) |
| Total | 122 (100.0%) | 64 (100.0%) |
Property Value to Household Income Ratio in Cankton
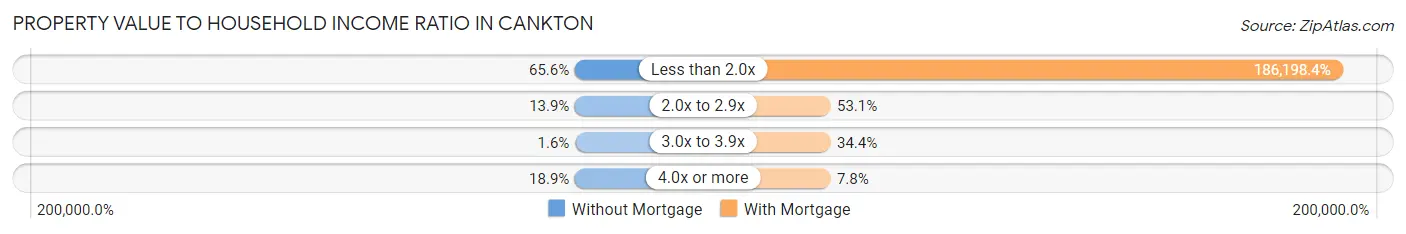
| Value-to-Income Ratio | Without Mortgage | With Mortgage |
| Less than 2.0x | 80 (65.6%) | 119,167 (186,198.4%) |
| 2.0x to 2.9x | 17 (13.9%) | 34 (53.1%) |
| 3.0x to 3.9x | 2 (1.6%) | 22 (34.4%) |
| 4.0x or more | 23 (18.9%) | 5 (7.8%) |
| Total | 122 (100.0%) | 64 (100.0%) |
Real Estate Taxes by Mortgage Status in Cankton
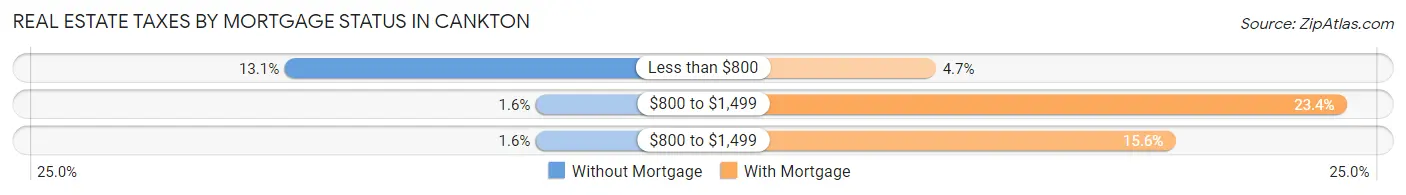
| Property Taxes | Without Mortgage | With Mortgage |
| Less than $800 | 16 (13.1%) | 3 (4.7%) |
| $800 to $1,499 | 2 (1.6%) | 15 (23.4%) |
| $800 to $1,499 | 2 (1.6%) | 10 (15.6%) |
| Total | 122 (100.0%) | 64 (100.0%) |
Health & Disability in Cankton
Health Insurance Coverage by Age in Cankton
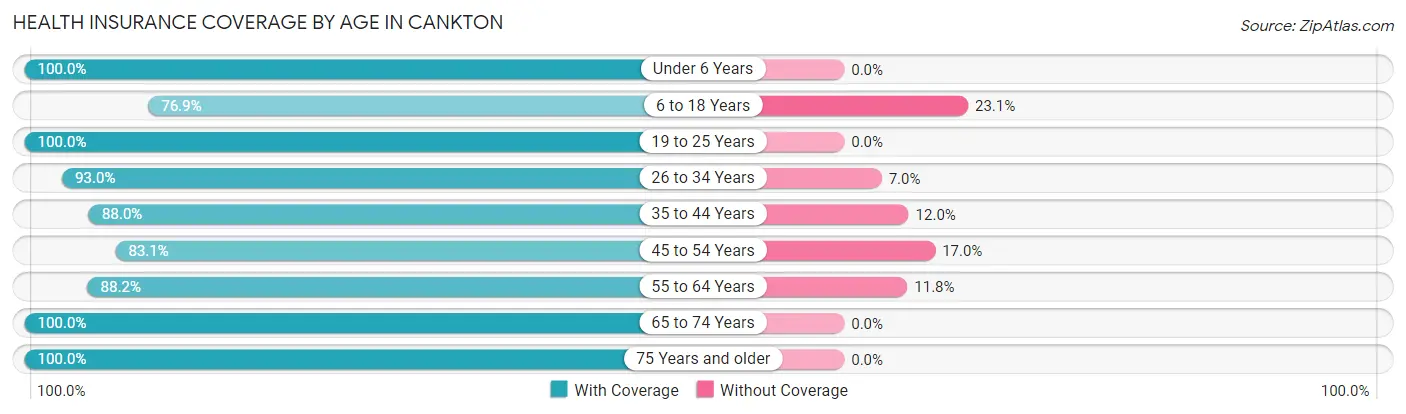
| Age Bracket | With Coverage | Without Coverage |
| Under 6 Years | 109 (100.0%) | 0 (0.0%) |
| 6 to 18 Years | 60 (76.9%) | 18 (23.1%) |
| 19 to 25 Years | 92 (100.0%) | 0 (0.0%) |
| 26 to 34 Years | 40 (93.0%) | 3 (7.0%) |
| 35 to 44 Years | 66 (88.0%) | 9 (12.0%) |
| 45 to 54 Years | 49 (83.1%) | 10 (17.0%) |
| 55 to 64 Years | 30 (88.2%) | 4 (11.8%) |
| 65 to 74 Years | 53 (100.0%) | 0 (0.0%) |
| 75 Years and older | 30 (100.0%) | 0 (0.0%) |
| Total | 529 (92.3%) | 44 (7.7%) |
Health Insurance Coverage by Citizenship Status in Cankton
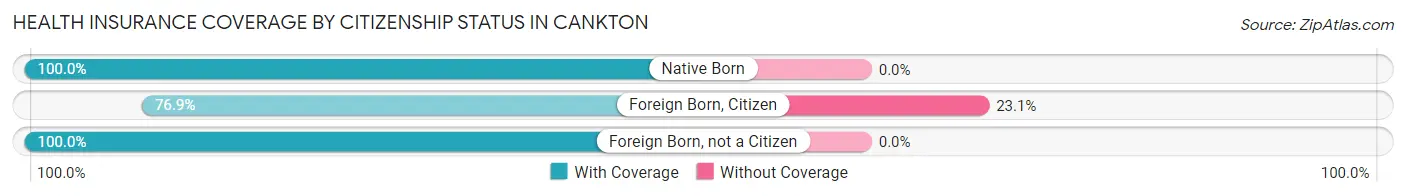
| Citizenship Status | With Coverage | Without Coverage |
| Native Born | 109 (100.0%) | 0 (0.0%) |
| Foreign Born, Citizen | 60 (76.9%) | 18 (23.1%) |
| Foreign Born, not a Citizen | 92 (100.0%) | 0 (0.0%) |
Health Insurance Coverage by Household Income in Cankton
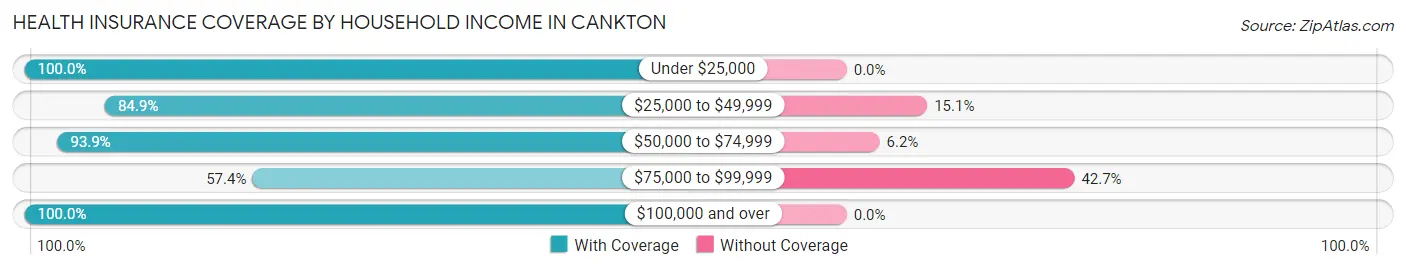
| Household Income | With Coverage | Without Coverage |
| Under $25,000 | 248 (100.0%) | 0 (0.0%) |
| $25,000 to $49,999 | 62 (84.9%) | 11 (15.1%) |
| $50,000 to $74,999 | 61 (93.9%) | 4 (6.1%) |
| $75,000 to $99,999 | 39 (57.4%) | 29 (42.6%) |
| $100,000 and over | 119 (100.0%) | 0 (0.0%) |
Public vs Private Health Insurance Coverage by Age in Cankton
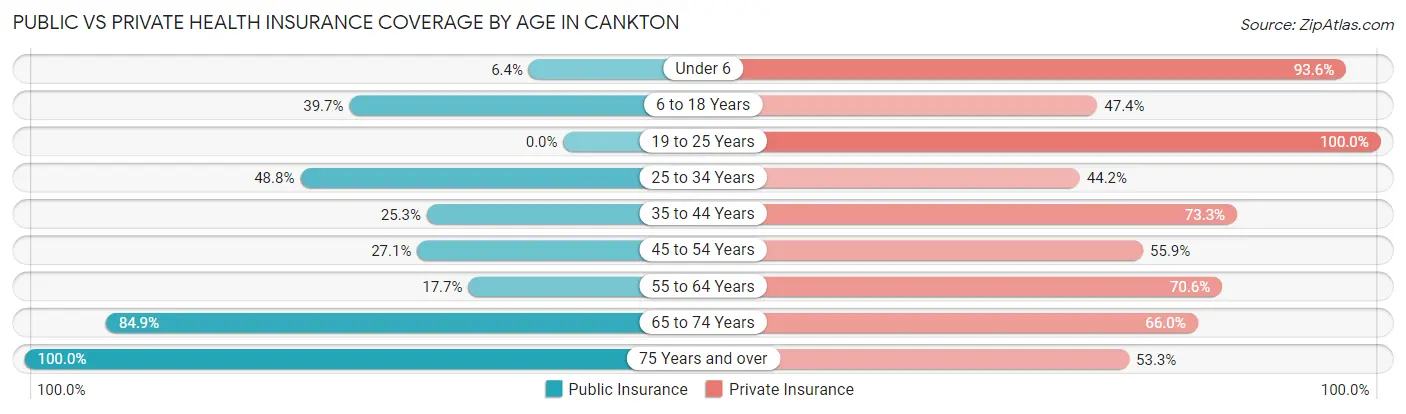
| Age Bracket | Public Insurance | Private Insurance |
| Under 6 | 7 (6.4%) | 102 (93.6%) |
| 6 to 18 Years | 31 (39.7%) | 37 (47.4%) |
| 19 to 25 Years | 0 (0.0%) | 92 (100.0%) |
| 25 to 34 Years | 21 (48.8%) | 19 (44.2%) |
| 35 to 44 Years | 19 (25.3%) | 55 (73.3%) |
| 45 to 54 Years | 16 (27.1%) | 33 (55.9%) |
| 55 to 64 Years | 6 (17.6%) | 24 (70.6%) |
| 65 to 74 Years | 45 (84.9%) | 35 (66.0%) |
| 75 Years and over | 30 (100.0%) | 16 (53.3%) |
| Total | 175 (30.5%) | 413 (72.1%) |
Disability Status by Sex by Age in Cankton
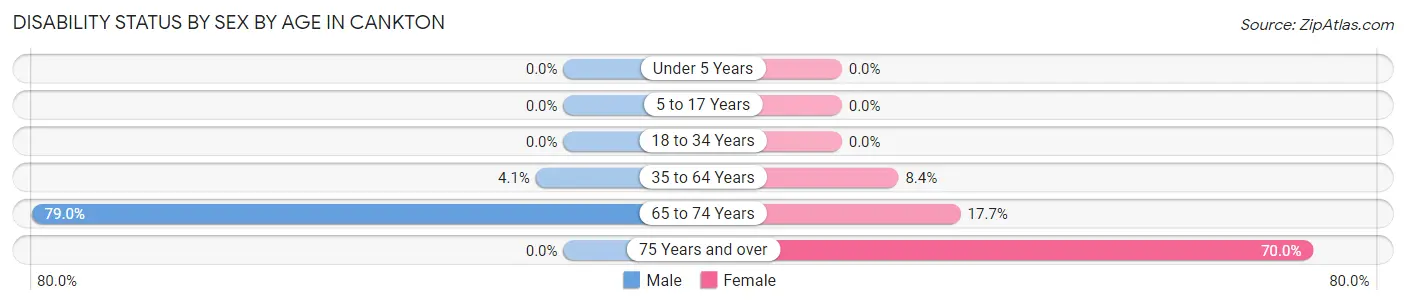
| Age Bracket | Male | Female |
| Under 5 Years | 0 (0.0%) | 0 (0.0%) |
| 5 to 17 Years | 0 (0.0%) | 0 (0.0%) |
| 18 to 34 Years | 0 (0.0%) | 0 (0.0%) |
| 35 to 64 Years | 3 (4.1%) | 8 (8.4%) |
| 65 to 74 Years | 15 (78.9%) | 6 (17.6%) |
| 75 Years and over | 0 (0.0%) | 14 (70.0%) |
Disability Class by Sex by Age in Cankton
Disability Class: Hearing Difficulty
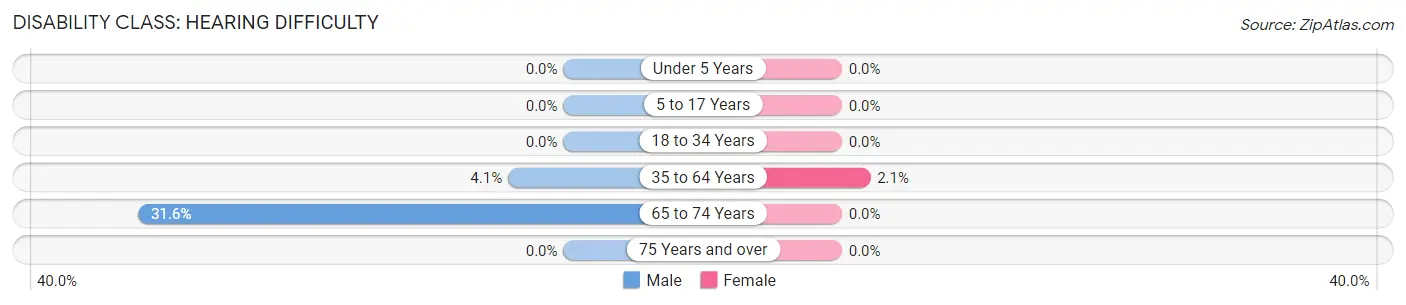
| Age Bracket | Male | Female |
| Under 5 Years | 0 (0.0%) | 0 (0.0%) |
| 5 to 17 Years | 0 (0.0%) | 0 (0.0%) |
| 18 to 34 Years | 0 (0.0%) | 0 (0.0%) |
| 35 to 64 Years | 3 (4.1%) | 2 (2.1%) |
| 65 to 74 Years | 6 (31.6%) | 0 (0.0%) |
| 75 Years and over | 0 (0.0%) | 0 (0.0%) |
Disability Class: Vision Difficulty
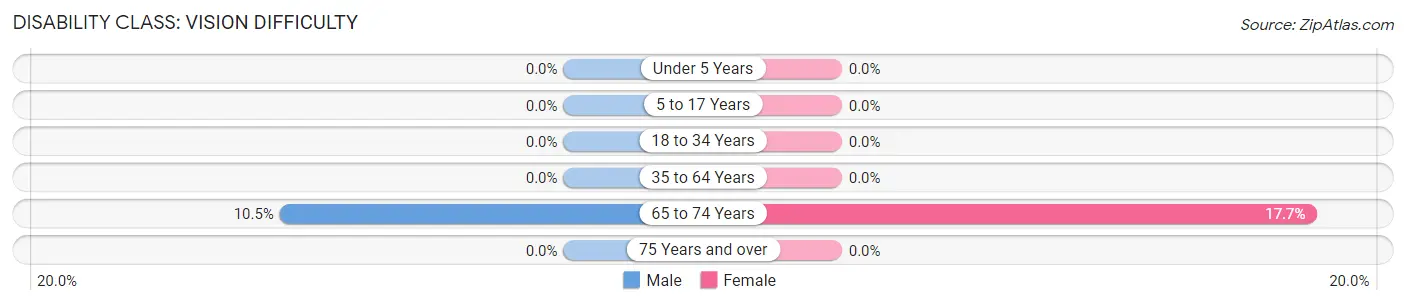
| Age Bracket | Male | Female |
| Under 5 Years | 0 (0.0%) | 0 (0.0%) |
| 5 to 17 Years | 0 (0.0%) | 0 (0.0%) |
| 18 to 34 Years | 0 (0.0%) | 0 (0.0%) |
| 35 to 64 Years | 0 (0.0%) | 0 (0.0%) |
| 65 to 74 Years | 2 (10.5%) | 6 (17.6%) |
| 75 Years and over | 0 (0.0%) | 0 (0.0%) |
Disability Class: Cognitive Difficulty
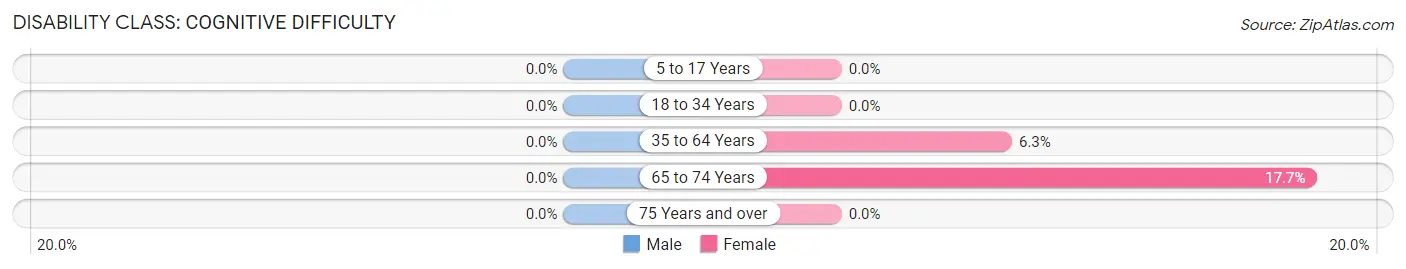
| Age Bracket | Male | Female |
| 5 to 17 Years | 0 (0.0%) | 0 (0.0%) |
| 18 to 34 Years | 0 (0.0%) | 0 (0.0%) |
| 35 to 64 Years | 0 (0.0%) | 6 (6.3%) |
| 65 to 74 Years | 0 (0.0%) | 6 (17.6%) |
| 75 Years and over | 0 (0.0%) | 0 (0.0%) |
Disability Class: Ambulatory Difficulty
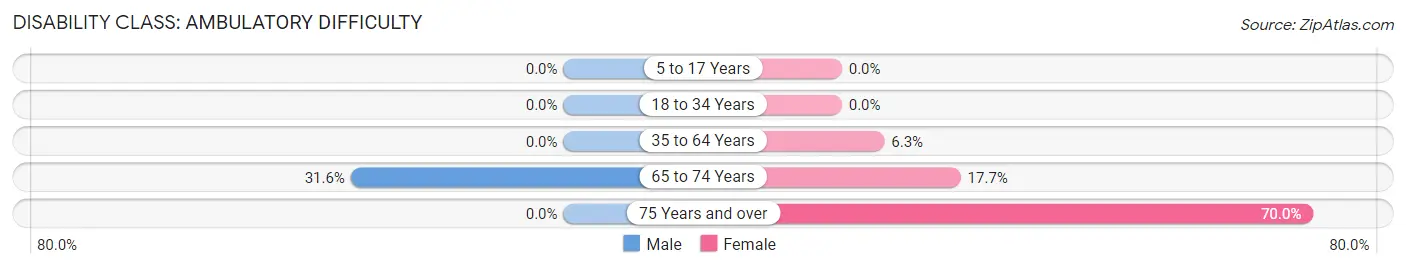
| Age Bracket | Male | Female |
| 5 to 17 Years | 0 (0.0%) | 0 (0.0%) |
| 18 to 34 Years | 0 (0.0%) | 0 (0.0%) |
| 35 to 64 Years | 0 (0.0%) | 6 (6.3%) |
| 65 to 74 Years | 6 (31.6%) | 6 (17.6%) |
| 75 Years and over | 0 (0.0%) | 14 (70.0%) |
Disability Class: Self-Care Difficulty
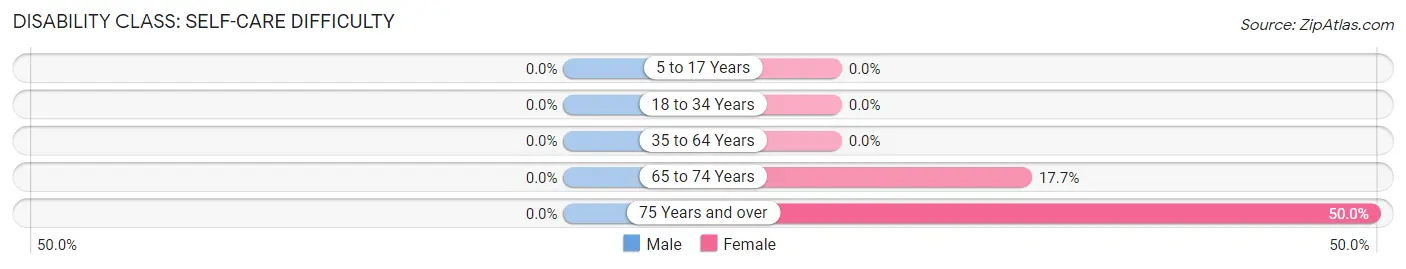
| Age Bracket | Male | Female |
| 5 to 17 Years | 0 (0.0%) | 0 (0.0%) |
| 18 to 34 Years | 0 (0.0%) | 0 (0.0%) |
| 35 to 64 Years | 0 (0.0%) | 0 (0.0%) |
| 65 to 74 Years | 0 (0.0%) | 6 (17.6%) |
| 75 Years and over | 0 (0.0%) | 10 (50.0%) |
Technology Access in Cankton
Computing Device Access in Cankton
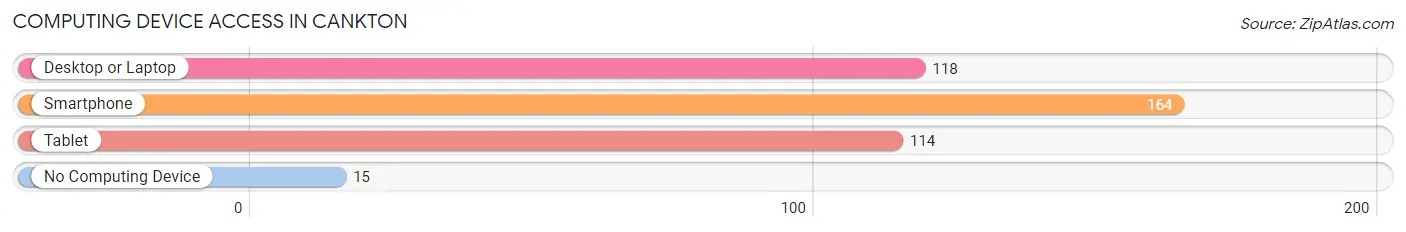
| Device Type | # Households | % Households |
| Desktop or Laptop | 118 | 57.3% |
| Smartphone | 164 | 79.6% |
| Tablet | 114 | 55.3% |
| No Computing Device | 15 | 7.3% |
| Total | 206 | 100.0% |
Internet Access in Cankton
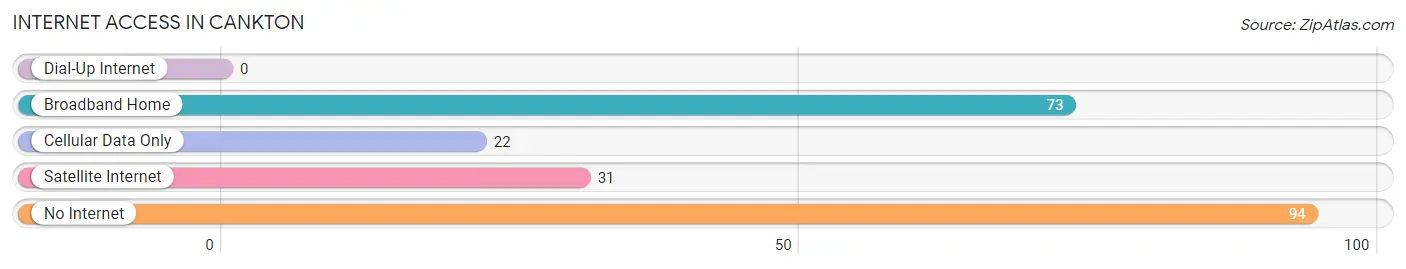
| Internet Type | # Households | % Households |
| Dial-Up Internet | 0 | 0.0% |
| Broadband Home | 73 | 35.4% |
| Cellular Data Only | 22 | 10.7% |
| Satellite Internet | 31 | 15.0% |
| No Internet | 94 | 45.6% |
| Total | 206 | 100.0% |
Cankton Summary
Cankton, Louisiana is a small town located in St. Landry Parish, in the southwestern part of the state. It is situated on the banks of Bayou Teche, and is part of the Lafayette Metropolitan Statistical Area. The town has a population of 1,845, according to the 2010 census.
History
Cankton was founded in 1845 by a group of French-speaking settlers from the nearby town of Opelousas. The town was named after a local Native American chief, Cankton, who was a leader of the Attakapas tribe. The town was originally a trading post and a stop on the stagecoach route between New Orleans and St. Louis.
In the late 19th century, Cankton became a center for the lumber industry, with several sawmills located in the area. The town also had a thriving agricultural economy, with cotton, corn, and sugarcane being the main crops.
In the early 20th century, Cankton experienced a period of growth and prosperity. The town was home to several businesses, including a bank, a hotel, a movie theater, and a variety of stores.
Geography
Cankton is located in southwestern Louisiana, in St. Landry Parish. It is situated on the banks of Bayou Teche, and is part of the Lafayette Metropolitan Statistical Area. The town has a total area of 1.2 square miles, all of which is land.
The climate in Cankton is humid subtropical, with hot, humid summers and mild winters. The average annual temperature is 68 degrees Fahrenheit, and the average annual precipitation is 54 inches.
Economy
The economy of Cankton is largely based on agriculture and tourism. The town is home to several farms, which produce cotton, corn, and sugarcane. The town is also a popular tourist destination, with several attractions, including the Cankton Museum, the Cankton Historic District, and the Cankton National Wildlife Refuge.
Demographics
According to the 2010 census, Cankton has a population of 1,845. The racial makeup of the town is 79.3% White, 17.2% African American, 0.7% Native American, 0.3% Asian, 0.1% Pacific Islander, and 2.4% from other races. The median household income is $30,938, and the median family income is $37,813. The per capita income is $15,945.
Conclusion
Cankton, Louisiana is a small town located in St. Landry Parish, in the southwestern part of the state. It is situated on the banks of Bayou Teche, and is part of the Lafayette Metropolitan Statistical Area. The town has a population of 1,845, according to the 2010 census. The economy of Cankton is largely based on agriculture and tourism, and the town is home to several farms, which produce cotton, corn, and sugarcane. The racial makeup of the town is 79.3% White, 17.2% African American, 0.7% Native American, 0.3% Asian, 0.1% Pacific Islander, and 2.4% from other races. The median household income is $30,938, and the median family income is $37,813. The per capita income is $15,945.
Common Questions
What is Per Capita Income in Cankton?
Per Capita income in Cankton is $24,827.
What is the Median Family Income in Cankton?
Median Family Income in Cankton is $43,594.
What is Inequality or Gini Index in Cankton?
Inequality or Gini Index in Cankton is 0.43.
What is the Total Population of Cankton?
Total Population of Cankton is 576.
What is the Total Male Population of Cankton?
Total Male Population of Cankton is 240.
What is the Total Female Population of Cankton?
Total Female Population of Cankton is 336.
What is the Ratio of Males per 100 Females in Cankton?
There are 71.43 Males per 100 Females in Cankton.
What is the Ratio of Females per 100 Males in Cankton?
There are 140.00 Females per 100 Males in Cankton.
What is the Median Population Age in Cankton?
Median Population Age in Cankton is 29.2 Years.
What is the Average Family Size in Cankton
Average Family Size in Cankton is 3.0 People.
What is the Average Household Size in Cankton
Average Household Size in Cankton is 2.8 People.
How Large is the Labor Force in Cankton?
There are 256 People in the Labor Forcein in Cankton.
What is the Percentage of People in the Labor Force in Cankton?
62.3% of People are in the Labor Force in Cankton.