Sterlington, LA Map & Demographics
Sterlington Map
Sterlington Overview
$26,738
PER CAPITA INCOME
$72,978
AVG FAMILY INCOME
$66,420
AVG HOUSEHOLD INCOME
23.7%
WAGE / INCOME GAP [ % ]
76.3¢/ $1
WAGE / INCOME GAP [ $ ]
0.43
INEQUALITY / GINI INDEX
2,093
TOTAL POPULATION
980
MALE POPULATION
1,113
FEMALE POPULATION
88.05
MALES / 100 FEMALES
113.57
FEMALES / 100 MALES
37.1
MEDIAN AGE
3.1
AVG FAMILY SIZE
2.6
AVG HOUSEHOLD SIZE
936
LABOR FORCE [ PEOPLE ]
62.6%
PERCENT IN LABOR FORCE
0.7%
UNEMPLOYMENT RATE
Sterlington Zip Codes
Sterlington Area Codes
Income in Sterlington
Income Overview in Sterlington
Per Capita Income in Sterlington is $26,738, while median incomes of families and households are $72,978 and $66,420 respectively.
| Characteristic | Number | Measure |
| Per Capita Income | 2,093 | $26,738 |
| Median Family Income | 589 | $72,978 |
| Mean Family Income | 589 | $74,722 |
| Median Household Income | 797 | $66,420 |
| Mean Household Income | 797 | $67,924 |
| Income Deficit | 589 | $0 |
| Wage / Income Gap (%) | 2,093 | 23.69% |
| Wage / Income Gap ($) | 2,093 | 76.31¢ per $1 |
| Gini / Inequality Index | 2,093 | 0.43 |
Earnings by Sex in Sterlington
Average Earnings in Sterlington are $42,091, $47,708 for men and $36,406 for women, a difference of 23.7%.
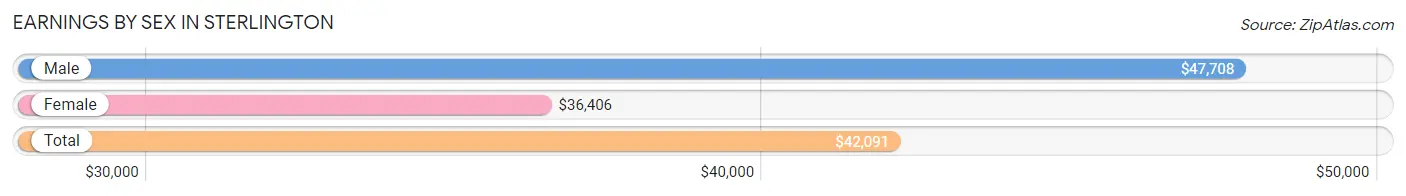
| Sex | Number | Average Earnings |
| Male | 431 (45.5%) | $47,708 |
| Female | 516 (54.5%) | $36,406 |
| Total | 947 (100.0%) | $42,091 |
Earnings by Sex by Income Bracket in Sterlington
The most common earnings brackets in Sterlington are $75,000 to $99,999 for men (68 | 15.8%) and $40,000 to $44,999 for women (73 | 14.1%).
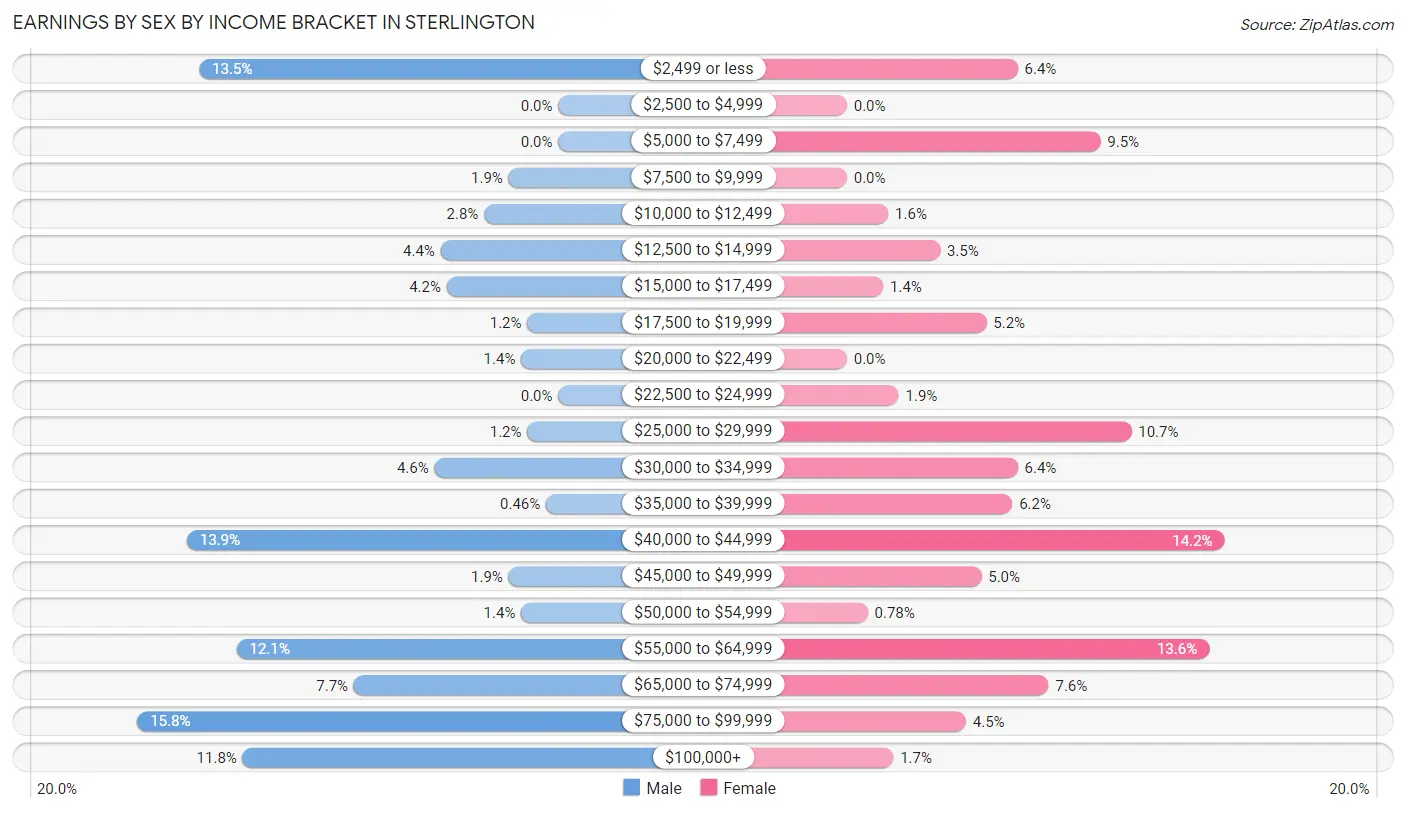
| Income | Male | Female |
| $2,499 or less | 58 (13.5%) | 33 (6.4%) |
| $2,500 to $4,999 | 0 (0.0%) | 0 (0.0%) |
| $5,000 to $7,499 | 0 (0.0%) | 49 (9.5%) |
| $7,500 to $9,999 | 8 (1.9%) | 0 (0.0%) |
| $10,000 to $12,499 | 12 (2.8%) | 8 (1.5%) |
| $12,500 to $14,999 | 19 (4.4%) | 18 (3.5%) |
| $15,000 to $17,499 | 18 (4.2%) | 7 (1.4%) |
| $17,500 to $19,999 | 5 (1.2%) | 27 (5.2%) |
| $20,000 to $22,499 | 6 (1.4%) | 0 (0.0%) |
| $22,500 to $24,999 | 0 (0.0%) | 10 (1.9%) |
| $25,000 to $29,999 | 5 (1.2%) | 55 (10.7%) |
| $30,000 to $34,999 | 20 (4.6%) | 33 (6.4%) |
| $35,000 to $39,999 | 2 (0.5%) | 32 (6.2%) |
| $40,000 to $44,999 | 60 (13.9%) | 73 (14.1%) |
| $45,000 to $49,999 | 8 (1.9%) | 26 (5.0%) |
| $50,000 to $54,999 | 6 (1.4%) | 4 (0.8%) |
| $55,000 to $64,999 | 52 (12.1%) | 70 (13.6%) |
| $65,000 to $74,999 | 33 (7.7%) | 39 (7.6%) |
| $75,000 to $99,999 | 68 (15.8%) | 23 (4.5%) |
| $100,000+ | 51 (11.8%) | 9 (1.7%) |
| Total | 431 (100.0%) | 516 (100.0%) |
Earnings by Sex by Educational Attainment in Sterlington
Average earnings in Sterlington are $62,500 for men and $37,344 for women, a difference of 40.3%. Men with an educational attainment of high school diploma enjoy the highest average annual earnings of $73,698, while those with college or associate's degree education earn the least with $59,444. Women with an educational attainment of graduate degree earn the most with the average annual earnings of $56,607, while those with less than high school education have the smallest earnings of $28,393.
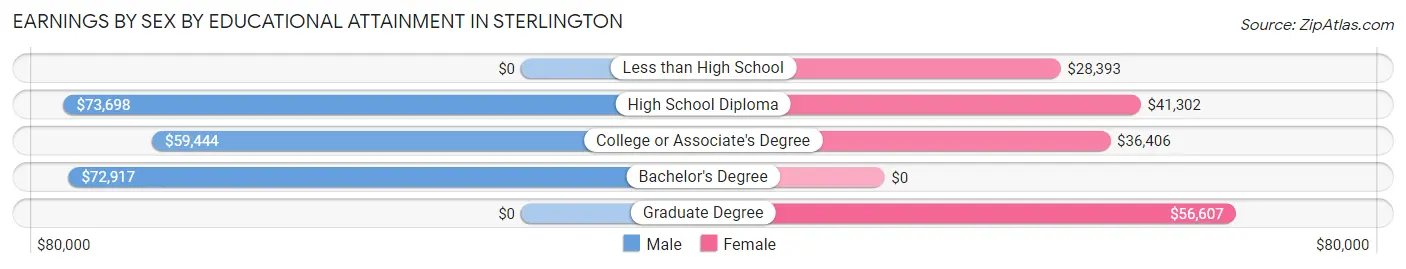
| Educational Attainment | Male Income | Female Income |
| Less than High School | - | - |
| High School Diploma | $73,698 | $41,302 |
| College or Associate's Degree | $59,444 | $36,406 |
| Bachelor's Degree | $72,917 | $0 |
| Graduate Degree | - | - |
| Total | $62,500 | $37,344 |
Family Income in Sterlington
Family Income Brackets in Sterlington
According to the Sterlington family income data, there are 143 families falling into the $75,000 to $99,999 income range, which is the most common income bracket and makes up 24.3% of all families. Conversely, the $10,000 to $14,999 income bracket is the least frequent group with only 1 families (0.2%) belonging to this category.
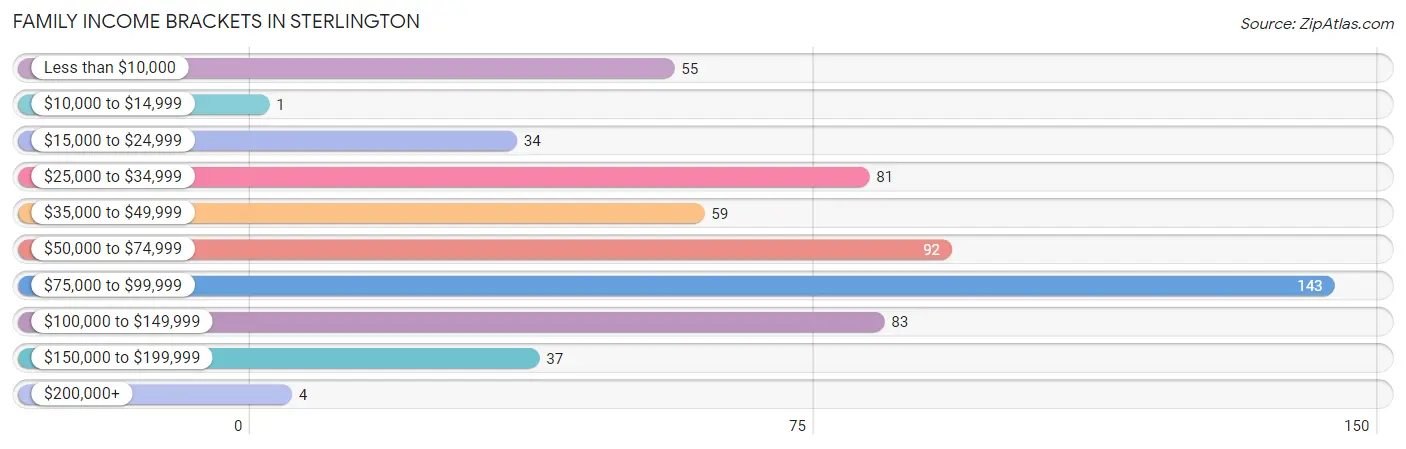
| Income Bracket | # Families | % Families |
| Less than $10,000 | 55 | 9.3% |
| $10,000 to $14,999 | 1 | 0.2% |
| $15,000 to $24,999 | 34 | 5.8% |
| $25,000 to $34,999 | 81 | 13.8% |
| $35,000 to $49,999 | 59 | 10.0% |
| $50,000 to $74,999 | 92 | 15.6% |
| $75,000 to $99,999 | 143 | 24.3% |
| $100,000 to $149,999 | 83 | 14.1% |
| $150,000 to $199,999 | 37 | 6.3% |
| $200,000+ | 4 | 0.7% |
Family Income by Famaliy Size in Sterlington
5-person families (16 | 2.7%) account for the highest median family income in Sterlington with $158,750 per family, while 2-person families (336 | 57.1%) have the highest median income of $36,875 per family member.
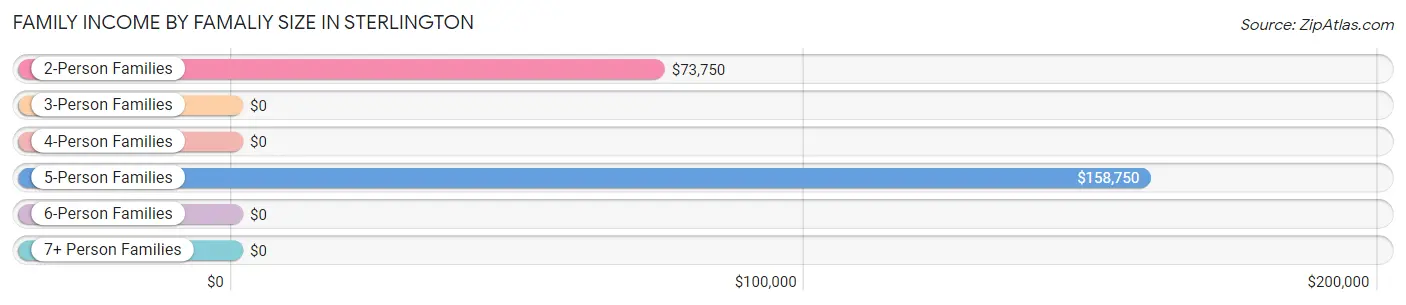
| Income Bracket | # Families | Median Income |
| 2-Person Families | 336 (57.1%) | $73,750 |
| 3-Person Families | 112 (19.0%) | $0 |
| 4-Person Families | 87 (14.8%) | $0 |
| 5-Person Families | 16 (2.7%) | $158,750 |
| 6-Person Families | 38 (6.5%) | $0 |
| 7+ Person Families | 0 (0.0%) | $0 |
| Total | 589 (100.0%) | $72,978 |
Family Income by Number of Earners in Sterlington
The median family income in Sterlington is $72,978, with families comprising 2 earners (156) having the highest median family income of $109,583, while families with no earners (122) have the lowest median family income of $19,605, accounting for 26.5% and 20.7% of families, respectively.
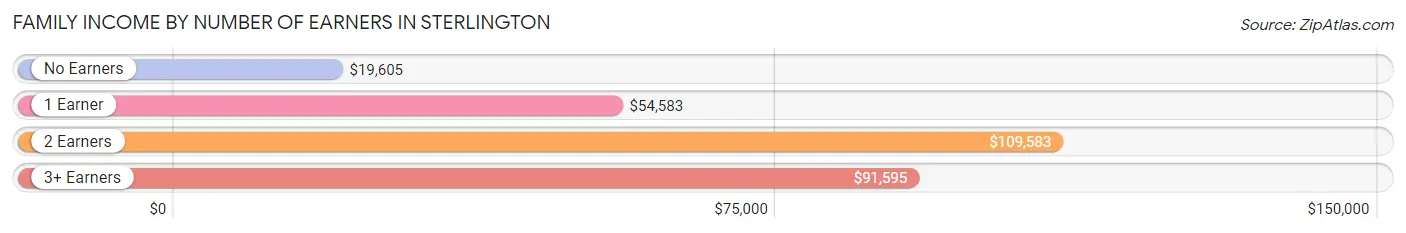
| Number of Earners | # Families | Median Income |
| No Earners | 122 (20.7%) | $19,605 |
| 1 Earner | 264 (44.8%) | $54,583 |
| 2 Earners | 156 (26.5%) | $109,583 |
| 3+ Earners | 47 (8.0%) | $91,595 |
| Total | 589 (100.0%) | $72,978 |
Household Income in Sterlington
Household Income Brackets in Sterlington
With 179 households falling in the category, the $75,000 to $99,999 income range is the most frequent in Sterlington, accounting for 22.5% of all households. In contrast, only 4 households (0.5%) fall into the $200,000+ income bracket, making it the least populous group.
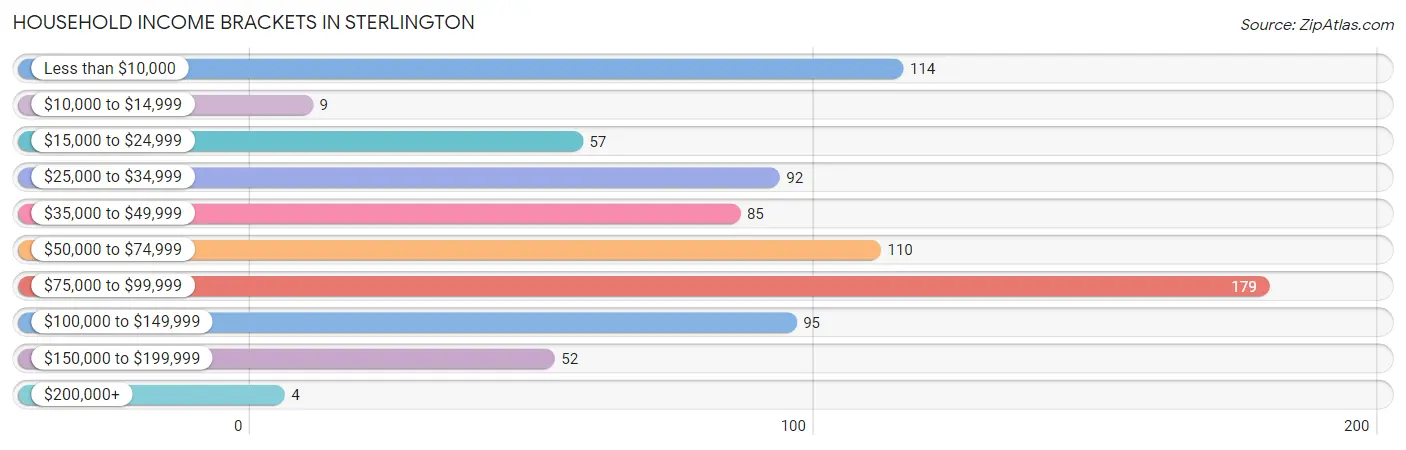
| Income Bracket | # Households | % Households |
| Less than $10,000 | 114 | 14.3% |
| $10,000 to $14,999 | 9 | 1.1% |
| $15,000 to $24,999 | 57 | 7.2% |
| $25,000 to $34,999 | 92 | 11.5% |
| $35,000 to $49,999 | 85 | 10.7% |
| $50,000 to $74,999 | 110 | 13.8% |
| $75,000 to $99,999 | 179 | 22.5% |
| $100,000 to $149,999 | 95 | 11.9% |
| $150,000 to $199,999 | 52 | 6.5% |
| $200,000+ | 4 | 0.5% |
Household Income by Householder Age in Sterlington
The median household income in Sterlington is $66,420, with the highest median household income of $76,198 found in the 25 to 44 years age bracket for the primary householder. A total of 307 households (38.5%) fall into this category. Meanwhile, the 15 to 24 years age bracket for the primary householder has the lowest median household income of $0, with 51 households (6.4%) in this group.
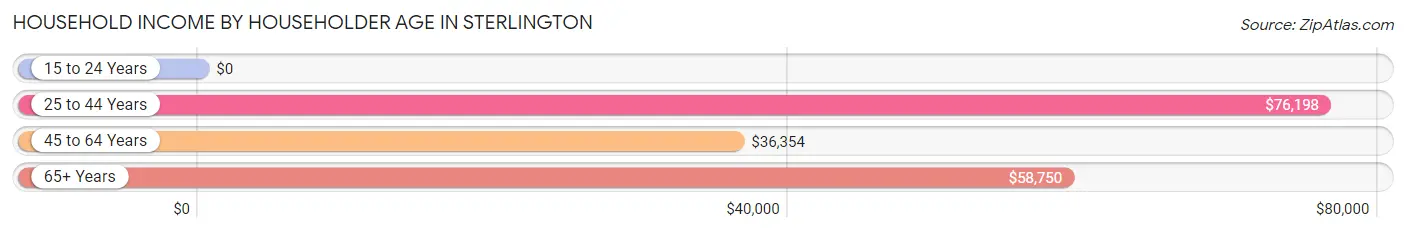
| Income Bracket | # Households | Median Income |
| 15 to 24 Years | 51 (6.4%) | $0 |
| 25 to 44 Years | 307 (38.5%) | $76,198 |
| 45 to 64 Years | 217 (27.2%) | $36,354 |
| 65+ Years | 222 (27.9%) | $58,750 |
| Total | 797 (100.0%) | $66,420 |
Poverty in Sterlington
Income Below Poverty by Sex and Age in Sterlington
With 15.8% poverty level for males and 22.3% for females among the residents of Sterlington, 6 to 11 year old males and 18 to 24 year old females are the most vulnerable to poverty, with 62 males (56.9%) and 18 females (48.6%) in their respective age groups living below the poverty level.
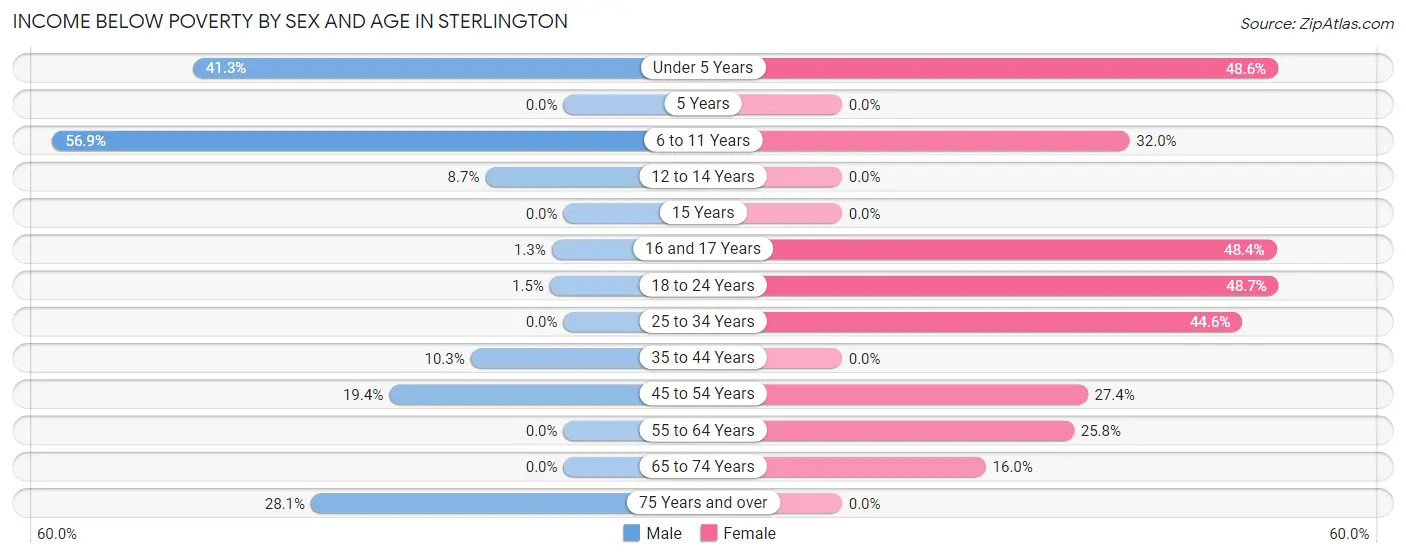
| Age Bracket | Male | Female |
| Under 5 Years | 33 (41.2%) | 17 (48.6%) |
| 5 Years | 0 (0.0%) | 0 (0.0%) |
| 6 to 11 Years | 62 (56.9%) | 49 (32.0%) |
| 12 to 14 Years | 4 (8.7%) | 0 (0.0%) |
| 15 Years | 0 (0.0%) | 0 (0.0%) |
| 16 and 17 Years | 1 (1.3%) | 15 (48.4%) |
| 18 to 24 Years | 1 (1.5%) | 18 (48.6%) |
| 25 to 34 Years | 0 (0.0%) | 66 (44.6%) |
| 35 to 44 Years | 15 (10.3%) | 0 (0.0%) |
| 45 to 54 Years | 20 (19.4%) | 26 (27.4%) |
| 55 to 64 Years | 0 (0.0%) | 23 (25.8%) |
| 65 to 74 Years | 0 (0.0%) | 33 (16.0%) |
| 75 Years and over | 18 (28.1%) | 0 (0.0%) |
| Total | 154 (15.8%) | 247 (22.3%) |
Income Above Poverty by Sex and Age in Sterlington
According to the poverty statistics in Sterlington, males aged 5 years and females aged 5 years are the age groups that are most secure financially, with 100.0% of males and 100.0% of females in these age groups living above the poverty line.
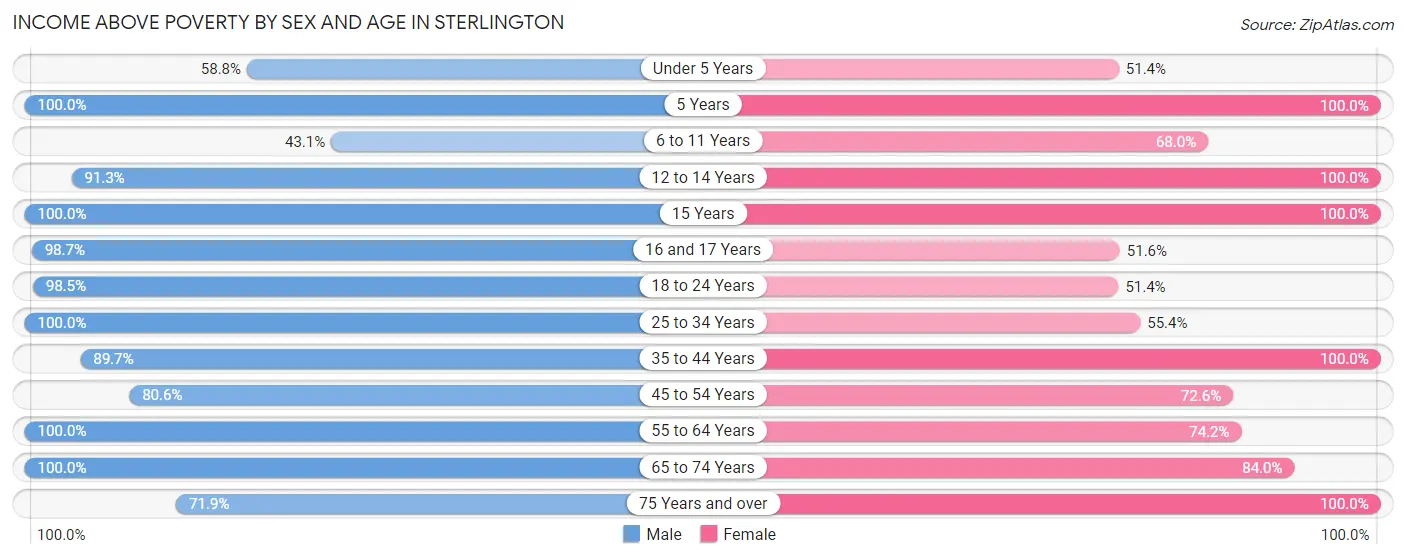
| Age Bracket | Male | Female |
| Under 5 Years | 47 (58.8%) | 18 (51.4%) |
| 5 Years | 7 (100.0%) | 6 (100.0%) |
| 6 to 11 Years | 47 (43.1%) | 104 (68.0%) |
| 12 to 14 Years | 42 (91.3%) | 131 (100.0%) |
| 15 Years | 16 (100.0%) | 5 (100.0%) |
| 16 and 17 Years | 75 (98.7%) | 16 (51.6%) |
| 18 to 24 Years | 65 (98.5%) | 19 (51.3%) |
| 25 to 34 Years | 59 (100.0%) | 82 (55.4%) |
| 35 to 44 Years | 130 (89.7%) | 160 (100.0%) |
| 45 to 54 Years | 83 (80.6%) | 69 (72.6%) |
| 55 to 64 Years | 34 (100.0%) | 66 (74.2%) |
| 65 to 74 Years | 171 (100.0%) | 173 (84.0%) |
| 75 Years and over | 46 (71.9%) | 12 (100.0%) |
| Total | 822 (84.2%) | 861 (77.7%) |
Income Below Poverty Among Married-Couple Families in Sterlington
The poverty statistics for married-couple families in Sterlington show that 5.6% or 23 of the total 412 families live below the poverty line. Families with 1 or 2 children have the highest poverty rate of 20.0%, comprising of 23 families. On the other hand, families with no children have the lowest poverty rate of 0.0%, which includes 0 families.
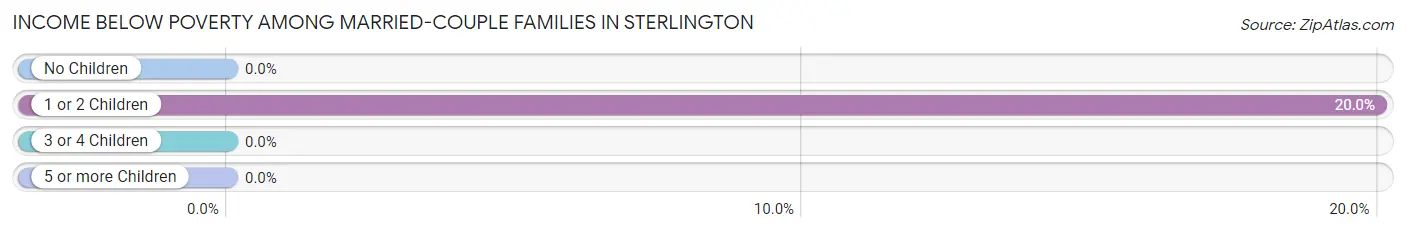
| Children | Above Poverty | Below Poverty |
| No Children | 258 (100.0%) | 0 (0.0%) |
| 1 or 2 Children | 92 (80.0%) | 23 (20.0%) |
| 3 or 4 Children | 39 (100.0%) | 0 (0.0%) |
| 5 or more Children | 0 (0.0%) | 0 (0.0%) |
| Total | 389 (94.4%) | 23 (5.6%) |
Income Below Poverty Among Single-Parent Households in Sterlington
According to the poverty data in Sterlington, 75.0% or 12 single-father households and 28.6% or 46 single-mother households are living below the poverty line. Among single-father households, those with no children have the highest poverty rate, with 11 households (100.0%) experiencing poverty. Likewise, among single-mother households, those with 3 or 4 children have the highest poverty rate, with 13 households (100.0%) falling below the poverty line.
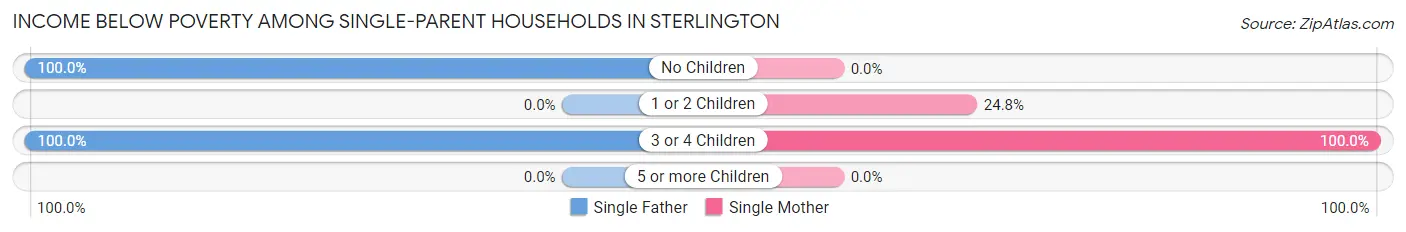
| Children | Single Father | Single Mother |
| No Children | 11 (100.0%) | 0 (0.0%) |
| 1 or 2 Children | 0 (0.0%) | 33 (24.8%) |
| 3 or 4 Children | 1 (100.0%) | 13 (100.0%) |
| 5 or more Children | 0 (0.0%) | 0 (0.0%) |
| Total | 12 (75.0%) | 46 (28.6%) |
Income Below Poverty Among Married-Couple vs Single-Parent Households in Sterlington
The poverty data for Sterlington shows that 23 of the married-couple family households (5.6%) and 58 of the single-parent households (32.8%) are living below the poverty level. Within the married-couple family households, those with 1 or 2 children have the highest poverty rate, with 23 households (20.0%) falling below the poverty line. Among the single-parent households, those with 3 or 4 children have the highest poverty rate, with 14 household (100.0%) living below poverty.
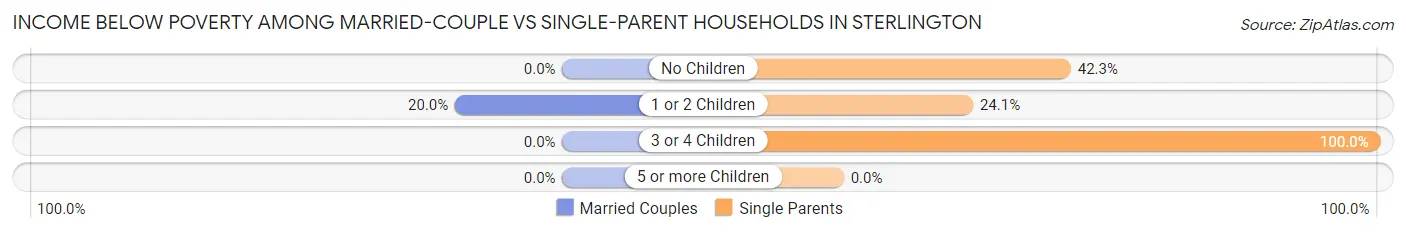
| Children | Married-Couple Families | Single-Parent Households |
| No Children | 0 (0.0%) | 11 (42.3%) |
| 1 or 2 Children | 23 (20.0%) | 33 (24.1%) |
| 3 or 4 Children | 0 (0.0%) | 14 (100.0%) |
| 5 or more Children | 0 (0.0%) | 0 (0.0%) |
| Total | 23 (5.6%) | 58 (32.8%) |
Race in Sterlington
The most populous races in Sterlington are White / Caucasian (1,693 | 80.9%), Black / African American (357 | 17.1%), and Hispanic or Latino (62 | 3.0%).
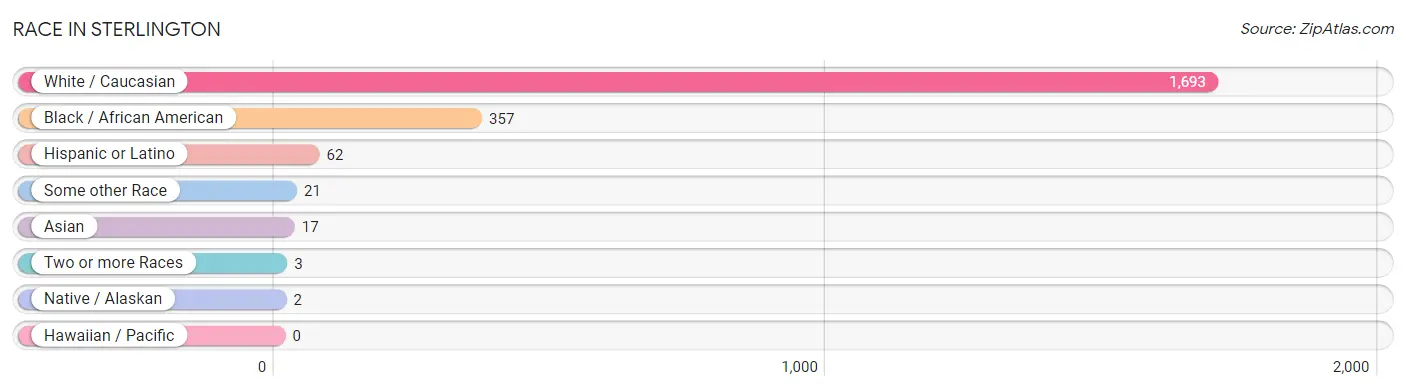
| Race | # Population | % Population |
| Asian | 17 | 0.8% |
| Black / African American | 357 | 17.1% |
| Hawaiian / Pacific | 0 | 0.0% |
| Hispanic or Latino | 62 | 3.0% |
| Native / Alaskan | 2 | 0.1% |
| White / Caucasian | 1,693 | 80.9% |
| Two or more Races | 3 | 0.1% |
| Some other Race | 21 | 1.0% |
| Total | 2,093 | 100.0% |
Ancestry in Sterlington
The most populous ancestries reported in Sterlington are English (287 | 13.7%), Irish (270 | 12.9%), American (153 | 7.3%), German (81 | 3.9%), and South American (41 | 2.0%), together accounting for 39.8% of all Sterlington residents.
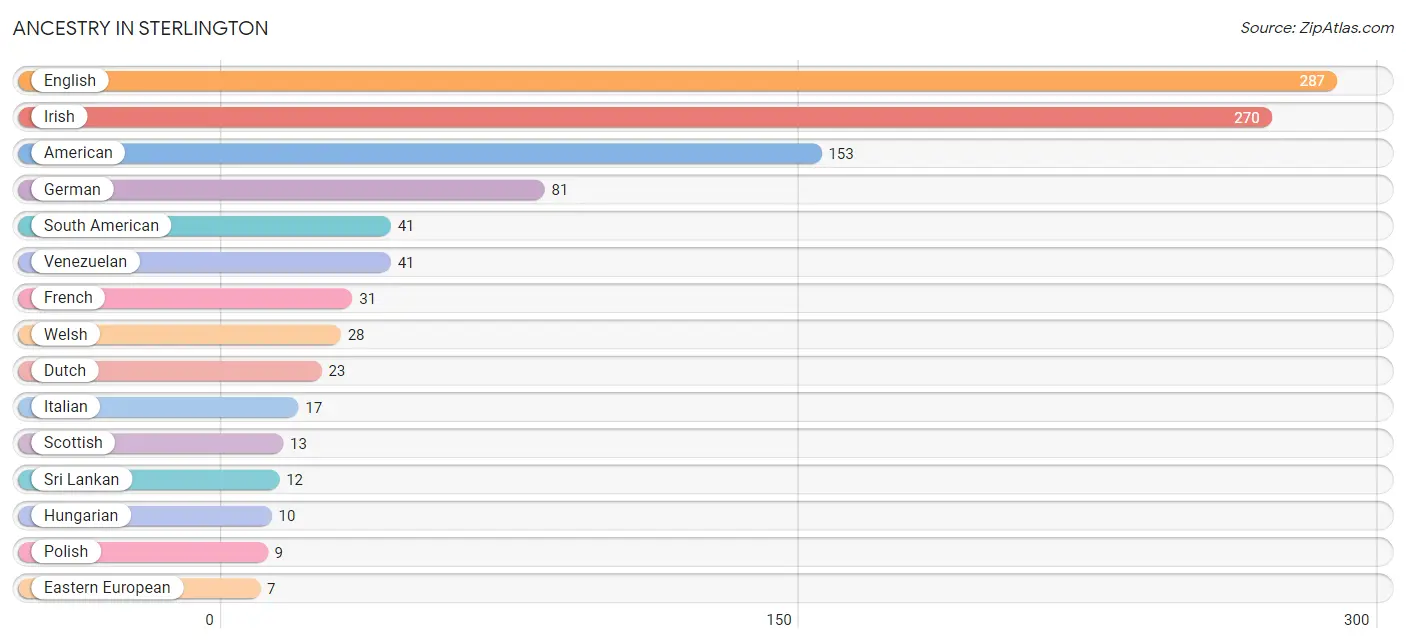
| Ancestry | # Population | % Population |
| African | 1 | 0.1% |
| American | 153 | 7.3% |
| Cajun | 6 | 0.3% |
| Cherokee | 2 | 0.1% |
| Danish | 2 | 0.1% |
| Dutch | 23 | 1.1% |
| Eastern European | 7 | 0.3% |
| English | 287 | 13.7% |
| European | 3 | 0.1% |
| Filipino | 4 | 0.2% |
| French | 31 | 1.5% |
| French Canadian | 4 | 0.2% |
| German | 81 | 3.9% |
| Hungarian | 10 | 0.5% |
| Indian (Asian) | 4 | 0.2% |
| Iranian | 7 | 0.3% |
| Irish | 270 | 12.9% |
| Italian | 17 | 0.8% |
| Polish | 9 | 0.4% |
| Scotch-Irish | 6 | 0.3% |
| Scottish | 13 | 0.6% |
| Slavic | 7 | 0.3% |
| South American | 41 | 2.0% |
| Sri Lankan | 12 | 0.6% |
| Subsaharan African | 1 | 0.1% |
| Venezuelan | 41 | 2.0% |
| Welsh | 28 | 1.3% | View All 27 Rows |
Immigrants in Sterlington
The most numerous immigrant groups reported in Sterlington came from Latin America (49 | 2.3%), South America (41 | 2.0%), Venezuela (41 | 2.0%), Central America (8 | 0.4%), and Mexico (8 | 0.4%), together accounting for 7.0% of all Sterlington residents.
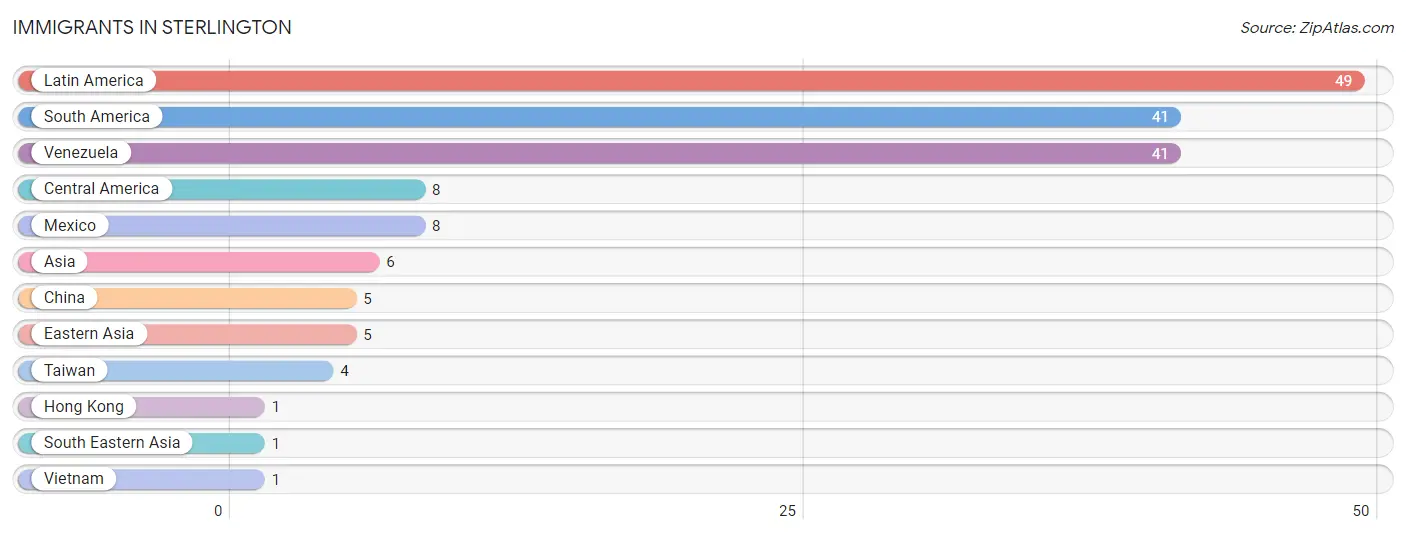
| Immigration Origin | # Population | % Population |
| Asia | 6 | 0.3% |
| Central America | 8 | 0.4% |
| China | 5 | 0.2% |
| Eastern Asia | 5 | 0.2% |
| Hong Kong | 1 | 0.1% |
| Latin America | 49 | 2.3% |
| Mexico | 8 | 0.4% |
| South America | 41 | 2.0% |
| South Eastern Asia | 1 | 0.1% |
| Taiwan | 4 | 0.2% |
| Venezuela | 41 | 2.0% |
| Vietnam | 1 | 0.1% | View All 12 Rows |
Sex and Age in Sterlington
Sex and Age in Sterlington
The most populous age groups in Sterlington are 15 to 19 Years (103 | 10.5%) for men and 10 to 14 Years (206 | 18.5%) for women.
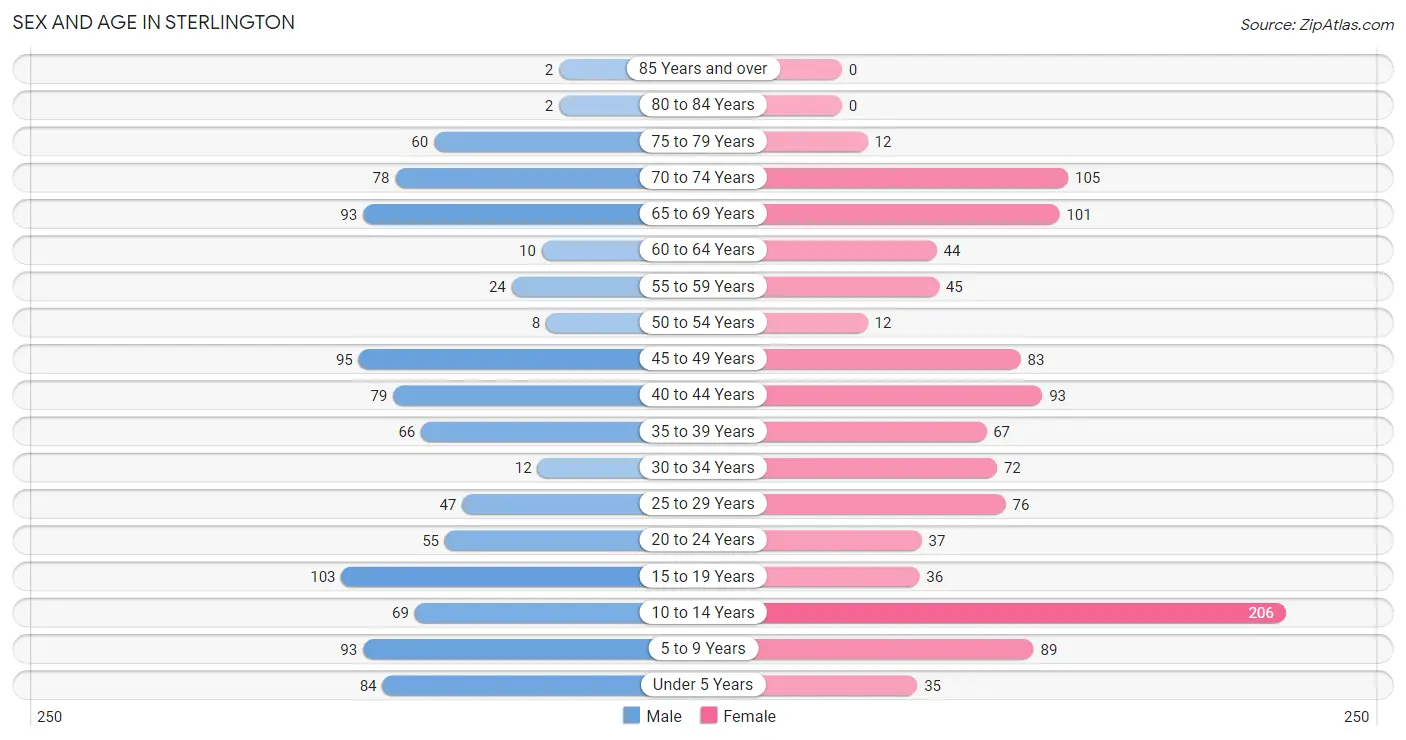
| Age Bracket | Male | Female |
| Under 5 Years | 84 (8.6%) | 35 (3.1%) |
| 5 to 9 Years | 93 (9.5%) | 89 (8.0%) |
| 10 to 14 Years | 69 (7.0%) | 206 (18.5%) |
| 15 to 19 Years | 103 (10.5%) | 36 (3.2%) |
| 20 to 24 Years | 55 (5.6%) | 37 (3.3%) |
| 25 to 29 Years | 47 (4.8%) | 76 (6.8%) |
| 30 to 34 Years | 12 (1.2%) | 72 (6.5%) |
| 35 to 39 Years | 66 (6.7%) | 67 (6.0%) |
| 40 to 44 Years | 79 (8.1%) | 93 (8.4%) |
| 45 to 49 Years | 95 (9.7%) | 83 (7.5%) |
| 50 to 54 Years | 8 (0.8%) | 12 (1.1%) |
| 55 to 59 Years | 24 (2.5%) | 45 (4.0%) |
| 60 to 64 Years | 10 (1.0%) | 44 (4.0%) |
| 65 to 69 Years | 93 (9.5%) | 101 (9.1%) |
| 70 to 74 Years | 78 (8.0%) | 105 (9.4%) |
| 75 to 79 Years | 60 (6.1%) | 12 (1.1%) |
| 80 to 84 Years | 2 (0.2%) | 0 (0.0%) |
| 85 Years and over | 2 (0.2%) | 0 (0.0%) |
| Total | 980 (100.0%) | 1,113 (100.0%) |
Families and Households in Sterlington
Median Family Size in Sterlington
The median family size in Sterlington is 3.09 persons per family, with single male/father families (16 | 2.7%) accounting for the largest median family size of 3.88 persons per family. On the other hand, single female/mother families (161 | 27.3%) represent the smallest median family size with 2.88 persons per family.
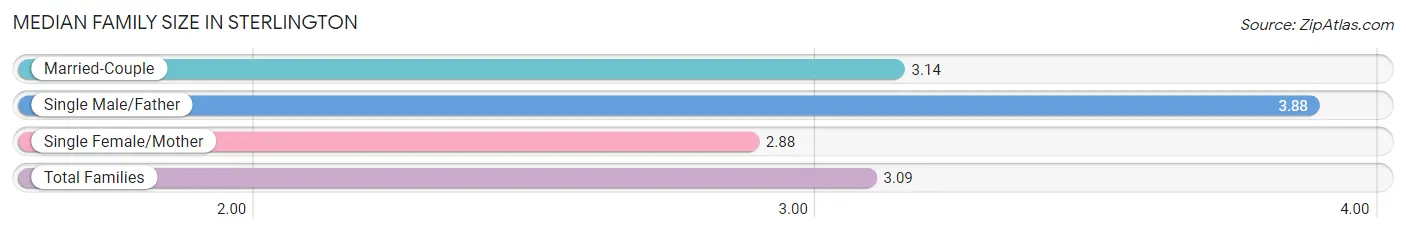
| Family Type | # Families | Family Size |
| Married-Couple | 412 (70.0%) | 3.14 |
| Single Male/Father | 16 (2.7%) | 3.88 |
| Single Female/Mother | 161 (27.3%) | 2.88 |
| Total Families | 589 (100.0%) | 3.09 |
Median Household Size in Sterlington
The median household size in Sterlington is 2.63 persons per household, with single male/father households (16 | 2.0%) accounting for the largest median household size of 3.88 persons per household. non-family households (208 | 26.1%) represent the smallest median household size with 1.24 persons per household.
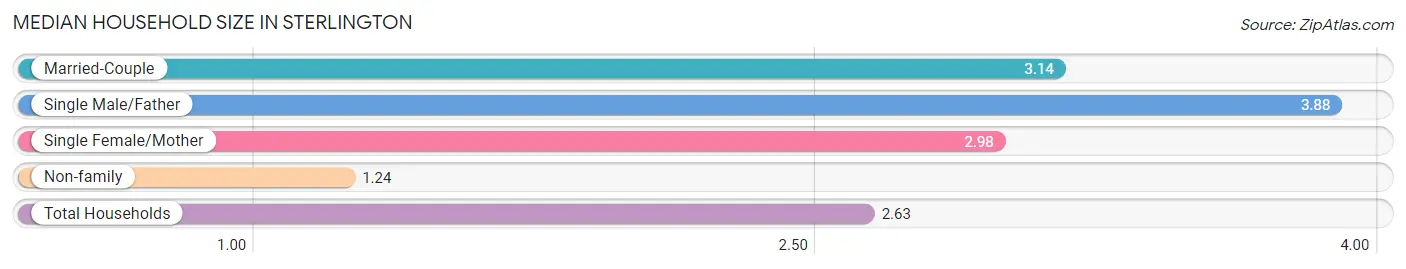
| Household Type | # Households | Household Size |
| Married-Couple | 412 (51.7%) | 3.14 |
| Single Male/Father | 16 (2.0%) | 3.88 |
| Single Female/Mother | 161 (20.2%) | 2.98 |
| Non-family | 208 (26.1%) | 1.24 |
| Total Households | 797 (100.0%) | 2.63 |
Household Size by Marriage Status in Sterlington
Out of a total of 797 households in Sterlington, 589 (73.9%) are family households, while 208 (26.1%) are nonfamily households. The most numerous type of family households are 2-person households, comprising 336, and the most common type of nonfamily households are 1-person households, comprising 183.
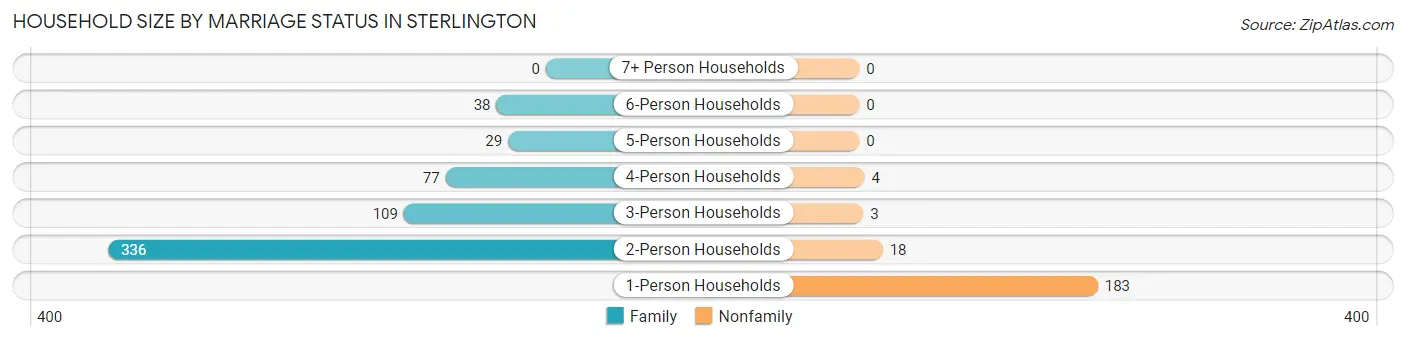
| Household Size | Family Households | Nonfamily Households |
| 1-Person Households | - | 183 (23.0%) |
| 2-Person Households | 336 (42.2%) | 18 (2.3%) |
| 3-Person Households | 109 (13.7%) | 3 (0.4%) |
| 4-Person Households | 77 (9.7%) | 4 (0.5%) |
| 5-Person Households | 29 (3.6%) | 0 (0.0%) |
| 6-Person Households | 38 (4.8%) | 0 (0.0%) |
| 7+ Person Households | 0 (0.0%) | 0 (0.0%) |
| Total | 589 (73.9%) | 208 (26.1%) |
Female Fertility in Sterlington
Fertility by Age in Sterlington
Average fertility rate in Sterlington is 21.0 births per 1,000 women. Women in the age bracket of 35 to 50 years have the highest fertility rate with 24.0 births per 1,000 women. Women in the age bracket of 35 to 50 years acount for 60.0% of all women with births.
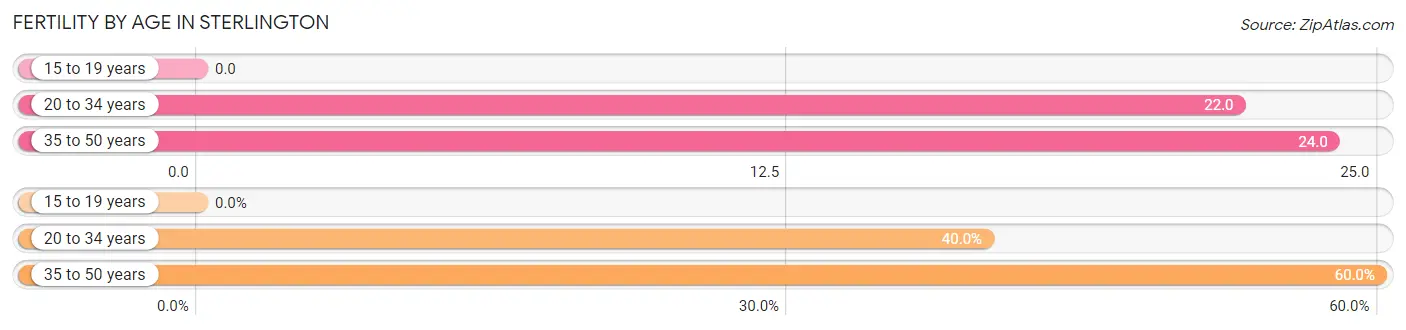
| Age Bracket | Women with Births | Births / 1,000 Women |
| 15 to 19 years | 0 (0.0%) | 0.0 |
| 20 to 34 years | 4 (40.0%) | 22.0 |
| 35 to 50 years | 6 (60.0%) | 24.0 |
| Total | 10 (100.0%) | 21.0 |
Fertility by Age by Marriage Status in Sterlington
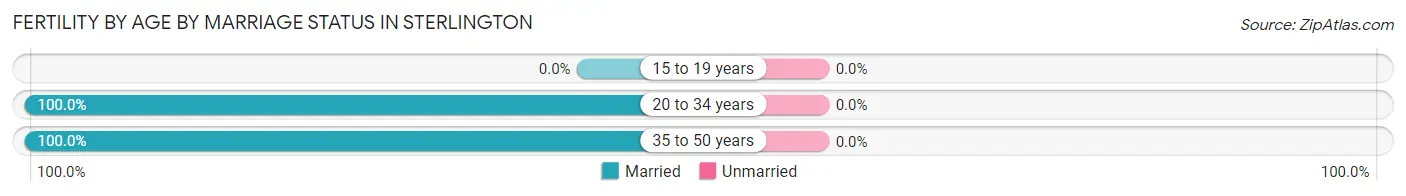
| Age Bracket | Married | Unmarried |
| 15 to 19 years | 0 (0.0%) | 0 (0.0%) |
| 20 to 34 years | 4 (100.0%) | 0 (0.0%) |
| 35 to 50 years | 6 (100.0%) | 0 (0.0%) |
| Total | 10 (100.0%) | 0 (0.0%) |
Fertility by Education in Sterlington
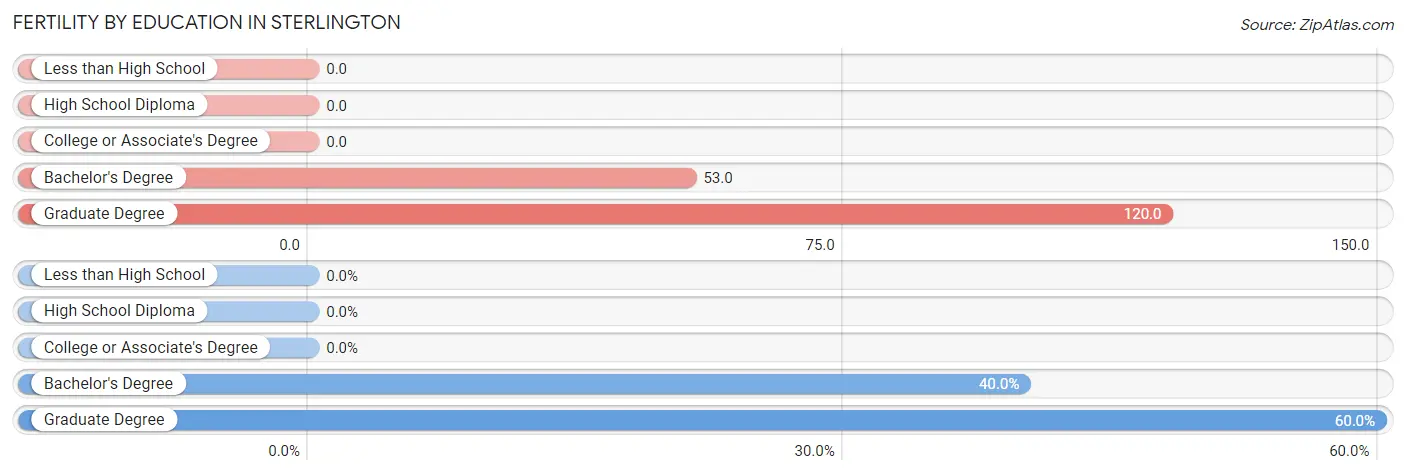
| Educational Attainment | Women with Births | Births / 1,000 Women |
| Less than High School | 0 (0.0%) | 0.0 |
| High School Diploma | 0 (0.0%) | 0.0 |
| College or Associate's Degree | 0 (0.0%) | 0.0 |
| Bachelor's Degree | 4 (40.0%) | 53.0 |
| Graduate Degree | 6 (60.0%) | 120.0 |
| Total | 10 (100.0%) | 21.0 |
Fertility by Education by Marriage Status in Sterlington
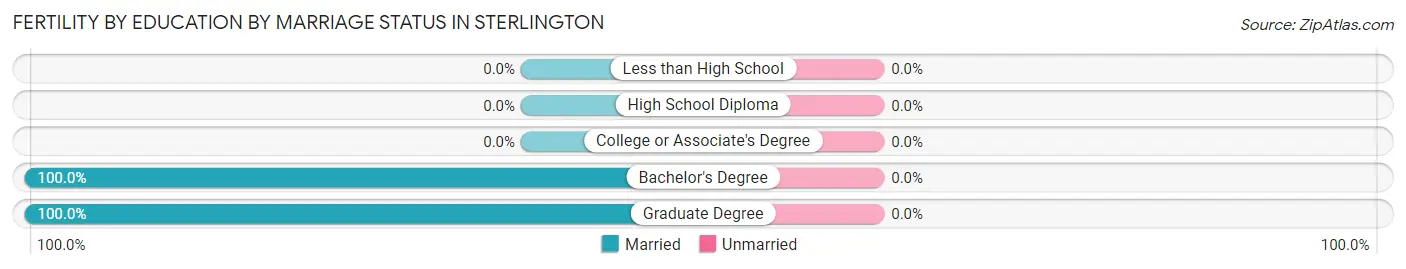
| Educational Attainment | Married | Unmarried |
| Less than High School | 0 (0.0%) | 0 (0.0%) |
| High School Diploma | 0 (0.0%) | 0 (0.0%) |
| College or Associate's Degree | 0 (0.0%) | 0 (0.0%) |
| Bachelor's Degree | 4 (100.0%) | 0 (0.0%) |
| Graduate Degree | 6 (100.0%) | 0 (0.0%) |
| Total | 10 (100.0%) | 0 (0.0%) |
Employment Characteristics in Sterlington
Employment by Class of Employer in Sterlington
Among the 929 employed individuals in Sterlington, private company employees (660 | 71.0%), self-employed (not incorporated) (83 | 8.9%), and not-for-profit organizations (82 | 8.8%) make up the most common classes of employment.
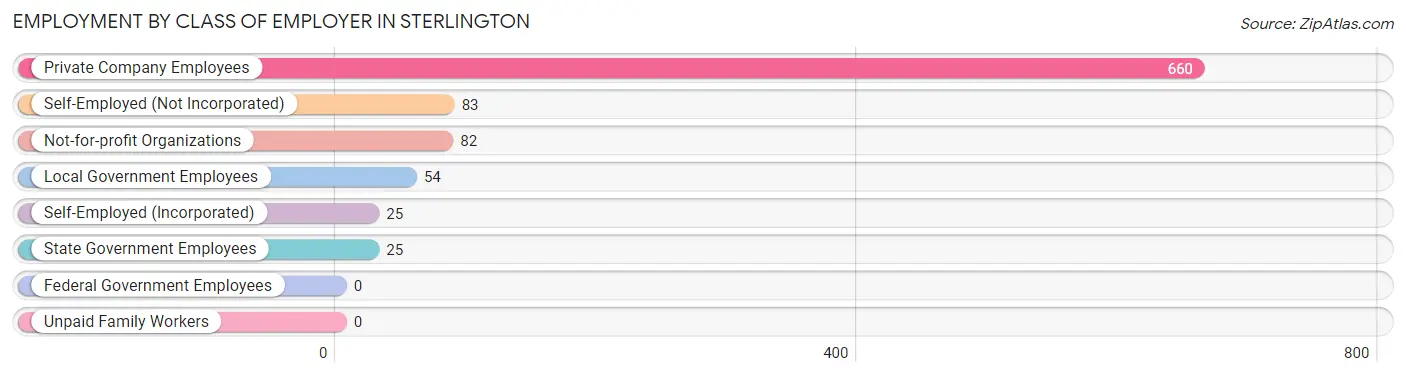
| Employer Class | # Employees | % Employees |
| Private Company Employees | 660 | 71.0% |
| Self-Employed (Incorporated) | 25 | 2.7% |
| Self-Employed (Not Incorporated) | 83 | 8.9% |
| Not-for-profit Organizations | 82 | 8.8% |
| Local Government Employees | 54 | 5.8% |
| State Government Employees | 25 | 2.7% |
| Federal Government Employees | 0 | 0.0% |
| Unpaid Family Workers | 0 | 0.0% |
| Total | 929 | 100.0% |
Employment Status by Age in Sterlington
According to the labor force statistics for Sterlington, out of the total population over 16 years of age (1,496), 62.6% or 936 individuals are in the labor force, with 0.7% or 7 of them unemployed. The age group with the highest labor force participation rate is 55 to 59 years, with 100.0% or 69 individuals in the labor force. Within the labor force, the 16 to 19 years age range has the highest percentage of unemployed individuals, with 10.8% or 7 of them being unemployed.
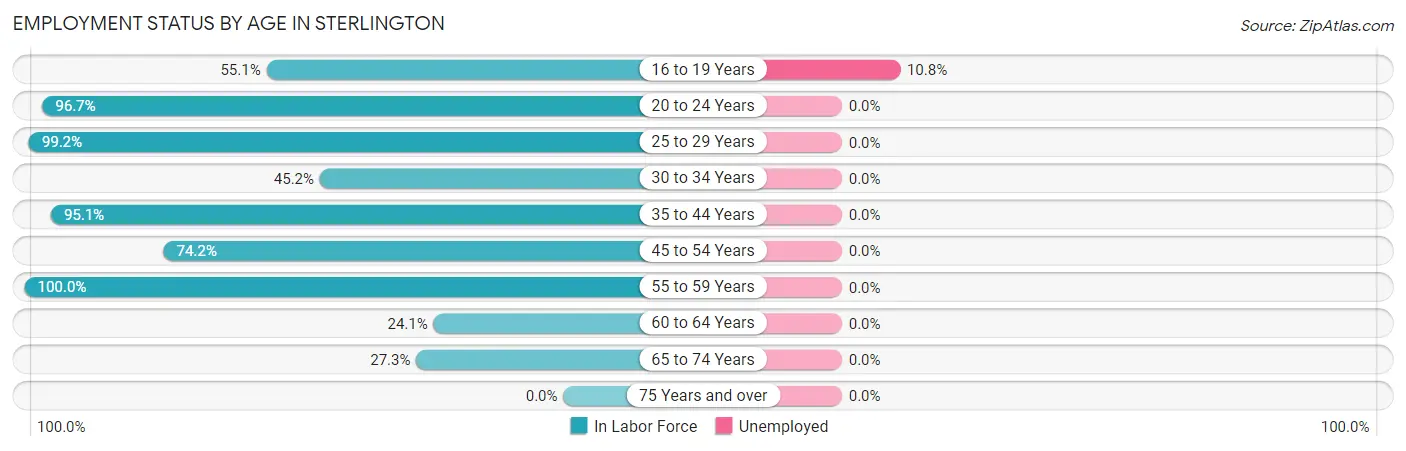
| Age Bracket | In Labor Force | Unemployed |
| 16 to 19 Years | 65 (55.1%) | 7 (10.8%) |
| 20 to 24 Years | 89 (96.7%) | 0 (0.0%) |
| 25 to 29 Years | 122 (99.2%) | 0 (0.0%) |
| 30 to 34 Years | 38 (45.2%) | 0 (0.0%) |
| 35 to 44 Years | 290 (95.1%) | 0 (0.0%) |
| 45 to 54 Years | 147 (74.2%) | 0 (0.0%) |
| 55 to 59 Years | 69 (100.0%) | 0 (0.0%) |
| 60 to 64 Years | 13 (24.1%) | 0 (0.0%) |
| 65 to 74 Years | 103 (27.3%) | 0 (0.0%) |
| 75 Years and over | 0 (0.0%) | 0 (0.0%) |
| Total | 936 (62.6%) | 7 (0.7%) |
Employment Status by Educational Attainment in Sterlington
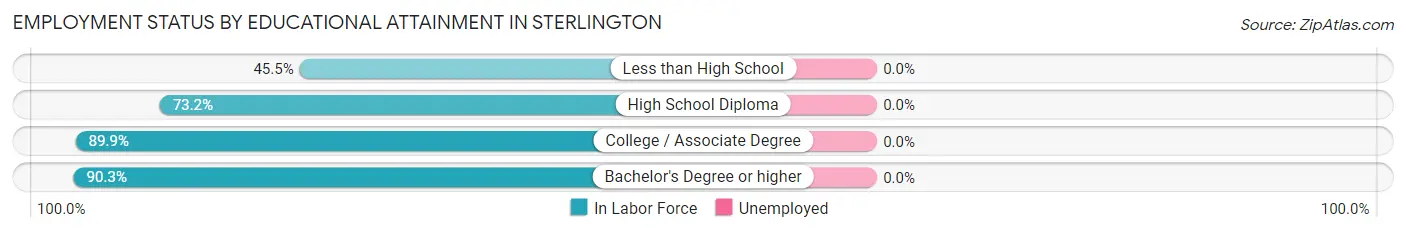
| Educational Attainment | In Labor Force | Unemployed |
| Less than High School | 25 (45.5%) | 0 (0.0%) |
| High School Diploma | 202 (73.2%) | 0 (0.0%) |
| College / Associate Degree | 284 (89.9%) | 0 (0.0%) |
| Bachelor's Degree or higher | 168 (90.3%) | 0 (0.0%) |
| Total | 679 (81.5%) | 0 (0.0%) |
Employment Occupations by Sex in Sterlington
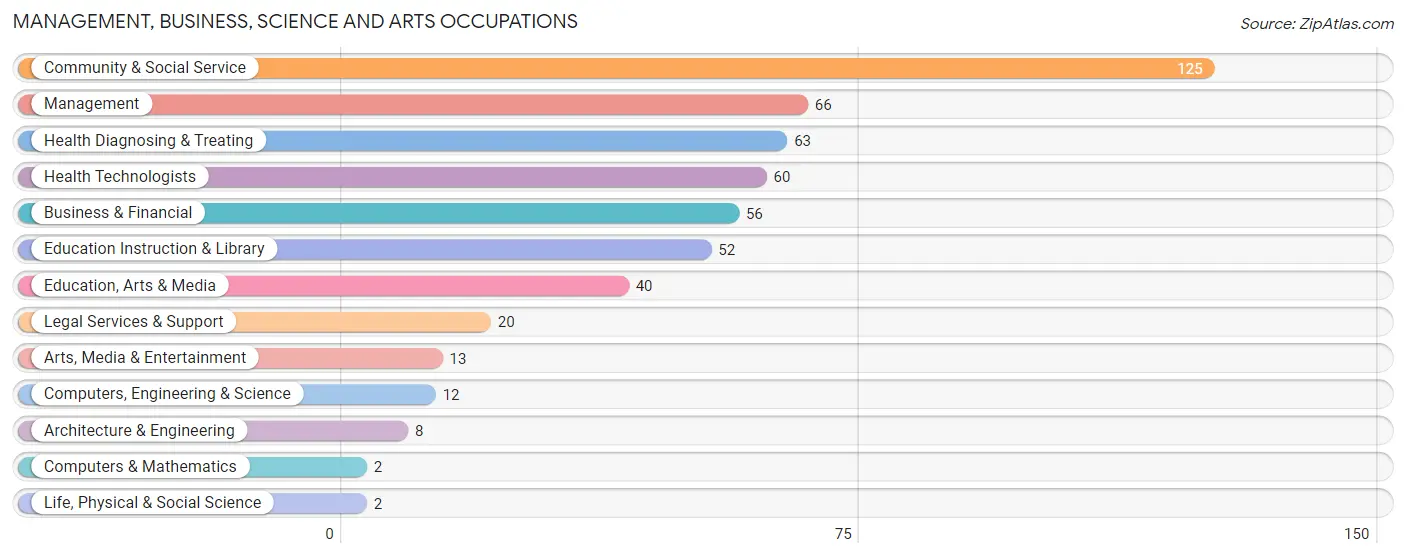
Management, Business, Science and Arts Occupations
The most common Management, Business, Science and Arts occupations in Sterlington are Community & Social Service (125 | 13.5%), Management (66 | 7.1%), Health Diagnosing & Treating (63 | 6.8%), Health Technologists (60 | 6.5%), and Business & Financial (56 | 6.0%).
Management, Business, Science and Arts Occupations by Sex
Within the Management, Business, Science and Arts occupations in Sterlington, the most male-oriented occupations are Computers, Engineering & Science (100.0%), Computers & Mathematics (100.0%), and Architecture & Engineering (100.0%), while the most female-oriented occupations are Arts, Media & Entertainment (100.0%), Health Diagnosing & Treating (93.6%), and Health Technologists (93.3%).
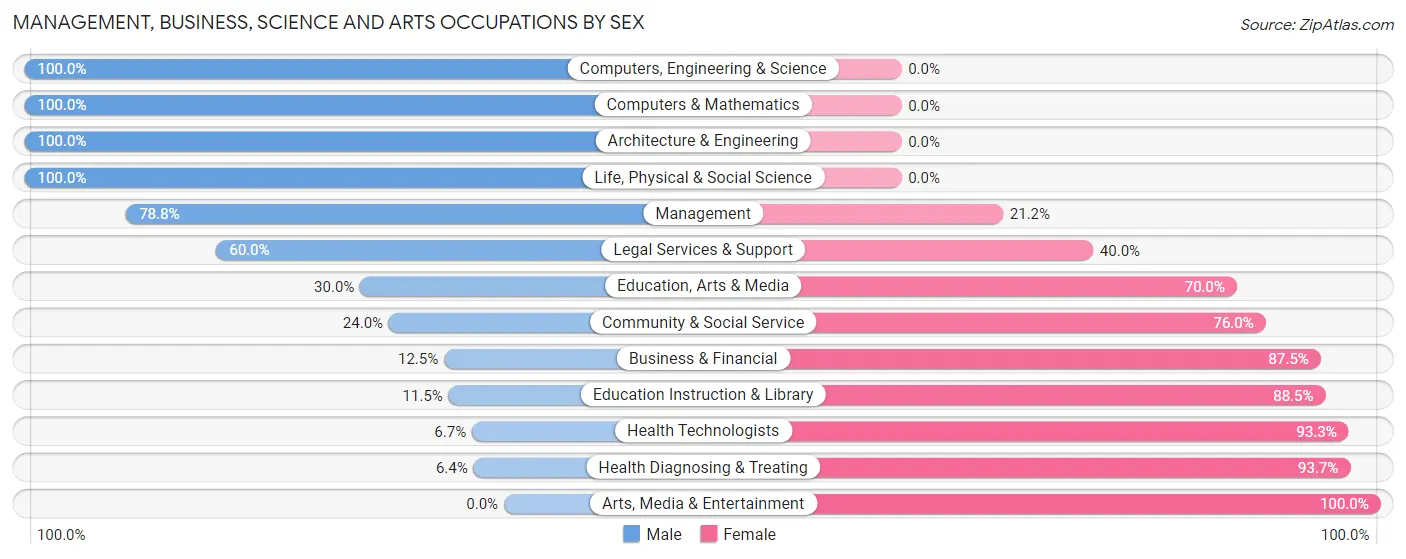
| Occupation | Male | Female |
| Management | 52 (78.8%) | 14 (21.2%) |
| Business & Financial | 7 (12.5%) | 49 (87.5%) |
| Computers, Engineering & Science | 12 (100.0%) | 0 (0.0%) |
| Computers & Mathematics | 2 (100.0%) | 0 (0.0%) |
| Architecture & Engineering | 8 (100.0%) | 0 (0.0%) |
| Life, Physical & Social Science | 2 (100.0%) | 0 (0.0%) |
| Community & Social Service | 30 (24.0%) | 95 (76.0%) |
| Education, Arts & Media | 12 (30.0%) | 28 (70.0%) |
| Legal Services & Support | 12 (60.0%) | 8 (40.0%) |
| Education Instruction & Library | 6 (11.5%) | 46 (88.5%) |
| Arts, Media & Entertainment | 0 (0.0%) | 13 (100.0%) |
| Health Diagnosing & Treating | 4 (6.4%) | 59 (93.6%) |
| Health Technologists | 4 (6.7%) | 56 (93.3%) |
| Total (Category) | 105 (32.6%) | 217 (67.4%) |
| Total (Overall) | 431 (46.4%) | 498 (53.6%) |
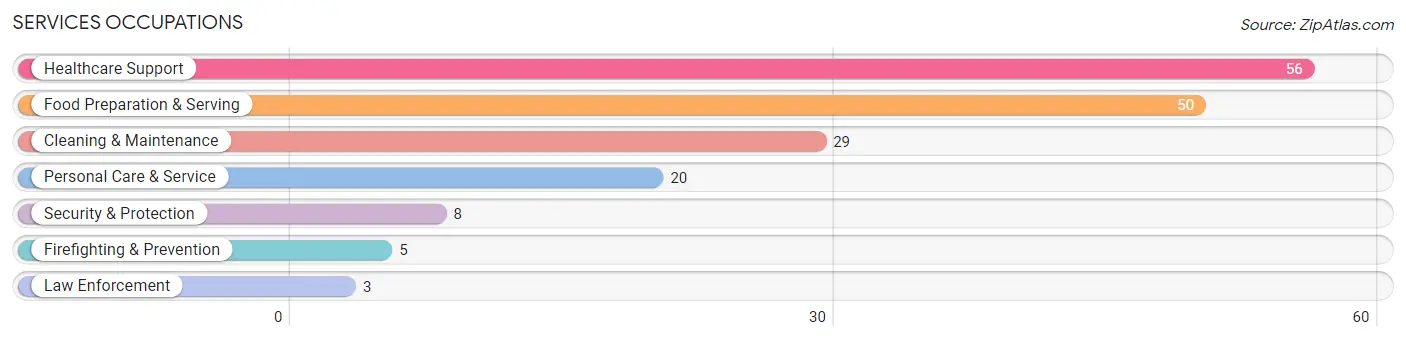
Services Occupations
The most common Services occupations in Sterlington are Healthcare Support (56 | 6.0%), Food Preparation & Serving (50 | 5.4%), Cleaning & Maintenance (29 | 3.1%), Personal Care & Service (20 | 2.1%), and Security & Protection (8 | 0.9%).
Services Occupations by Sex
Within the Services occupations in Sterlington, the most male-oriented occupations are Security & Protection (100.0%), Firefighting & Prevention (100.0%), and Law Enforcement (100.0%), while the most female-oriented occupations are Healthcare Support (100.0%), Personal Care & Service (95.0%), and Food Preparation & Serving (42.0%).
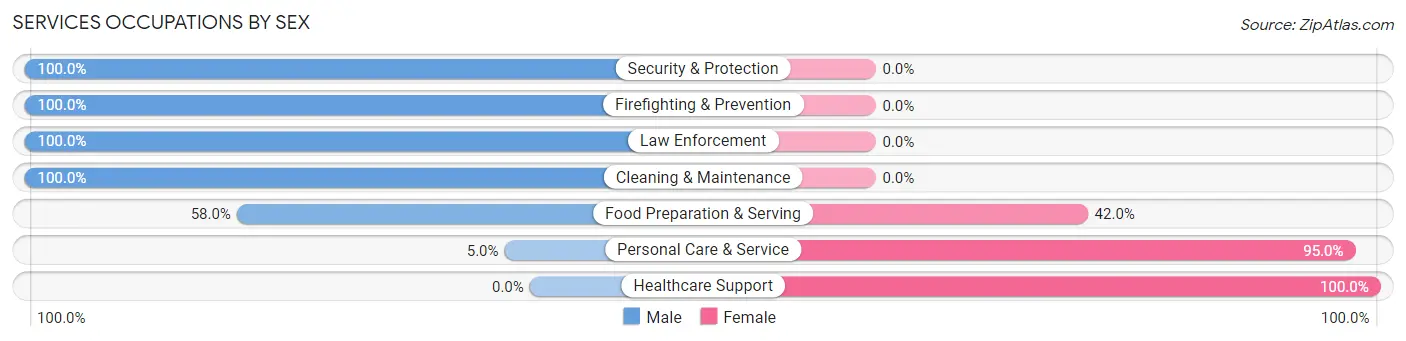
| Occupation | Male | Female |
| Healthcare Support | 0 (0.0%) | 56 (100.0%) |
| Security & Protection | 8 (100.0%) | 0 (0.0%) |
| Firefighting & Prevention | 5 (100.0%) | 0 (0.0%) |
| Law Enforcement | 3 (100.0%) | 0 (0.0%) |
| Food Preparation & Serving | 29 (58.0%) | 21 (42.0%) |
| Cleaning & Maintenance | 29 (100.0%) | 0 (0.0%) |
| Personal Care & Service | 1 (5.0%) | 19 (95.0%) |
| Total (Category) | 67 (41.1%) | 96 (58.9%) |
| Total (Overall) | 431 (46.4%) | 498 (53.6%) |
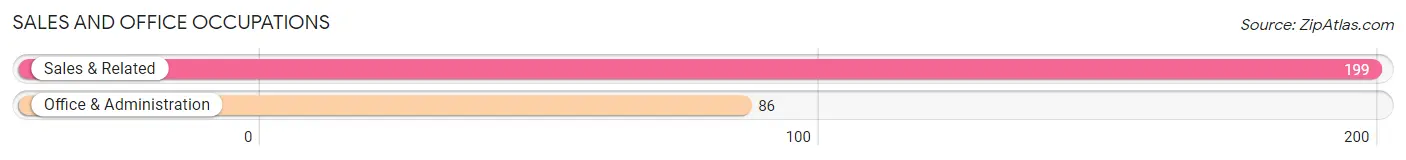
Sales and Office Occupations
The most common Sales and Office occupations in Sterlington are Sales & Related (199 | 21.4%), and Office & Administration (86 | 9.3%).
Sales and Office Occupations by Sex
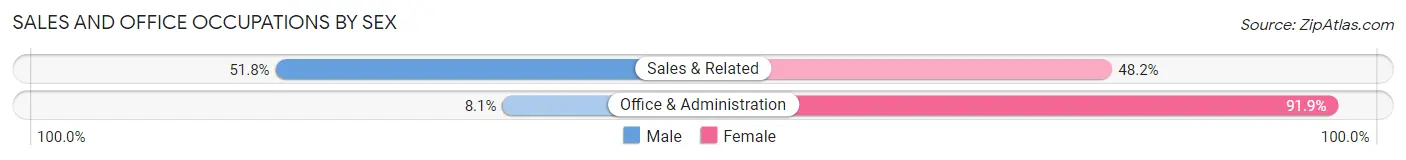
| Occupation | Male | Female |
| Sales & Related | 103 (51.8%) | 96 (48.2%) |
| Office & Administration | 7 (8.1%) | 79 (91.9%) |
| Total (Category) | 110 (38.6%) | 175 (61.4%) |
| Total (Overall) | 431 (46.4%) | 498 (53.6%) |
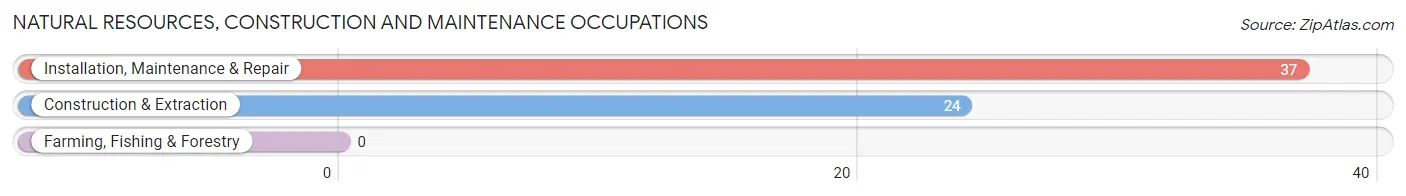
Natural Resources, Construction and Maintenance Occupations
The most common Natural Resources, Construction and Maintenance occupations in Sterlington are Installation, Maintenance & Repair (37 | 4.0%), and Construction & Extraction (24 | 2.6%).
Natural Resources, Construction and Maintenance Occupations by Sex
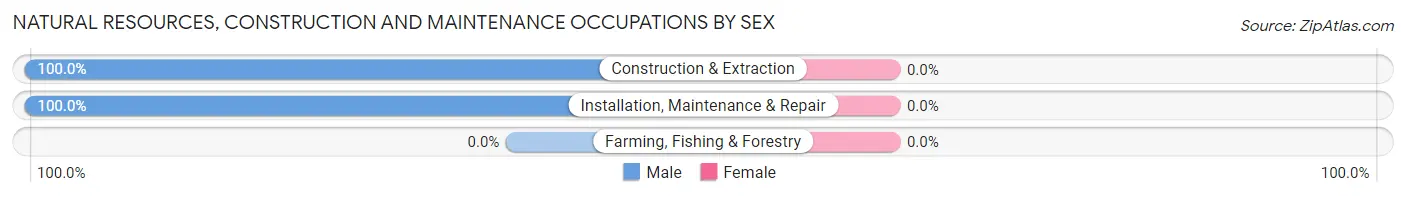
| Occupation | Male | Female |
| Farming, Fishing & Forestry | 0 (0.0%) | 0 (0.0%) |
| Construction & Extraction | 24 (100.0%) | 0 (0.0%) |
| Installation, Maintenance & Repair | 37 (100.0%) | 0 (0.0%) |
| Total (Category) | 61 (100.0%) | 0 (0.0%) |
| Total (Overall) | 431 (46.4%) | 498 (53.6%) |
Production, Transportation and Moving Occupations
The most common Production, Transportation and Moving occupations in Sterlington are Production (50 | 5.4%), Material Moving (32 | 3.4%), and Transportation (16 | 1.7%).
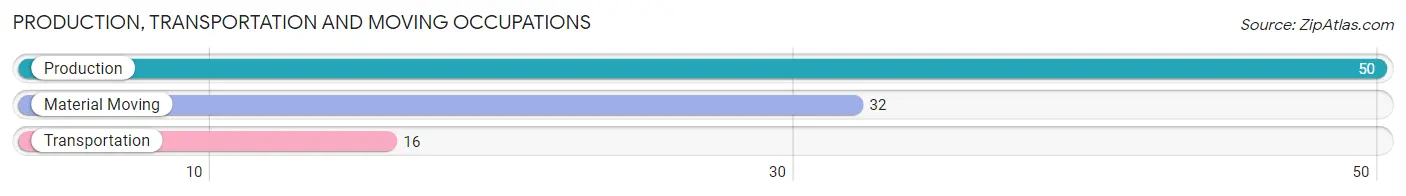
Production, Transportation and Moving Occupations by Sex
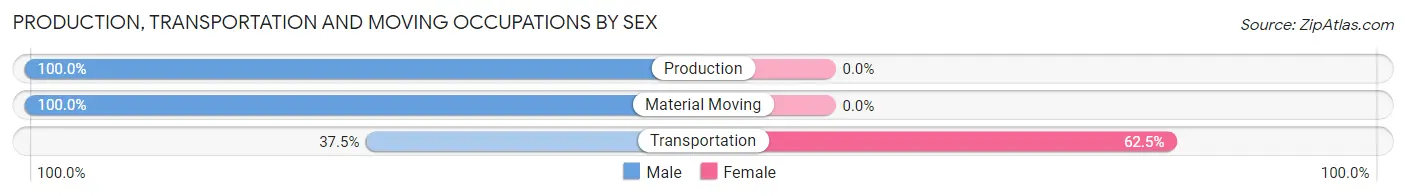
| Occupation | Male | Female |
| Production | 50 (100.0%) | 0 (0.0%) |
| Transportation | 6 (37.5%) | 10 (62.5%) |
| Material Moving | 32 (100.0%) | 0 (0.0%) |
| Total (Category) | 88 (89.8%) | 10 (10.2%) |
| Total (Overall) | 431 (46.4%) | 498 (53.6%) |
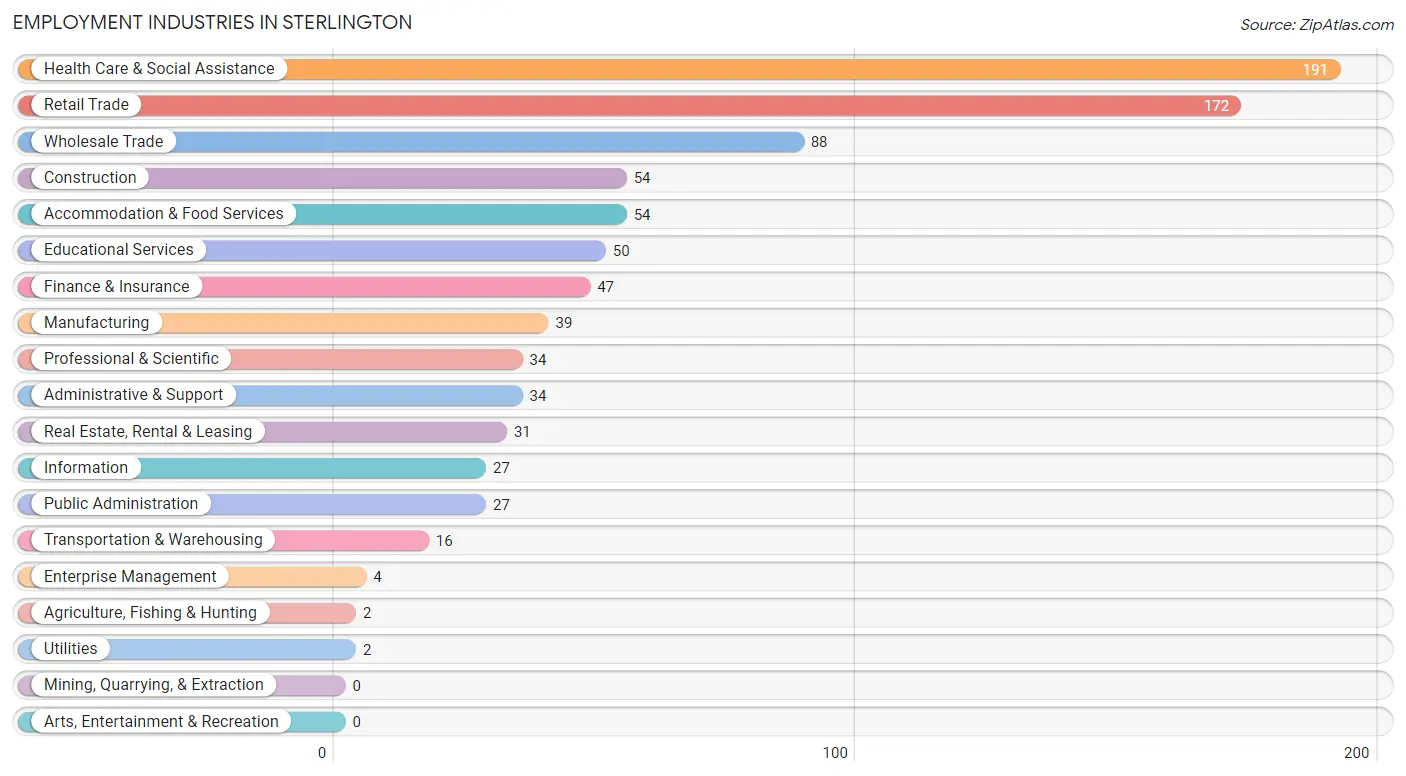
Employment Industries by Sex in Sterlington
Employment Industries in Sterlington
The major employment industries in Sterlington include Health Care & Social Assistance (191 | 20.6%), Retail Trade (172 | 18.5%), Wholesale Trade (88 | 9.5%), Construction (54 | 5.8%), and Accommodation & Food Services (54 | 5.8%).
Employment Industries by Sex in Sterlington
The Sterlington industries that see more men than women are Agriculture, Fishing & Hunting (100.0%), Construction (100.0%), and Manufacturing (100.0%), whereas the industries that tend to have a higher number of women are Enterprise Management (100.0%), Health Care & Social Assistance (96.3%), and Finance & Insurance (95.7%).
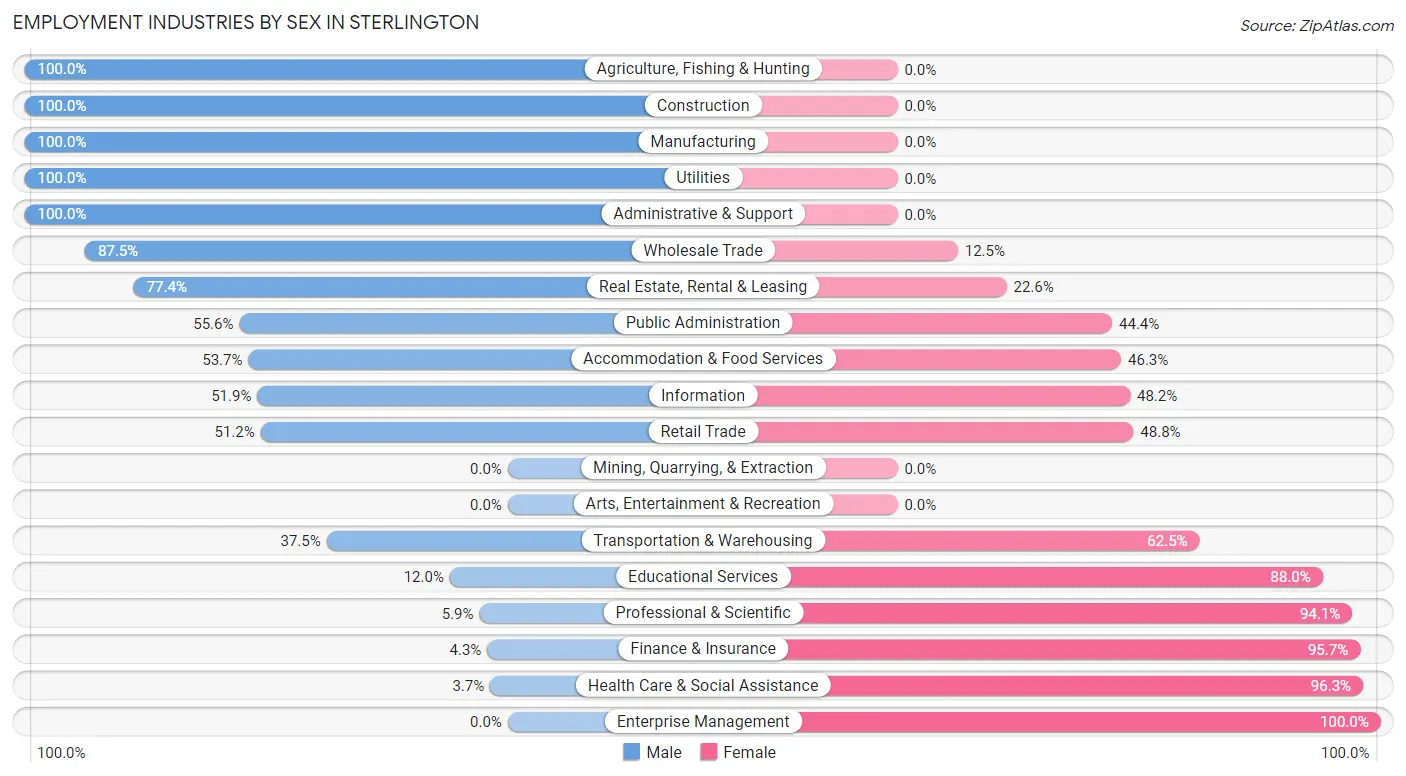
| Industry | Male | Female |
| Agriculture, Fishing & Hunting | 2 (100.0%) | 0 (0.0%) |
| Mining, Quarrying, & Extraction | 0 (0.0%) | 0 (0.0%) |
| Construction | 54 (100.0%) | 0 (0.0%) |
| Manufacturing | 39 (100.0%) | 0 (0.0%) |
| Wholesale Trade | 77 (87.5%) | 11 (12.5%) |
| Retail Trade | 88 (51.2%) | 84 (48.8%) |
| Transportation & Warehousing | 6 (37.5%) | 10 (62.5%) |
| Utilities | 2 (100.0%) | 0 (0.0%) |
| Information | 14 (51.8%) | 13 (48.1%) |
| Finance & Insurance | 2 (4.3%) | 45 (95.7%) |
| Real Estate, Rental & Leasing | 24 (77.4%) | 7 (22.6%) |
| Professional & Scientific | 2 (5.9%) | 32 (94.1%) |
| Enterprise Management | 0 (0.0%) | 4 (100.0%) |
| Administrative & Support | 34 (100.0%) | 0 (0.0%) |
| Educational Services | 6 (12.0%) | 44 (88.0%) |
| Health Care & Social Assistance | 7 (3.7%) | 184 (96.3%) |
| Arts, Entertainment & Recreation | 0 (0.0%) | 0 (0.0%) |
| Accommodation & Food Services | 29 (53.7%) | 25 (46.3%) |
| Public Administration | 15 (55.6%) | 12 (44.4%) |
| Total | 431 (46.4%) | 498 (53.6%) |
Education in Sterlington
School Enrollment in Sterlington
The most common levels of schooling among the 726 students in Sterlington are high school (196 | 27.0%), middle school (191 | 26.3%), and elementary school (164 | 22.6%).
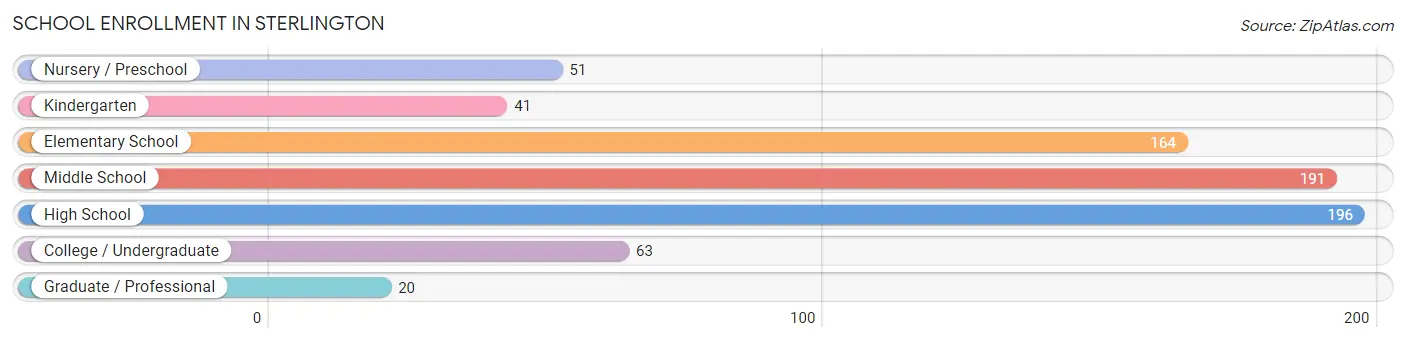
| School Level | # Students | % Students |
| Nursery / Preschool | 51 | 7.0% |
| Kindergarten | 41 | 5.7% |
| Elementary School | 164 | 22.6% |
| Middle School | 191 | 26.3% |
| High School | 196 | 27.0% |
| College / Undergraduate | 63 | 8.7% |
| Graduate / Professional | 20 | 2.8% |
| Total | 726 | 100.0% |
School Enrollment by Age by Funding Source in Sterlington
Out of a total of 726 students who are enrolled in schools in Sterlington, 144 (19.8%) attend a private institution, while the remaining 582 (80.2%) are enrolled in public schools. The age group of 15 to 17 year olds has the highest likelihood of being enrolled in private schools, with 54 (42.2% in the age bracket) enrolled. Conversely, the age group of 18 to 19 year olds has the lowest likelihood of being enrolled in a private school, with 11 (100.0% in the age bracket) attending a public institution.
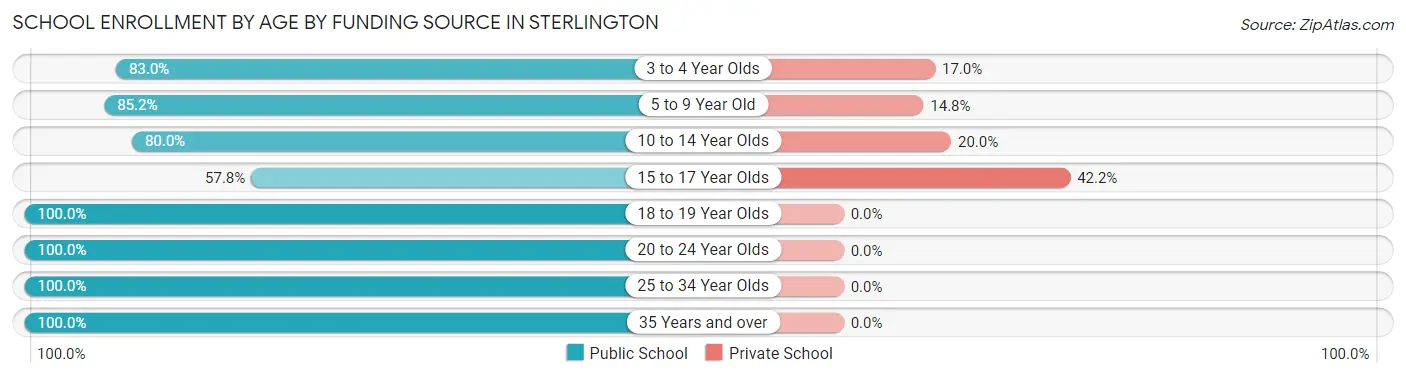
| Age Bracket | Public School | Private School |
| 3 to 4 Year Olds | 39 (83.0%) | 8 (17.0%) |
| 5 to 9 Year Old | 155 (85.2%) | 27 (14.8%) |
| 10 to 14 Year Olds | 220 (80.0%) | 55 (20.0%) |
| 15 to 17 Year Olds | 74 (57.8%) | 54 (42.2%) |
| 18 to 19 Year Olds | 11 (100.0%) | 0 (0.0%) |
| 20 to 24 Year Olds | 3 (100.0%) | 0 (0.0%) |
| 25 to 34 Year Olds | 51 (100.0%) | 0 (0.0%) |
| 35 Years and over | 29 (100.0%) | 0 (0.0%) |
| Total | 582 (80.2%) | 144 (19.8%) |
Educational Attainment by Field of Study in Sterlington
Business (52 | 25.7%), education (48 | 23.8%), liberal arts & history (34 | 16.8%), arts & humanities (18 | 8.9%), and engineering (12 | 5.9%) are the most common fields of study among 202 individuals in Sterlington who have obtained a bachelor's degree or higher.
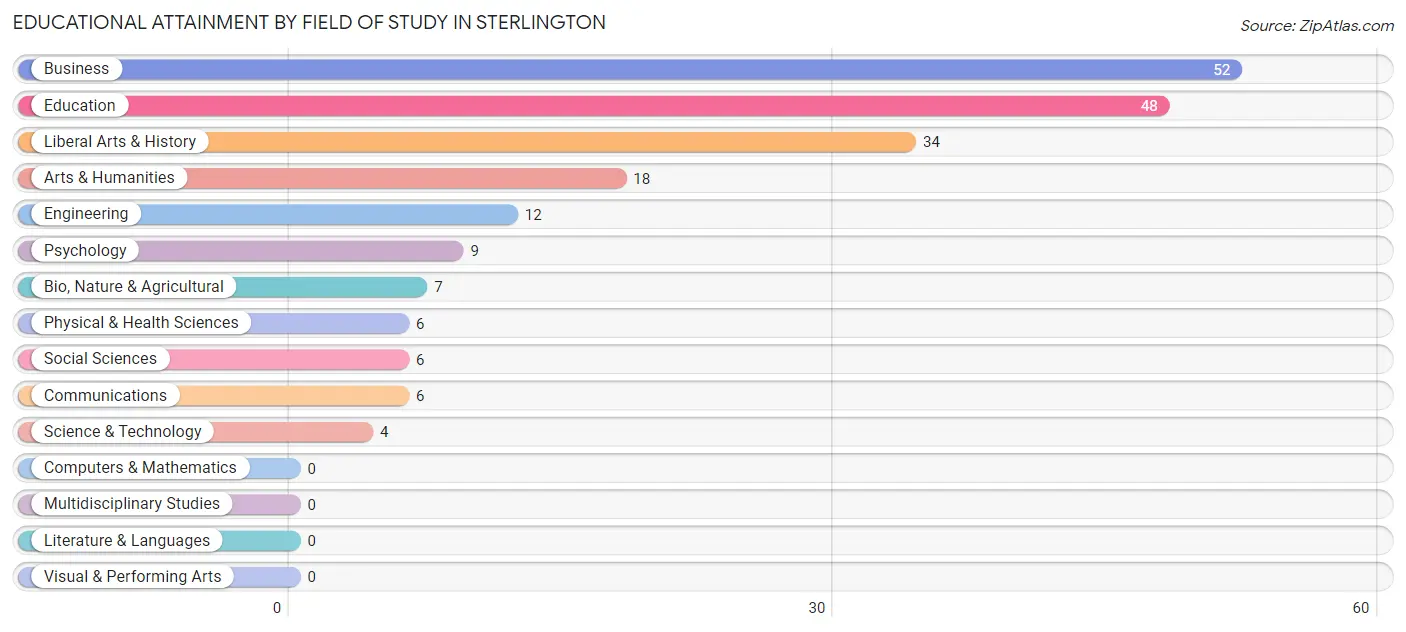
| Field of Study | # Graduates | % Graduates |
| Computers & Mathematics | 0 | 0.0% |
| Bio, Nature & Agricultural | 7 | 3.5% |
| Physical & Health Sciences | 6 | 3.0% |
| Psychology | 9 | 4.5% |
| Social Sciences | 6 | 3.0% |
| Engineering | 12 | 5.9% |
| Multidisciplinary Studies | 0 | 0.0% |
| Science & Technology | 4 | 2.0% |
| Business | 52 | 25.7% |
| Education | 48 | 23.8% |
| Literature & Languages | 0 | 0.0% |
| Liberal Arts & History | 34 | 16.8% |
| Visual & Performing Arts | 0 | 0.0% |
| Communications | 6 | 3.0% |
| Arts & Humanities | 18 | 8.9% |
| Total | 202 | 100.0% |
Transportation & Commute in Sterlington
Vehicle Availability by Sex in Sterlington
The most prevalent vehicle ownership categories in Sterlington are males with 2 vehicles (217, accounting for 50.3%) and females with 2 vehicles (300, making up 43.6%).
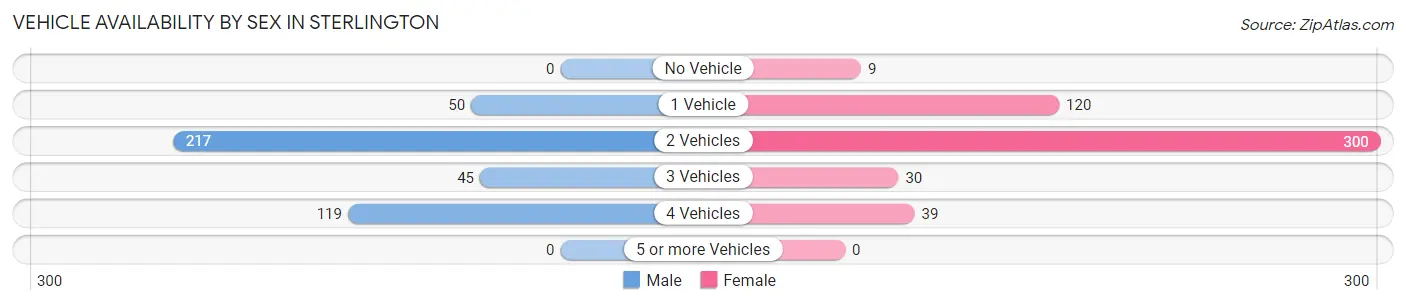
| Vehicles Available | Male | Female |
| No Vehicle | 0 (0.0%) | 9 (1.8%) |
| 1 Vehicle | 50 (11.6%) | 120 (24.1%) |
| 2 Vehicles | 217 (50.3%) | 300 (60.2%) |
| 3 Vehicles | 45 (10.4%) | 30 (6.0%) |
| 4 Vehicles | 119 (27.6%) | 39 (7.8%) |
| 5 or more Vehicles | 0 (0.0%) | 0 (0.0%) |
| Total | 431 (100.0%) | 498 (100.0%) |
Commute Time in Sterlington
The most frequently occuring commute durations in Sterlington are 30 to 34 minutes (208 commuters, 22.5%), 5 to 9 minutes (179 commuters, 19.4%), and 20 to 24 minutes (172 commuters, 18.6%).
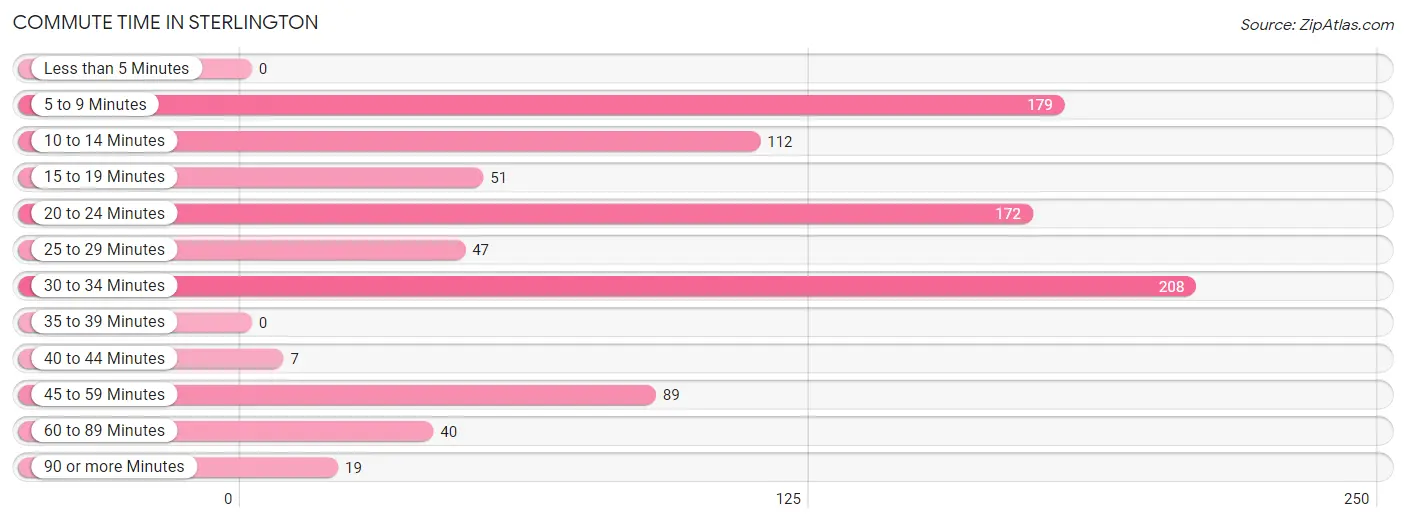
| Commute Time | # Commuters | % Commuters |
| Less than 5 Minutes | 0 | 0.0% |
| 5 to 9 Minutes | 179 | 19.4% |
| 10 to 14 Minutes | 112 | 12.1% |
| 15 to 19 Minutes | 51 | 5.5% |
| 20 to 24 Minutes | 172 | 18.6% |
| 25 to 29 Minutes | 47 | 5.1% |
| 30 to 34 Minutes | 208 | 22.5% |
| 35 to 39 Minutes | 0 | 0.0% |
| 40 to 44 Minutes | 7 | 0.8% |
| 45 to 59 Minutes | 89 | 9.6% |
| 60 to 89 Minutes | 40 | 4.3% |
| 90 or more Minutes | 19 | 2.1% |
Commute Time by Sex in Sterlington
The most common commute times in Sterlington are 5 to 9 minutes (117 commuters, 27.5%) for males and 30 to 34 minutes (138 commuters, 27.7%) for females.
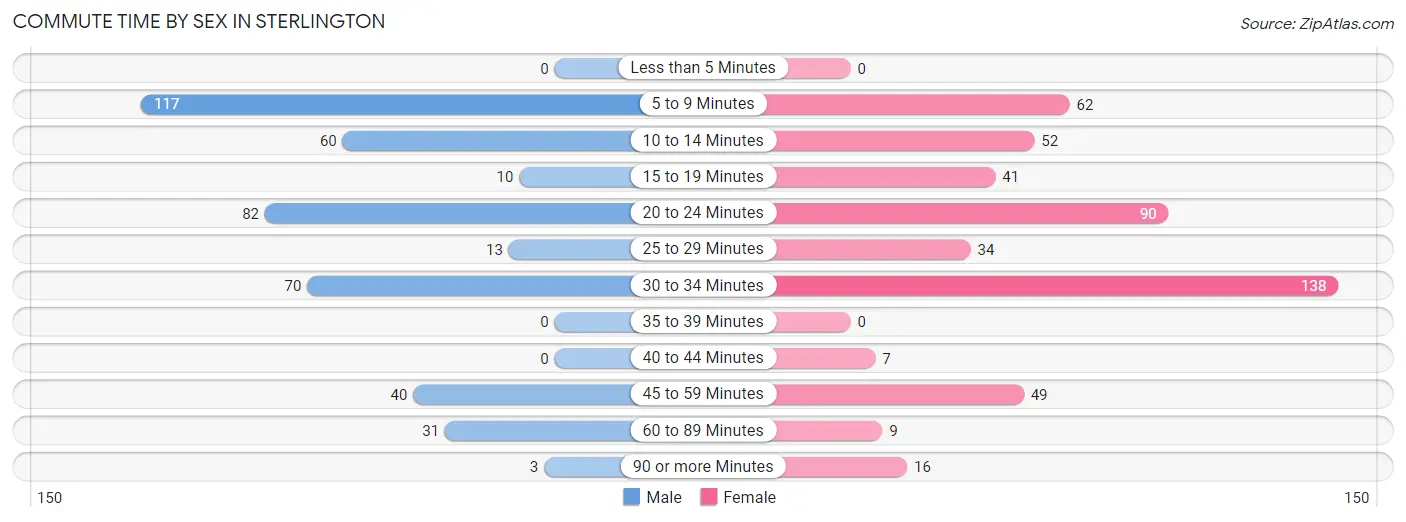
| Commute Time | Male | Female |
| Less than 5 Minutes | 0 (0.0%) | 0 (0.0%) |
| 5 to 9 Minutes | 117 (27.5%) | 62 (12.4%) |
| 10 to 14 Minutes | 60 (14.1%) | 52 (10.4%) |
| 15 to 19 Minutes | 10 (2.4%) | 41 (8.2%) |
| 20 to 24 Minutes | 82 (19.3%) | 90 (18.1%) |
| 25 to 29 Minutes | 13 (3.0%) | 34 (6.8%) |
| 30 to 34 Minutes | 70 (16.4%) | 138 (27.7%) |
| 35 to 39 Minutes | 0 (0.0%) | 0 (0.0%) |
| 40 to 44 Minutes | 0 (0.0%) | 7 (1.4%) |
| 45 to 59 Minutes | 40 (9.4%) | 49 (9.8%) |
| 60 to 89 Minutes | 31 (7.3%) | 9 (1.8%) |
| 90 or more Minutes | 3 (0.7%) | 16 (3.2%) |
Time of Departure to Work by Sex in Sterlington
The most frequent times of departure to work in Sterlington are 6:30 AM to 6:59 AM (104, 24.4%) for males and 7:00 AM to 7:29 AM (174, 34.9%) for females.
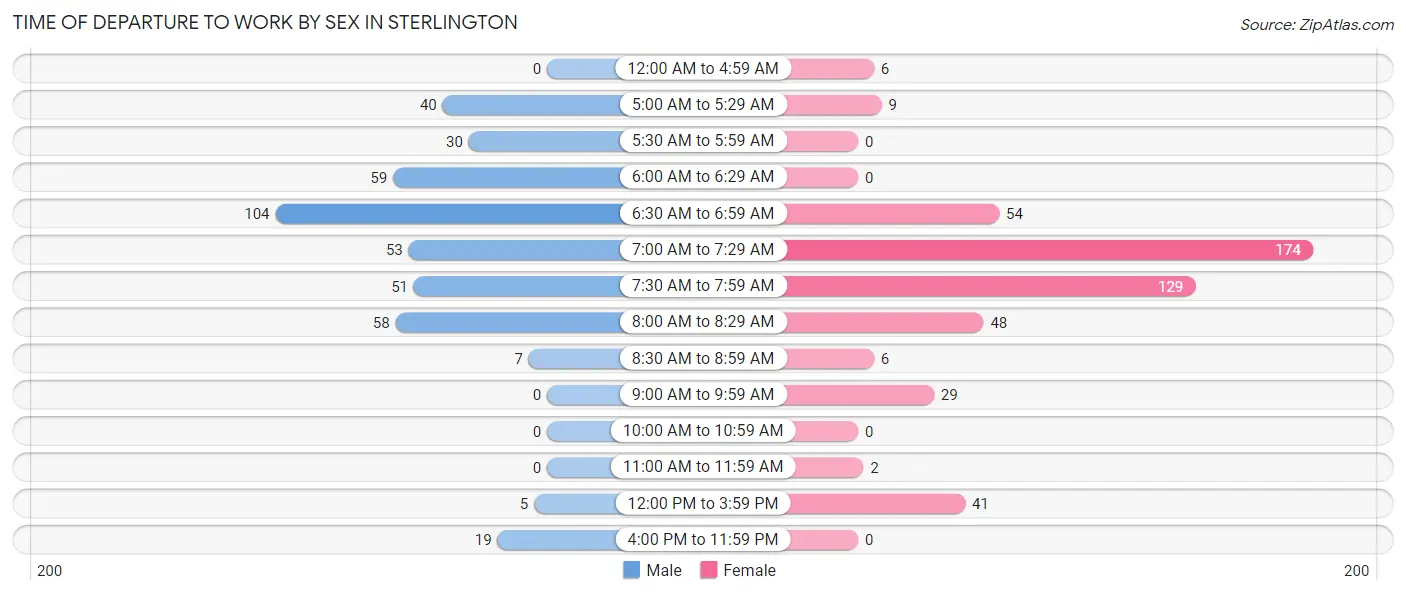
| Time of Departure | Male | Female |
| 12:00 AM to 4:59 AM | 0 (0.0%) | 6 (1.2%) |
| 5:00 AM to 5:29 AM | 40 (9.4%) | 9 (1.8%) |
| 5:30 AM to 5:59 AM | 30 (7.0%) | 0 (0.0%) |
| 6:00 AM to 6:29 AM | 59 (13.9%) | 0 (0.0%) |
| 6:30 AM to 6:59 AM | 104 (24.4%) | 54 (10.8%) |
| 7:00 AM to 7:29 AM | 53 (12.4%) | 174 (34.9%) |
| 7:30 AM to 7:59 AM | 51 (12.0%) | 129 (25.9%) |
| 8:00 AM to 8:29 AM | 58 (13.6%) | 48 (9.6%) |
| 8:30 AM to 8:59 AM | 7 (1.6%) | 6 (1.2%) |
| 9:00 AM to 9:59 AM | 0 (0.0%) | 29 (5.8%) |
| 10:00 AM to 10:59 AM | 0 (0.0%) | 0 (0.0%) |
| 11:00 AM to 11:59 AM | 0 (0.0%) | 2 (0.4%) |
| 12:00 PM to 3:59 PM | 5 (1.2%) | 41 (8.2%) |
| 4:00 PM to 11:59 PM | 19 (4.5%) | 0 (0.0%) |
| Total | 426 (100.0%) | 498 (100.0%) |
Housing Occupancy in Sterlington
Occupancy by Ownership in Sterlington
Of the total 797 dwellings in Sterlington, owner-occupied units account for 406 (50.9%), while renter-occupied units make up 391 (49.1%).
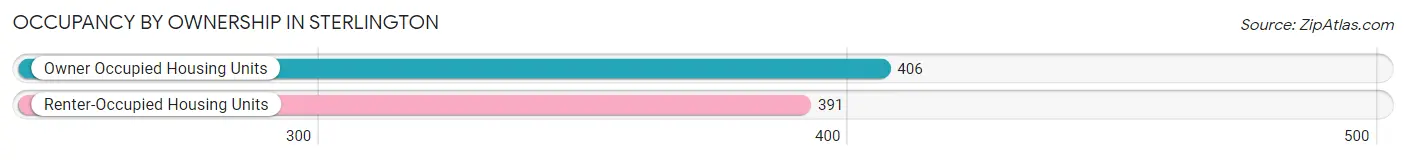
| Occupancy | # Housing Units | % Housing Units |
| Owner Occupied Housing Units | 406 | 50.9% |
| Renter-Occupied Housing Units | 391 | 49.1% |
| Total Occupied Housing Units | 797 | 100.0% |
Occupancy by Household Size in Sterlington
| Household Size | # Housing Units | % Housing Units |
| 1-Person Household | 183 | 23.0% |
| 2-Person Household | 354 | 44.4% |
| 3-Person Household | 112 | 14.1% |
| 4+ Person Household | 148 | 18.6% |
| Total Housing Units | 797 | 100.0% |
Occupancy by Ownership by Household Size in Sterlington
| Household Size | Owner-occupied | Renter-occupied |
| 1-Person Household | 80 (43.7%) | 103 (56.3%) |
| 2-Person Household | 181 (51.1%) | 173 (48.9%) |
| 3-Person Household | 24 (21.4%) | 88 (78.6%) |
| 4+ Person Household | 121 (81.8%) | 27 (18.2%) |
| Total Housing Units | 406 (50.9%) | 391 (49.1%) |
Occupancy by Educational Attainment in Sterlington
| Household Size | Owner-occupied | Renter-occupied |
| Less than High School | 10 (21.3%) | 37 (78.7%) |
| High School Diploma | 134 (45.4%) | 161 (54.6%) |
| College/Associate Degree | 203 (61.3%) | 128 (38.7%) |
| Bachelor's Degree or higher | 59 (47.6%) | 65 (52.4%) |
Occupancy by Age of Householder in Sterlington
| Age Bracket | # Households | % Households |
| Under 35 Years | 182 | 22.8% |
| 35 to 44 Years | 176 | 22.1% |
| 45 to 54 Years | 131 | 16.4% |
| 55 to 64 Years | 86 | 10.8% |
| 65 to 74 Years | 168 | 21.1% |
| 75 to 84 Years | 52 | 6.5% |
| 85 Years and Over | 2 | 0.3% |
| Total | 797 | 100.0% |
Housing Finances in Sterlington
Median Income by Occupancy in Sterlington
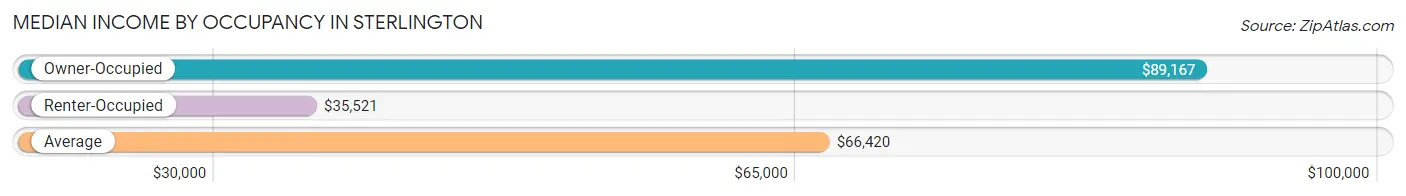
| Occupancy Type | # Households | Median Income |
| Owner-Occupied | 406 (50.9%) | $89,167 |
| Renter-Occupied | 391 (49.1%) | $35,521 |
| Average | 797 (100.0%) | $66,420 |
Occupancy by Householder Income Bracket in Sterlington
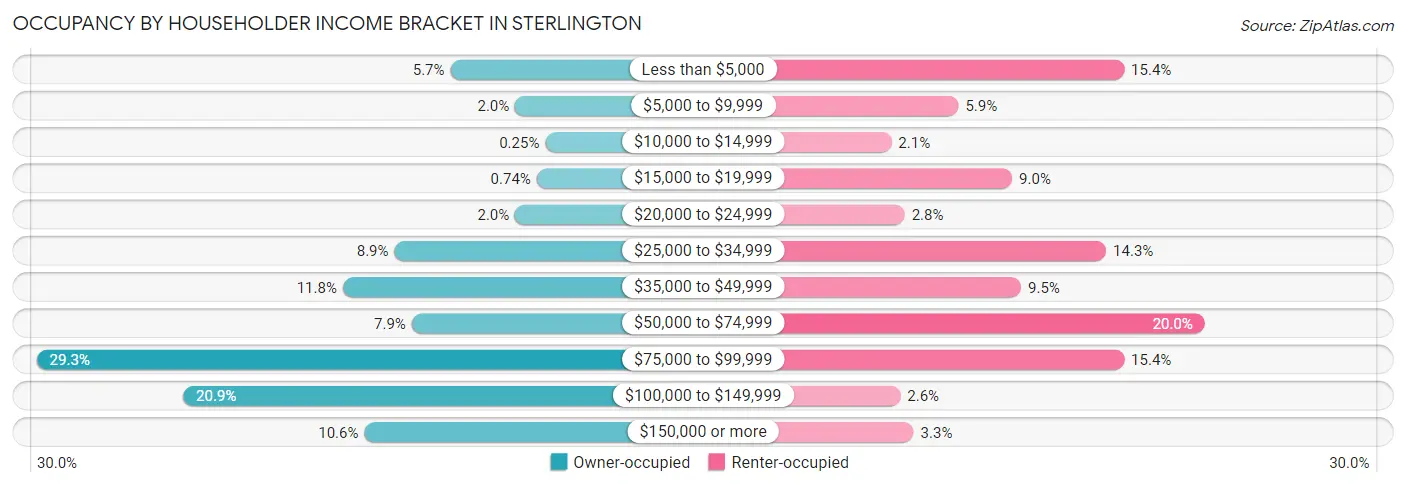
| Income Bracket | Owner-occupied | Renter-occupied |
| Less than $5,000 | 23 (5.7%) | 60 (15.3%) |
| $5,000 to $9,999 | 8 (2.0%) | 23 (5.9%) |
| $10,000 to $14,999 | 1 (0.3%) | 8 (2.1%) |
| $15,000 to $19,999 | 3 (0.7%) | 35 (8.9%) |
| $20,000 to $24,999 | 8 (2.0%) | 11 (2.8%) |
| $25,000 to $34,999 | 36 (8.9%) | 56 (14.3%) |
| $35,000 to $49,999 | 48 (11.8%) | 37 (9.5%) |
| $50,000 to $74,999 | 32 (7.9%) | 78 (20.0%) |
| $75,000 to $99,999 | 119 (29.3%) | 60 (15.3%) |
| $100,000 to $149,999 | 85 (20.9%) | 10 (2.6%) |
| $150,000 or more | 43 (10.6%) | 13 (3.3%) |
| Total | 406 (100.0%) | 391 (100.0%) |
Monthly Housing Cost Tiers in Sterlington
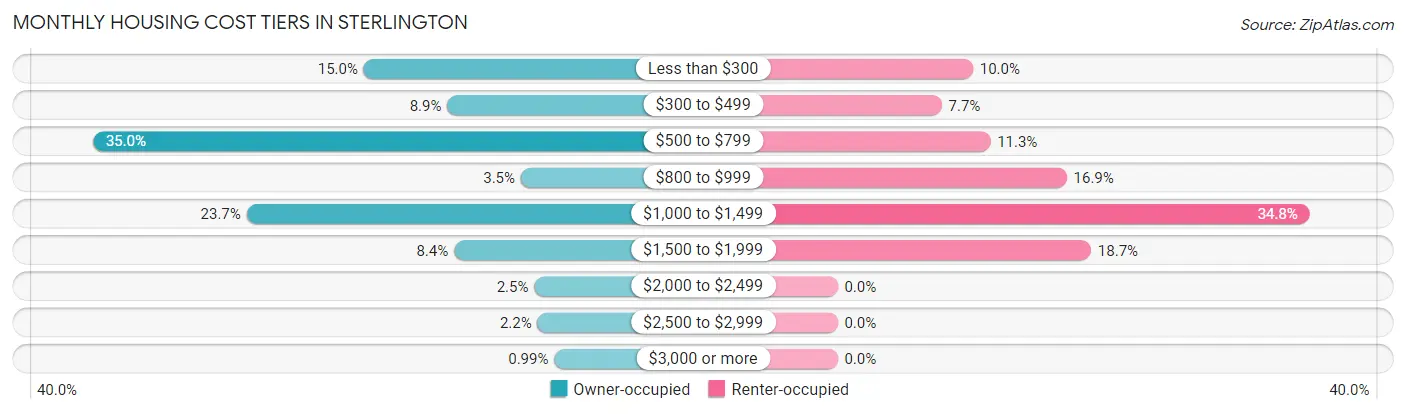
| Monthly Cost | Owner-occupied | Renter-occupied |
| Less than $300 | 61 (15.0%) | 39 (10.0%) |
| $300 to $499 | 36 (8.9%) | 30 (7.7%) |
| $500 to $799 | 142 (35.0%) | 44 (11.3%) |
| $800 to $999 | 14 (3.5%) | 66 (16.9%) |
| $1,000 to $1,499 | 96 (23.6%) | 136 (34.8%) |
| $1,500 to $1,999 | 34 (8.4%) | 73 (18.7%) |
| $2,000 to $2,499 | 10 (2.5%) | 0 (0.0%) |
| $2,500 to $2,999 | 9 (2.2%) | 0 (0.0%) |
| $3,000 or more | 4 (1.0%) | 0 (0.0%) |
| Total | 406 (100.0%) | 391 (100.0%) |
Physical Housing Characteristics in Sterlington
Housing Structures in Sterlington
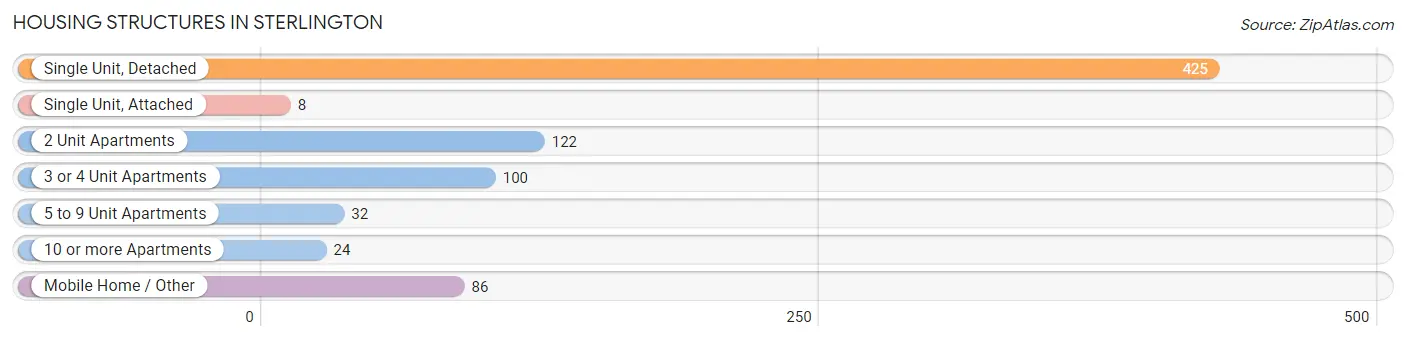
| Structure Type | # Housing Units | % Housing Units |
| Single Unit, Detached | 425 | 53.3% |
| Single Unit, Attached | 8 | 1.0% |
| 2 Unit Apartments | 122 | 15.3% |
| 3 or 4 Unit Apartments | 100 | 12.6% |
| 5 to 9 Unit Apartments | 32 | 4.0% |
| 10 or more Apartments | 24 | 3.0% |
| Mobile Home / Other | 86 | 10.8% |
| Total | 797 | 100.0% |
Housing Structures by Occupancy in Sterlington
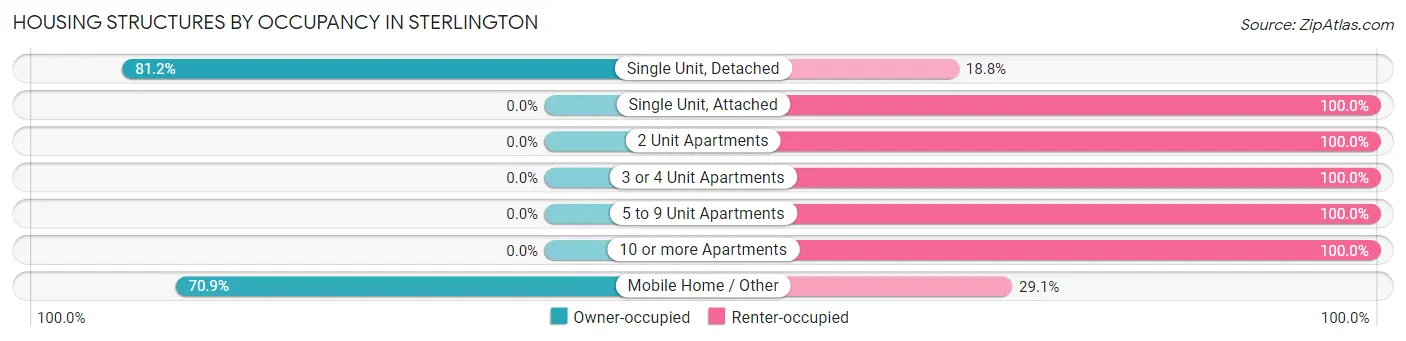
| Structure Type | Owner-occupied | Renter-occupied |
| Single Unit, Detached | 345 (81.2%) | 80 (18.8%) |
| Single Unit, Attached | 0 (0.0%) | 8 (100.0%) |
| 2 Unit Apartments | 0 (0.0%) | 122 (100.0%) |
| 3 or 4 Unit Apartments | 0 (0.0%) | 100 (100.0%) |
| 5 to 9 Unit Apartments | 0 (0.0%) | 32 (100.0%) |
| 10 or more Apartments | 0 (0.0%) | 24 (100.0%) |
| Mobile Home / Other | 61 (70.9%) | 25 (29.1%) |
| Total | 406 (50.9%) | 391 (49.1%) |
Housing Structures by Number of Rooms in Sterlington
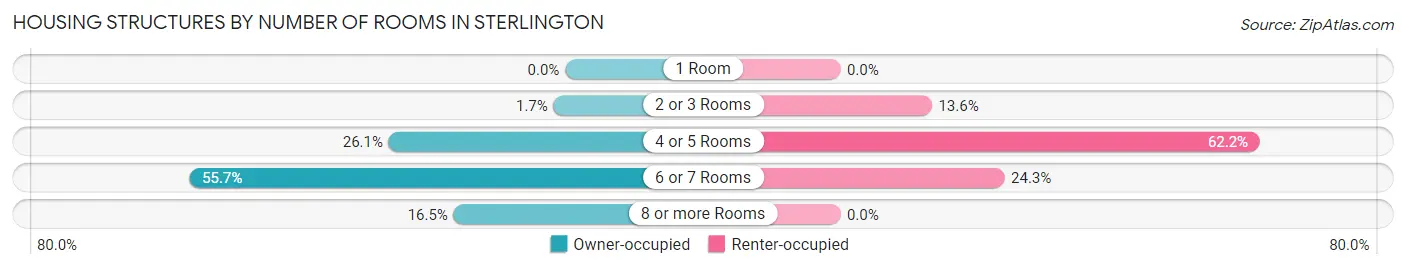
| Number of Rooms | Owner-occupied | Renter-occupied |
| 1 Room | 0 (0.0%) | 0 (0.0%) |
| 2 or 3 Rooms | 7 (1.7%) | 53 (13.6%) |
| 4 or 5 Rooms | 106 (26.1%) | 243 (62.2%) |
| 6 or 7 Rooms | 226 (55.7%) | 95 (24.3%) |
| 8 or more Rooms | 67 (16.5%) | 0 (0.0%) |
| Total | 406 (100.0%) | 391 (100.0%) |
Housing Structure by Heating Type in Sterlington
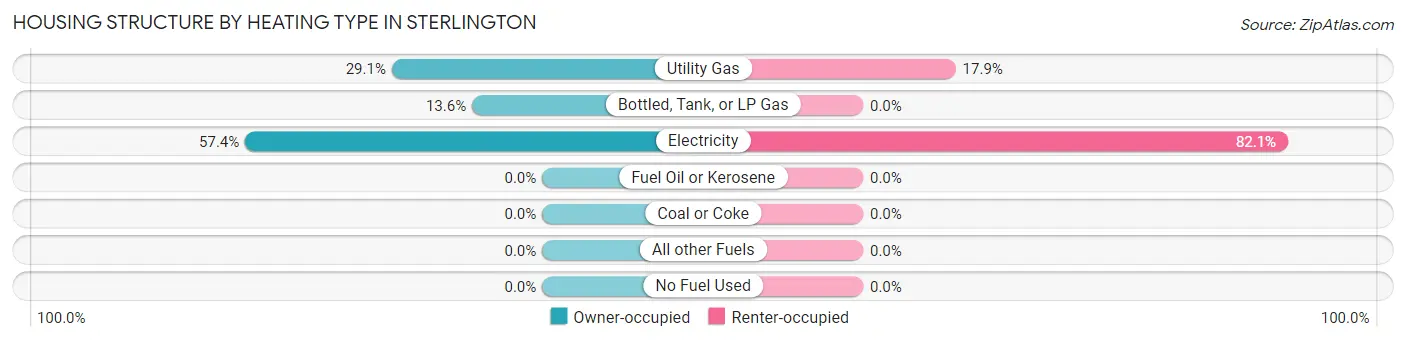
| Heating Type | Owner-occupied | Renter-occupied |
| Utility Gas | 118 (29.1%) | 70 (17.9%) |
| Bottled, Tank, or LP Gas | 55 (13.6%) | 0 (0.0%) |
| Electricity | 233 (57.4%) | 321 (82.1%) |
| Fuel Oil or Kerosene | 0 (0.0%) | 0 (0.0%) |
| Coal or Coke | 0 (0.0%) | 0 (0.0%) |
| All other Fuels | 0 (0.0%) | 0 (0.0%) |
| No Fuel Used | 0 (0.0%) | 0 (0.0%) |
| Total | 406 (100.0%) | 391 (100.0%) |
Household Vehicle Usage in Sterlington
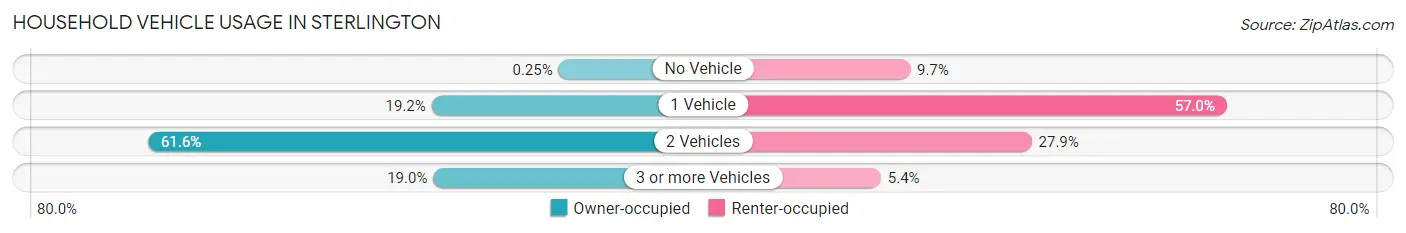
| Vehicles per Household | Owner-occupied | Renter-occupied |
| No Vehicle | 1 (0.3%) | 38 (9.7%) |
| 1 Vehicle | 78 (19.2%) | 223 (57.0%) |
| 2 Vehicles | 250 (61.6%) | 109 (27.9%) |
| 3 or more Vehicles | 77 (19.0%) | 21 (5.4%) |
| Total | 406 (100.0%) | 391 (100.0%) |
Real Estate & Mortgages in Sterlington
Real Estate and Mortgage Overview in Sterlington
| Characteristic | Without Mortgage | With Mortgage |
| Housing Units | 211 | 195 |
| Median Property Value | - | - |
| Median Household Income | - | - |
| Monthly Housing Costs | $603 | $4 |
| Real Estate Taxes | - | - |
Property Value by Mortgage Status in Sterlington
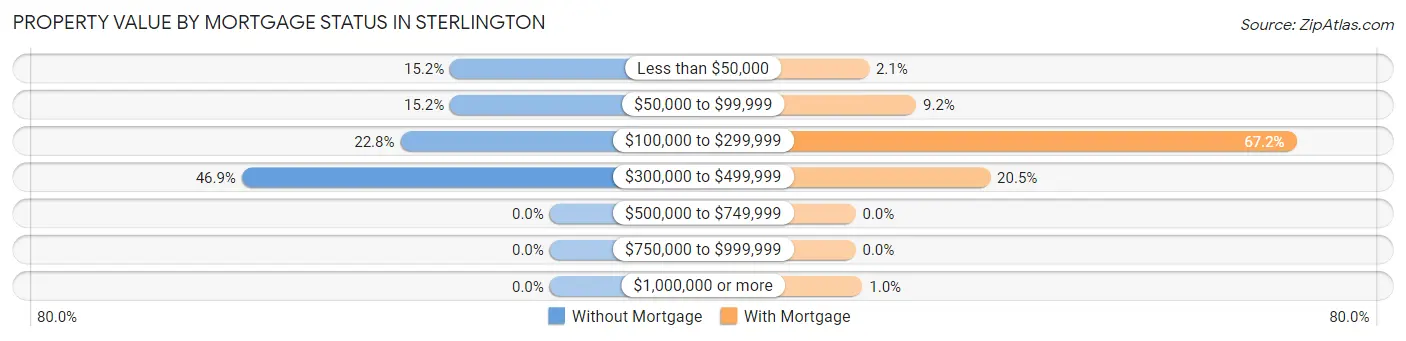
| Property Value | Without Mortgage | With Mortgage |
| Less than $50,000 | 32 (15.2%) | 4 (2.1%) |
| $50,000 to $99,999 | 32 (15.2%) | 18 (9.2%) |
| $100,000 to $299,999 | 48 (22.8%) | 131 (67.2%) |
| $300,000 to $499,999 | 99 (46.9%) | 40 (20.5%) |
| $500,000 to $749,999 | 0 (0.0%) | 0 (0.0%) |
| $750,000 to $999,999 | 0 (0.0%) | 0 (0.0%) |
| $1,000,000 or more | 0 (0.0%) | 2 (1.0%) |
| Total | 211 (100.0%) | 195 (100.0%) |
Household Income by Mortgage Status in Sterlington
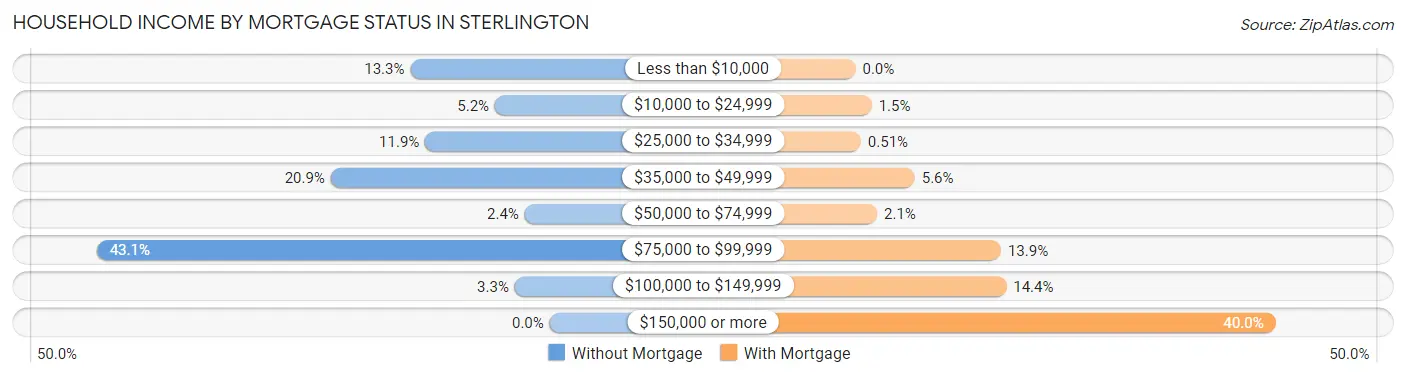
| Household Income | Without Mortgage | With Mortgage |
| Less than $10,000 | 28 (13.3%) | 0 (0.0%) |
| $10,000 to $24,999 | 11 (5.2%) | 3 (1.5%) |
| $25,000 to $34,999 | 25 (11.8%) | 1 (0.5%) |
| $35,000 to $49,999 | 44 (20.8%) | 11 (5.6%) |
| $50,000 to $74,999 | 5 (2.4%) | 4 (2.1%) |
| $75,000 to $99,999 | 91 (43.1%) | 27 (13.9%) |
| $100,000 to $149,999 | 7 (3.3%) | 28 (14.4%) |
| $150,000 or more | 0 (0.0%) | 78 (40.0%) |
| Total | 211 (100.0%) | 195 (100.0%) |
Property Value to Household Income Ratio in Sterlington
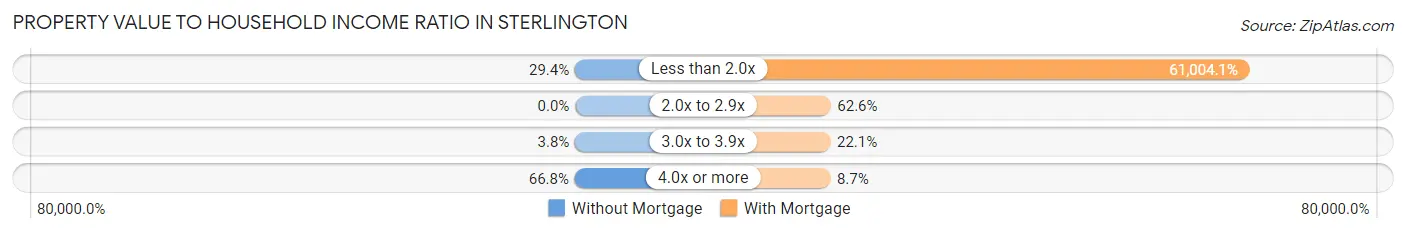
| Value-to-Income Ratio | Without Mortgage | With Mortgage |
| Less than 2.0x | 62 (29.4%) | 118,958 (61,004.1%) |
| 2.0x to 2.9x | 0 (0.0%) | 122 (62.6%) |
| 3.0x to 3.9x | 8 (3.8%) | 43 (22.1%) |
| 4.0x or more | 141 (66.8%) | 17 (8.7%) |
| Total | 211 (100.0%) | 195 (100.0%) |
Real Estate Taxes by Mortgage Status in Sterlington
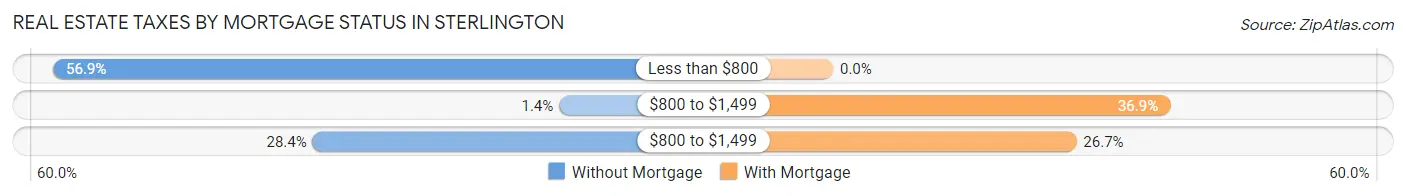
| Property Taxes | Without Mortgage | With Mortgage |
| Less than $800 | 120 (56.9%) | 0 (0.0%) |
| $800 to $1,499 | 3 (1.4%) | 72 (36.9%) |
| $800 to $1,499 | 60 (28.4%) | 52 (26.7%) |
| Total | 211 (100.0%) | 195 (100.0%) |
Health & Disability in Sterlington
Health Insurance Coverage by Age in Sterlington
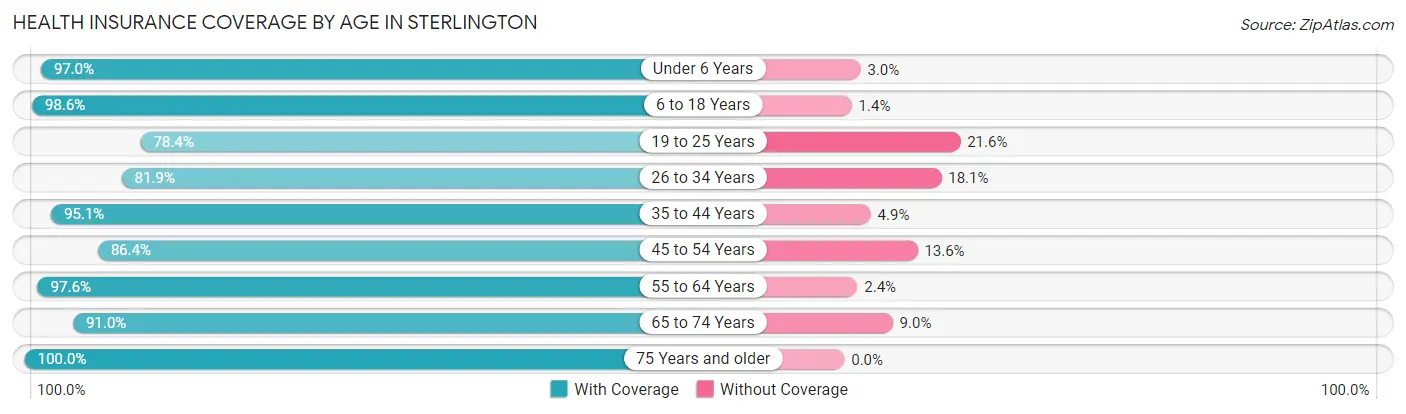
| Age Bracket | With Coverage | Without Coverage |
| Under 6 Years | 128 (97.0%) | 4 (3.0%) |
| 6 to 18 Years | 575 (98.6%) | 8 (1.4%) |
| 19 to 25 Years | 87 (78.4%) | 24 (21.6%) |
| 26 to 34 Years | 154 (81.9%) | 34 (18.1%) |
| 35 to 44 Years | 290 (95.1%) | 15 (4.9%) |
| 45 to 54 Years | 171 (86.4%) | 27 (13.6%) |
| 55 to 64 Years | 120 (97.6%) | 3 (2.4%) |
| 65 to 74 Years | 343 (91.0%) | 34 (9.0%) |
| 75 Years and older | 76 (100.0%) | 0 (0.0%) |
| Total | 1,944 (92.9%) | 149 (7.1%) |
Health Insurance Coverage by Citizenship Status in Sterlington
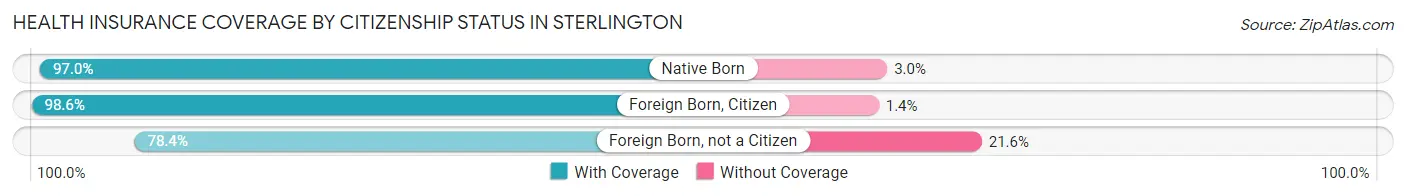
| Citizenship Status | With Coverage | Without Coverage |
| Native Born | 128 (97.0%) | 4 (3.0%) |
| Foreign Born, Citizen | 575 (98.6%) | 8 (1.4%) |
| Foreign Born, not a Citizen | 87 (78.4%) | 24 (21.6%) |
Health Insurance Coverage by Household Income in Sterlington
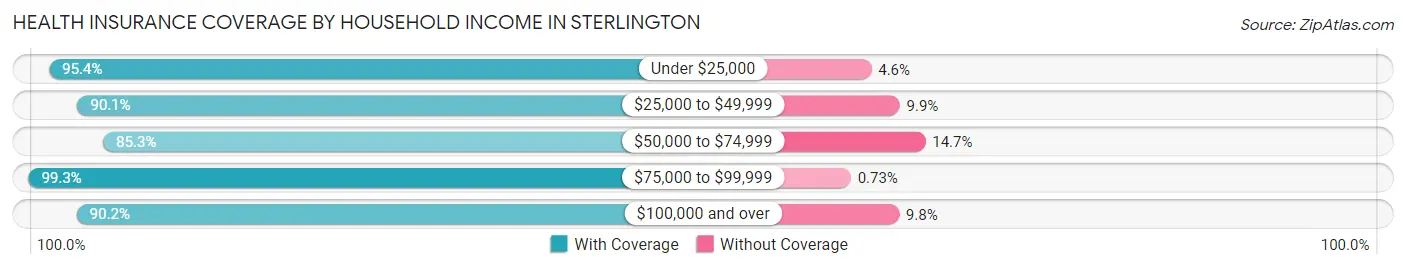
| Household Income | With Coverage | Without Coverage |
| Under $25,000 | 374 (95.4%) | 18 (4.6%) |
| $25,000 to $49,999 | 337 (90.1%) | 37 (9.9%) |
| $50,000 to $74,999 | 238 (85.3%) | 41 (14.7%) |
| $75,000 to $99,999 | 542 (99.3%) | 4 (0.7%) |
| $100,000 and over | 453 (90.2%) | 49 (9.8%) |
Public vs Private Health Insurance Coverage by Age in Sterlington
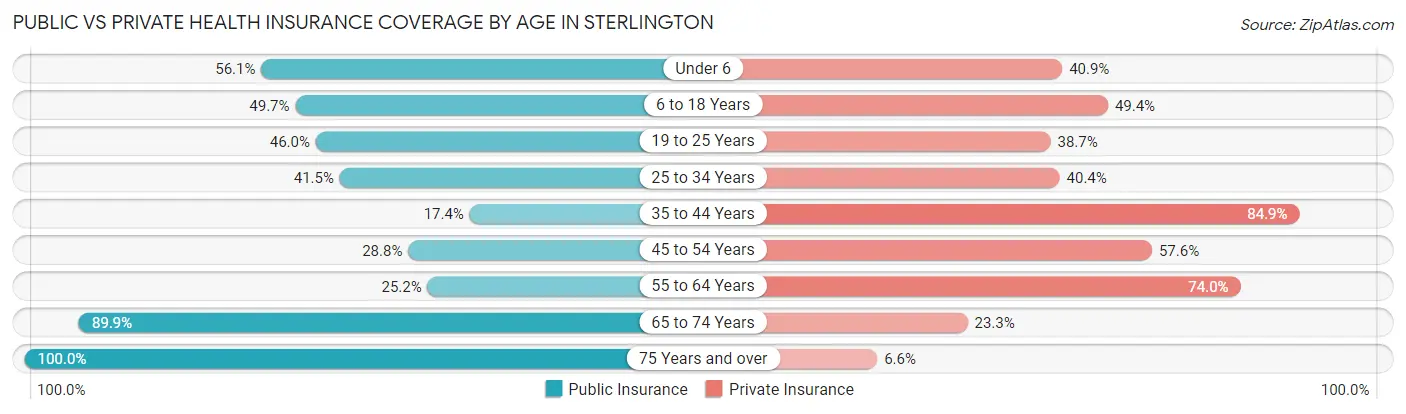
| Age Bracket | Public Insurance | Private Insurance |
| Under 6 | 74 (56.1%) | 54 (40.9%) |
| 6 to 18 Years | 290 (49.7%) | 288 (49.4%) |
| 19 to 25 Years | 51 (46.0%) | 43 (38.7%) |
| 25 to 34 Years | 78 (41.5%) | 76 (40.4%) |
| 35 to 44 Years | 53 (17.4%) | 259 (84.9%) |
| 45 to 54 Years | 57 (28.8%) | 114 (57.6%) |
| 55 to 64 Years | 31 (25.2%) | 91 (74.0%) |
| 65 to 74 Years | 339 (89.9%) | 88 (23.3%) |
| 75 Years and over | 76 (100.0%) | 5 (6.6%) |
| Total | 1,049 (50.1%) | 1,018 (48.6%) |
Disability Status by Sex by Age in Sterlington
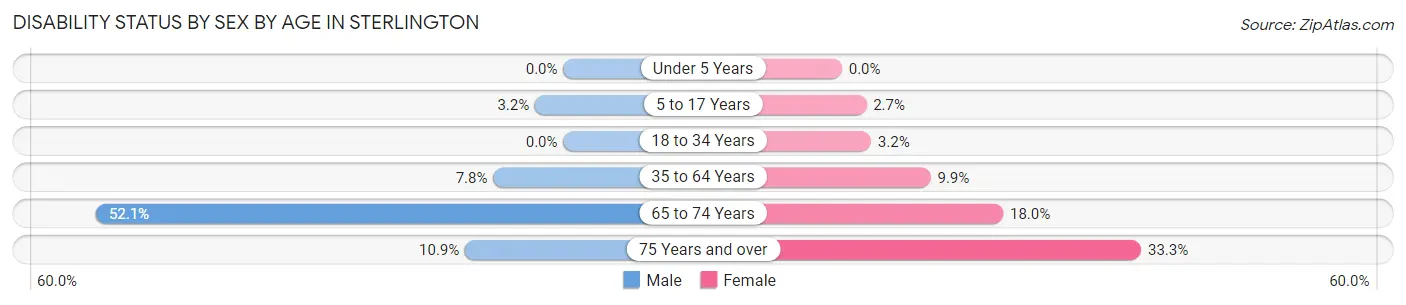
| Age Bracket | Male | Female |
| Under 5 Years | 0 (0.0%) | 0 (0.0%) |
| 5 to 17 Years | 8 (3.2%) | 9 (2.7%) |
| 18 to 34 Years | 0 (0.0%) | 6 (3.2%) |
| 35 to 64 Years | 22 (7.8%) | 34 (9.9%) |
| 65 to 74 Years | 89 (52.0%) | 37 (18.0%) |
| 75 Years and over | 7 (10.9%) | 4 (33.3%) |
Disability Class by Sex by Age in Sterlington
Disability Class: Hearing Difficulty
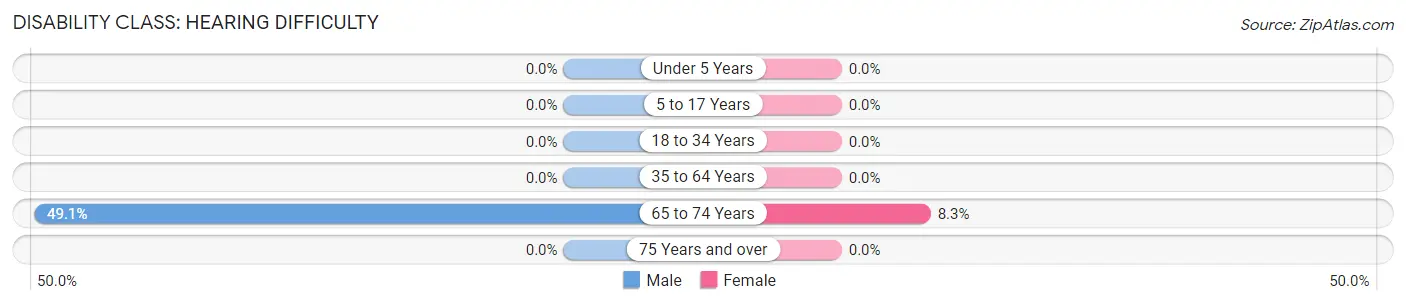
| Age Bracket | Male | Female |
| Under 5 Years | 0 (0.0%) | 0 (0.0%) |
| 5 to 17 Years | 0 (0.0%) | 0 (0.0%) |
| 18 to 34 Years | 0 (0.0%) | 0 (0.0%) |
| 35 to 64 Years | 0 (0.0%) | 0 (0.0%) |
| 65 to 74 Years | 84 (49.1%) | 17 (8.3%) |
| 75 Years and over | 0 (0.0%) | 0 (0.0%) |
Disability Class: Vision Difficulty
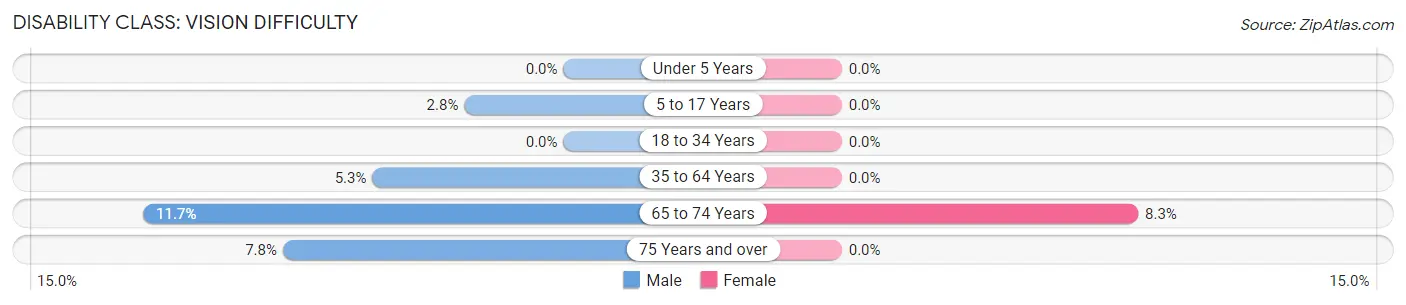
| Age Bracket | Male | Female |
| Under 5 Years | 0 (0.0%) | 0 (0.0%) |
| 5 to 17 Years | 7 (2.8%) | 0 (0.0%) |
| 18 to 34 Years | 0 (0.0%) | 0 (0.0%) |
| 35 to 64 Years | 15 (5.3%) | 0 (0.0%) |
| 65 to 74 Years | 20 (11.7%) | 17 (8.3%) |
| 75 Years and over | 5 (7.8%) | 0 (0.0%) |
Disability Class: Cognitive Difficulty
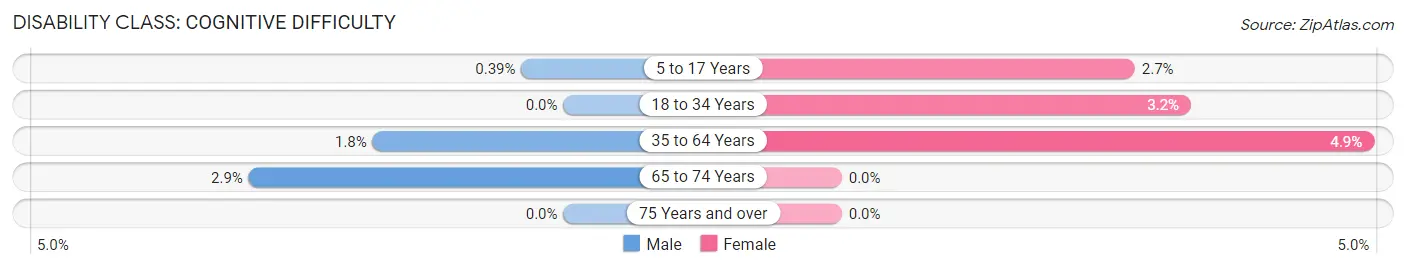
| Age Bracket | Male | Female |
| 5 to 17 Years | 1 (0.4%) | 9 (2.7%) |
| 18 to 34 Years | 0 (0.0%) | 6 (3.2%) |
| 35 to 64 Years | 5 (1.8%) | 17 (4.9%) |
| 65 to 74 Years | 5 (2.9%) | 0 (0.0%) |
| 75 Years and over | 0 (0.0%) | 0 (0.0%) |
Disability Class: Ambulatory Difficulty
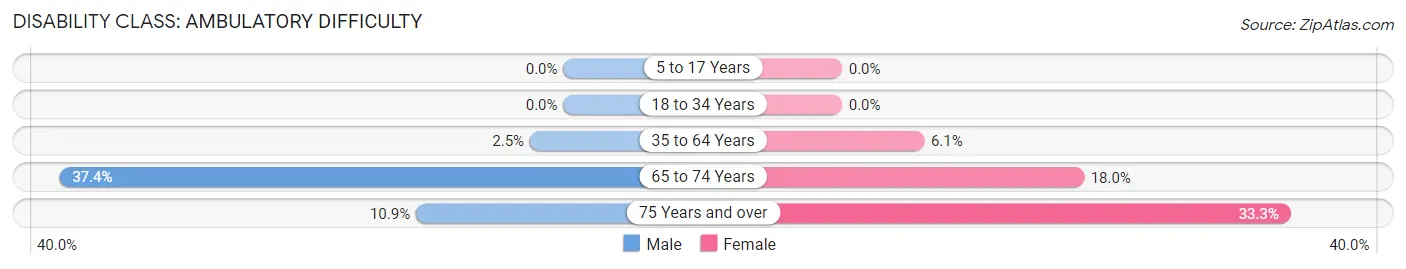
| Age Bracket | Male | Female |
| 5 to 17 Years | 0 (0.0%) | 0 (0.0%) |
| 18 to 34 Years | 0 (0.0%) | 0 (0.0%) |
| 35 to 64 Years | 7 (2.5%) | 21 (6.1%) |
| 65 to 74 Years | 64 (37.4%) | 37 (18.0%) |
| 75 Years and over | 7 (10.9%) | 4 (33.3%) |
Disability Class: Self-Care Difficulty
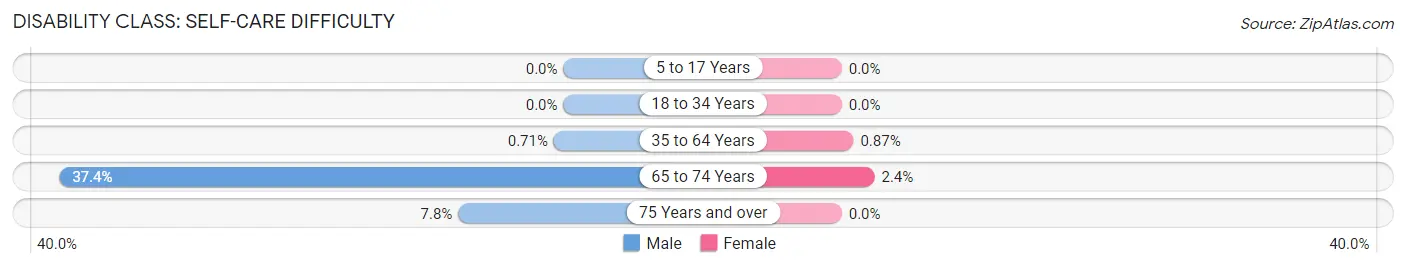
| Age Bracket | Male | Female |
| 5 to 17 Years | 0 (0.0%) | 0 (0.0%) |
| 18 to 34 Years | 0 (0.0%) | 0 (0.0%) |
| 35 to 64 Years | 2 (0.7%) | 3 (0.9%) |
| 65 to 74 Years | 64 (37.4%) | 5 (2.4%) |
| 75 Years and over | 5 (7.8%) | 0 (0.0%) |
Technology Access in Sterlington
Computing Device Access in Sterlington
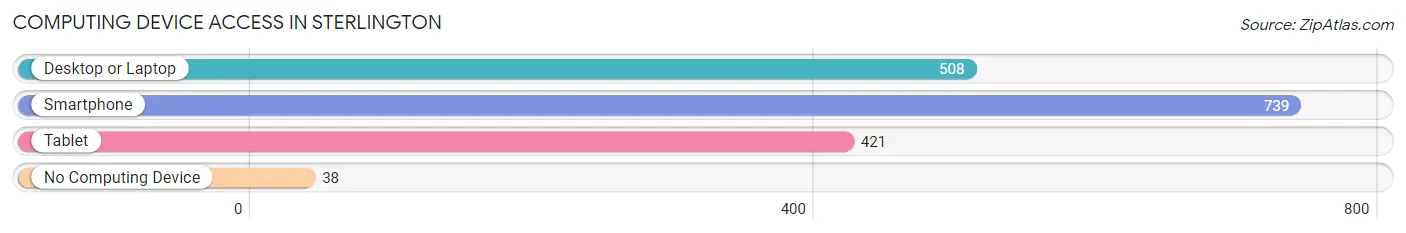
| Device Type | # Households | % Households |
| Desktop or Laptop | 508 | 63.7% |
| Smartphone | 739 | 92.7% |
| Tablet | 421 | 52.8% |
| No Computing Device | 38 | 4.8% |
| Total | 797 | 100.0% |
Internet Access in Sterlington
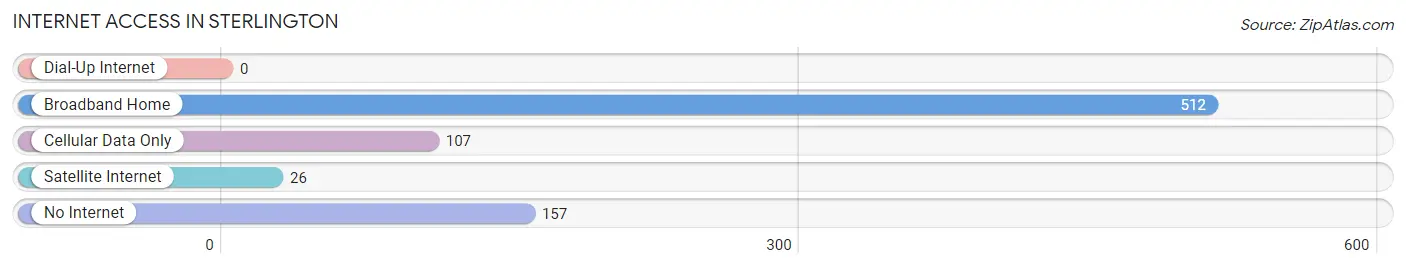
| Internet Type | # Households | % Households |
| Dial-Up Internet | 0 | 0.0% |
| Broadband Home | 512 | 64.2% |
| Cellular Data Only | 107 | 13.4% |
| Satellite Internet | 26 | 3.3% |
| No Internet | 157 | 19.7% |
| Total | 797 | 100.0% |
Sterlington Summary
Sterlington is a small town located in Ouachita Parish, Louisiana. It is situated on the banks of the Ouachita River, approximately 10 miles north of Monroe. The town was founded in 1848 and has a population of approximately 2,000 people.
History
Sterlington was founded in 1848 by a group of settlers from the nearby town of Monroe. The settlers were looking for a place to settle and start a new life. The town was named after the Sterlington family, who were among the first settlers. The Sterlingtons were originally from Virginia and had moved to Louisiana in the early 1800s.
The town grew slowly but steadily over the years, and by the early 1900s it had become a thriving community. The town was home to several businesses, including a sawmill, a cotton gin, and a grist mill. The town also had a school, a post office, and a few churches.
In the early 1900s, the town was also home to a large African American population. The African Americans in Sterlington were mostly farmers and worked in the cotton fields. They also had their own churches and schools.
In the 1950s, the town began to decline as the cotton industry in the area began to decline. Many of the businesses in town closed and the population began to decline as well. In the late 1970s, the town was revitalized when a new industry, the Sterlington Refinery, was built. The refinery brought new jobs and new people to the town, and the population began to grow again.
Geography
Sterlington is located in Ouachita Parish, Louisiana. It is situated on the banks of the Ouachita River, approximately 10 miles north of Monroe. The town is surrounded by rolling hills and is located in a rural area. The climate in Sterlington is humid subtropical, with hot summers and mild winters.
Economy
The economy of Sterlington is largely based on the oil and gas industry. The Sterlington Refinery is the largest employer in the town, and it provides jobs for many of the residents. Other industries in the town include agriculture, manufacturing, and tourism.
The town also has a few small businesses, including restaurants, shops, and a few hotels. The town also has a few churches and a post office.
Demographics
As of the 2010 census, the population of Sterlington was 2,000. The racial makeup of the town was 79.2% White, 17.2% African American, 0.7% Native American, 0.3% Asian, and 2.6% from other races. The median household income was $37,500, and the median age was 37.
Conclusion
Sterlington is a small town located in Ouachita Parish, Louisiana. It was founded in 1848 and has a population of approximately 2,000 people. The town is largely dependent on the oil and gas industry, and it also has a few small businesses. The town has a diverse population, with a mix of White, African American, Native American, and Asian residents.
Common Questions
What is Per Capita Income in Sterlington?
Per Capita income in Sterlington is $26,738.
What is the Median Family Income in Sterlington?
Median Family Income in Sterlington is $72,978.
What is the Median Household income in Sterlington?
Median Household Income in Sterlington is $66,420.
What is Income or Wage Gap in Sterlington?
Income or Wage Gap in Sterlington is 23.7%.
Women in Sterlington earn 76.3 cents for every dollar earned by a man.
What is Inequality or Gini Index in Sterlington?
Inequality or Gini Index in Sterlington is 0.43.
What is the Total Population of Sterlington?
Total Population of Sterlington is 2,093.
What is the Total Male Population of Sterlington?
Total Male Population of Sterlington is 980.
What is the Total Female Population of Sterlington?
Total Female Population of Sterlington is 1,113.
What is the Ratio of Males per 100 Females in Sterlington?
There are 88.05 Males per 100 Females in Sterlington.
What is the Ratio of Females per 100 Males in Sterlington?
There are 113.57 Females per 100 Males in Sterlington.
What is the Median Population Age in Sterlington?
Median Population Age in Sterlington is 37.1 Years.
What is the Average Family Size in Sterlington
Average Family Size in Sterlington is 3.1 People.
What is the Average Household Size in Sterlington
Average Household Size in Sterlington is 2.6 People.
How Large is the Labor Force in Sterlington?
There are 936 People in the Labor Forcein in Sterlington.
What is the Percentage of People in the Labor Force in Sterlington?
62.6% of People are in the Labor Force in Sterlington.
What is the Unemployment Rate in Sterlington?
Unemployment Rate in Sterlington is 0.7%.