Zip Codes with the Highest Percentage of Population Employed in Legal Services & Support in Houma, LA
RELATED REPORTS & OPTIONS
Legal Services & Support
Houma
Compare Zip Codes
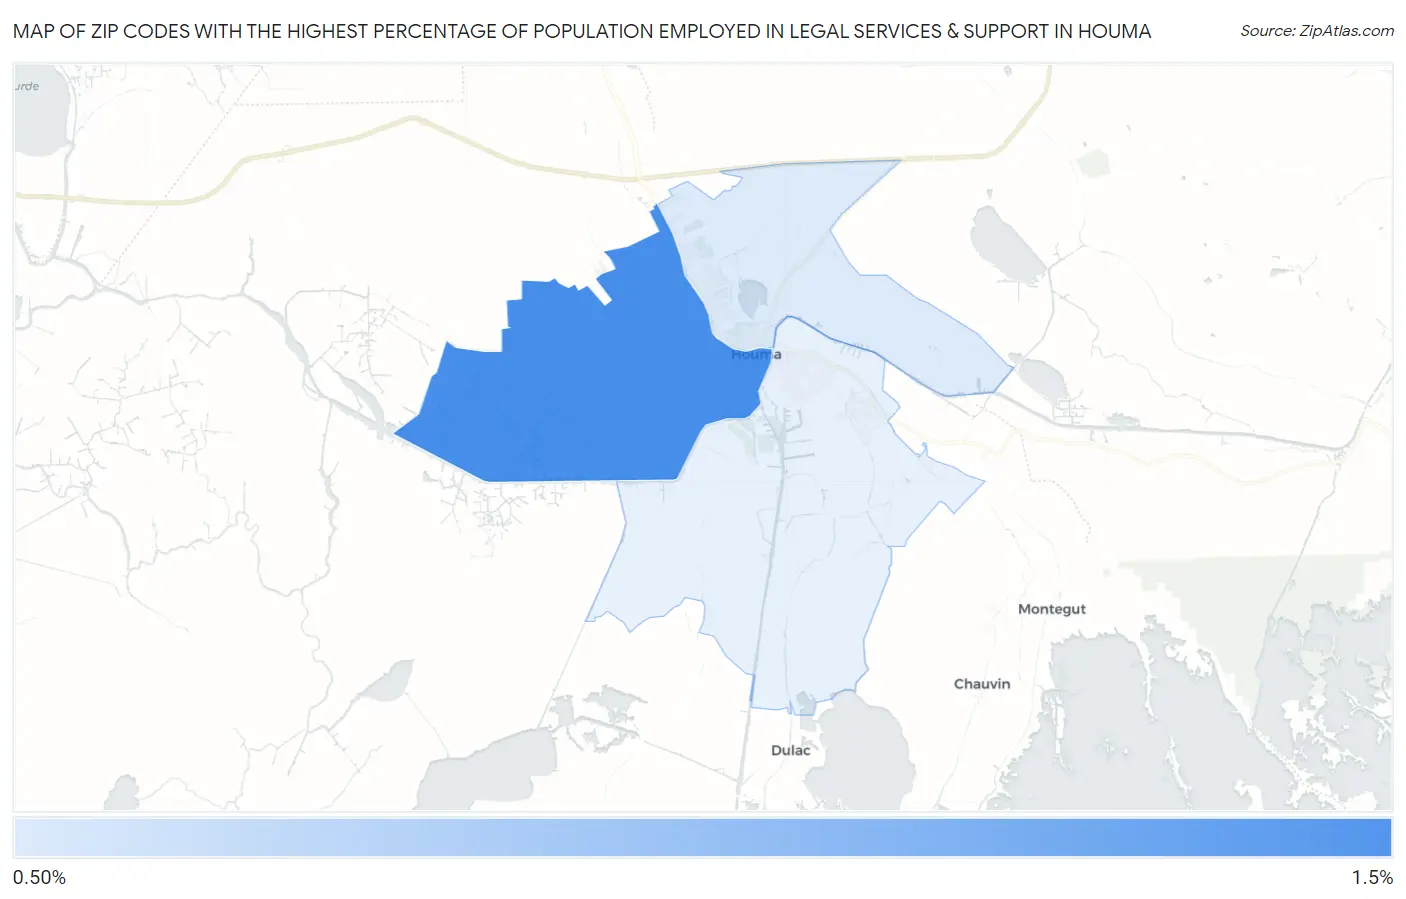
Map of Zip Codes with the Highest Percentage of Population Employed in Legal Services & Support in Houma
0.70%
1.1%
Zip Codes with the Highest Percentage of Population Employed in Legal Services & Support in Houma, LA
| Zip Code | % Employed | vs State | vs National | |
| 1. | 70360 | 1.1% | 1.3%(-0.237)#132 | 1.2%(-0.090)#7,214 |
| 2. | 70364 | 0.70% | 1.3%(-0.627)#172 | 1.2%(-0.480)#10,370 |
1
Common Questions
What are the Top Zip Codes with the Highest Percentage of Population Employed in Legal Services & Support in Houma, LA?
Top Zip Codes with the Highest Percentage of Population Employed in Legal Services & Support in Houma, LA are:
What zip code has the Highest Percentage of Population Employed in Legal Services & Support in Houma, LA?
70360 has the Highest Percentage of Population Employed in Legal Services & Support in Houma, LA with 1.1%.
What is the Percentage of Population Employed in Legal Services & Support in Houma, LA?
Percentage of Population Employed in Legal Services & Support in Houma is 1.4%.
What is the Percentage of Population Employed in Legal Services & Support in Louisiana?
Percentage of Population Employed in Legal Services & Support in Louisiana is 1.3%.
What is the Percentage of Population Employed in Legal Services & Support in the United States?
Percentage of Population Employed in Legal Services & Support in the United States is 1.2%.