Zip Codes with the Highest Percentage of Population Employed in Legal Services & Support in Shreveport, LA
RELATED REPORTS & OPTIONS
Legal Services & Support
Shreveport
Compare Zip Codes
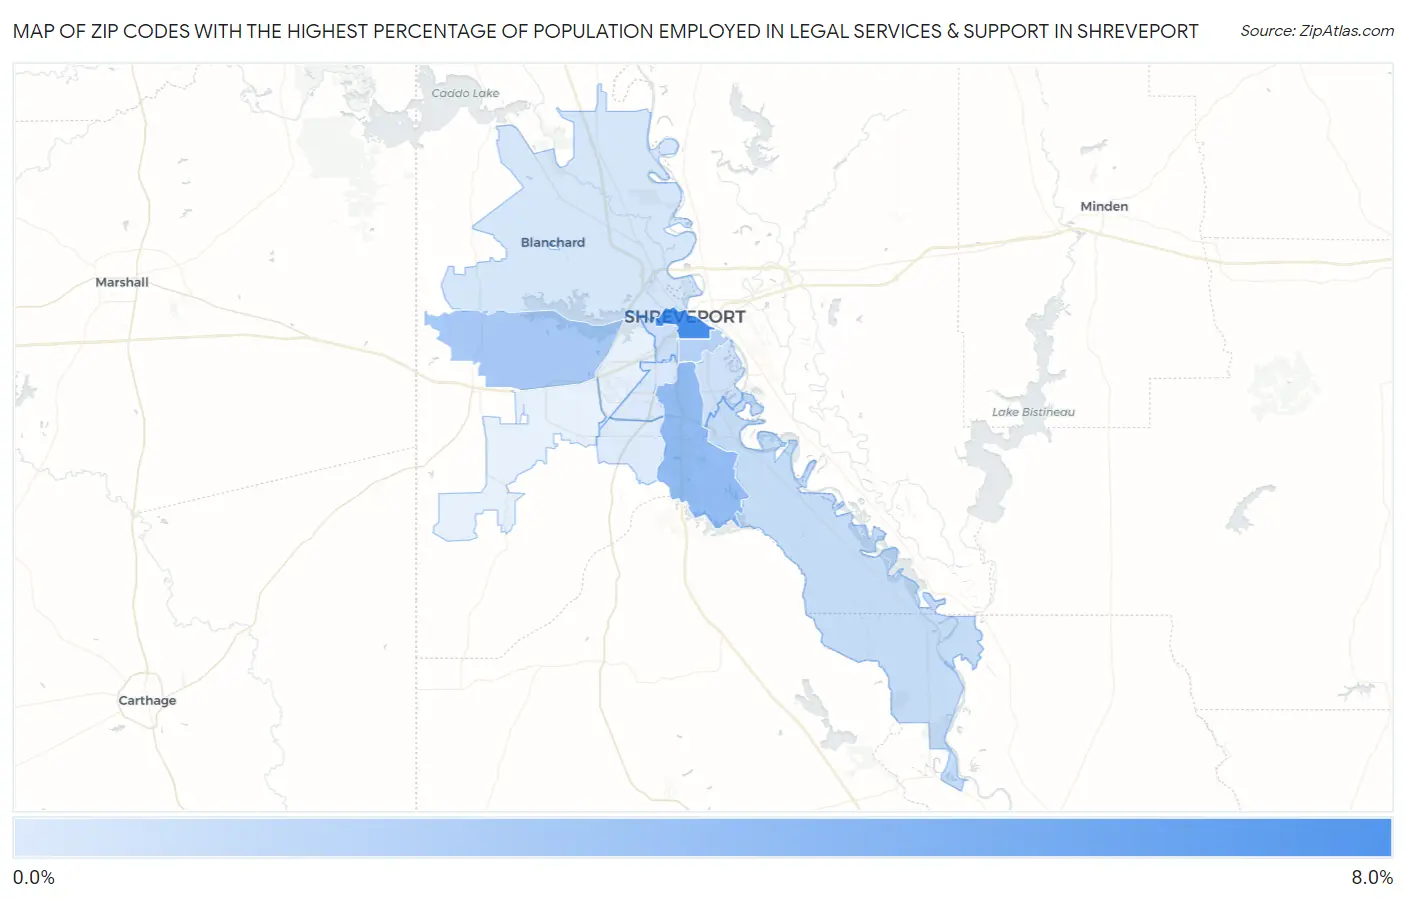
Map of Zip Codes with the Highest Percentage of Population Employed in Legal Services & Support in Shreveport
0.086%
8.0%
Zip Codes with the Highest Percentage of Population Employed in Legal Services & Support in Shreveport, LA
| Zip Code | % Employed | vs State | vs National | |
| 1. | 71101 | 8.0% | 1.3%(+6.66)#2 | 1.2%(+6.81)#268 |
| 2. | 71106 | 4.1% | 1.3%(+2.73)#16 | 1.2%(+2.88)#1,097 |
| 3. | 71119 | 2.9% | 1.3%(+1.60)#36 | 1.2%(+1.74)#1,934 |
| 4. | 71104 | 2.0% | 1.3%(+0.716)#59 | 1.2%(+0.862)#3,343 |
| 5. | 71115 | 1.2% | 1.3%(-0.124)#121 | 1.2%(+0.023)#6,447 |
| 6. | 71103 | 0.99% | 1.3%(-0.345)#140 | 1.2%(-0.198)#7,918 |
| 7. | 71105 | 0.77% | 1.3%(-0.558)#166 | 1.2%(-0.412)#9,725 |
| 8. | 71107 | 0.46% | 1.3%(-0.873)#211 | 1.2%(-0.727)#13,177 |
| 9. | 71108 | 0.25% | 1.3%(-1.08)#240 | 1.2%(-0.930)#15,592 |
| 10. | 71118 | 0.086% | 1.3%(-1.24)#256 | 1.2%(-1.10)#17,220 |
1
Common Questions
What are the Top 10 Zip Codes with the Highest Percentage of Population Employed in Legal Services & Support in Shreveport, LA?
Top 10 Zip Codes with the Highest Percentage of Population Employed in Legal Services & Support in Shreveport, LA are:
What zip code has the Highest Percentage of Population Employed in Legal Services & Support in Shreveport, LA?
71101 has the Highest Percentage of Population Employed in Legal Services & Support in Shreveport, LA with 8.0%.
What is the Percentage of Population Employed in Legal Services & Support in Shreveport, LA?
Percentage of Population Employed in Legal Services & Support in Shreveport is 1.5%.
What is the Percentage of Population Employed in Legal Services & Support in Louisiana?
Percentage of Population Employed in Legal Services & Support in Louisiana is 1.3%.
What is the Percentage of Population Employed in Legal Services & Support in the United States?
Percentage of Population Employed in Legal Services & Support in the United States is 1.2%.