Lost Springs, KS Map & Demographics
Lost Springs Map
Lost Springs Overview
$19,262
PER CAPITA INCOME
$65,000
AVG FAMILY INCOME
$57,917
AVG HOUSEHOLD INCOME
0.25
INEQUALITY / GINI INDEX
78
TOTAL POPULATION
40
MALE POPULATION
38
FEMALE POPULATION
105.26
MALES / 100 FEMALES
95.00
FEMALES / 100 MALES
34.6
MEDIAN AGE
5.2
AVG FAMILY SIZE
4.1
AVG HOUSEHOLD SIZE
37
LABOR FORCE [ PEOPLE ]
61.7%
PERCENT IN LABOR FORCE
Lost Springs Zip Codes
Lost Springs Area Codes
Income in Lost Springs
Income Overview in Lost Springs
Per Capita Income in Lost Springs is $19,262, while median incomes of families and households are $65,000 and $57,917 respectively.
| Characteristic | Number | Measure |
| Per Capita Income | 78 | $19,262 |
| Median Family Income | 14 | $65,000 |
| Mean Family Income | 14 | $59,400 |
| Median Household Income | 19 | $57,917 |
| Mean Household Income | 19 | $54,279 |
| Income Deficit | 14 | $0 |
| Wage / Income Gap (%) | 78 | 0.00% |
| Wage / Income Gap ($) | 78 | 100.00¢ per $1 |
| Gini / Inequality Index | 78 | 0.25 |
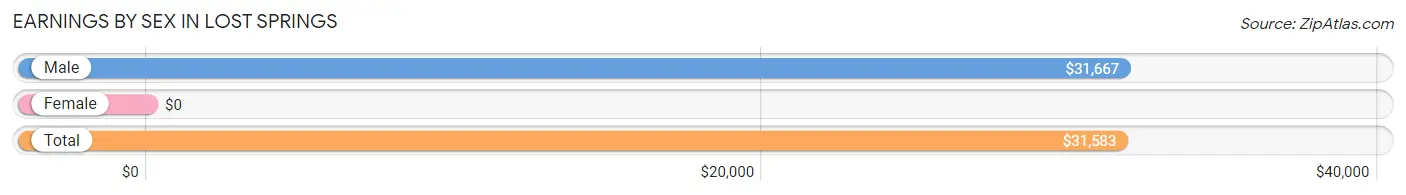
Earnings by Sex in Lost Springs
| Sex | Number | Average Earnings |
| Male | 26 (70.3%) | $31,667 |
| Female | 11 (29.7%) | $0 |
| Total | 37 (100.0%) | $31,583 |
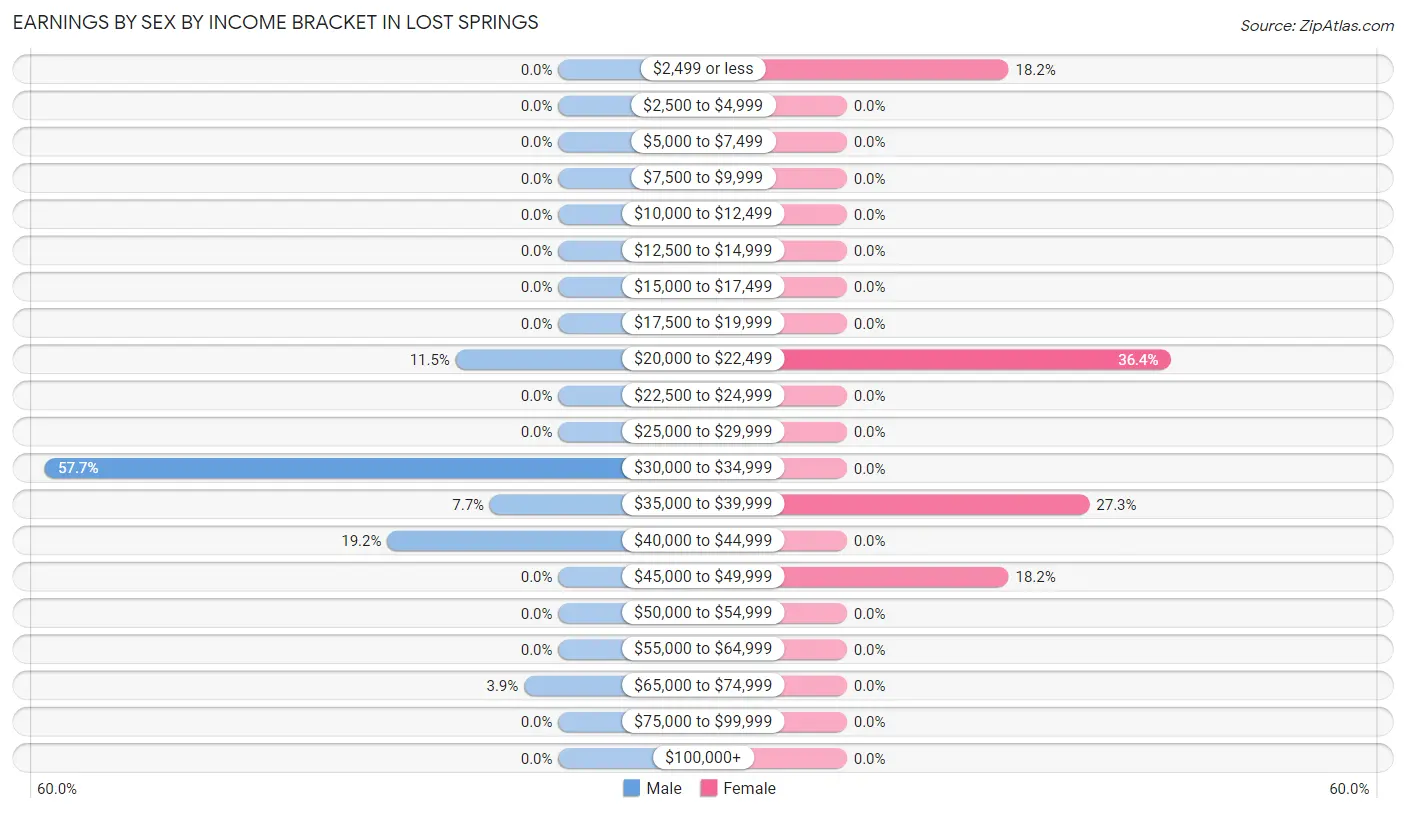
Earnings by Sex by Income Bracket in Lost Springs
The most common earnings brackets in Lost Springs are $30,000 to $34,999 for men (15 | 57.7%) and $20,000 to $22,499 for women (4 | 36.4%).
| Income | Male | Female |
| $2,499 or less | 0 (0.0%) | 2 (18.2%) |
| $2,500 to $4,999 | 0 (0.0%) | 0 (0.0%) |
| $5,000 to $7,499 | 0 (0.0%) | 0 (0.0%) |
| $7,500 to $9,999 | 0 (0.0%) | 0 (0.0%) |
| $10,000 to $12,499 | 0 (0.0%) | 0 (0.0%) |
| $12,500 to $14,999 | 0 (0.0%) | 0 (0.0%) |
| $15,000 to $17,499 | 0 (0.0%) | 0 (0.0%) |
| $17,500 to $19,999 | 0 (0.0%) | 0 (0.0%) |
| $20,000 to $22,499 | 3 (11.5%) | 4 (36.4%) |
| $22,500 to $24,999 | 0 (0.0%) | 0 (0.0%) |
| $25,000 to $29,999 | 0 (0.0%) | 0 (0.0%) |
| $30,000 to $34,999 | 15 (57.7%) | 0 (0.0%) |
| $35,000 to $39,999 | 2 (7.7%) | 3 (27.3%) |
| $40,000 to $44,999 | 5 (19.2%) | 0 (0.0%) |
| $45,000 to $49,999 | 0 (0.0%) | 2 (18.2%) |
| $50,000 to $54,999 | 0 (0.0%) | 0 (0.0%) |
| $55,000 to $64,999 | 0 (0.0%) | 0 (0.0%) |
| $65,000 to $74,999 | 1 (3.8%) | 0 (0.0%) |
| $75,000 to $99,999 | 0 (0.0%) | 0 (0.0%) |
| $100,000+ | 0 (0.0%) | 0 (0.0%) |
| Total | 26 (100.0%) | 11 (100.0%) |
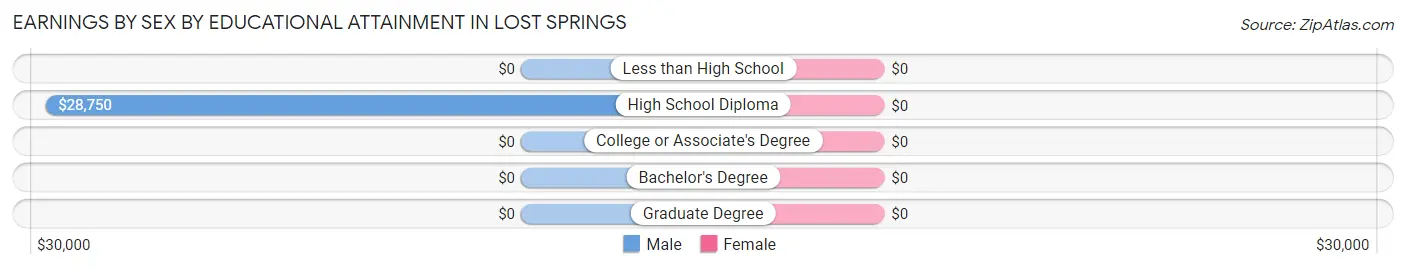
Earnings by Sex by Educational Attainment in Lost Springs
| Educational Attainment | Male Income | Female Income |
| Less than High School | - | - |
| High School Diploma | $28,750 | $0 |
| College or Associate's Degree | - | - |
| Bachelor's Degree | - | - |
| Graduate Degree | - | - |
| Total | $31,250 | $35,417 |
Family Income in Lost Springs
Family Income Brackets in Lost Springs
According to the Lost Springs family income data, there are 6 families falling into the $50,000 to $74,999 income range, which is the most common income bracket and makes up 42.9% of all families.
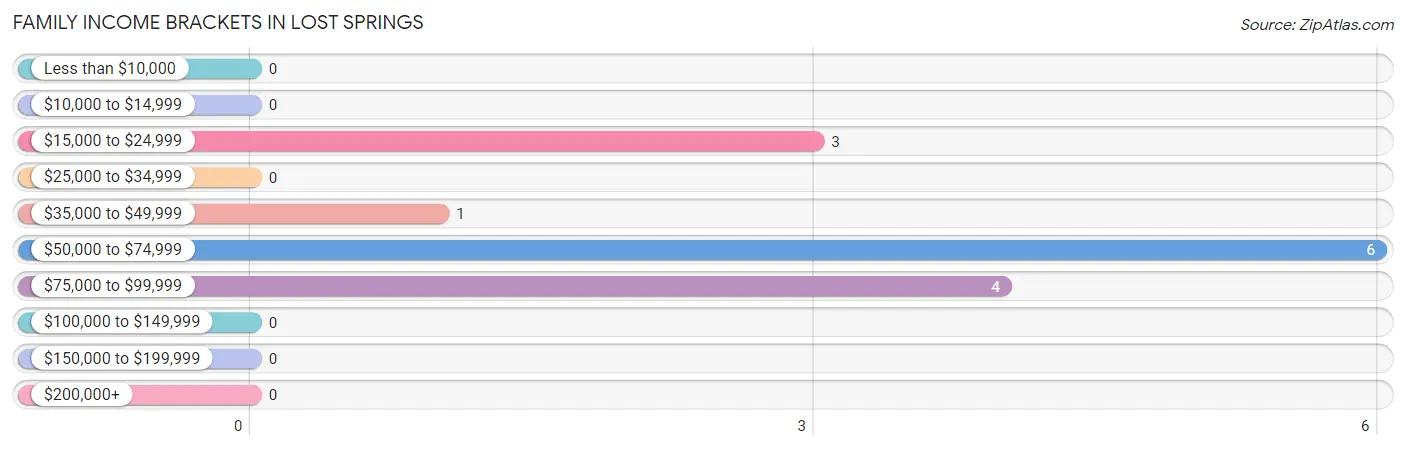
| Income Bracket | # Families | % Families |
| Less than $10,000 | 0 | 0.0% |
| $10,000 to $14,999 | 0 | 0.0% |
| $15,000 to $24,999 | 3 | 21.4% |
| $25,000 to $34,999 | 0 | 0.0% |
| $35,000 to $49,999 | 1 | 7.1% |
| $50,000 to $74,999 | 6 | 42.9% |
| $75,000 to $99,999 | 4 | 28.6% |
| $100,000 to $149,999 | 0 | 0.0% |
| $150,000 to $199,999 | 0 | 0.0% |
| $200,000+ | 0 | 0.0% |
Family Income by Famaliy Size in Lost Springs
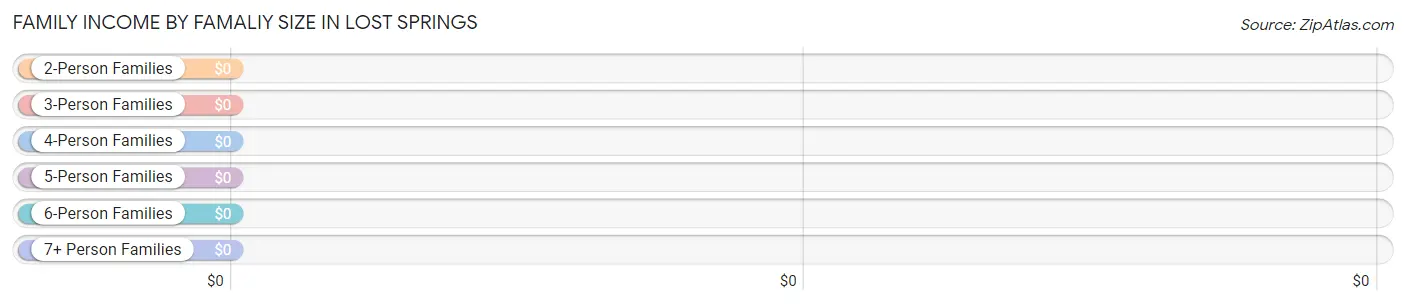
| Income Bracket | # Families | Median Income |
| 2-Person Families | 4 (28.6%) | $0 |
| 3-Person Families | 0 (0.0%) | $0 |
| 4-Person Families | 6 (42.9%) | $0 |
| 5-Person Families | 1 (7.1%) | $0 |
| 6-Person Families | 3 (21.4%) | $0 |
| 7+ Person Families | 0 (0.0%) | $0 |
| Total | 14 (100.0%) | $65,000 |
Family Income by Number of Earners in Lost Springs
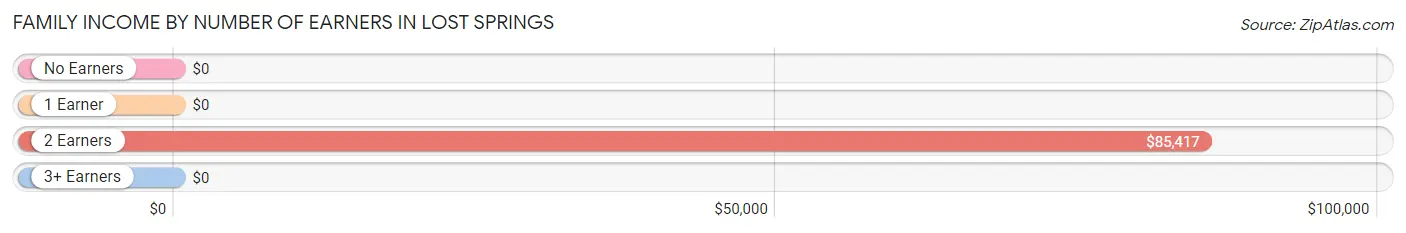
| Number of Earners | # Families | Median Income |
| No Earners | 4 (28.6%) | $0 |
| 1 Earner | 0 (0.0%) | $0 |
| 2 Earners | 7 (50.0%) | $85,417 |
| 3+ Earners | 3 (21.4%) | $0 |
| Total | 14 (100.0%) | $65,000 |
Household Income in Lost Springs
Household Income Brackets in Lost Springs
With 6 households falling in the category, the $50,000 to $74,999 income range is the most frequent in Lost Springs, accounting for 31.6% of all households.
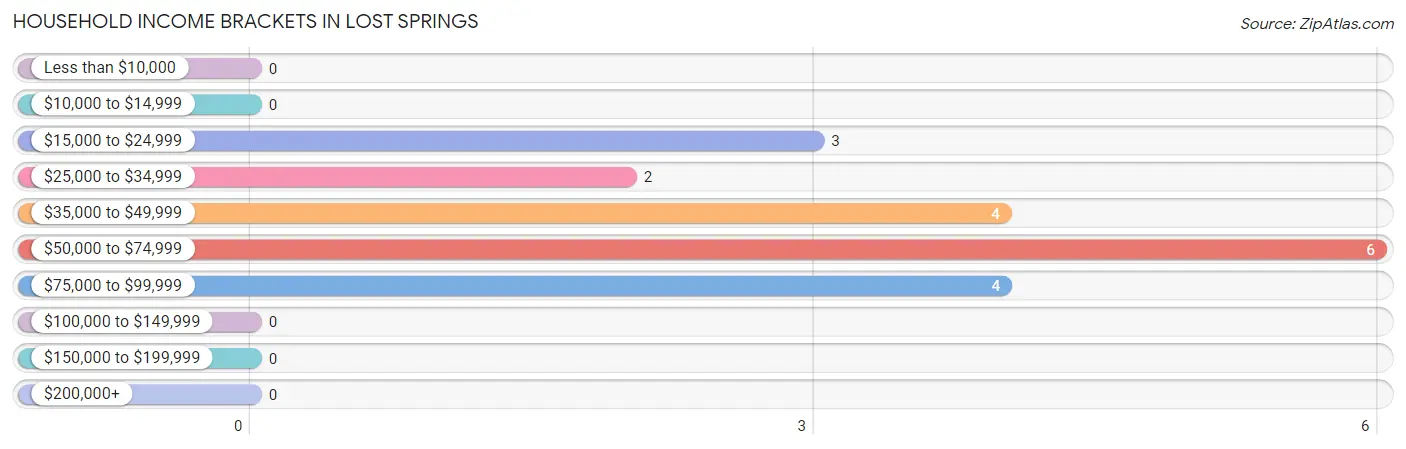
| Income Bracket | # Households | % Households |
| Less than $10,000 | 0 | 0.0% |
| $10,000 to $14,999 | 0 | 0.0% |
| $15,000 to $24,999 | 3 | 15.8% |
| $25,000 to $34,999 | 2 | 10.5% |
| $35,000 to $49,999 | 4 | 21.1% |
| $50,000 to $74,999 | 6 | 31.6% |
| $75,000 to $99,999 | 4 | 21.1% |
| $100,000 to $149,999 | 0 | 0.0% |
| $150,000 to $199,999 | 0 | 0.0% |
| $200,000+ | 0 | 0.0% |
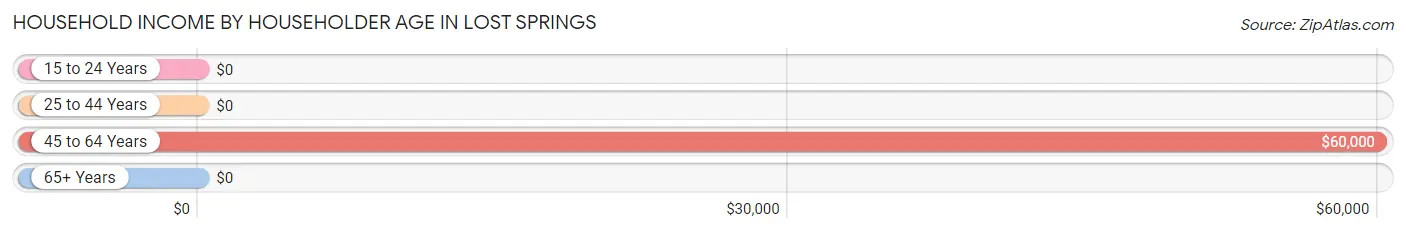
Household Income by Householder Age in Lost Springs
The median household income in Lost Springs is $57,917, with the highest median household income of $60,000 found in the 45 to 64 years age bracket for the primary householder. A total of 6 households (31.6%) fall into this category.
| Income Bracket | # Households | Median Income |
| 15 to 24 Years | 0 (0.0%) | $0 |
| 25 to 44 Years | 4 (21.0%) | $0 |
| 45 to 64 Years | 6 (31.6%) | $60,000 |
| 65+ Years | 9 (47.4%) | $0 |
| Total | 19 (100.0%) | $57,917 |
Poverty in Lost Springs
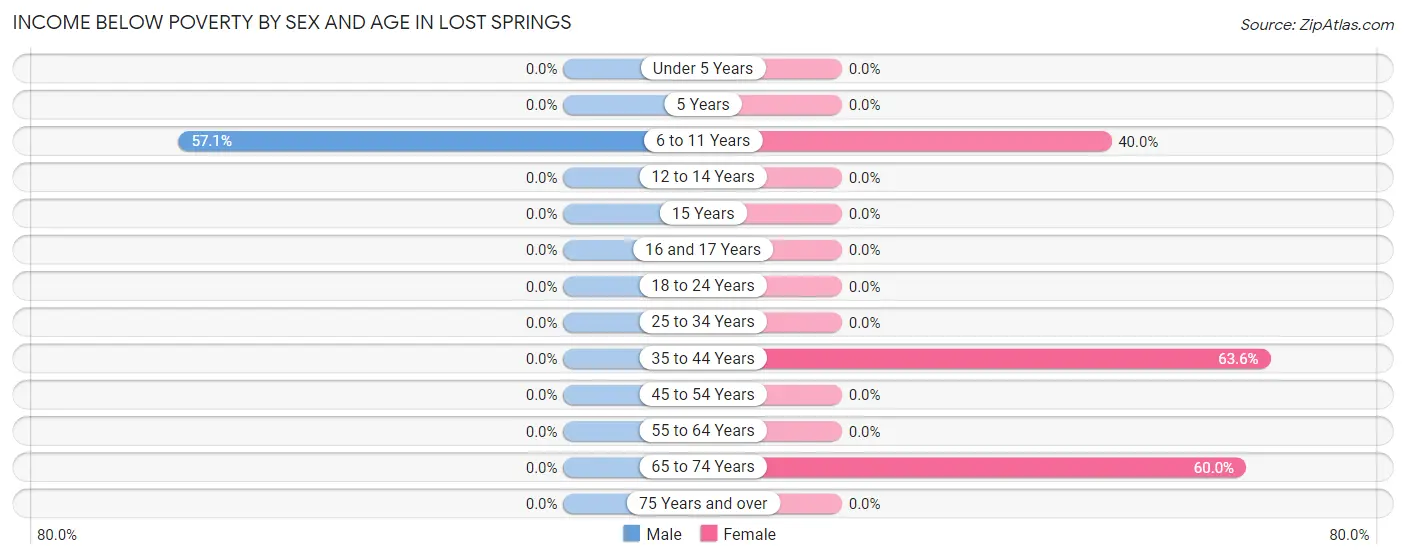
Income Below Poverty by Sex and Age in Lost Springs
With 10.0% poverty level for males and 36.8% for females among the residents of Lost Springs, 6 to 11 year old males and 35 to 44 year old females are the most vulnerable to poverty, with 4 males (57.1%) and 7 females (63.6%) in their respective age groups living below the poverty level.
| Age Bracket | Male | Female |
| Under 5 Years | 0 (0.0%) | 0 (0.0%) |
| 5 Years | 0 (0.0%) | 0 (0.0%) |
| 6 to 11 Years | 4 (57.1%) | 4 (40.0%) |
| 12 to 14 Years | 0 (0.0%) | 0 (0.0%) |
| 15 Years | 0 (0.0%) | 0 (0.0%) |
| 16 and 17 Years | 0 (0.0%) | 0 (0.0%) |
| 18 to 24 Years | 0 (0.0%) | 0 (0.0%) |
| 25 to 34 Years | 0 (0.0%) | 0 (0.0%) |
| 35 to 44 Years | 0 (0.0%) | 7 (63.6%) |
| 45 to 54 Years | 0 (0.0%) | 0 (0.0%) |
| 55 to 64 Years | 0 (0.0%) | 0 (0.0%) |
| 65 to 74 Years | 0 (0.0%) | 3 (60.0%) |
| 75 Years and over | 0 (0.0%) | 0 (0.0%) |
| Total | 4 (10.0%) | 14 (36.8%) |
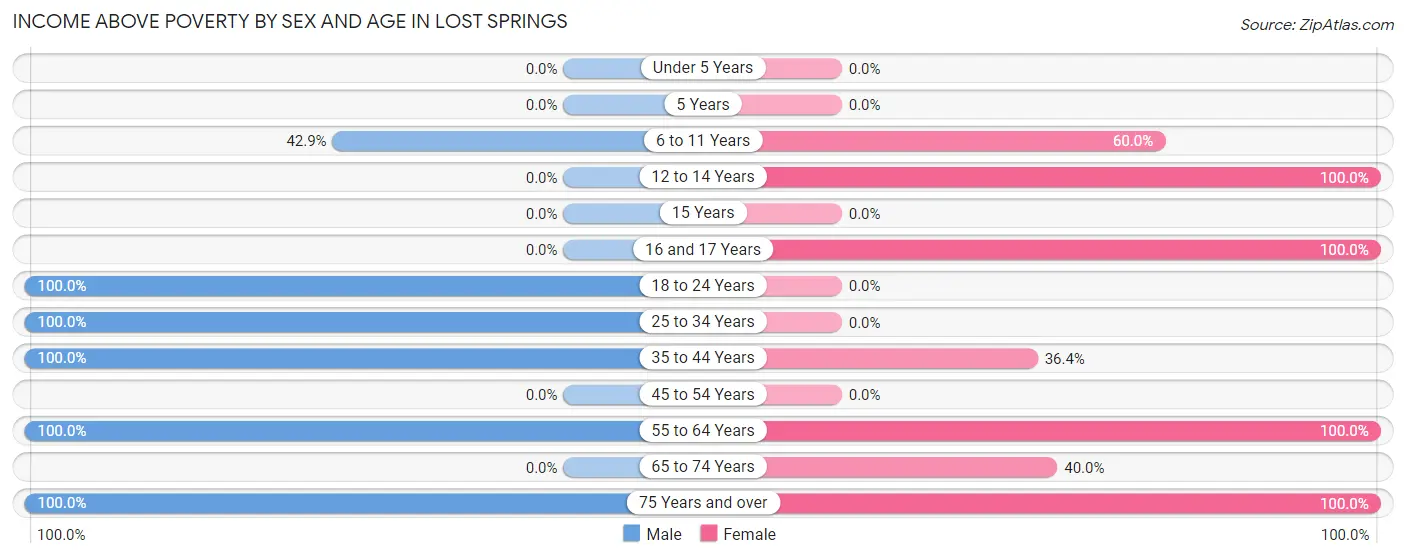
Income Above Poverty by Sex and Age in Lost Springs
According to the poverty statistics in Lost Springs, males aged 18 to 24 years and females aged 12 to 14 years are the age groups that are most secure financially, with 100.0% of males and 100.0% of females in these age groups living above the poverty line.
| Age Bracket | Male | Female |
| Under 5 Years | 0 (0.0%) | 0 (0.0%) |
| 5 Years | 0 (0.0%) | 0 (0.0%) |
| 6 to 11 Years | 3 (42.9%) | 6 (60.0%) |
| 12 to 14 Years | 0 (0.0%) | 1 (100.0%) |
| 15 Years | 0 (0.0%) | 0 (0.0%) |
| 16 and 17 Years | 0 (0.0%) | 2 (100.0%) |
| 18 to 24 Years | 10 (100.0%) | 0 (0.0%) |
| 25 to 34 Years | 15 (100.0%) | 0 (0.0%) |
| 35 to 44 Years | 3 (100.0%) | 4 (36.4%) |
| 45 to 54 Years | 0 (0.0%) | 0 (0.0%) |
| 55 to 64 Years | 3 (100.0%) | 5 (100.0%) |
| 65 to 74 Years | 0 (0.0%) | 2 (40.0%) |
| 75 Years and over | 2 (100.0%) | 4 (100.0%) |
| Total | 36 (90.0%) | 24 (63.2%) |
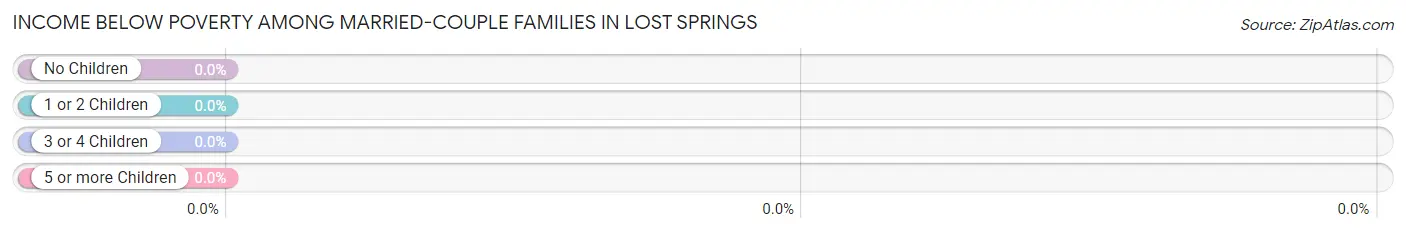
Income Below Poverty Among Married-Couple Families in Lost Springs
| Children | Above Poverty | Below Poverty |
| No Children | 4 (100.0%) | 0 (0.0%) |
| 1 or 2 Children | 0 (0.0%) | 0 (0.0%) |
| 3 or 4 Children | 4 (100.0%) | 0 (0.0%) |
| 5 or more Children | 0 (0.0%) | 0 (0.0%) |
| Total | 8 (100.0%) | 0 (0.0%) |
Income Below Poverty Among Single-Parent Households in Lost Springs
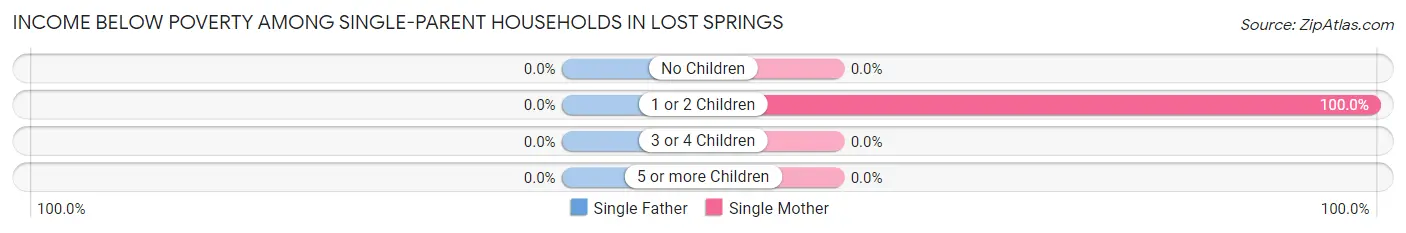
| Children | Single Father | Single Mother |
| No Children | 0 (0.0%) | 0 (0.0%) |
| 1 or 2 Children | 0 (0.0%) | 3 (100.0%) |
| 3 or 4 Children | 0 (0.0%) | 0 (0.0%) |
| 5 or more Children | 0 (0.0%) | 0 (0.0%) |
| Total | 0 (0.0%) | 3 (50.0%) |
Income Below Poverty Among Married-Couple vs Single-Parent Households in Lost Springs
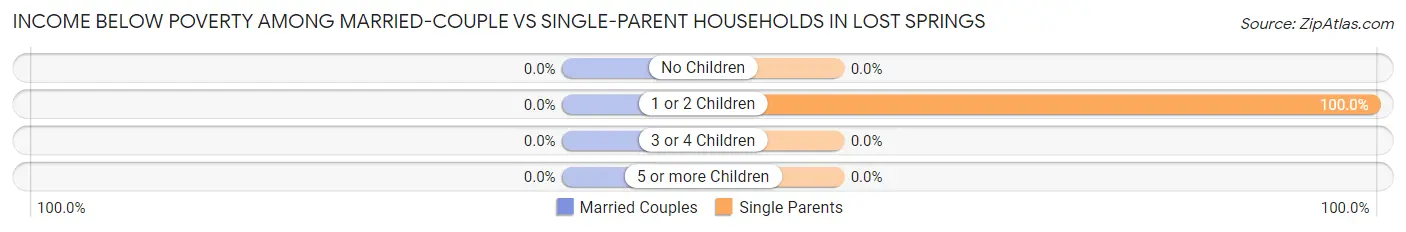
| Children | Married-Couple Families | Single-Parent Households |
| No Children | 0 (0.0%) | 0 (0.0%) |
| 1 or 2 Children | 0 (0.0%) | 3 (100.0%) |
| 3 or 4 Children | 0 (0.0%) | 0 (0.0%) |
| 5 or more Children | 0 (0.0%) | 0 (0.0%) |
| Total | 0 (0.0%) | 3 (50.0%) |
Race in Lost Springs
The most populous races in Lost Springs are White / Caucasian (57 | 73.1%), Hispanic or Latino (30 | 38.5%), and Two or more Races (21 | 26.9%).
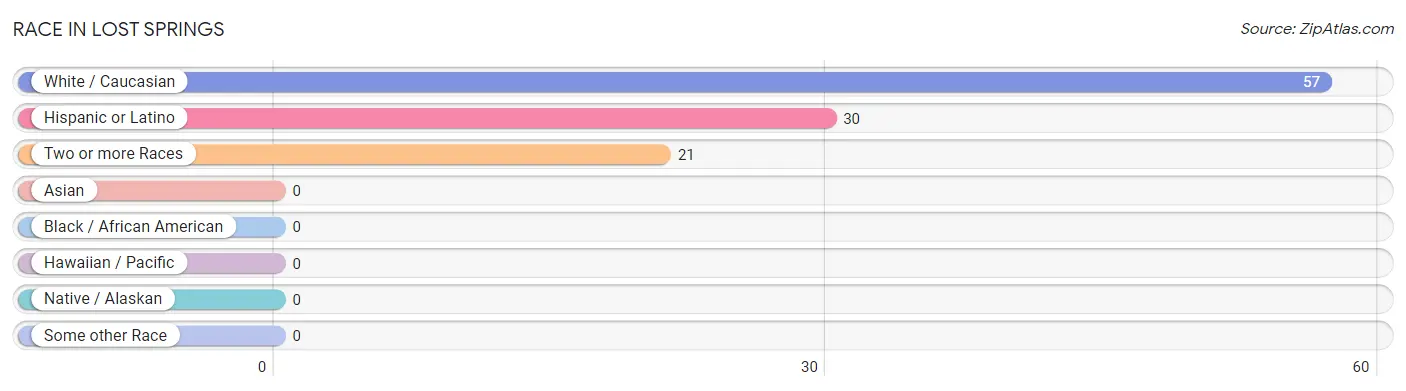
| Race | # Population | % Population |
| Asian | 0 | 0.0% |
| Black / African American | 0 | 0.0% |
| Hawaiian / Pacific | 0 | 0.0% |
| Hispanic or Latino | 30 | 38.5% |
| Native / Alaskan | 0 | 0.0% |
| White / Caucasian | 57 | 73.1% |
| Two or more Races | 21 | 26.9% |
| Some other Race | 0 | 0.0% |
| Total | 78 | 100.0% |
Ancestry in Lost Springs
The most populous ancestries reported in Lost Springs are German (27 | 34.6%), Czech (18 | 23.1%), Mexican (18 | 23.1%), Shoshone (18 | 23.1%), and American (6 | 7.7%), together accounting for 111.5% of all Lost Springs residents.
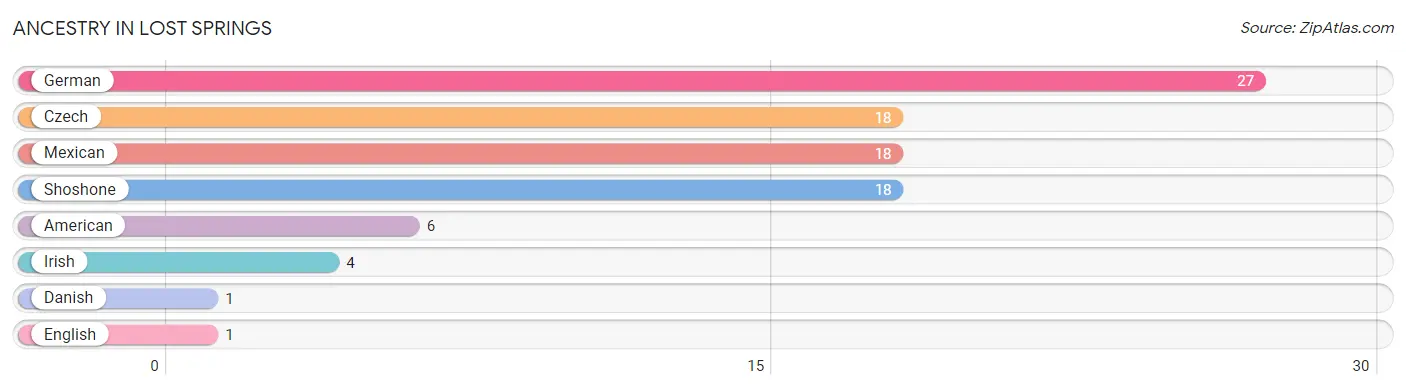
| Ancestry | # Population | % Population |
| American | 6 | 7.7% |
| Czech | 18 | 23.1% |
| Danish | 1 | 1.3% |
| English | 1 | 1.3% |
| German | 27 | 34.6% |
| Irish | 4 | 5.1% |
| Mexican | 18 | 23.1% |
| Shoshone | 18 | 23.1% | View All 8 Rows |
Immigrants in Lost Springs

| Immigration Origin | # Population | % Population | View All 0 Rows |
Sex and Age in Lost Springs
Sex and Age in Lost Springs
The most populous age groups in Lost Springs are 30 to 34 Years (15 | 37.5%) for men and 35 to 39 Years (10 | 26.3%) for women.
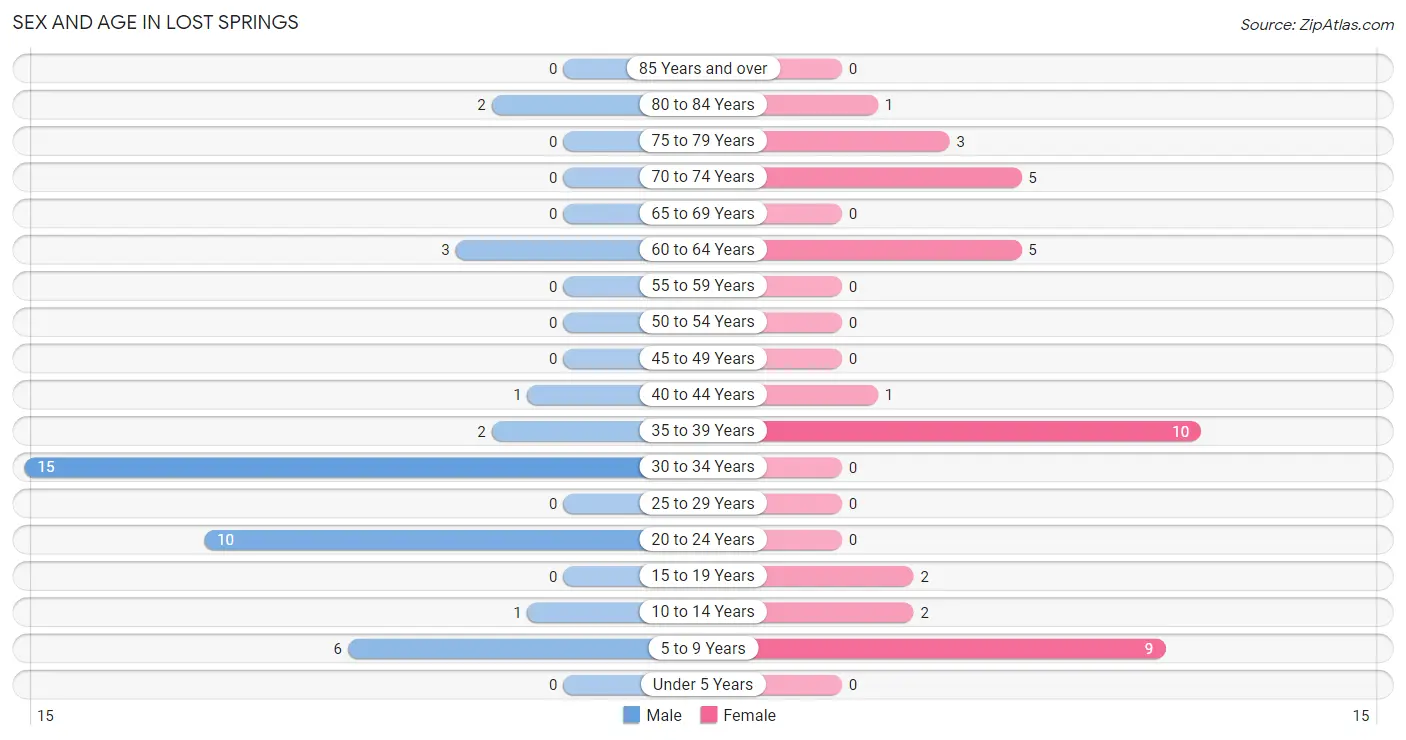
| Age Bracket | Male | Female |
| Under 5 Years | 0 (0.0%) | 0 (0.0%) |
| 5 to 9 Years | 6 (15.0%) | 9 (23.7%) |
| 10 to 14 Years | 1 (2.5%) | 2 (5.3%) |
| 15 to 19 Years | 0 (0.0%) | 2 (5.3%) |
| 20 to 24 Years | 10 (25.0%) | 0 (0.0%) |
| 25 to 29 Years | 0 (0.0%) | 0 (0.0%) |
| 30 to 34 Years | 15 (37.5%) | 0 (0.0%) |
| 35 to 39 Years | 2 (5.0%) | 10 (26.3%) |
| 40 to 44 Years | 1 (2.5%) | 1 (2.6%) |
| 45 to 49 Years | 0 (0.0%) | 0 (0.0%) |
| 50 to 54 Years | 0 (0.0%) | 0 (0.0%) |
| 55 to 59 Years | 0 (0.0%) | 0 (0.0%) |
| 60 to 64 Years | 3 (7.5%) | 5 (13.2%) |
| 65 to 69 Years | 0 (0.0%) | 0 (0.0%) |
| 70 to 74 Years | 0 (0.0%) | 5 (13.2%) |
| 75 to 79 Years | 0 (0.0%) | 3 (7.9%) |
| 80 to 84 Years | 2 (5.0%) | 1 (2.6%) |
| 85 Years and over | 0 (0.0%) | 0 (0.0%) |
| Total | 40 (100.0%) | 38 (100.0%) |
Families and Households in Lost Springs
Median Family Size in Lost Springs
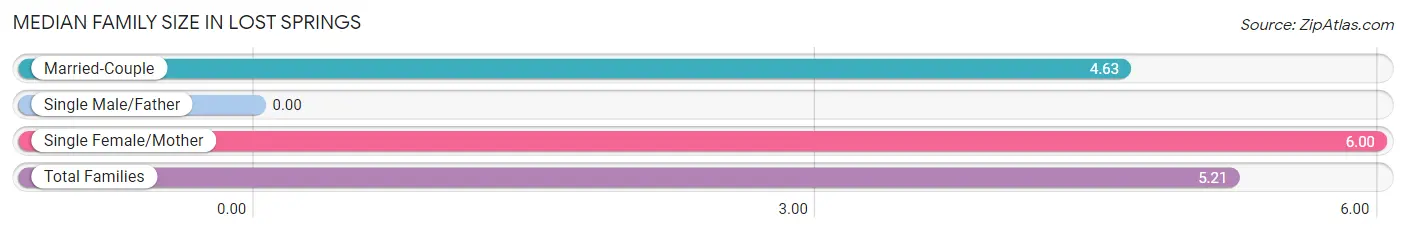
| Family Type | # Families | Family Size |
| Married-Couple | 8 (57.1%) | 4.63 |
| Single Male/Father | 0 (0.0%) | - |
| Single Female/Mother | 6 (42.9%) | 6.00 |
| Total Families | 14 (100.0%) | 5.21 |
Median Household Size in Lost Springs
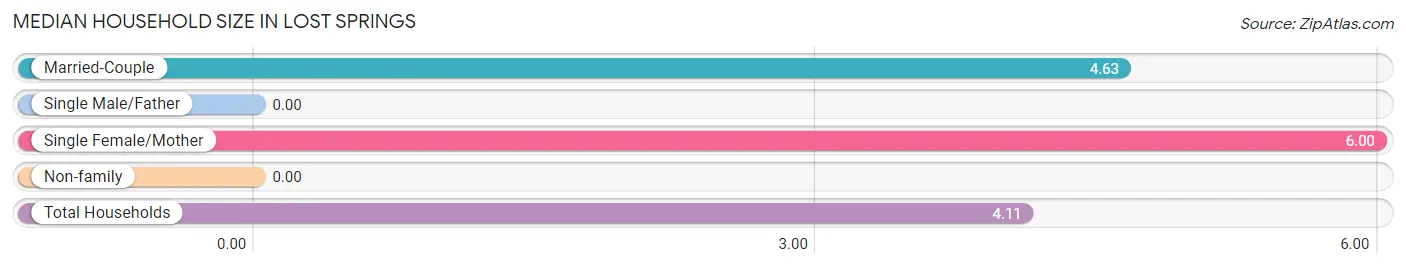
| Household Type | # Households | Household Size |
| Married-Couple | 8 (42.1%) | 4.63 |
| Single Male/Father | 0 (0.0%) | - |
| Single Female/Mother | 6 (31.6%) | 6.00 |
| Non-family | 5 (26.3%) | - |
| Total Households | 19 (100.0%) | 4.11 |
Household Size by Marriage Status in Lost Springs
Out of a total of 19 households in Lost Springs, 14 (73.7%) are family households, while 5 (26.3%) are nonfamily households. The most numerous type of family households are 4-person households, comprising 6, and the most common type of nonfamily households are 1-person households, comprising 5.
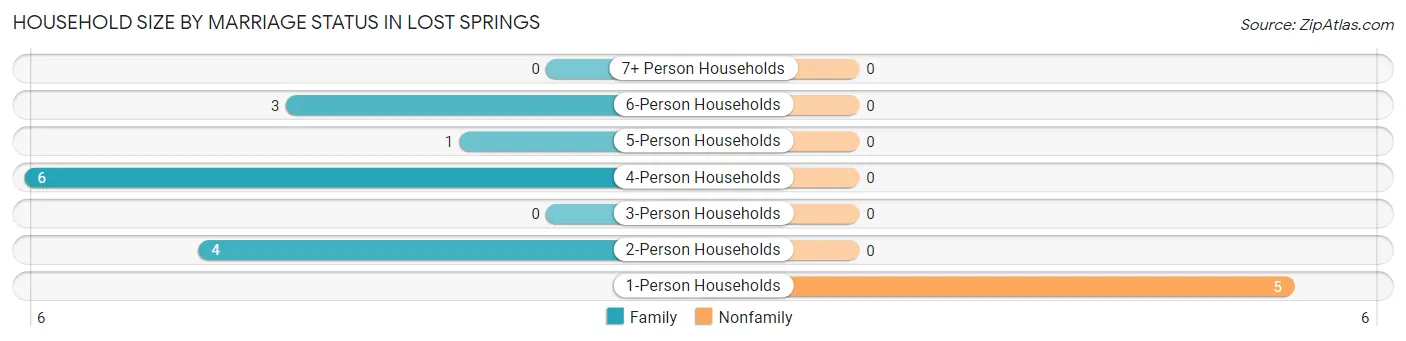
| Household Size | Family Households | Nonfamily Households |
| 1-Person Households | - | 5 (26.3%) |
| 2-Person Households | 4 (21.0%) | 0 (0.0%) |
| 3-Person Households | 0 (0.0%) | 0 (0.0%) |
| 4-Person Households | 6 (31.6%) | 0 (0.0%) |
| 5-Person Households | 1 (5.3%) | 0 (0.0%) |
| 6-Person Households | 3 (15.8%) | 0 (0.0%) |
| 7+ Person Households | 0 (0.0%) | 0 (0.0%) |
| Total | 14 (73.7%) | 5 (26.3%) |
Female Fertility in Lost Springs
Fertility by Age in Lost Springs
| Age Bracket | Women with Births | Births / 1,000 Women |
| 15 to 19 years | 0 (0.0%) | 0.0 |
| 20 to 34 years | 0 (0.0%) | 0.0 |
| 35 to 50 years | 0 (0.0%) | 0.0 |
| Total | 0 (0.0%) | 0.0 |
Fertility by Age by Marriage Status in Lost Springs
| Age Bracket | Married | Unmarried |
| 15 to 19 years | 0 (0.0%) | 0 (0.0%) |
| 20 to 34 years | 0 (0.0%) | 0 (0.0%) |
| 35 to 50 years | 0 (0.0%) | 0 (0.0%) |
| Total | 0 (0.0%) | 0 (0.0%) |
Fertility by Education in Lost Springs
| Educational Attainment | Women with Births | Births / 1,000 Women |
| Less than High School | 0 (0.0%) | 0.0 |
| High School Diploma | 0 (0.0%) | 0.0 |
| College or Associate's Degree | 0 (0.0%) | 0.0 |
| Bachelor's Degree | 0 (0.0%) | 0.0 |
| Graduate Degree | 0 (0.0%) | 0.0 |
| Total | 0 (0.0%) | 0.0 |
Fertility by Education by Marriage Status in Lost Springs
| Educational Attainment | Married | Unmarried |
| Less than High School | 0 (0.0%) | 0 (0.0%) |
| High School Diploma | 0 (0.0%) | 0 (0.0%) |
| College or Associate's Degree | 0 (0.0%) | 0 (0.0%) |
| Bachelor's Degree | 0 (0.0%) | 0 (0.0%) |
| Graduate Degree | 0 (0.0%) | 0 (0.0%) |
| Total | 0 (0.0%) | 0 (0.0%) |
Employment Characteristics in Lost Springs
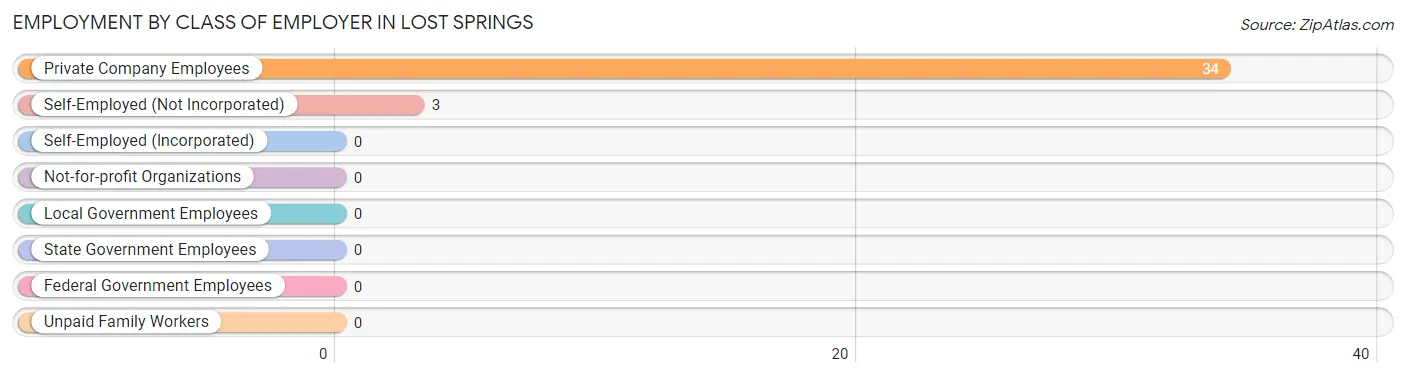
Employment by Class of Employer in Lost Springs
Among the 37 employed individuals in Lost Springs, private company employees (34 | 91.9%), and self-employed (not incorporated) (3 | 8.1%) make up the most common classes of employment.
| Employer Class | # Employees | % Employees |
| Private Company Employees | 34 | 91.9% |
| Self-Employed (Incorporated) | 0 | 0.0% |
| Self-Employed (Not Incorporated) | 3 | 8.1% |
| Not-for-profit Organizations | 0 | 0.0% |
| Local Government Employees | 0 | 0.0% |
| State Government Employees | 0 | 0.0% |
| Federal Government Employees | 0 | 0.0% |
| Unpaid Family Workers | 0 | 0.0% |
| Total | 37 | 100.0% |
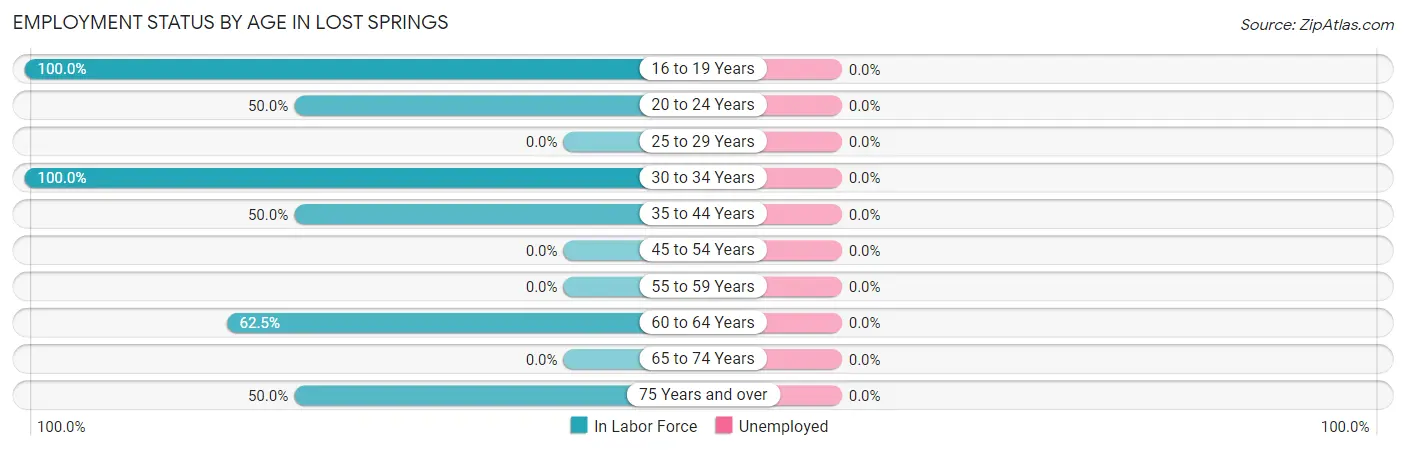
Employment Status by Age in Lost Springs
| Age Bracket | In Labor Force | Unemployed |
| 16 to 19 Years | 2 (100.0%) | 0 (0.0%) |
| 20 to 24 Years | 5 (50.0%) | 0 (0.0%) |
| 25 to 29 Years | 0 (0.0%) | 0 (0.0%) |
| 30 to 34 Years | 15 (100.0%) | 0 (0.0%) |
| 35 to 44 Years | 7 (50.0%) | 0 (0.0%) |
| 45 to 54 Years | 0 (0.0%) | 0 (0.0%) |
| 55 to 59 Years | 0 (0.0%) | 0 (0.0%) |
| 60 to 64 Years | 5 (62.5%) | 0 (0.0%) |
| 65 to 74 Years | 0 (0.0%) | 0 (0.0%) |
| 75 Years and over | 3 (50.0%) | 0 (0.0%) |
| Total | 37 (61.7%) | 0 (0.0%) |
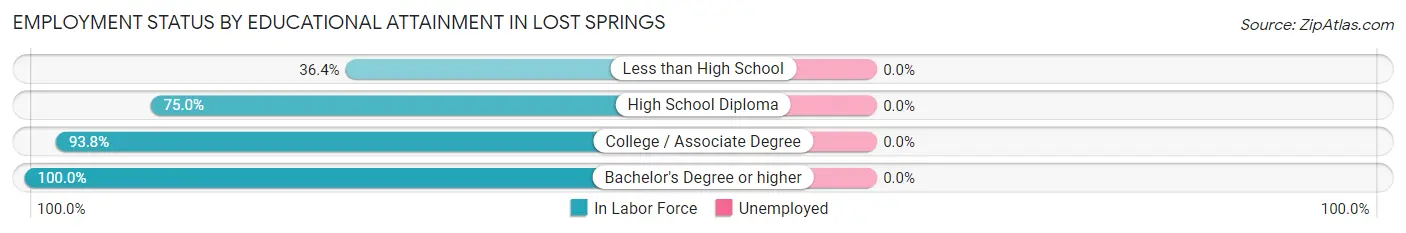
Employment Status by Educational Attainment in Lost Springs
| Educational Attainment | In Labor Force | Unemployed |
| Less than High School | 4 (36.4%) | 0 (0.0%) |
| High School Diploma | 6 (75.0%) | 0 (0.0%) |
| College / Associate Degree | 15 (93.8%) | 0 (0.0%) |
| Bachelor's Degree or higher | 2 (100.0%) | 0 (0.0%) |
| Total | 27 (73.0%) | 0 (0.0%) |
Employment Occupations by Sex in Lost Springs
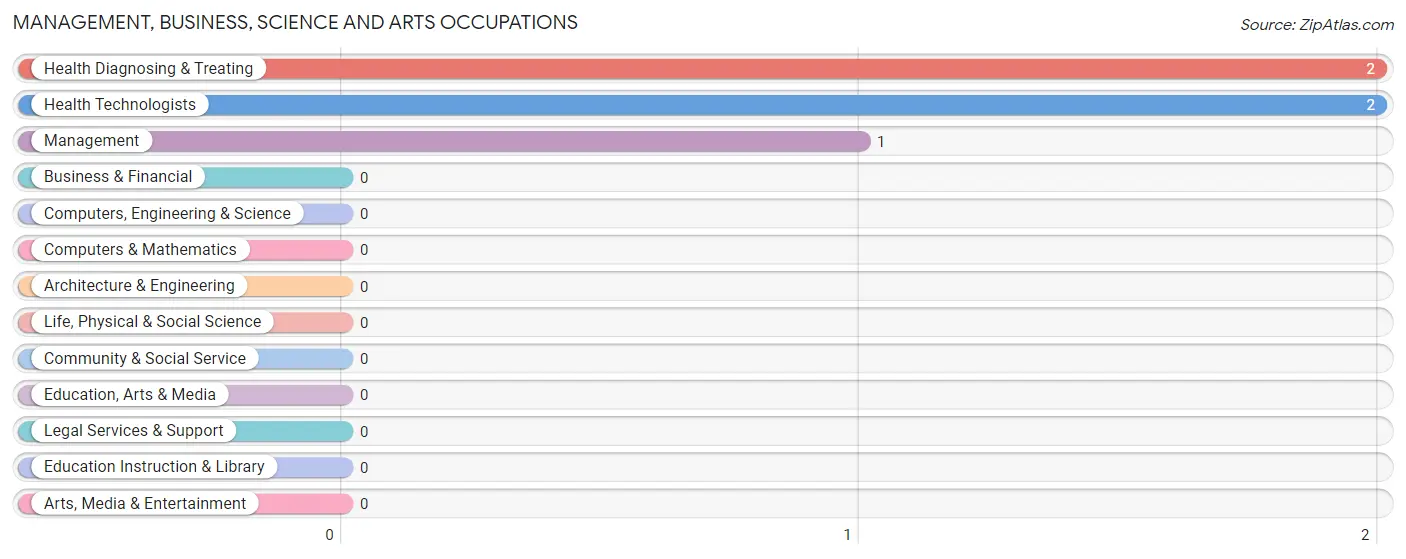
Management, Business, Science and Arts Occupations
The most common Management, Business, Science and Arts occupations in Lost Springs are Health Diagnosing & Treating (2 | 5.4%), Health Technologists (2 | 5.4%), and Management (1 | 2.7%).
Management, Business, Science and Arts Occupations by Sex
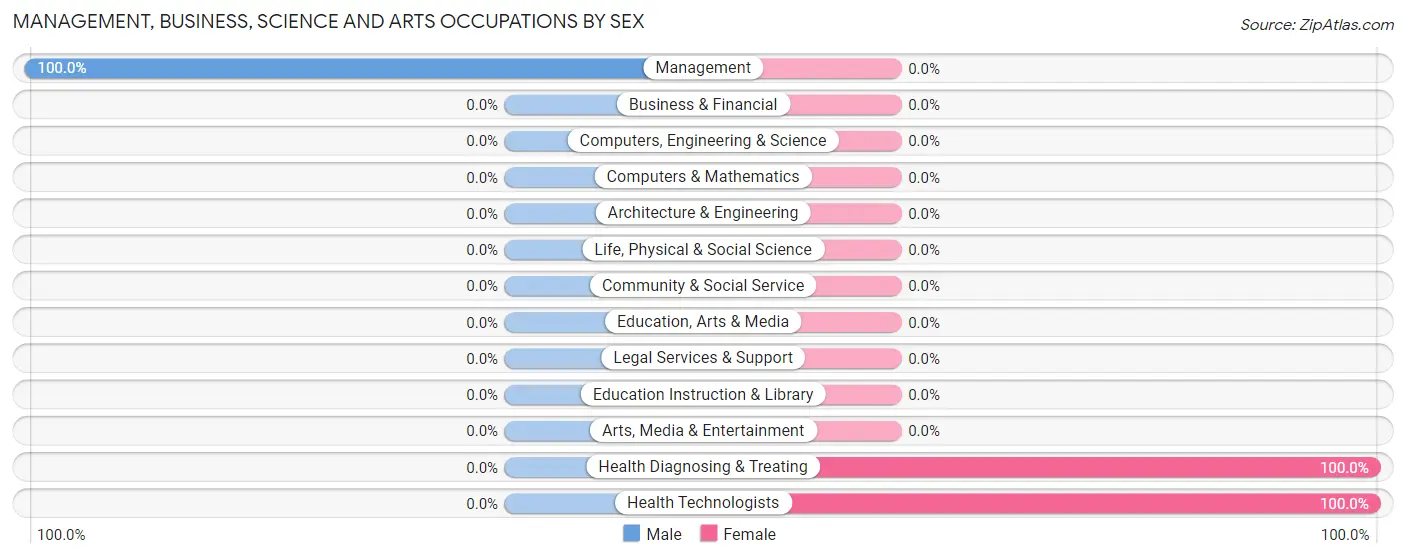
| Occupation | Male | Female |
| Management | 1 (100.0%) | 0 (0.0%) |
| Business & Financial | 0 (0.0%) | 0 (0.0%) |
| Computers, Engineering & Science | 0 (0.0%) | 0 (0.0%) |
| Computers & Mathematics | 0 (0.0%) | 0 (0.0%) |
| Architecture & Engineering | 0 (0.0%) | 0 (0.0%) |
| Life, Physical & Social Science | 0 (0.0%) | 0 (0.0%) |
| Community & Social Service | 0 (0.0%) | 0 (0.0%) |
| Education, Arts & Media | 0 (0.0%) | 0 (0.0%) |
| Legal Services & Support | 0 (0.0%) | 0 (0.0%) |
| Education Instruction & Library | 0 (0.0%) | 0 (0.0%) |
| Arts, Media & Entertainment | 0 (0.0%) | 0 (0.0%) |
| Health Diagnosing & Treating | 0 (0.0%) | 2 (100.0%) |
| Health Technologists | 0 (0.0%) | 2 (100.0%) |
| Total (Category) | 1 (33.3%) | 2 (66.7%) |
| Total (Overall) | 26 (70.3%) | 11 (29.7%) |
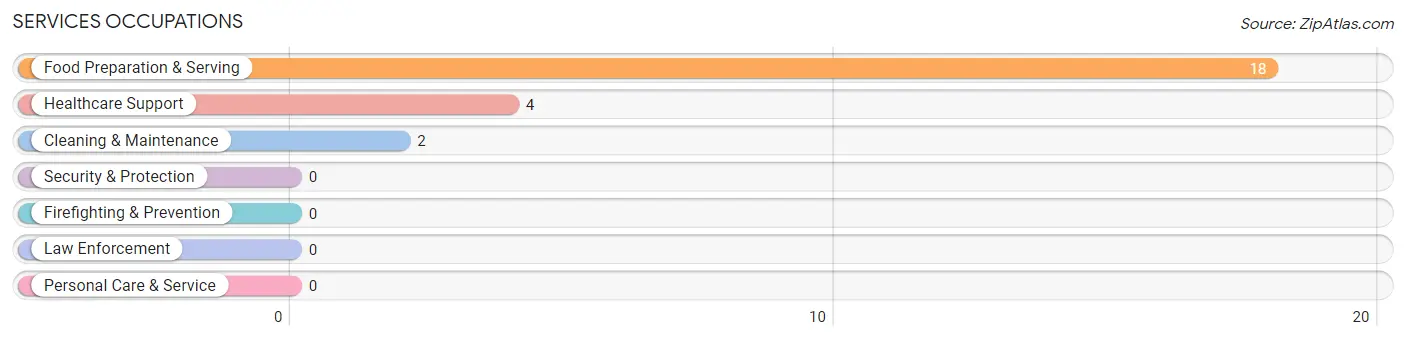
Services Occupations
The most common Services occupations in Lost Springs are Food Preparation & Serving (18 | 48.6%), Healthcare Support (4 | 10.8%), and Cleaning & Maintenance (2 | 5.4%).
Services Occupations by Sex
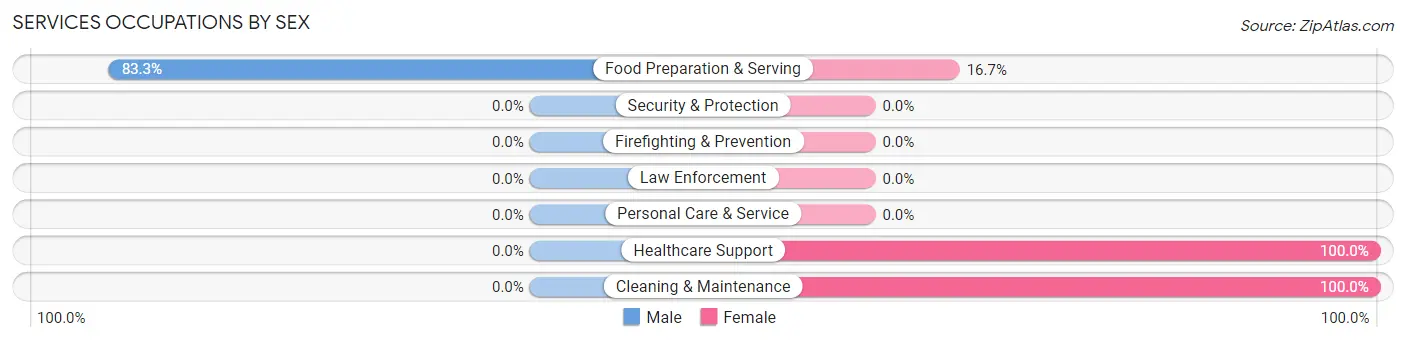
| Occupation | Male | Female |
| Healthcare Support | 0 (0.0%) | 4 (100.0%) |
| Security & Protection | 0 (0.0%) | 0 (0.0%) |
| Firefighting & Prevention | 0 (0.0%) | 0 (0.0%) |
| Law Enforcement | 0 (0.0%) | 0 (0.0%) |
| Food Preparation & Serving | 15 (83.3%) | 3 (16.7%) |
| Cleaning & Maintenance | 0 (0.0%) | 2 (100.0%) |
| Personal Care & Service | 0 (0.0%) | 0 (0.0%) |
| Total (Category) | 15 (62.5%) | 9 (37.5%) |
| Total (Overall) | 26 (70.3%) | 11 (29.7%) |
Sales and Office Occupations
The most common Sales and Office occupations in Lost Springs are , and Office & Administration (5 | 13.5%).
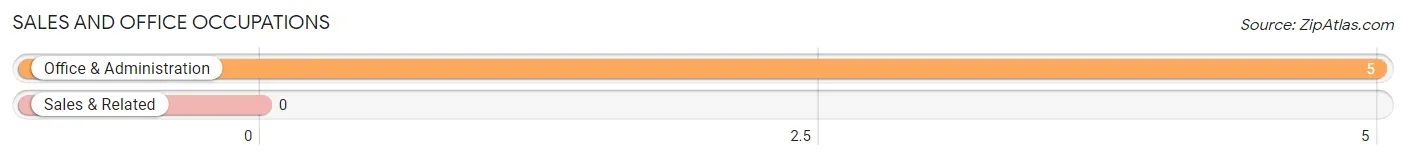
Sales and Office Occupations by Sex

| Occupation | Male | Female |
| Sales & Related | 0 (0.0%) | 0 (0.0%) |
| Office & Administration | 5 (100.0%) | 0 (0.0%) |
| Total (Category) | 5 (100.0%) | 0 (0.0%) |
| Total (Overall) | 26 (70.3%) | 11 (29.7%) |
Natural Resources, Construction and Maintenance Occupations
The most common Natural Resources, Construction and Maintenance occupations in Lost Springs are Farming, Fishing & Forestry (3 | 8.1%), and Construction & Extraction (2 | 5.4%).
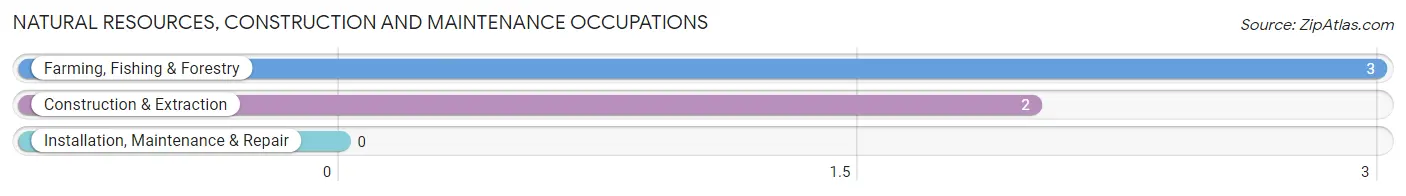
Natural Resources, Construction and Maintenance Occupations by Sex
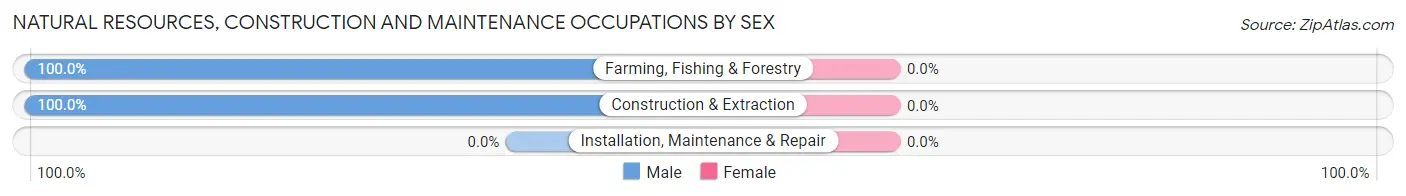
| Occupation | Male | Female |
| Farming, Fishing & Forestry | 3 (100.0%) | 0 (0.0%) |
| Construction & Extraction | 2 (100.0%) | 0 (0.0%) |
| Installation, Maintenance & Repair | 0 (0.0%) | 0 (0.0%) |
| Total (Category) | 5 (100.0%) | 0 (0.0%) |
| Total (Overall) | 26 (70.3%) | 11 (29.7%) |
Production, Transportation and Moving Occupations
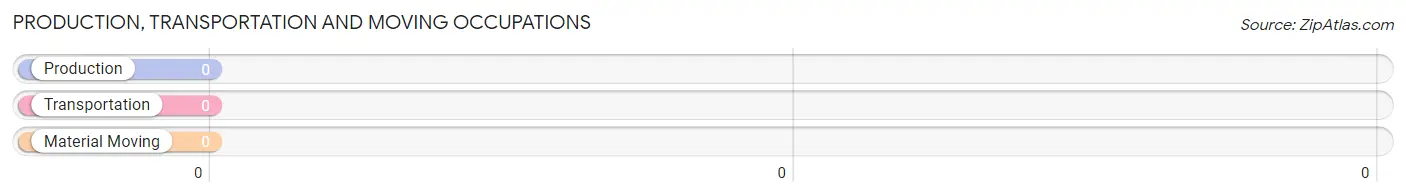
Production, Transportation and Moving Occupations by Sex
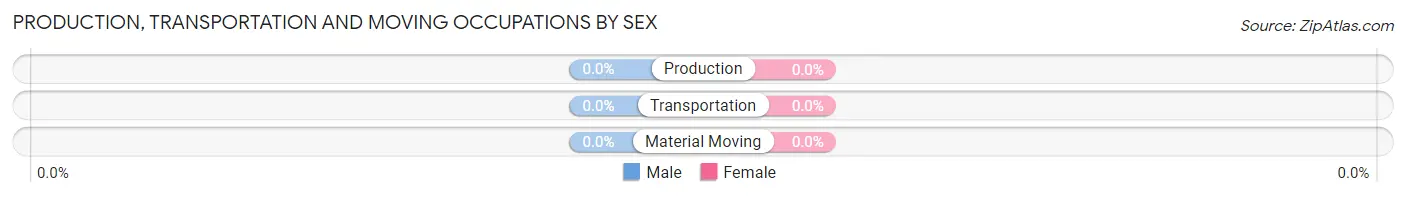
| Occupation | Male | Female |
| Production | 0 (0.0%) | 0 (0.0%) |
| Transportation | 0 (0.0%) | 0 (0.0%) |
| Material Moving | 0 (0.0%) | 0 (0.0%) |
| Total (Category) | 0 (0.0%) | 0 (0.0%) |
| Total (Overall) | 26 (70.3%) | 11 (29.7%) |
Employment Industries by Sex in Lost Springs
Employment Industries in Lost Springs
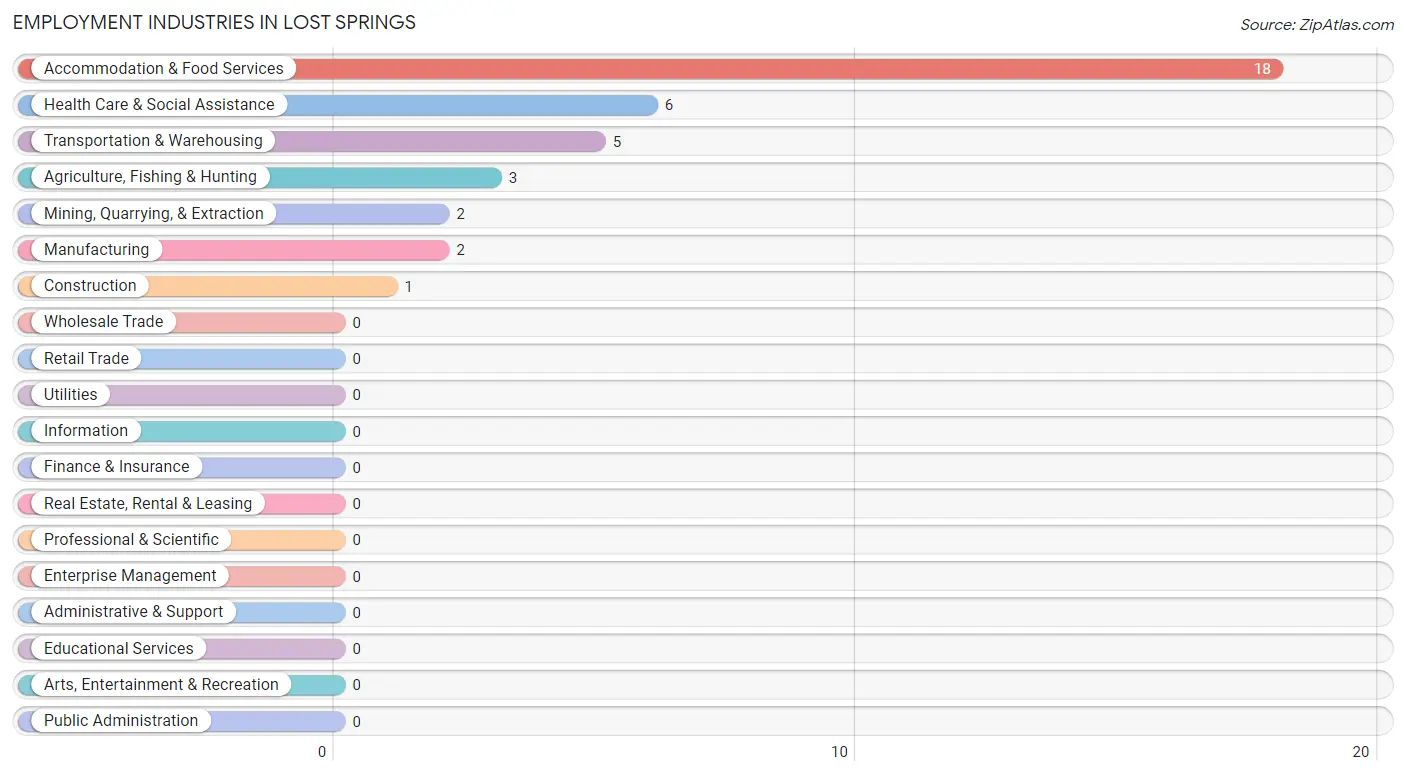
The major employment industries in Lost Springs include Accommodation & Food Services (18 | 48.6%), Health Care & Social Assistance (6 | 16.2%), Transportation & Warehousing (5 | 13.5%), Agriculture, Fishing & Hunting (3 | 8.1%), and Mining, Quarrying, & Extraction (2 | 5.4%).
Employment Industries by Sex in Lost Springs
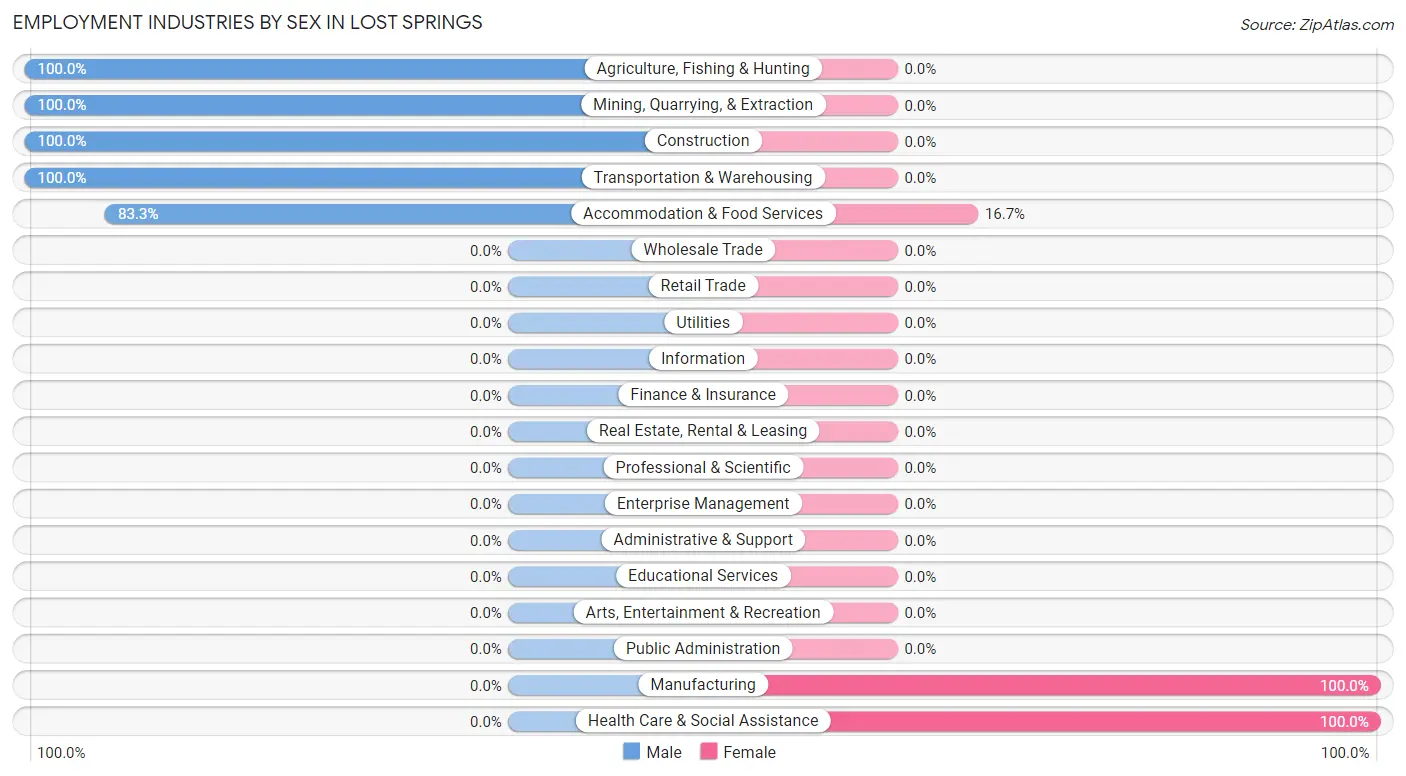
The Lost Springs industries that see more men than women are Agriculture, Fishing & Hunting (100.0%), Mining, Quarrying, & Extraction (100.0%), and Construction (100.0%), whereas the industries that tend to have a higher number of women are Manufacturing (100.0%), Health Care & Social Assistance (100.0%), and Accommodation & Food Services (16.7%).
| Industry | Male | Female |
| Agriculture, Fishing & Hunting | 3 (100.0%) | 0 (0.0%) |
| Mining, Quarrying, & Extraction | 2 (100.0%) | 0 (0.0%) |
| Construction | 1 (100.0%) | 0 (0.0%) |
| Manufacturing | 0 (0.0%) | 2 (100.0%) |
| Wholesale Trade | 0 (0.0%) | 0 (0.0%) |
| Retail Trade | 0 (0.0%) | 0 (0.0%) |
| Transportation & Warehousing | 5 (100.0%) | 0 (0.0%) |
| Utilities | 0 (0.0%) | 0 (0.0%) |
| Information | 0 (0.0%) | 0 (0.0%) |
| Finance & Insurance | 0 (0.0%) | 0 (0.0%) |
| Real Estate, Rental & Leasing | 0 (0.0%) | 0 (0.0%) |
| Professional & Scientific | 0 (0.0%) | 0 (0.0%) |
| Enterprise Management | 0 (0.0%) | 0 (0.0%) |
| Administrative & Support | 0 (0.0%) | 0 (0.0%) |
| Educational Services | 0 (0.0%) | 0 (0.0%) |
| Health Care & Social Assistance | 0 (0.0%) | 6 (100.0%) |
| Arts, Entertainment & Recreation | 0 (0.0%) | 0 (0.0%) |
| Accommodation & Food Services | 15 (83.3%) | 3 (16.7%) |
| Public Administration | 0 (0.0%) | 0 (0.0%) |
| Total | 26 (70.3%) | 11 (29.7%) |
Education in Lost Springs
School Enrollment in Lost Springs
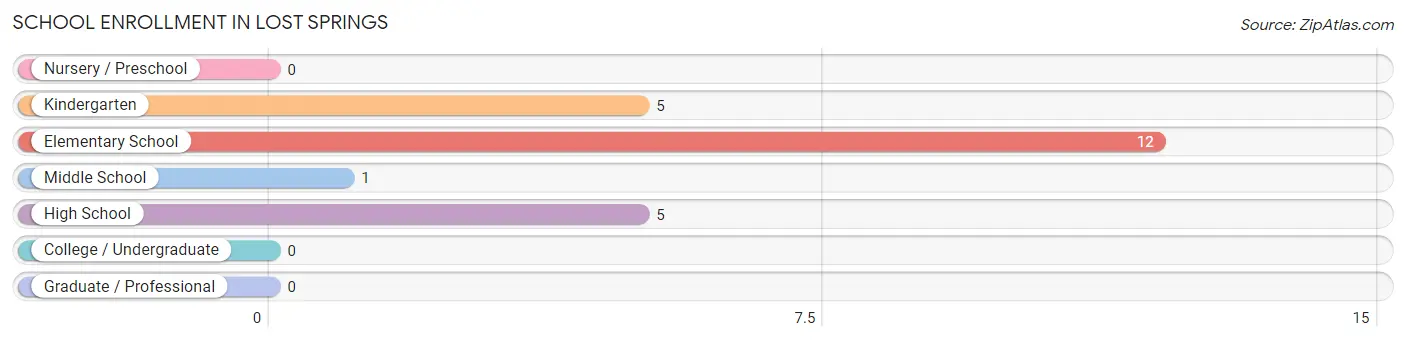
The most common levels of schooling among the 23 students in Lost Springs are elementary school (12 | 52.2%), kindergarten (5 | 21.7%), and high school (5 | 21.7%).
| School Level | # Students | % Students |
| Nursery / Preschool | 0 | 0.0% |
| Kindergarten | 5 | 21.7% |
| Elementary School | 12 | 52.2% |
| Middle School | 1 | 4.3% |
| High School | 5 | 21.7% |
| College / Undergraduate | 0 | 0.0% |
| Graduate / Professional | 0 | 0.0% |
| Total | 23 | 100.0% |
School Enrollment by Age by Funding Source in Lost Springs
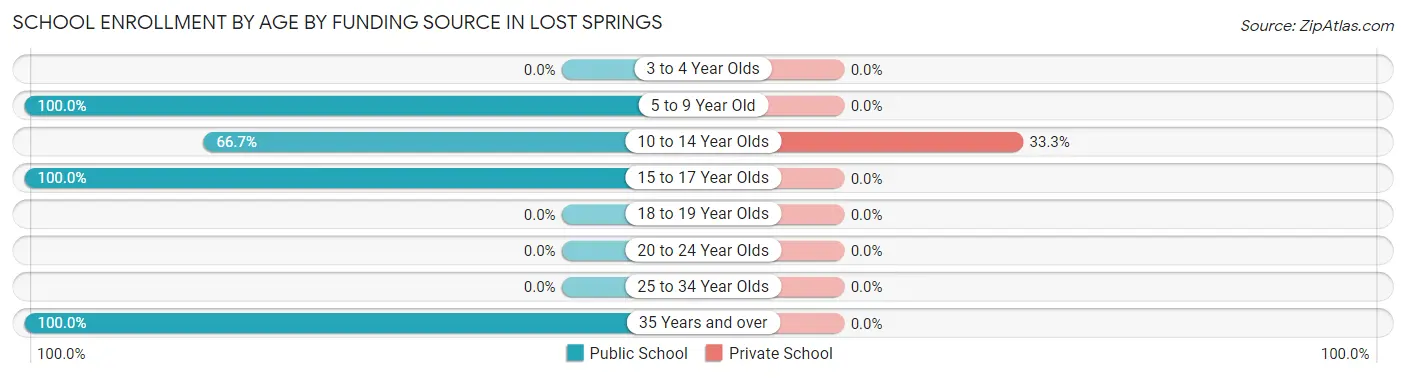
Out of a total of 23 students who are enrolled in schools in Lost Springs, 1 (4.3%) attend a private institution, while the remaining 22 (95.7%) are enrolled in public schools. The age group of 10 to 14 year olds has the highest likelihood of being enrolled in private schools, with 1 (33.3% in the age bracket) enrolled. Conversely, the age group of 5 to 9 year old has the lowest likelihood of being enrolled in a private school, with 15 (100.0% in the age bracket) attending a public institution.
| Age Bracket | Public School | Private School |
| 3 to 4 Year Olds | 0 (0.0%) | 0 (0.0%) |
| 5 to 9 Year Old | 15 (100.0%) | 0 (0.0%) |
| 10 to 14 Year Olds | 2 (66.7%) | 1 (33.3%) |
| 15 to 17 Year Olds | 2 (100.0%) | 0 (0.0%) |
| 18 to 19 Year Olds | 0 (0.0%) | 0 (0.0%) |
| 20 to 24 Year Olds | 0 (0.0%) | 0 (0.0%) |
| 25 to 34 Year Olds | 0 (0.0%) | 0 (0.0%) |
| 35 Years and over | 3 (100.0%) | 0 (0.0%) |
| Total | 22 (95.7%) | 1 (4.3%) |
Educational Attainment by Field of Study in Lost Springs
Education (3 | 42.9%), science & technology (2 | 28.6%), and business (2 | 28.6%) are the most common fields of study among 7 individuals in Lost Springs who have obtained a bachelor's degree or higher.
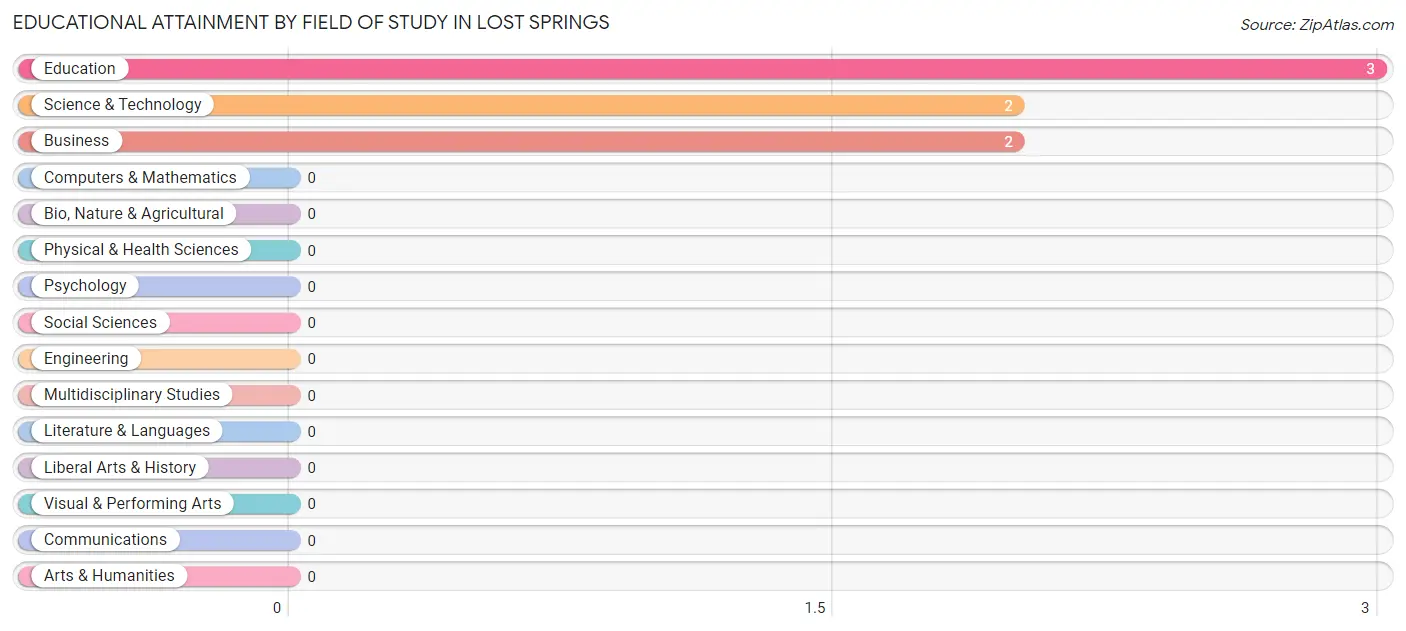
| Field of Study | # Graduates | % Graduates |
| Computers & Mathematics | 0 | 0.0% |
| Bio, Nature & Agricultural | 0 | 0.0% |
| Physical & Health Sciences | 0 | 0.0% |
| Psychology | 0 | 0.0% |
| Social Sciences | 0 | 0.0% |
| Engineering | 0 | 0.0% |
| Multidisciplinary Studies | 0 | 0.0% |
| Science & Technology | 2 | 28.6% |
| Business | 2 | 28.6% |
| Education | 3 | 42.9% |
| Literature & Languages | 0 | 0.0% |
| Liberal Arts & History | 0 | 0.0% |
| Visual & Performing Arts | 0 | 0.0% |
| Communications | 0 | 0.0% |
| Arts & Humanities | 0 | 0.0% |
| Total | 7 | 100.0% |
Transportation & Commute in Lost Springs
Vehicle Availability by Sex in Lost Springs
The most prevalent vehicle ownership categories in Lost Springs are males with 1 vehicle (15, accounting for 57.7%) and females with 1 vehicle (5, making up 136.4%).
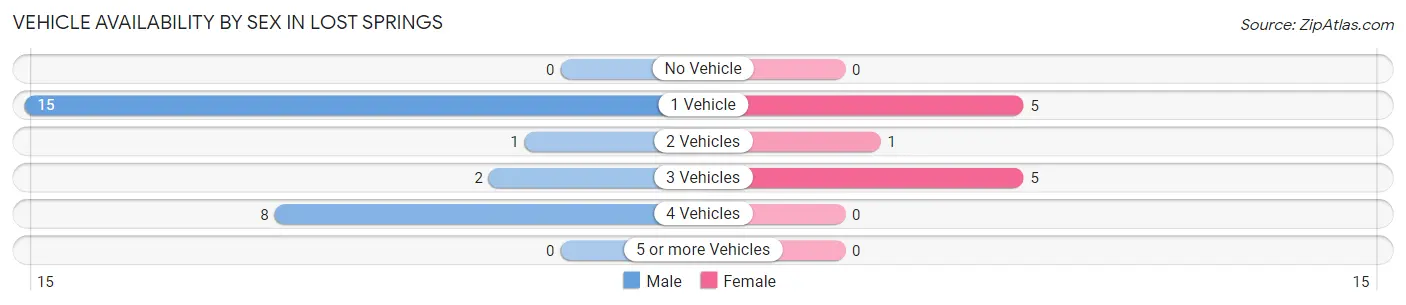
| Vehicles Available | Male | Female |
| No Vehicle | 0 (0.0%) | 0 (0.0%) |
| 1 Vehicle | 15 (57.7%) | 5 (45.5%) |
| 2 Vehicles | 1 (3.8%) | 1 (9.1%) |
| 3 Vehicles | 2 (7.7%) | 5 (45.5%) |
| 4 Vehicles | 8 (30.8%) | 0 (0.0%) |
| 5 or more Vehicles | 0 (0.0%) | 0 (0.0%) |
| Total | 26 (100.0%) | 11 (100.0%) |
Commute Time in Lost Springs
The most frequently occuring commute durations in Lost Springs are 15 to 19 minutes (20 commuters, 54.0%), 10 to 14 minutes (4 commuters, 10.8%), and less than 5 minutes (3 commuters, 8.1%).
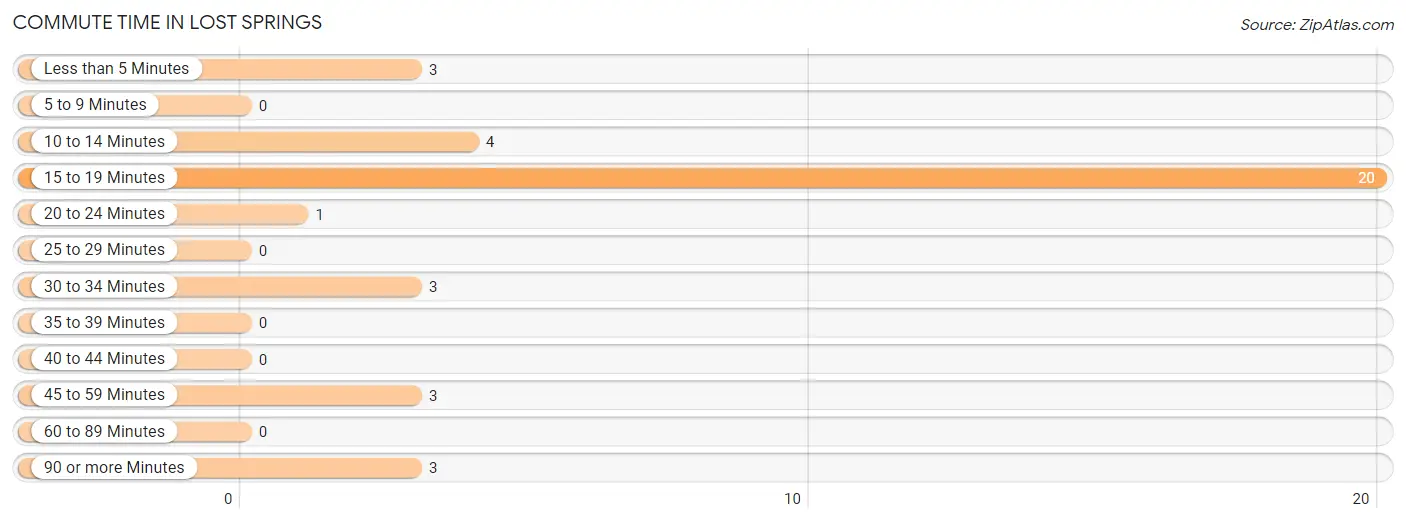
| Commute Time | # Commuters | % Commuters |
| Less than 5 Minutes | 3 | 8.1% |
| 5 to 9 Minutes | 0 | 0.0% |
| 10 to 14 Minutes | 4 | 10.8% |
| 15 to 19 Minutes | 20 | 54.0% |
| 20 to 24 Minutes | 1 | 2.7% |
| 25 to 29 Minutes | 0 | 0.0% |
| 30 to 34 Minutes | 3 | 8.1% |
| 35 to 39 Minutes | 0 | 0.0% |
| 40 to 44 Minutes | 0 | 0.0% |
| 45 to 59 Minutes | 3 | 8.1% |
| 60 to 89 Minutes | 0 | 0.0% |
| 90 or more Minutes | 3 | 8.1% |
Commute Time by Sex in Lost Springs
The most common commute times in Lost Springs are 15 to 19 minutes (20 commuters, 76.9%) for males and 10 to 14 minutes (4 commuters, 36.4%) for females.
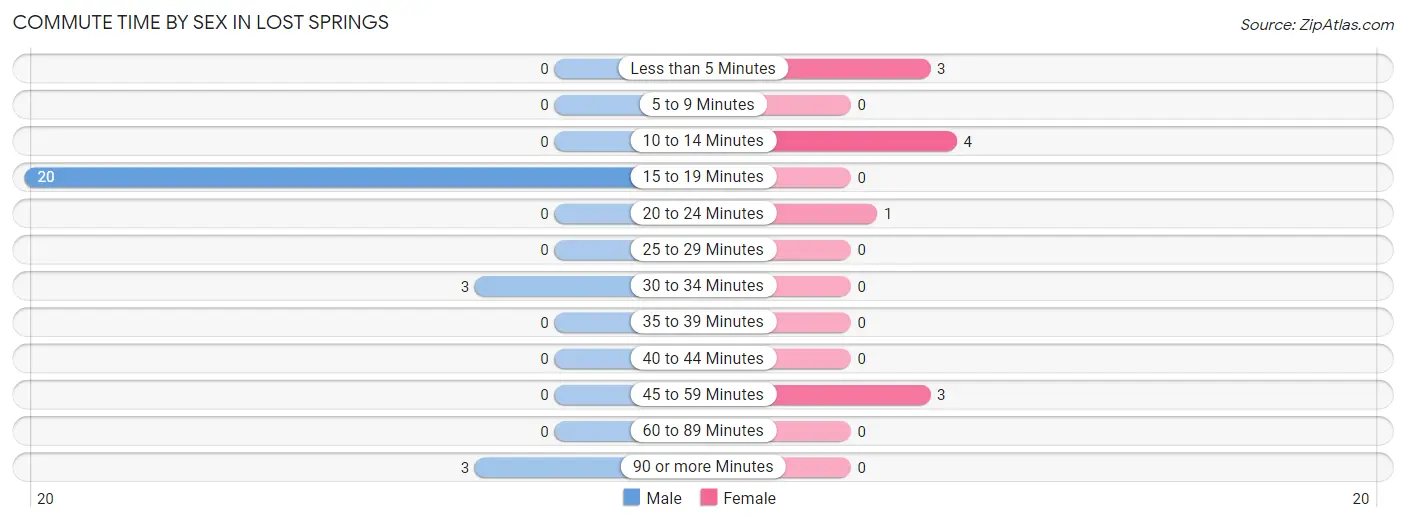
| Commute Time | Male | Female |
| Less than 5 Minutes | 0 (0.0%) | 3 (27.3%) |
| 5 to 9 Minutes | 0 (0.0%) | 0 (0.0%) |
| 10 to 14 Minutes | 0 (0.0%) | 4 (36.4%) |
| 15 to 19 Minutes | 20 (76.9%) | 0 (0.0%) |
| 20 to 24 Minutes | 0 (0.0%) | 1 (9.1%) |
| 25 to 29 Minutes | 0 (0.0%) | 0 (0.0%) |
| 30 to 34 Minutes | 3 (11.5%) | 0 (0.0%) |
| 35 to 39 Minutes | 0 (0.0%) | 0 (0.0%) |
| 40 to 44 Minutes | 0 (0.0%) | 0 (0.0%) |
| 45 to 59 Minutes | 0 (0.0%) | 3 (27.3%) |
| 60 to 89 Minutes | 0 (0.0%) | 0 (0.0%) |
| 90 or more Minutes | 3 (11.5%) | 0 (0.0%) |
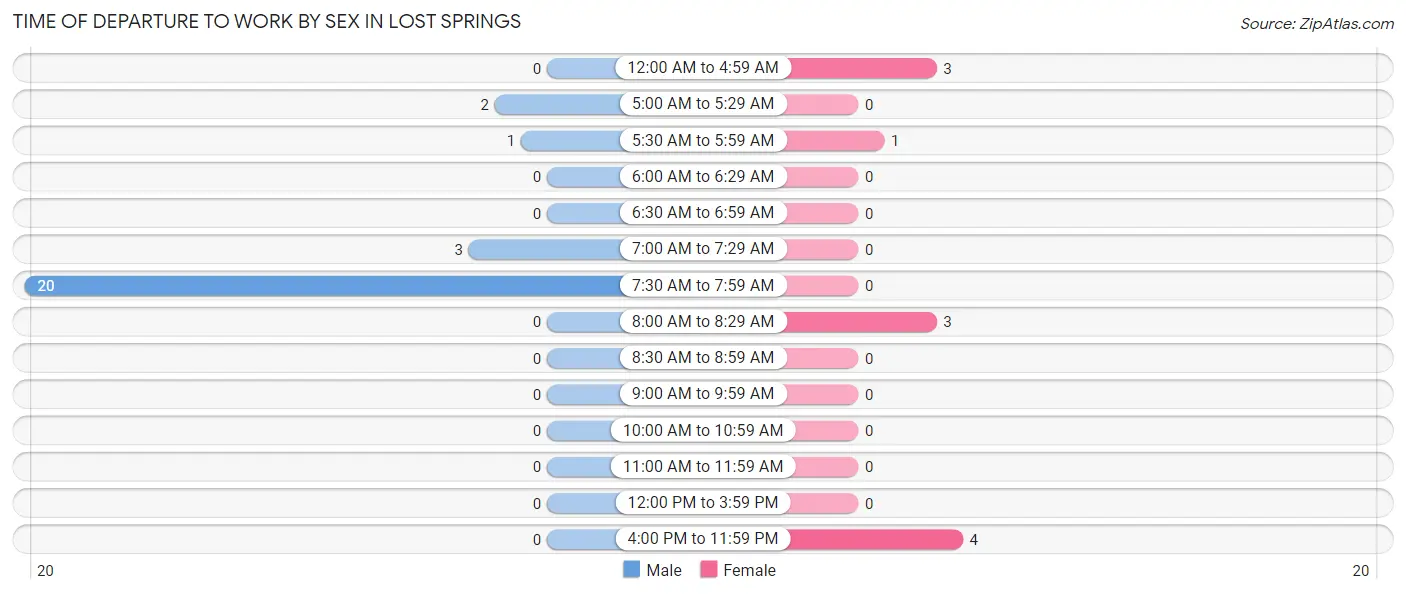
Time of Departure to Work by Sex in Lost Springs
The most frequent times of departure to work in Lost Springs are 7:30 AM to 7:59 AM (20, 76.9%) for males and 4:00 PM to 11:59 PM (4, 36.4%) for females.
| Time of Departure | Male | Female |
| 12:00 AM to 4:59 AM | 0 (0.0%) | 3 (27.3%) |
| 5:00 AM to 5:29 AM | 2 (7.7%) | 0 (0.0%) |
| 5:30 AM to 5:59 AM | 1 (3.8%) | 1 (9.1%) |
| 6:00 AM to 6:29 AM | 0 (0.0%) | 0 (0.0%) |
| 6:30 AM to 6:59 AM | 0 (0.0%) | 0 (0.0%) |
| 7:00 AM to 7:29 AM | 3 (11.5%) | 0 (0.0%) |
| 7:30 AM to 7:59 AM | 20 (76.9%) | 0 (0.0%) |
| 8:00 AM to 8:29 AM | 0 (0.0%) | 3 (27.3%) |
| 8:30 AM to 8:59 AM | 0 (0.0%) | 0 (0.0%) |
| 9:00 AM to 9:59 AM | 0 (0.0%) | 0 (0.0%) |
| 10:00 AM to 10:59 AM | 0 (0.0%) | 0 (0.0%) |
| 11:00 AM to 11:59 AM | 0 (0.0%) | 0 (0.0%) |
| 12:00 PM to 3:59 PM | 0 (0.0%) | 0 (0.0%) |
| 4:00 PM to 11:59 PM | 0 (0.0%) | 4 (36.4%) |
| Total | 26 (100.0%) | 11 (100.0%) |
Housing Occupancy in Lost Springs
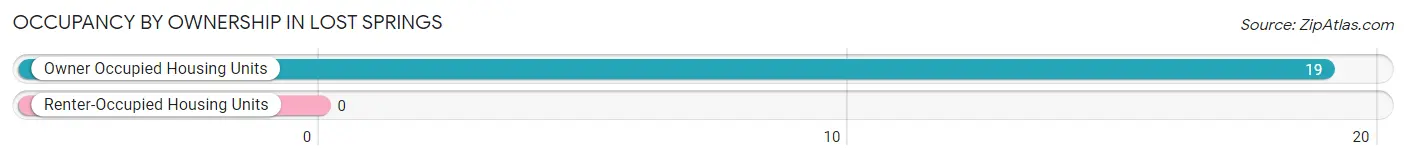
Occupancy by Ownership in Lost Springs
Of the total 19 dwellings in Lost Springs, owner-occupied units account for 19 (100.0%), while renter-occupied units make up 0 (0.0%).
| Occupancy | # Housing Units | % Housing Units |
| Owner Occupied Housing Units | 19 | 100.0% |
| Renter-Occupied Housing Units | 0 | 0.0% |
| Total Occupied Housing Units | 19 | 100.0% |
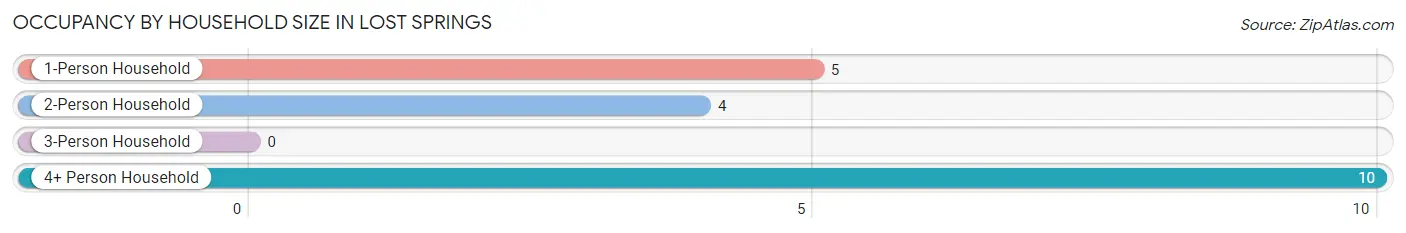
Occupancy by Household Size in Lost Springs
| Household Size | # Housing Units | % Housing Units |
| 1-Person Household | 5 | 26.3% |
| 2-Person Household | 4 | 21.0% |
| 3-Person Household | 0 | 0.0% |
| 4+ Person Household | 10 | 52.6% |
| Total Housing Units | 19 | 100.0% |
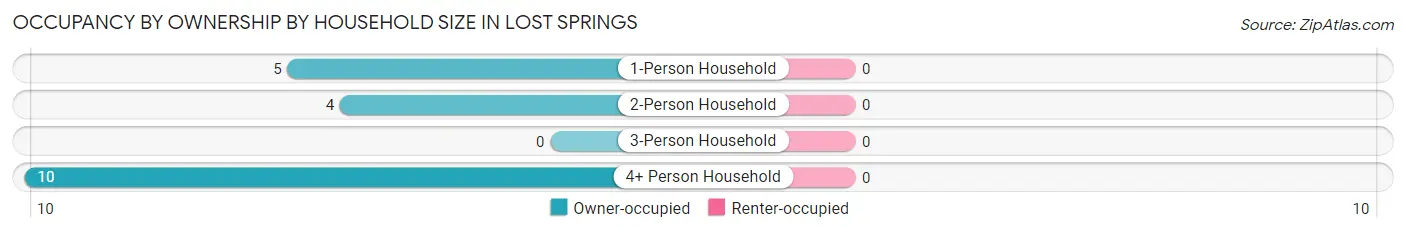
Occupancy by Ownership by Household Size in Lost Springs
| Household Size | Owner-occupied | Renter-occupied |
| 1-Person Household | 5 (100.0%) | 0 (0.0%) |
| 2-Person Household | 4 (100.0%) | 0 (0.0%) |
| 3-Person Household | 0 (0.0%) | 0 (0.0%) |
| 4+ Person Household | 10 (100.0%) | 0 (0.0%) |
| Total Housing Units | 19 (100.0%) | 0 (0.0%) |
Occupancy by Educational Attainment in Lost Springs
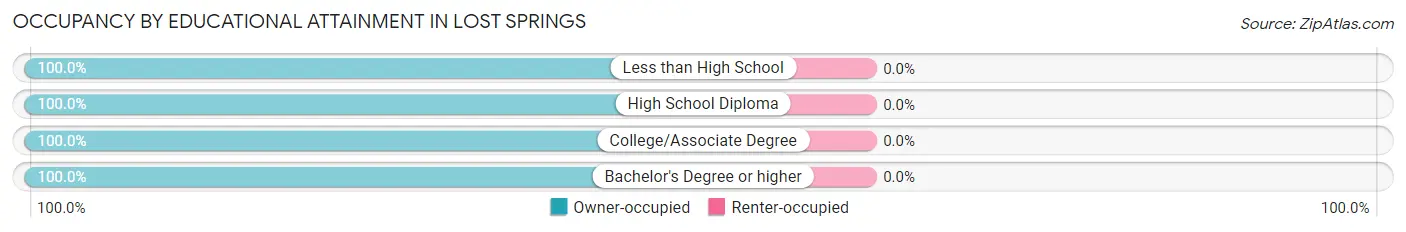
| Household Size | Owner-occupied | Renter-occupied |
| Less than High School | 3 (100.0%) | 0 (0.0%) |
| High School Diploma | 12 (100.0%) | 0 (0.0%) |
| College/Associate Degree | 1 (100.0%) | 0 (0.0%) |
| Bachelor's Degree or higher | 3 (100.0%) | 0 (0.0%) |
Occupancy by Age of Householder in Lost Springs
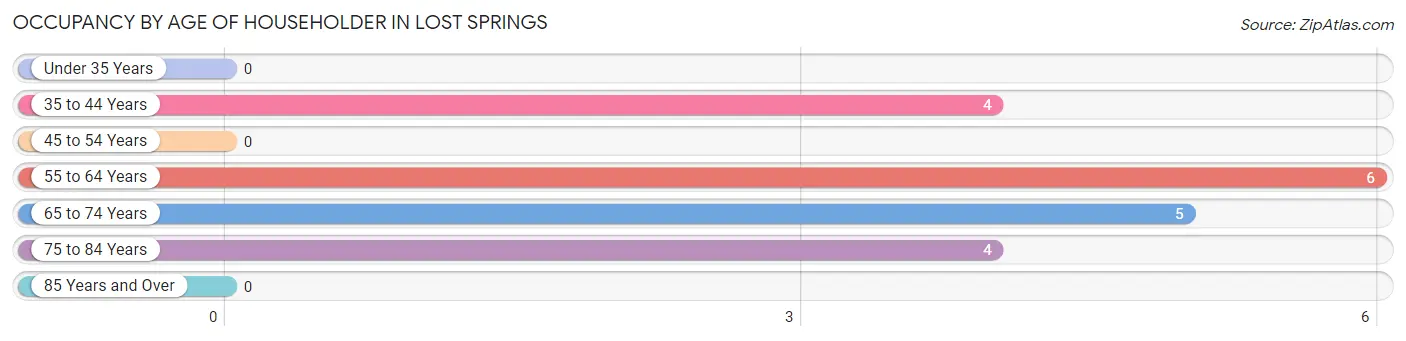
| Age Bracket | # Households | % Households |
| Under 35 Years | 0 | 0.0% |
| 35 to 44 Years | 4 | 21.0% |
| 45 to 54 Years | 0 | 0.0% |
| 55 to 64 Years | 6 | 31.6% |
| 65 to 74 Years | 5 | 26.3% |
| 75 to 84 Years | 4 | 21.0% |
| 85 Years and Over | 0 | 0.0% |
| Total | 19 | 100.0% |
Housing Finances in Lost Springs
Median Income by Occupancy in Lost Springs
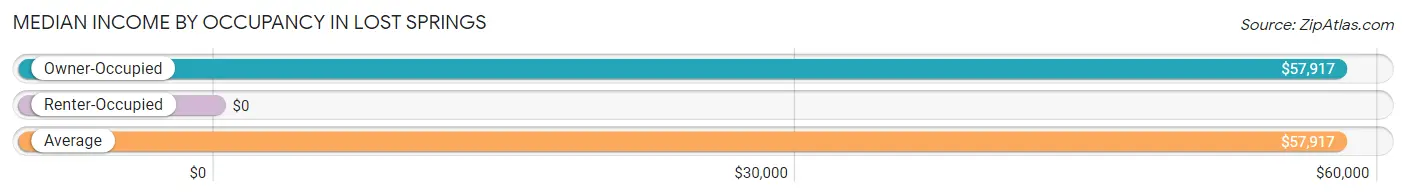
| Occupancy Type | # Households | Median Income |
| Owner-Occupied | 19 (100.0%) | $57,917 |
| Renter-Occupied | 0 (0.0%) | $0 |
| Average | 19 (100.0%) | $57,917 |
Occupancy by Householder Income Bracket in Lost Springs
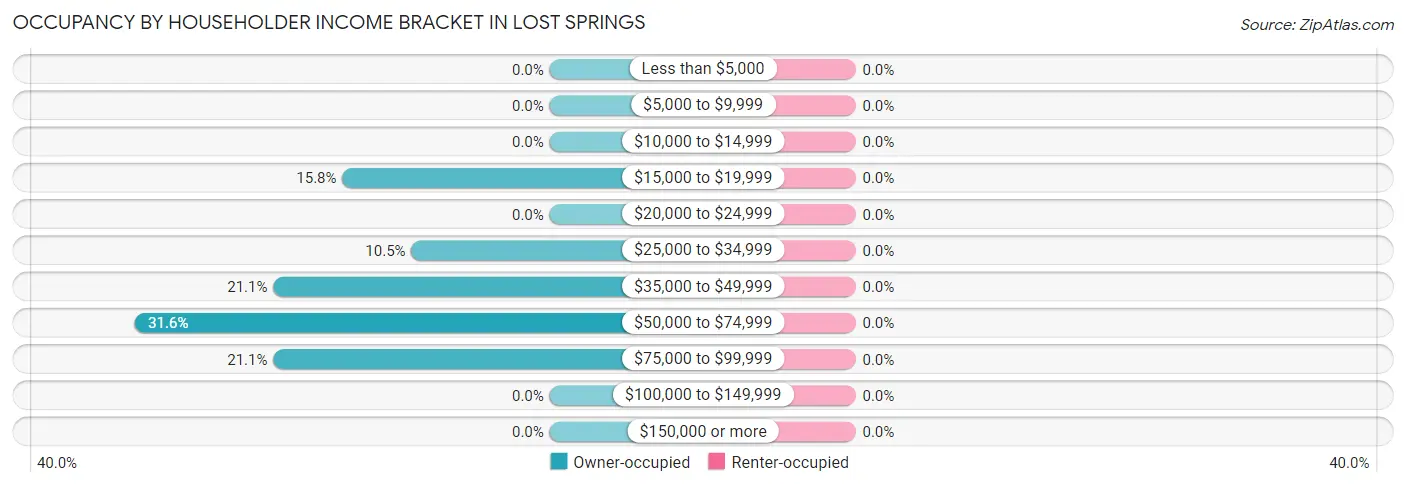
| Income Bracket | Owner-occupied | Renter-occupied |
| Less than $5,000 | 0 (0.0%) | 0 (0.0%) |
| $5,000 to $9,999 | 0 (0.0%) | 0 (0.0%) |
| $10,000 to $14,999 | 0 (0.0%) | 0 (0.0%) |
| $15,000 to $19,999 | 3 (15.8%) | 0 (0.0%) |
| $20,000 to $24,999 | 0 (0.0%) | 0 (0.0%) |
| $25,000 to $34,999 | 2 (10.5%) | 0 (0.0%) |
| $35,000 to $49,999 | 4 (21.0%) | 0 (0.0%) |
| $50,000 to $74,999 | 6 (31.6%) | 0 (0.0%) |
| $75,000 to $99,999 | 4 (21.0%) | 0 (0.0%) |
| $100,000 to $149,999 | 0 (0.0%) | 0 (0.0%) |
| $150,000 or more | 0 (0.0%) | 0 (0.0%) |
| Total | 19 (100.0%) | 0 (0.0%) |
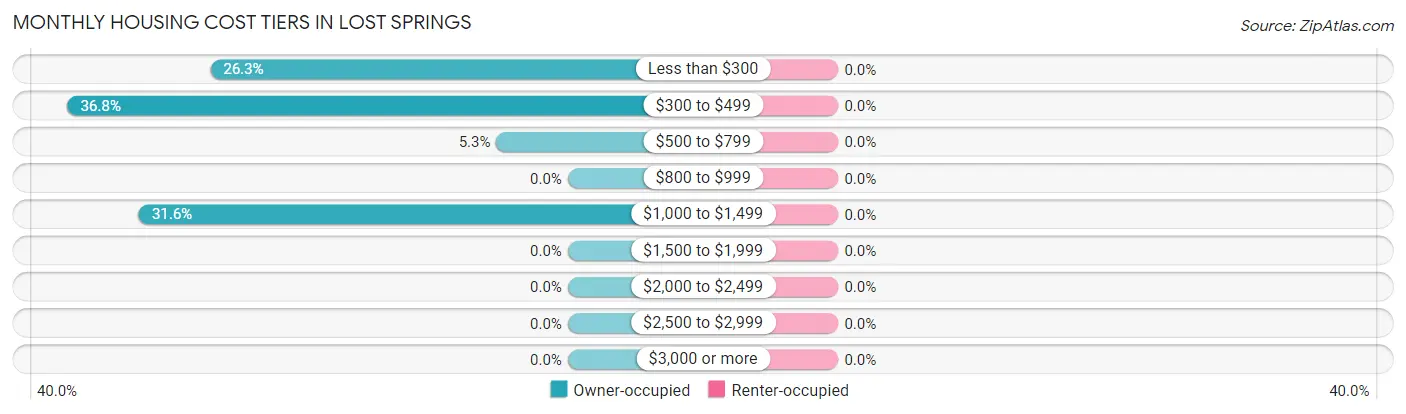
Monthly Housing Cost Tiers in Lost Springs
| Monthly Cost | Owner-occupied | Renter-occupied |
| Less than $300 | 5 (26.3%) | 0 (0.0%) |
| $300 to $499 | 7 (36.8%) | 0 (0.0%) |
| $500 to $799 | 1 (5.3%) | 0 (0.0%) |
| $800 to $999 | 0 (0.0%) | 0 (0.0%) |
| $1,000 to $1,499 | 6 (31.6%) | 0 (0.0%) |
| $1,500 to $1,999 | 0 (0.0%) | 0 (0.0%) |
| $2,000 to $2,499 | 0 (0.0%) | 0 (0.0%) |
| $2,500 to $2,999 | 0 (0.0%) | 0 (0.0%) |
| $3,000 or more | 0 (0.0%) | 0 (0.0%) |
| Total | 19 (100.0%) | 0 (0.0%) |
Physical Housing Characteristics in Lost Springs
Housing Structures in Lost Springs
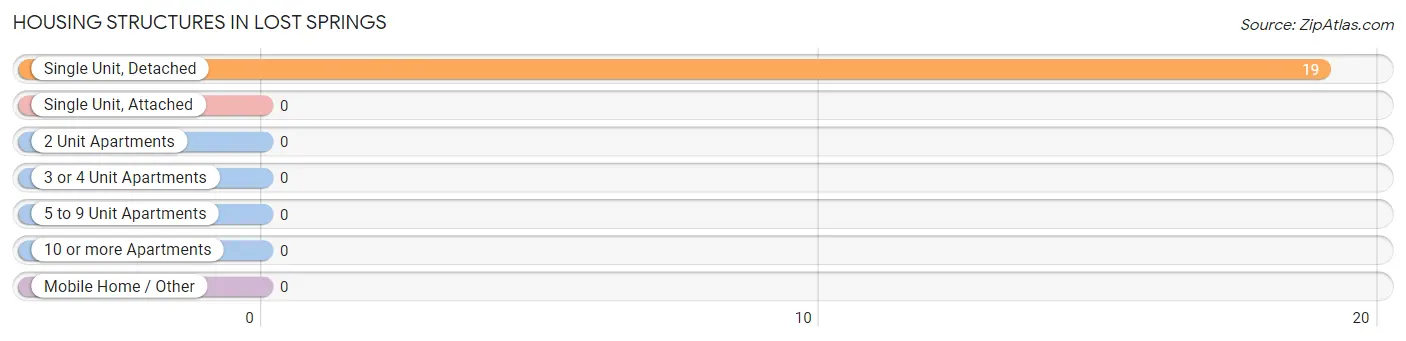
| Structure Type | # Housing Units | % Housing Units |
| Single Unit, Detached | 19 | 100.0% |
| Single Unit, Attached | 0 | 0.0% |
| 2 Unit Apartments | 0 | 0.0% |
| 3 or 4 Unit Apartments | 0 | 0.0% |
| 5 to 9 Unit Apartments | 0 | 0.0% |
| 10 or more Apartments | 0 | 0.0% |
| Mobile Home / Other | 0 | 0.0% |
| Total | 19 | 100.0% |
Housing Structures by Occupancy in Lost Springs
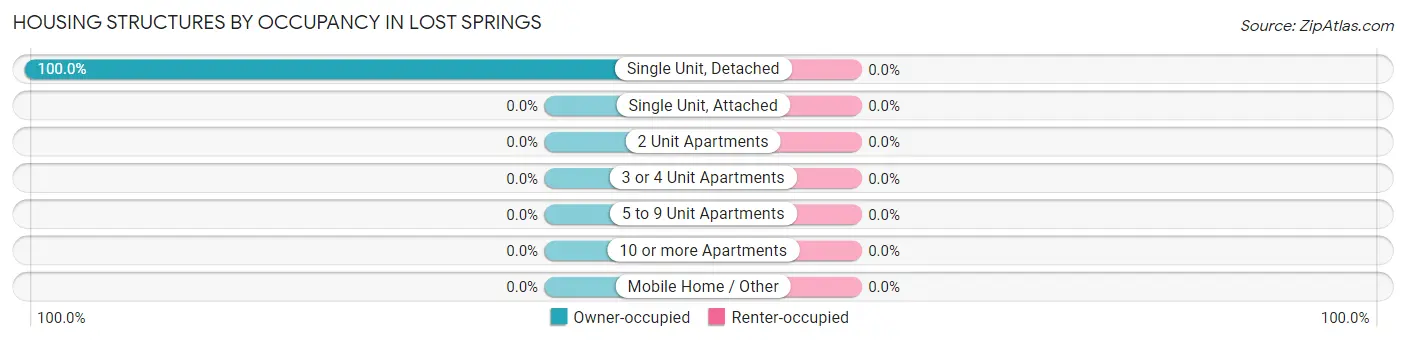
| Structure Type | Owner-occupied | Renter-occupied |
| Single Unit, Detached | 19 (100.0%) | 0 (0.0%) |
| Single Unit, Attached | 0 (0.0%) | 0 (0.0%) |
| 2 Unit Apartments | 0 (0.0%) | 0 (0.0%) |
| 3 or 4 Unit Apartments | 0 (0.0%) | 0 (0.0%) |
| 5 to 9 Unit Apartments | 0 (0.0%) | 0 (0.0%) |
| 10 or more Apartments | 0 (0.0%) | 0 (0.0%) |
| Mobile Home / Other | 0 (0.0%) | 0 (0.0%) |
| Total | 19 (100.0%) | 0 (0.0%) |
Housing Structures by Number of Rooms in Lost Springs
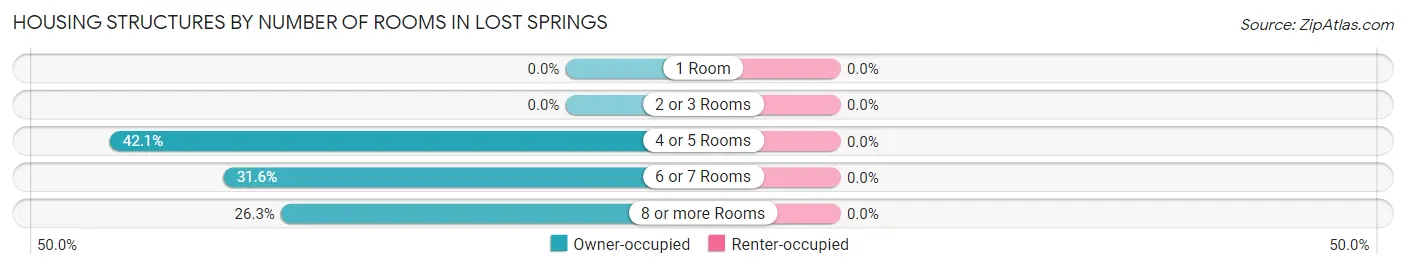
| Number of Rooms | Owner-occupied | Renter-occupied |
| 1 Room | 0 (0.0%) | 0 (0.0%) |
| 2 or 3 Rooms | 0 (0.0%) | 0 (0.0%) |
| 4 or 5 Rooms | 8 (42.1%) | 0 (0.0%) |
| 6 or 7 Rooms | 6 (31.6%) | 0 (0.0%) |
| 8 or more Rooms | 5 (26.3%) | 0 (0.0%) |
| Total | 19 (100.0%) | 0 (0.0%) |
Housing Structure by Heating Type in Lost Springs
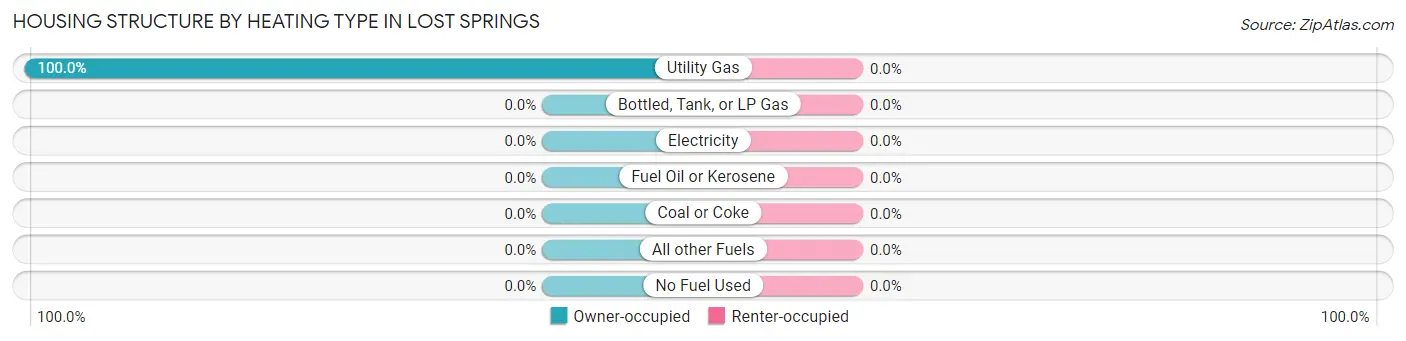
| Heating Type | Owner-occupied | Renter-occupied |
| Utility Gas | 19 (100.0%) | 0 (0.0%) |
| Bottled, Tank, or LP Gas | 0 (0.0%) | 0 (0.0%) |
| Electricity | 0 (0.0%) | 0 (0.0%) |
| Fuel Oil or Kerosene | 0 (0.0%) | 0 (0.0%) |
| Coal or Coke | 0 (0.0%) | 0 (0.0%) |
| All other Fuels | 0 (0.0%) | 0 (0.0%) |
| No Fuel Used | 0 (0.0%) | 0 (0.0%) |
| Total | 19 (100.0%) | 0 (0.0%) |
Household Vehicle Usage in Lost Springs
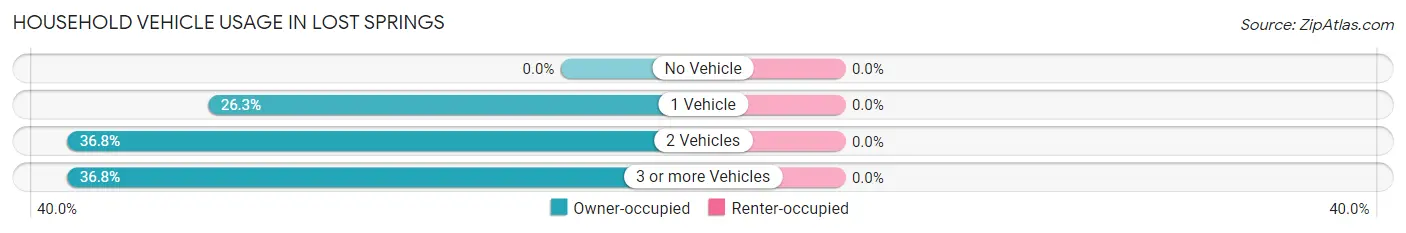
| Vehicles per Household | Owner-occupied | Renter-occupied |
| No Vehicle | 0 (0.0%) | 0 (0.0%) |
| 1 Vehicle | 5 (26.3%) | 0 (0.0%) |
| 2 Vehicles | 7 (36.8%) | 0 (0.0%) |
| 3 or more Vehicles | 7 (36.8%) | 0 (0.0%) |
| Total | 19 (100.0%) | 0 (0.0%) |
Real Estate & Mortgages in Lost Springs
Real Estate and Mortgage Overview in Lost Springs
| Characteristic | Without Mortgage | With Mortgage |
| Housing Units | 13 | 6 |
| Median Property Value | - | - |
| Median Household Income | $46,250 | $0 |
| Monthly Housing Costs | $363 | $0 |
| Real Estate Taxes | $450 | $0 |
Property Value by Mortgage Status in Lost Springs
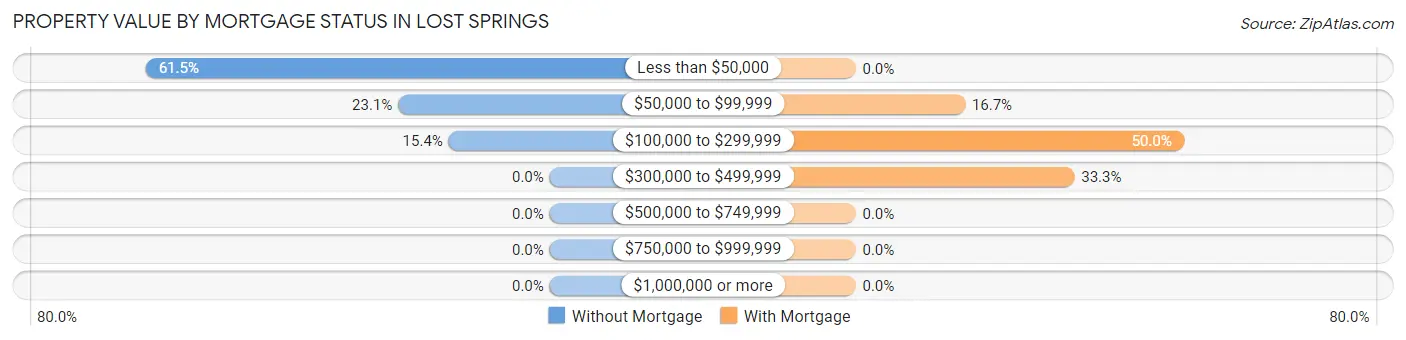
| Property Value | Without Mortgage | With Mortgage |
| Less than $50,000 | 8 (61.5%) | 0 (0.0%) |
| $50,000 to $99,999 | 3 (23.1%) | 1 (16.7%) |
| $100,000 to $299,999 | 2 (15.4%) | 3 (50.0%) |
| $300,000 to $499,999 | 0 (0.0%) | 2 (33.3%) |
| $500,000 to $749,999 | 0 (0.0%) | 0 (0.0%) |
| $750,000 to $999,999 | 0 (0.0%) | 0 (0.0%) |
| $1,000,000 or more | 0 (0.0%) | 0 (0.0%) |
| Total | 13 (100.0%) | 6 (100.0%) |
Household Income by Mortgage Status in Lost Springs
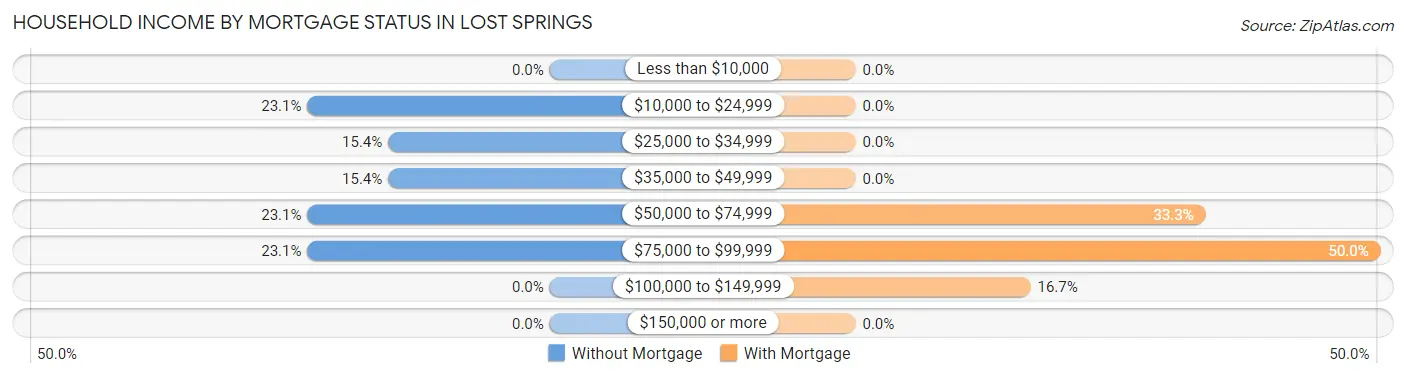
| Household Income | Without Mortgage | With Mortgage |
| Less than $10,000 | 0 (0.0%) | 0 (0.0%) |
| $10,000 to $24,999 | 3 (23.1%) | 0 (0.0%) |
| $25,000 to $34,999 | 2 (15.4%) | 0 (0.0%) |
| $35,000 to $49,999 | 2 (15.4%) | 0 (0.0%) |
| $50,000 to $74,999 | 3 (23.1%) | 2 (33.3%) |
| $75,000 to $99,999 | 3 (23.1%) | 3 (50.0%) |
| $100,000 to $149,999 | 0 (0.0%) | 1 (16.7%) |
| $150,000 or more | 0 (0.0%) | 0 (0.0%) |
| Total | 13 (100.0%) | 6 (100.0%) |
Property Value to Household Income Ratio in Lost Springs
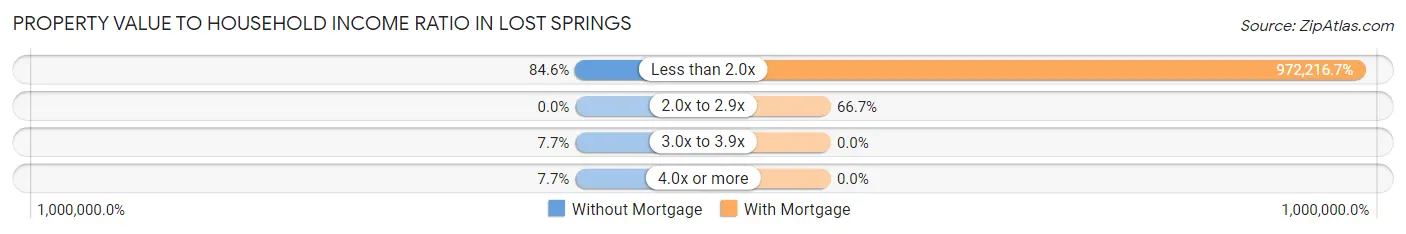
| Value-to-Income Ratio | Without Mortgage | With Mortgage |
| Less than 2.0x | 11 (84.6%) | 58,333 (972,216.7%) |
| 2.0x to 2.9x | 0 (0.0%) | 4 (66.7%) |
| 3.0x to 3.9x | 1 (7.7%) | 0 (0.0%) |
| 4.0x or more | 1 (7.7%) | 0 (0.0%) |
| Total | 13 (100.0%) | 6 (100.0%) |
Real Estate Taxes by Mortgage Status in Lost Springs
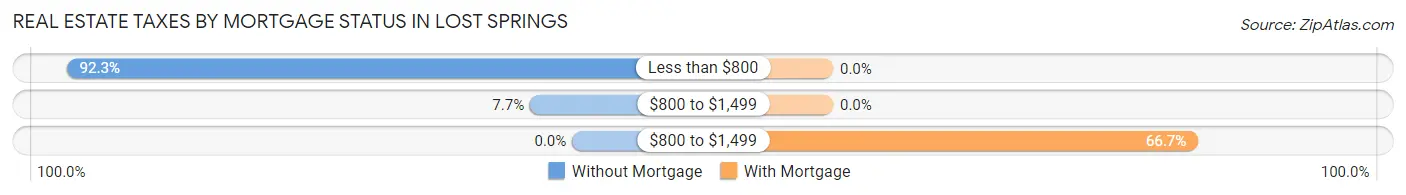
| Property Taxes | Without Mortgage | With Mortgage |
| Less than $800 | 12 (92.3%) | 0 (0.0%) |
| $800 to $1,499 | 1 (7.7%) | 0 (0.0%) |
| $800 to $1,499 | 0 (0.0%) | 4 (66.7%) |
| Total | 13 (100.0%) | 6 (100.0%) |
Health & Disability in Lost Springs
Health Insurance Coverage by Age in Lost Springs
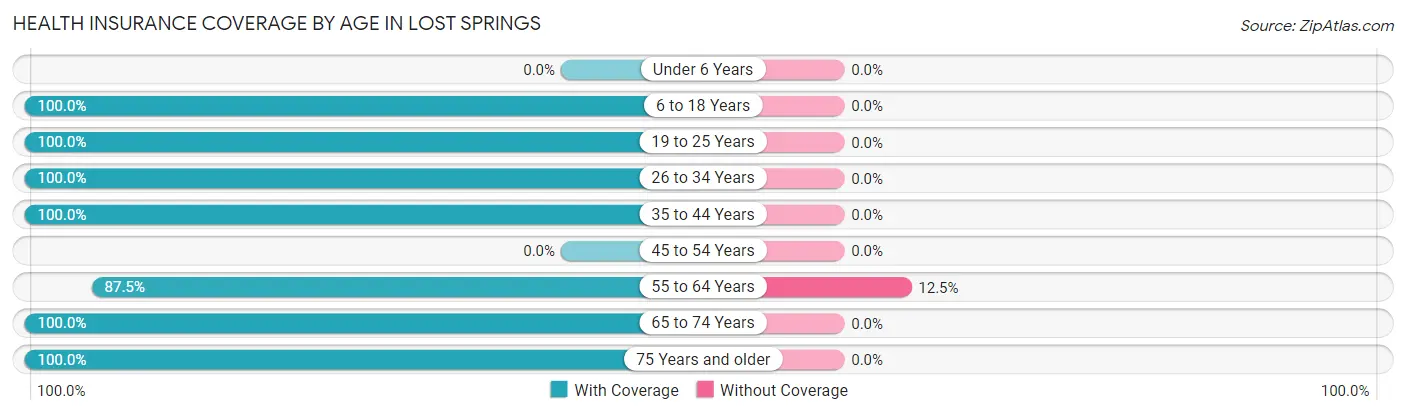
| Age Bracket | With Coverage | Without Coverage |
| Under 6 Years | 0 (0.0%) | 0 (0.0%) |
| 6 to 18 Years | 20 (100.0%) | 0 (0.0%) |
| 19 to 25 Years | 10 (100.0%) | 0 (0.0%) |
| 26 to 34 Years | 15 (100.0%) | 0 (0.0%) |
| 35 to 44 Years | 14 (100.0%) | 0 (0.0%) |
| 45 to 54 Years | 0 (0.0%) | 0 (0.0%) |
| 55 to 64 Years | 7 (87.5%) | 1 (12.5%) |
| 65 to 74 Years | 5 (100.0%) | 0 (0.0%) |
| 75 Years and older | 6 (100.0%) | 0 (0.0%) |
| Total | 77 (98.7%) | 1 (1.3%) |
Health Insurance Coverage by Citizenship Status in Lost Springs
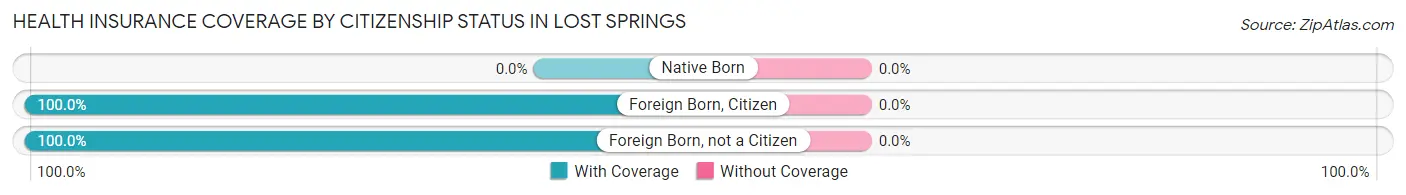
| Citizenship Status | With Coverage | Without Coverage |
| Native Born | 0 (0.0%) | 0 (0.0%) |
| Foreign Born, Citizen | 20 (100.0%) | 0 (0.0%) |
| Foreign Born, not a Citizen | 10 (100.0%) | 0 (0.0%) |
Health Insurance Coverage by Household Income in Lost Springs
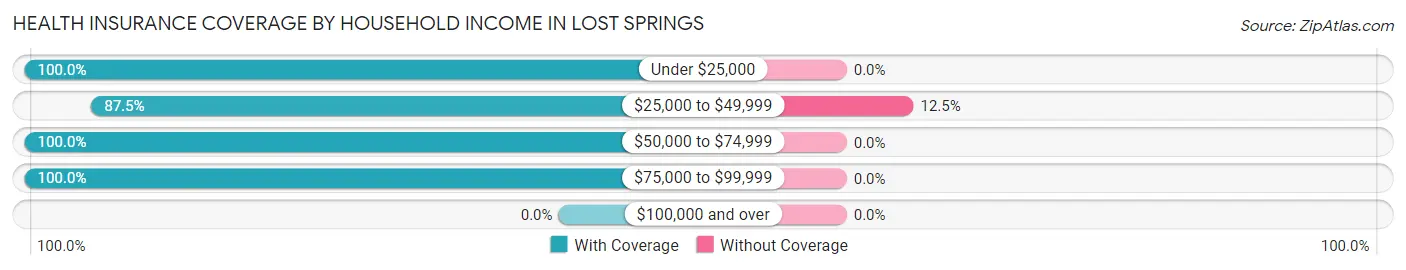
| Household Income | With Coverage | Without Coverage |
| Under $25,000 | 18 (100.0%) | 0 (0.0%) |
| $25,000 to $49,999 | 7 (87.5%) | 1 (12.5%) |
| $50,000 to $74,999 | 29 (100.0%) | 0 (0.0%) |
| $75,000 to $99,999 | 23 (100.0%) | 0 (0.0%) |
| $100,000 and over | 0 (0.0%) | 0 (0.0%) |
Public vs Private Health Insurance Coverage by Age in Lost Springs
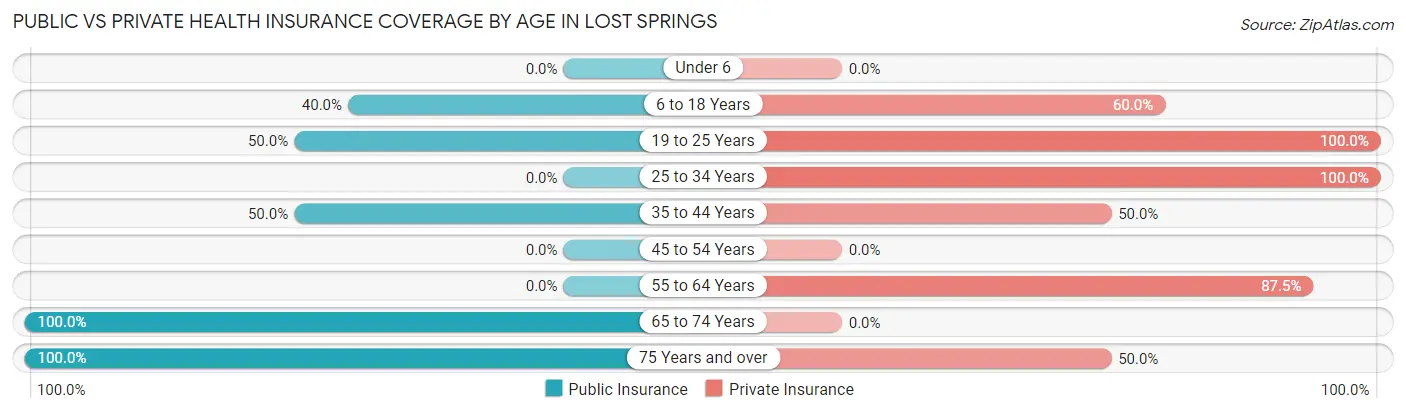
| Age Bracket | Public Insurance | Private Insurance |
| Under 6 | 0 (0.0%) | 0 (0.0%) |
| 6 to 18 Years | 8 (40.0%) | 12 (60.0%) |
| 19 to 25 Years | 5 (50.0%) | 10 (100.0%) |
| 25 to 34 Years | 0 (0.0%) | 15 (100.0%) |
| 35 to 44 Years | 7 (50.0%) | 7 (50.0%) |
| 45 to 54 Years | 0 (0.0%) | 0 (0.0%) |
| 55 to 64 Years | 0 (0.0%) | 7 (87.5%) |
| 65 to 74 Years | 5 (100.0%) | 0 (0.0%) |
| 75 Years and over | 6 (100.0%) | 3 (50.0%) |
| Total | 31 (39.7%) | 54 (69.2%) |
Disability Status by Sex by Age in Lost Springs
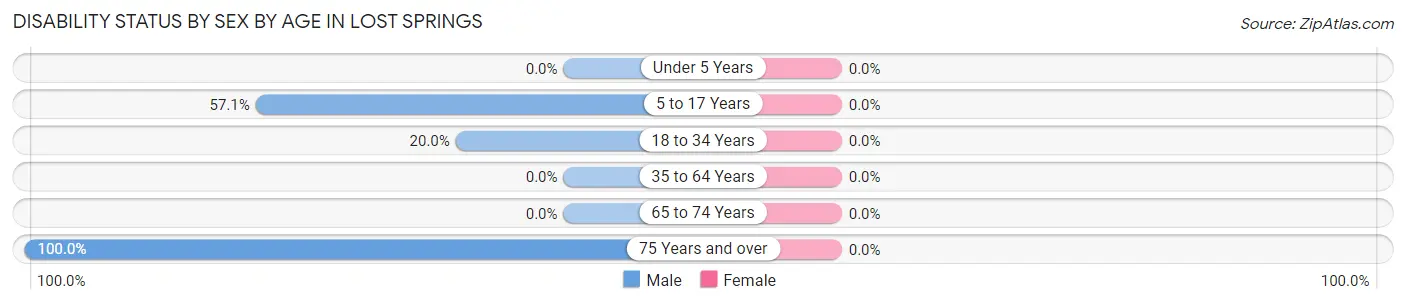
| Age Bracket | Male | Female |
| Under 5 Years | 0 (0.0%) | 0 (0.0%) |
| 5 to 17 Years | 4 (57.1%) | 0 (0.0%) |
| 18 to 34 Years | 5 (20.0%) | 0 (0.0%) |
| 35 to 64 Years | 0 (0.0%) | 0 (0.0%) |
| 65 to 74 Years | 0 (0.0%) | 0 (0.0%) |
| 75 Years and over | 2 (100.0%) | 0 (0.0%) |
Disability Class by Sex by Age in Lost Springs
Disability Class: Hearing Difficulty
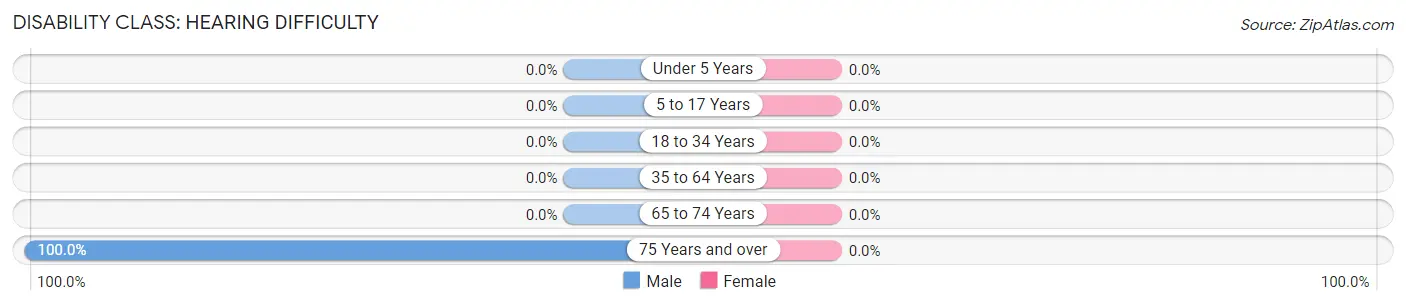
| Age Bracket | Male | Female |
| Under 5 Years | 0 (0.0%) | 0 (0.0%) |
| 5 to 17 Years | 0 (0.0%) | 0 (0.0%) |
| 18 to 34 Years | 0 (0.0%) | 0 (0.0%) |
| 35 to 64 Years | 0 (0.0%) | 0 (0.0%) |
| 65 to 74 Years | 0 (0.0%) | 0 (0.0%) |
| 75 Years and over | 2 (100.0%) | 0 (0.0%) |
Disability Class: Vision Difficulty
| Age Bracket | Male | Female |
| Under 5 Years | 0 (0.0%) | 0 (0.0%) |
| 5 to 17 Years | 0 (0.0%) | 0 (0.0%) |
| 18 to 34 Years | 0 (0.0%) | 0 (0.0%) |
| 35 to 64 Years | 0 (0.0%) | 0 (0.0%) |
| 65 to 74 Years | 0 (0.0%) | 0 (0.0%) |
| 75 Years and over | 0 (0.0%) | 0 (0.0%) |
Disability Class: Cognitive Difficulty
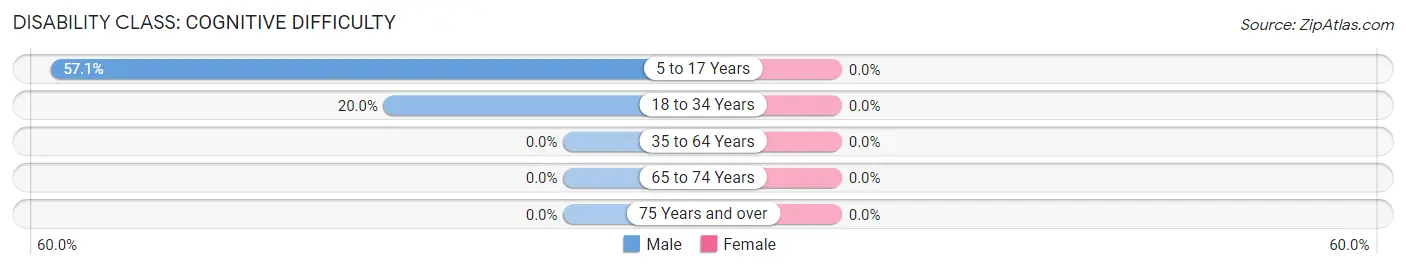
| Age Bracket | Male | Female |
| 5 to 17 Years | 4 (57.1%) | 0 (0.0%) |
| 18 to 34 Years | 5 (20.0%) | 0 (0.0%) |
| 35 to 64 Years | 0 (0.0%) | 0 (0.0%) |
| 65 to 74 Years | 0 (0.0%) | 0 (0.0%) |
| 75 Years and over | 0 (0.0%) | 0 (0.0%) |
Disability Class: Ambulatory Difficulty
| Age Bracket | Male | Female |
| 5 to 17 Years | 0 (0.0%) | 0 (0.0%) |
| 18 to 34 Years | 0 (0.0%) | 0 (0.0%) |
| 35 to 64 Years | 0 (0.0%) | 0 (0.0%) |
| 65 to 74 Years | 0 (0.0%) | 0 (0.0%) |
| 75 Years and over | 0 (0.0%) | 0 (0.0%) |
Disability Class: Self-Care Difficulty
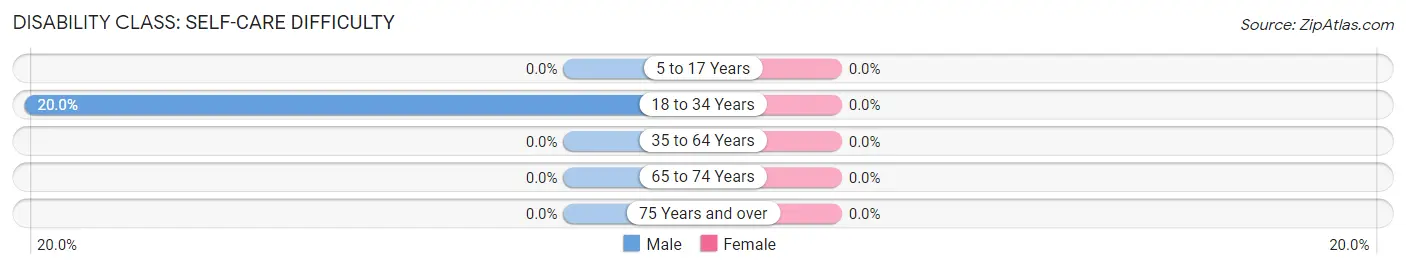
| Age Bracket | Male | Female |
| 5 to 17 Years | 0 (0.0%) | 0 (0.0%) |
| 18 to 34 Years | 5 (20.0%) | 0 (0.0%) |
| 35 to 64 Years | 0 (0.0%) | 0 (0.0%) |
| 65 to 74 Years | 0 (0.0%) | 0 (0.0%) |
| 75 Years and over | 0 (0.0%) | 0 (0.0%) |
Technology Access in Lost Springs
Computing Device Access in Lost Springs
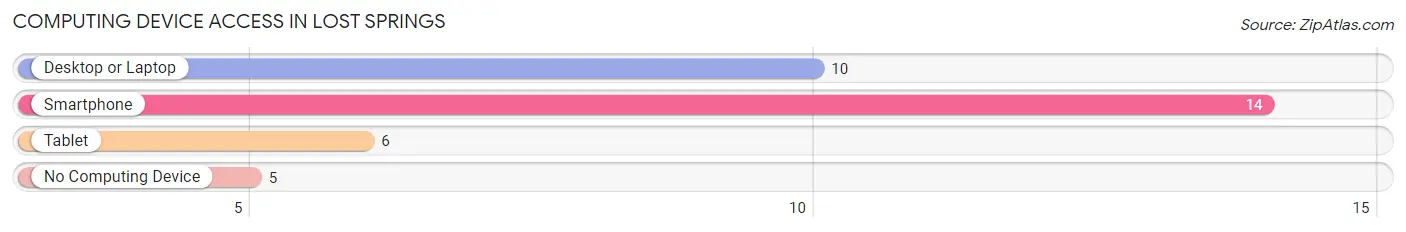
| Device Type | # Households | % Households |
| Desktop or Laptop | 10 | 52.6% |
| Smartphone | 14 | 73.7% |
| Tablet | 6 | 31.6% |
| No Computing Device | 5 | 26.3% |
| Total | 19 | 100.0% |
Internet Access in Lost Springs
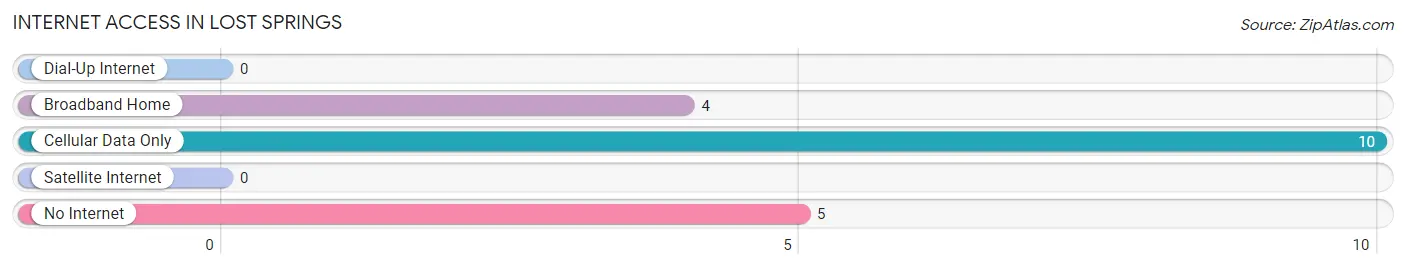
| Internet Type | # Households | % Households |
| Dial-Up Internet | 0 | 0.0% |
| Broadband Home | 4 | 21.0% |
| Cellular Data Only | 10 | 52.6% |
| Satellite Internet | 0 | 0.0% |
| No Internet | 5 | 26.3% |
| Total | 19 | 100.0% |
Lost Springs Summary
History
Lost Springs, Kansas is a small town located in Marion County, Kansas. It was founded in 1871 by a group of settlers from Ohio. The town was originally called “Lost Springs Station” because of the nearby springs that were believed to have been lost. The town was officially incorporated in 1887.
The town was originally a farming community, but it soon became a stop on the Atchison, Topeka and Santa Fe Railway. This allowed the town to become a center for trade and commerce. The town also had a post office, a school, a bank, a hotel, and several stores.
In the early 1900s, the town experienced a period of growth and prosperity. The population grew to over 500 people and the town had a variety of businesses, including a newspaper, a flour mill, a creamery, and a lumber yard.
However, the Great Depression hit the town hard and the population began to decline. By the 1950s, the population had dropped to just over 200 people. The town continued to decline until the 1980s when it began to experience a resurgence.
Today, Lost Springs is a small town with a population of just over 200 people. It is a quiet, rural community with a strong sense of community and pride.
Geography
Lost Springs is located in Marion County, Kansas. It is situated in the Flint Hills region of the state, which is known for its rolling hills and prairies. The town is located about 25 miles south of the city of Marion and about 50 miles north of Wichita.
The town is situated on the banks of the Cottonwood River, which flows through the town. The town is also located near several other small towns, including Florence, Durham, and Peabody.
The town has a total area of 0.6 square miles, all of which is land. The town has a humid continental climate, with hot summers and cold winters.
Economy
The economy of Lost Springs is largely based on agriculture. The town is home to several farms, which produce a variety of crops, including wheat, corn, soybeans, and hay. The town also has several small businesses, including a grocery store, a hardware store, and a restaurant.
The town is also home to a few manufacturing companies, including a furniture factory and a metal fabrication plant. The town also has a few small service businesses, such as a barber shop and a beauty salon.
Demographics
As of the 2010 census, the population of Lost Springs was 214 people. The racial makeup of the town was 97.2% White, 0.5% African American, 0.5% Native American, 0.5% Asian, and 1.4% from other races.
The median household income in the town was $37,500 and the median family income was $41,250. The per capita income in the town was $17,857. About 11.3% of the population was below the poverty line.
Conclusion
Lost Springs, Kansas is a small town located in Marion County, Kansas. It was founded in 1871 and has a population of just over 200 people. The town is largely based on agriculture and has a few small businesses. The town has a humid continental climate and a median household income of $37,500.
Common Questions
What is Per Capita Income in Lost Springs?
Per Capita income in Lost Springs is $19,262.
What is the Median Family Income in Lost Springs?
Median Family Income in Lost Springs is $65,000.
What is the Median Household income in Lost Springs?
Median Household Income in Lost Springs is $57,917.
What is Inequality or Gini Index in Lost Springs?
Inequality or Gini Index in Lost Springs is 0.25.
What is the Total Population of Lost Springs?
Total Population of Lost Springs is 78.
What is the Total Male Population of Lost Springs?
Total Male Population of Lost Springs is 40.
What is the Total Female Population of Lost Springs?
Total Female Population of Lost Springs is 38.
What is the Ratio of Males per 100 Females in Lost Springs?
There are 105.26 Males per 100 Females in Lost Springs.
What is the Ratio of Females per 100 Males in Lost Springs?
There are 95.00 Females per 100 Males in Lost Springs.
What is the Median Population Age in Lost Springs?
Median Population Age in Lost Springs is 34.6 Years.
What is the Average Family Size in Lost Springs
Average Family Size in Lost Springs is 5.2 People.
What is the Average Household Size in Lost Springs
Average Household Size in Lost Springs is 4.1 People.
How Large is the Labor Force in Lost Springs?
There are 37 People in the Labor Forcein in Lost Springs.
What is the Percentage of People in the Labor Force in Lost Springs?
61.7% of People are in the Labor Force in Lost Springs.