Williamsburg, KS Map & Demographics
Williamsburg Map
Williamsburg Overview
$19,545
PER CAPITA INCOME
$52,000
AVG FAMILY INCOME
$50,000
AVG HOUSEHOLD INCOME
0.30
INEQUALITY / GINI INDEX
429
TOTAL POPULATION
192
MALE POPULATION
237
FEMALE POPULATION
81.01
MALES / 100 FEMALES
123.44
FEMALES / 100 MALES
34.6
MEDIAN AGE
3.4
AVG FAMILY SIZE
3.2
AVG HOUSEHOLD SIZE
180
LABOR FORCE [ PEOPLE ]
59.6%
PERCENT IN LABOR FORCE
7.8%
UNEMPLOYMENT RATE
Williamsburg Zip Codes
Williamsburg Area Codes
Income in Williamsburg
Income Overview in Williamsburg
Per Capita Income in Williamsburg is $19,545, while median incomes of families and households are $52,000 and $50,000 respectively.
| Characteristic | Number | Measure |
| Per Capita Income | 429 | $19,545 |
| Median Family Income | 118 | $52,000 |
| Mean Family Income | 118 | $59,308 |
| Median Household Income | 132 | $50,000 |
| Mean Household Income | 132 | $61,535 |
| Income Deficit | 118 | $0 |
| Wage / Income Gap (%) | 429 | 0.00% |
| Wage / Income Gap ($) | 429 | 100.00¢ per $1 |
| Gini / Inequality Index | 429 | 0.30 |
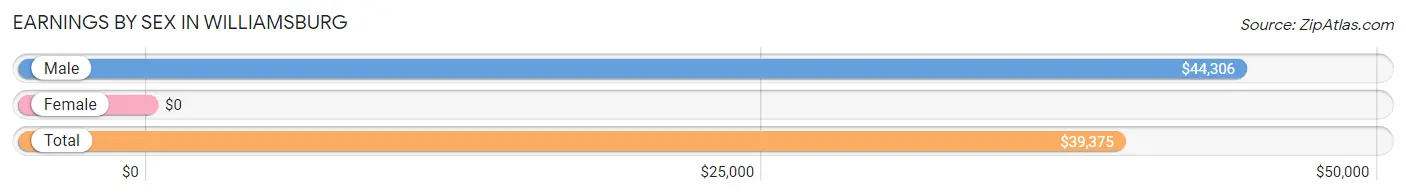
Earnings by Sex in Williamsburg
| Sex | Number | Average Earnings |
| Male | 105 (58.3%) | $44,306 |
| Female | 75 (41.7%) | $0 |
| Total | 180 (100.0%) | $39,375 |
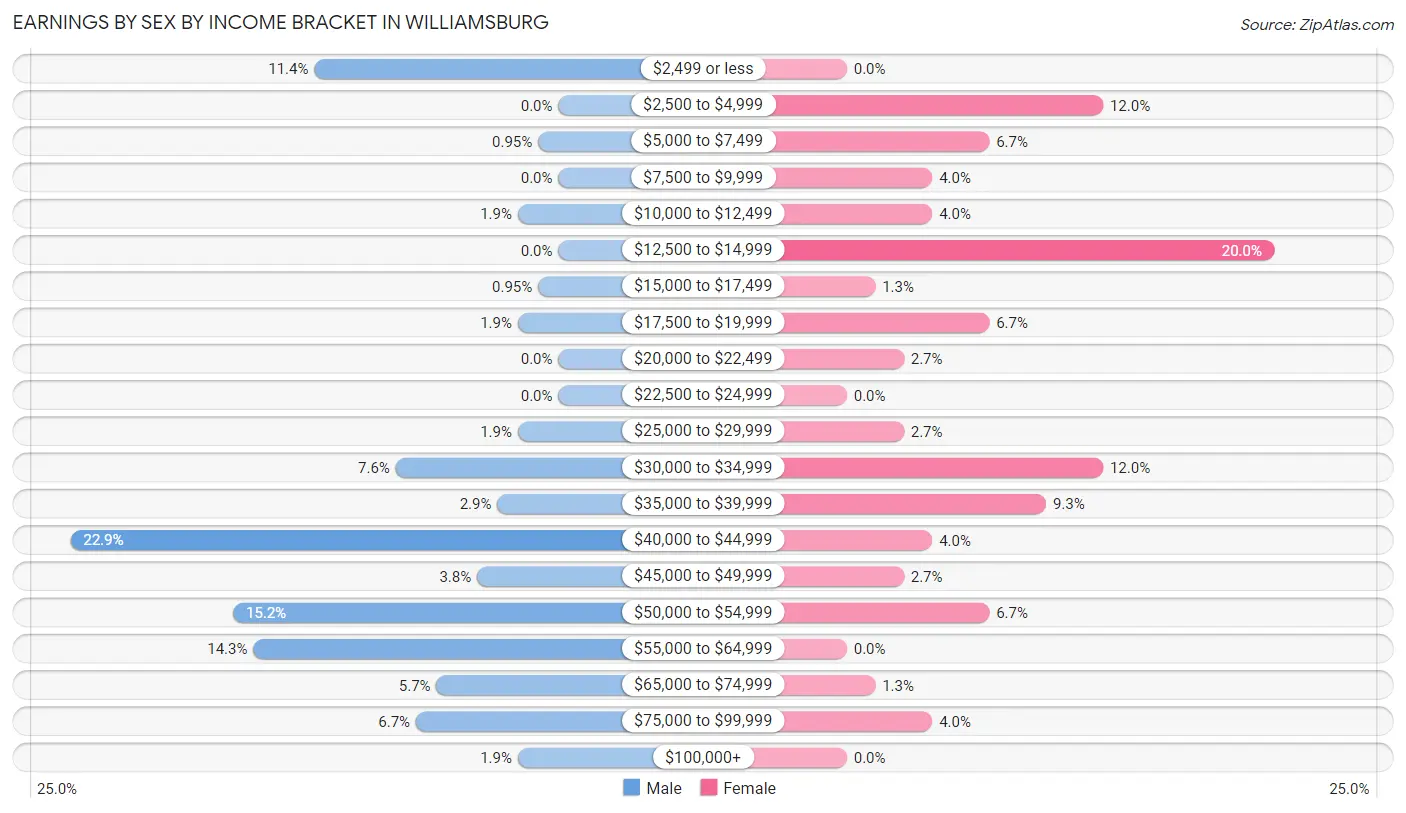
Earnings by Sex by Income Bracket in Williamsburg
The most common earnings brackets in Williamsburg are $40,000 to $44,999 for men (24 | 22.9%) and $12,500 to $14,999 for women (15 | 20.0%).
| Income | Male | Female |
| $2,499 or less | 12 (11.4%) | 0 (0.0%) |
| $2,500 to $4,999 | 0 (0.0%) | 9 (12.0%) |
| $5,000 to $7,499 | 1 (0.9%) | 5 (6.7%) |
| $7,500 to $9,999 | 0 (0.0%) | 3 (4.0%) |
| $10,000 to $12,499 | 2 (1.9%) | 3 (4.0%) |
| $12,500 to $14,999 | 0 (0.0%) | 15 (20.0%) |
| $15,000 to $17,499 | 1 (0.9%) | 1 (1.3%) |
| $17,500 to $19,999 | 2 (1.9%) | 5 (6.7%) |
| $20,000 to $22,499 | 0 (0.0%) | 2 (2.7%) |
| $22,500 to $24,999 | 0 (0.0%) | 0 (0.0%) |
| $25,000 to $29,999 | 2 (1.9%) | 2 (2.7%) |
| $30,000 to $34,999 | 8 (7.6%) | 9 (12.0%) |
| $35,000 to $39,999 | 3 (2.9%) | 7 (9.3%) |
| $40,000 to $44,999 | 24 (22.9%) | 3 (4.0%) |
| $45,000 to $49,999 | 4 (3.8%) | 2 (2.7%) |
| $50,000 to $54,999 | 16 (15.2%) | 5 (6.7%) |
| $55,000 to $64,999 | 15 (14.3%) | 0 (0.0%) |
| $65,000 to $74,999 | 6 (5.7%) | 1 (1.3%) |
| $75,000 to $99,999 | 7 (6.7%) | 3 (4.0%) |
| $100,000+ | 2 (1.9%) | 0 (0.0%) |
| Total | 105 (100.0%) | 75 (100.0%) |
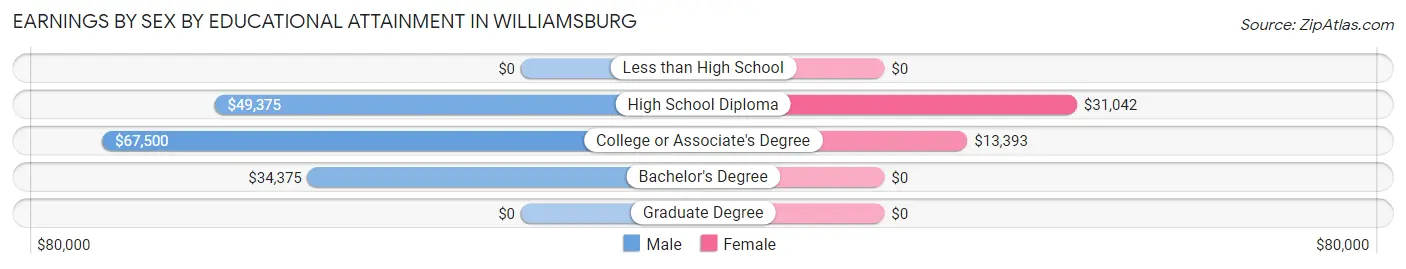
Earnings by Sex by Educational Attainment in Williamsburg
| Educational Attainment | Male Income | Female Income |
| Less than High School | - | - |
| High School Diploma | $49,375 | $31,042 |
| College or Associate's Degree | $67,500 | $13,393 |
| Bachelor's Degree | $34,375 | $0 |
| Graduate Degree | - | - |
| Total | $50,833 | $0 |
Family Income in Williamsburg
Family Income Brackets in Williamsburg
According to the Williamsburg family income data, there are 31 families falling into the $50,000 to $74,999 income range, which is the most common income bracket and makes up 26.3% of all families.
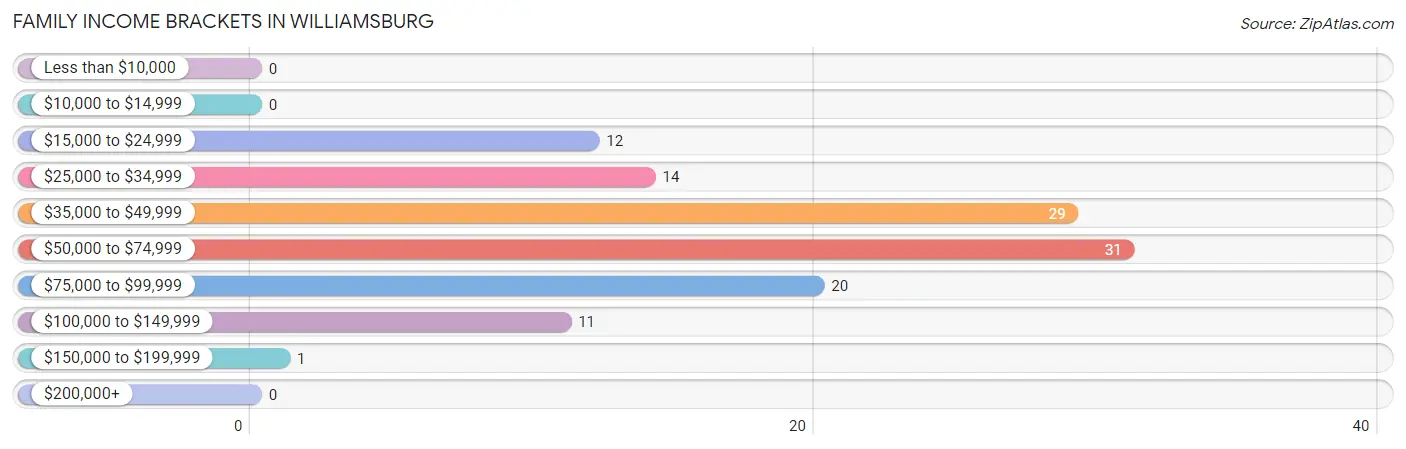
| Income Bracket | # Families | % Families |
| Less than $10,000 | 0 | 0.0% |
| $10,000 to $14,999 | 0 | 0.0% |
| $15,000 to $24,999 | 12 | 10.2% |
| $25,000 to $34,999 | 14 | 11.9% |
| $35,000 to $49,999 | 29 | 24.6% |
| $50,000 to $74,999 | 31 | 26.3% |
| $75,000 to $99,999 | 20 | 16.9% |
| $100,000 to $149,999 | 11 | 9.3% |
| $150,000 to $199,999 | 1 | 0.8% |
| $200,000+ | 0 | 0.0% |
Family Income by Famaliy Size in Williamsburg
4-person families (18 | 15.2%) account for the highest median family income in Williamsburg with $80,000 per family, while 2-person families (48 | 40.7%) have the highest median income of $22,188 per family member.
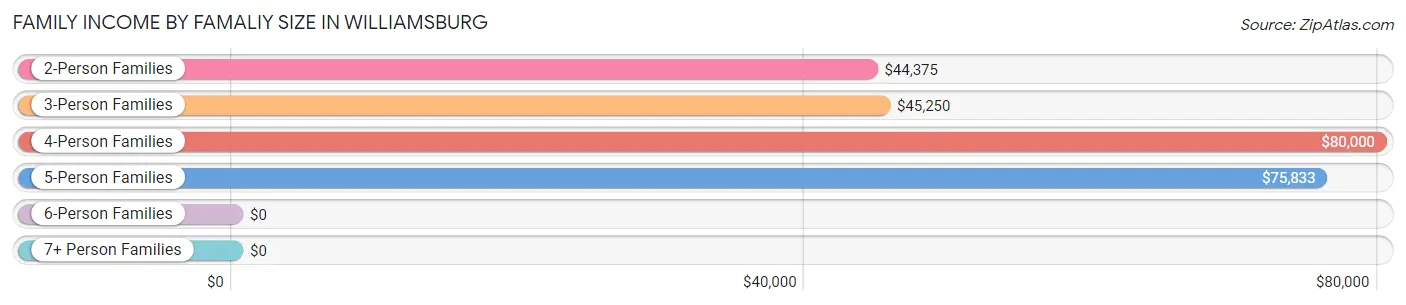
| Income Bracket | # Families | Median Income |
| 2-Person Families | 48 (40.7%) | $44,375 |
| 3-Person Families | 23 (19.5%) | $45,250 |
| 4-Person Families | 18 (15.2%) | $80,000 |
| 5-Person Families | 20 (17.0%) | $75,833 |
| 6-Person Families | 6 (5.1%) | $0 |
| 7+ Person Families | 3 (2.5%) | $0 |
| Total | 118 (100.0%) | $52,000 |
Family Income by Number of Earners in Williamsburg
The median family income in Williamsburg is $52,000, with families comprising 3+ earners (10) having the highest median family income of $99,000, while families with no earners (29) have the lowest median family income of $34,063, accounting for 8.5% and 24.6% of families, respectively.
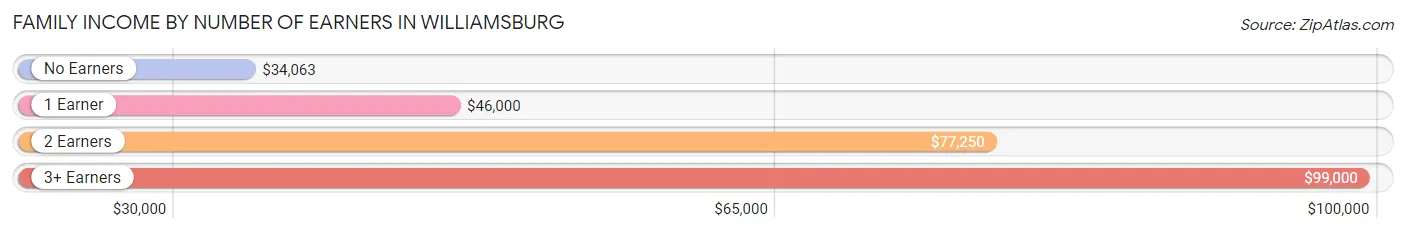
| Number of Earners | # Families | Median Income |
| No Earners | 29 (24.6%) | $34,063 |
| 1 Earner | 42 (35.6%) | $46,000 |
| 2 Earners | 37 (31.4%) | $77,250 |
| 3+ Earners | 10 (8.5%) | $99,000 |
| Total | 118 (100.0%) | $52,000 |
Household Income in Williamsburg
Household Income Brackets in Williamsburg
With 34 households falling in the category, the $35,000 to $49,999 income range is the most frequent in Williamsburg, accounting for 25.8% of all households.
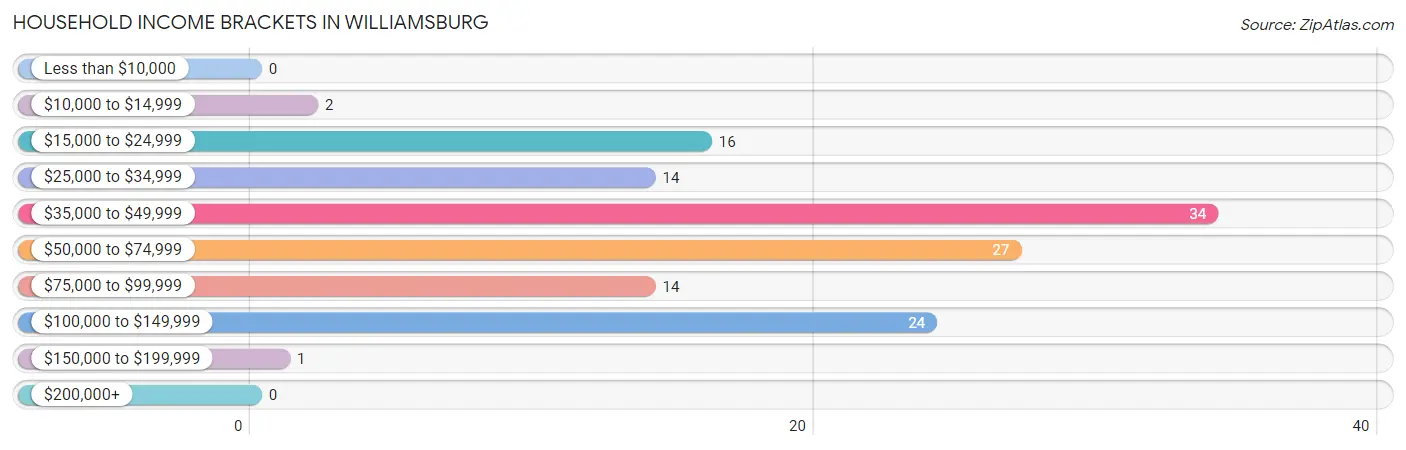
| Income Bracket | # Households | % Households |
| Less than $10,000 | 0 | 0.0% |
| $10,000 to $14,999 | 2 | 1.5% |
| $15,000 to $24,999 | 16 | 12.1% |
| $25,000 to $34,999 | 14 | 10.6% |
| $35,000 to $49,999 | 34 | 25.8% |
| $50,000 to $74,999 | 27 | 20.5% |
| $75,000 to $99,999 | 14 | 10.6% |
| $100,000 to $149,999 | 24 | 18.2% |
| $150,000 to $199,999 | 1 | 0.8% |
| $200,000+ | 0 | 0.0% |
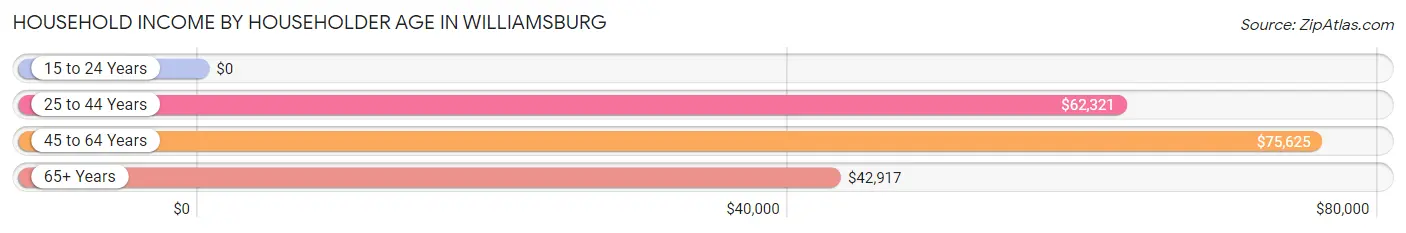
Household Income by Householder Age in Williamsburg
The median household income in Williamsburg is $50,000, with the highest median household income of $75,625 found in the 45 to 64 years age bracket for the primary householder. A total of 37 households (28.0%) fall into this category.
| Income Bracket | # Households | Median Income |
| 15 to 24 Years | 0 (0.0%) | $0 |
| 25 to 44 Years | 49 (37.1%) | $62,321 |
| 45 to 64 Years | 37 (28.0%) | $75,625 |
| 65+ Years | 46 (34.8%) | $42,917 |
| Total | 132 (100.0%) | $50,000 |
Poverty in Williamsburg
Income Below Poverty by Sex and Age in Williamsburg
With 10.4% poverty level for males and 6.8% for females among the residents of Williamsburg, 12 to 14 year old males and under 5 year old females are the most vulnerable to poverty, with 5 males (83.3%) and 4 females (25.0%) in their respective age groups living below the poverty level.
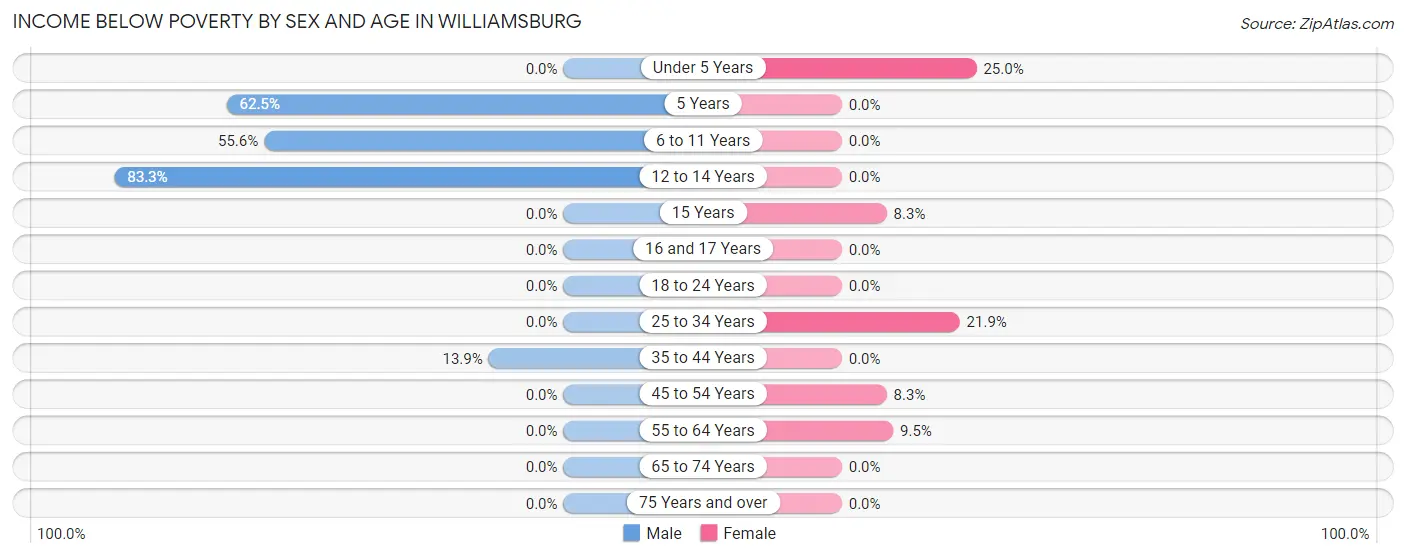
| Age Bracket | Male | Female |
| Under 5 Years | 0 (0.0%) | 4 (25.0%) |
| 5 Years | 5 (62.5%) | 0 (0.0%) |
| 6 to 11 Years | 5 (55.6%) | 0 (0.0%) |
| 12 to 14 Years | 5 (83.3%) | 0 (0.0%) |
| 15 Years | 0 (0.0%) | 1 (8.3%) |
| 16 and 17 Years | 0 (0.0%) | 0 (0.0%) |
| 18 to 24 Years | 0 (0.0%) | 0 (0.0%) |
| 25 to 34 Years | 0 (0.0%) | 7 (21.9%) |
| 35 to 44 Years | 5 (13.9%) | 0 (0.0%) |
| 45 to 54 Years | 0 (0.0%) | 2 (8.3%) |
| 55 to 64 Years | 0 (0.0%) | 2 (9.5%) |
| 65 to 74 Years | 0 (0.0%) | 0 (0.0%) |
| 75 Years and over | 0 (0.0%) | 0 (0.0%) |
| Total | 20 (10.4%) | 16 (6.8%) |
Income Above Poverty by Sex and Age in Williamsburg
According to the poverty statistics in Williamsburg, males aged under 5 years and females aged 6 to 11 years are the age groups that are most secure financially, with 100.0% of males and 100.0% of females in these age groups living above the poverty line.
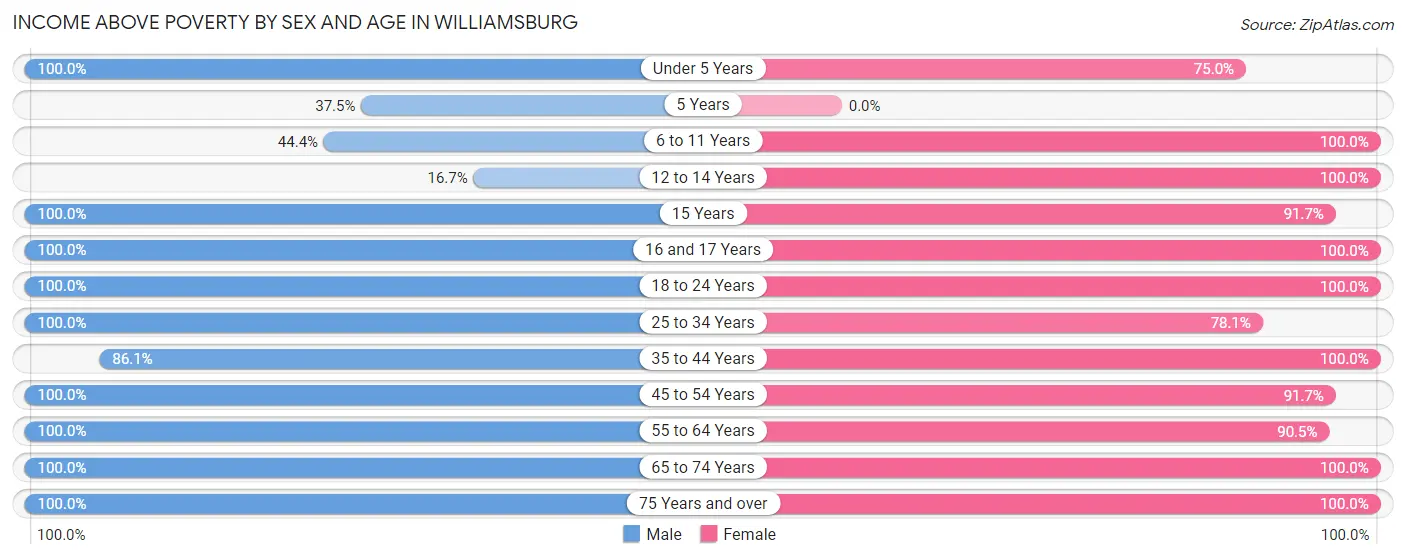
| Age Bracket | Male | Female |
| Under 5 Years | 18 (100.0%) | 12 (75.0%) |
| 5 Years | 3 (37.5%) | 0 (0.0%) |
| 6 to 11 Years | 4 (44.4%) | 34 (100.0%) |
| 12 to 14 Years | 1 (16.7%) | 16 (100.0%) |
| 15 Years | 8 (100.0%) | 11 (91.7%) |
| 16 and 17 Years | 1 (100.0%) | 14 (100.0%) |
| 18 to 24 Years | 19 (100.0%) | 2 (100.0%) |
| 25 to 34 Years | 22 (100.0%) | 25 (78.1%) |
| 35 to 44 Years | 31 (86.1%) | 20 (100.0%) |
| 45 to 54 Years | 15 (100.0%) | 22 (91.7%) |
| 55 to 64 Years | 20 (100.0%) | 19 (90.5%) |
| 65 to 74 Years | 19 (100.0%) | 31 (100.0%) |
| 75 Years and over | 11 (100.0%) | 15 (100.0%) |
| Total | 172 (89.6%) | 221 (93.2%) |
Income Below Poverty Among Married-Couple Families in Williamsburg
The poverty statistics for married-couple families in Williamsburg show that 5.1% or 5 of the total 99 families live below the poverty line. Families with 3 or 4 children have the highest poverty rate of 20.0%, comprising of 5 families. On the other hand, families with no children have the lowest poverty rate of 0.0%, which includes 0 families.
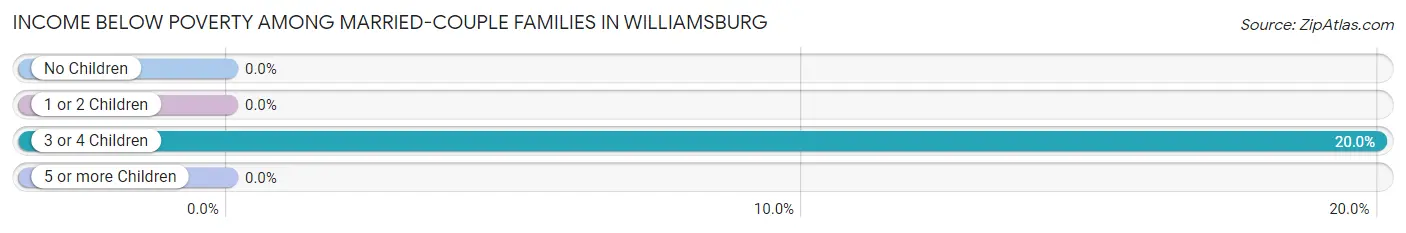
| Children | Above Poverty | Below Poverty |
| No Children | 49 (100.0%) | 0 (0.0%) |
| 1 or 2 Children | 24 (100.0%) | 0 (0.0%) |
| 3 or 4 Children | 20 (80.0%) | 5 (20.0%) |
| 5 or more Children | 1 (100.0%) | 0 (0.0%) |
| Total | 94 (95.0%) | 5 (5.1%) |
Income Below Poverty Among Single-Parent Households in Williamsburg
| Children | Single Father | Single Mother |
| No Children | 0 (0.0%) | 0 (0.0%) |
| 1 or 2 Children | 0 (0.0%) | 0 (0.0%) |
| 3 or 4 Children | 0 (0.0%) | 0 (0.0%) |
| 5 or more Children | 0 (0.0%) | 0 (0.0%) |
| Total | 0 (0.0%) | 0 (0.0%) |
Income Below Poverty Among Married-Couple vs Single-Parent Households in Williamsburg
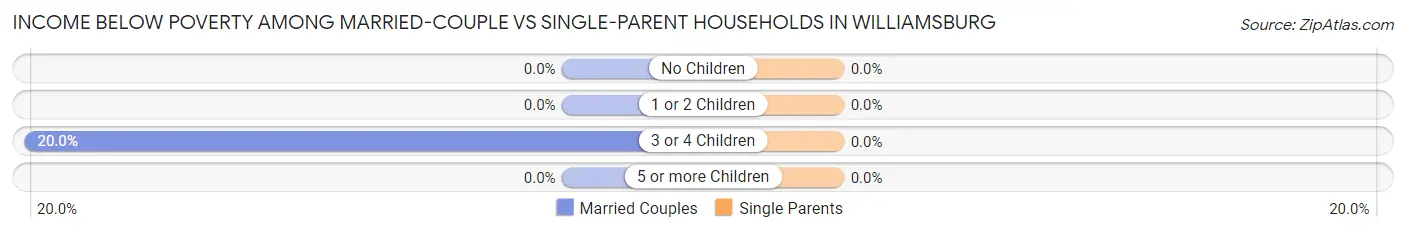
| Children | Married-Couple Families | Single-Parent Households |
| No Children | 0 (0.0%) | 0 (0.0%) |
| 1 or 2 Children | 0 (0.0%) | 0 (0.0%) |
| 3 or 4 Children | 5 (20.0%) | 0 (0.0%) |
| 5 or more Children | 0 (0.0%) | 0 (0.0%) |
| Total | 5 (5.1%) | 0 (0.0%) |
Race in Williamsburg
The most populous races in Williamsburg are White / Caucasian (416 | 97.0%), and Two or more Races (13 | 3.0%).
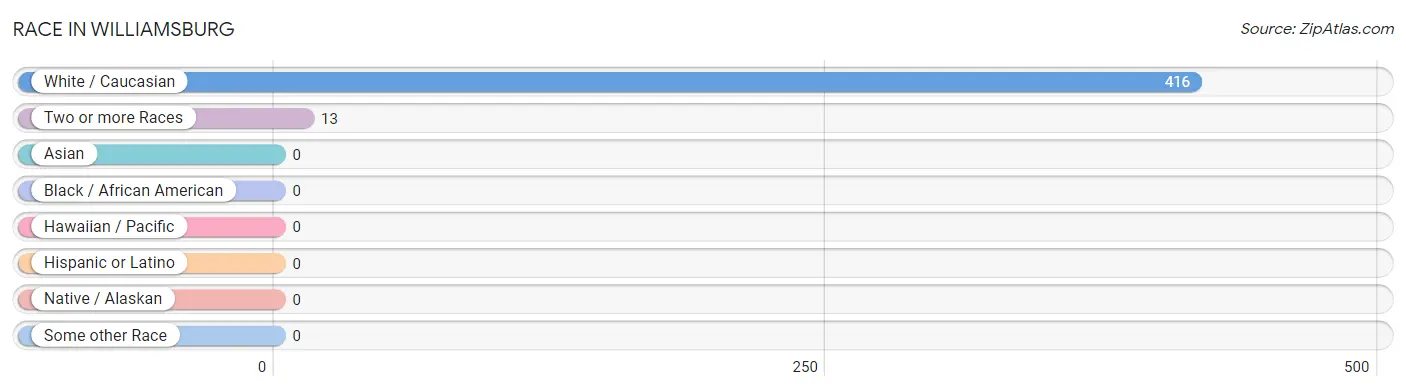
| Race | # Population | % Population |
| Asian | 0 | 0.0% |
| Black / African American | 0 | 0.0% |
| Hawaiian / Pacific | 0 | 0.0% |
| Hispanic or Latino | 0 | 0.0% |
| Native / Alaskan | 0 | 0.0% |
| White / Caucasian | 416 | 97.0% |
| Two or more Races | 13 | 3.0% |
| Some other Race | 0 | 0.0% |
| Total | 429 | 100.0% |
Ancestry in Williamsburg
The most populous ancestries reported in Williamsburg are German (87 | 20.3%), Irish (67 | 15.6%), American (46 | 10.7%), Norwegian (19 | 4.4%), and Scandinavian (14 | 3.3%), together accounting for 54.3% of all Williamsburg residents.
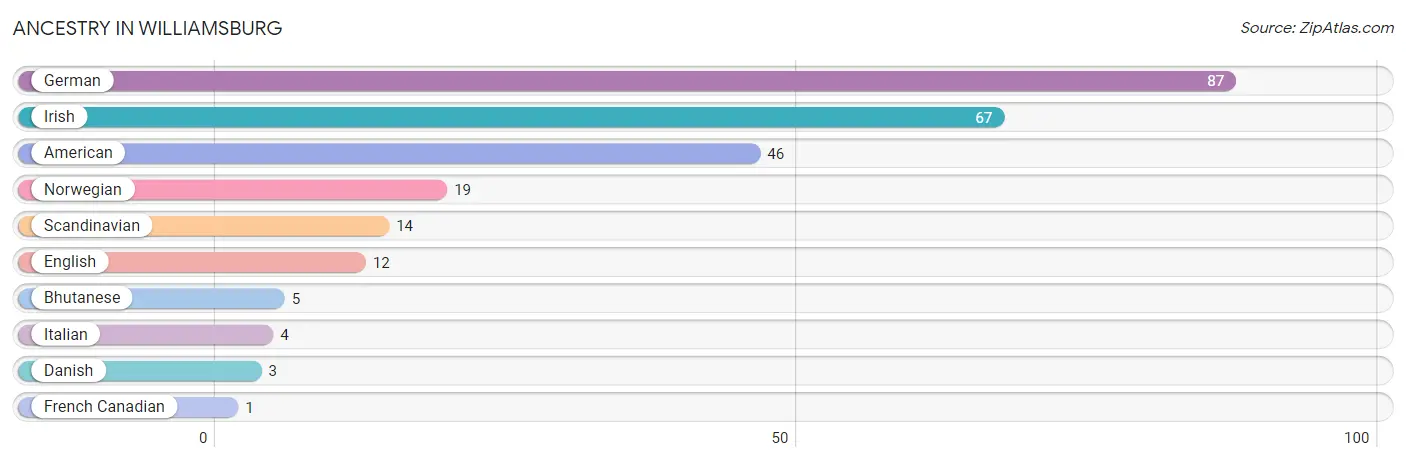
| Ancestry | # Population | % Population |
| American | 46 | 10.7% |
| Bhutanese | 5 | 1.2% |
| Danish | 3 | 0.7% |
| English | 12 | 2.8% |
| French Canadian | 1 | 0.2% |
| German | 87 | 20.3% |
| Irish | 67 | 15.6% |
| Italian | 4 | 0.9% |
| Norwegian | 19 | 4.4% |
| Scandinavian | 14 | 3.3% | View All 10 Rows |
Immigrants in Williamsburg

| Immigration Origin | # Population | % Population | View All 0 Rows |
Sex and Age in Williamsburg
Sex and Age in Williamsburg
The most populous age groups in Williamsburg are 35 to 39 Years (32 | 16.7%) for men and 10 to 14 Years (35 | 14.8%) for women.
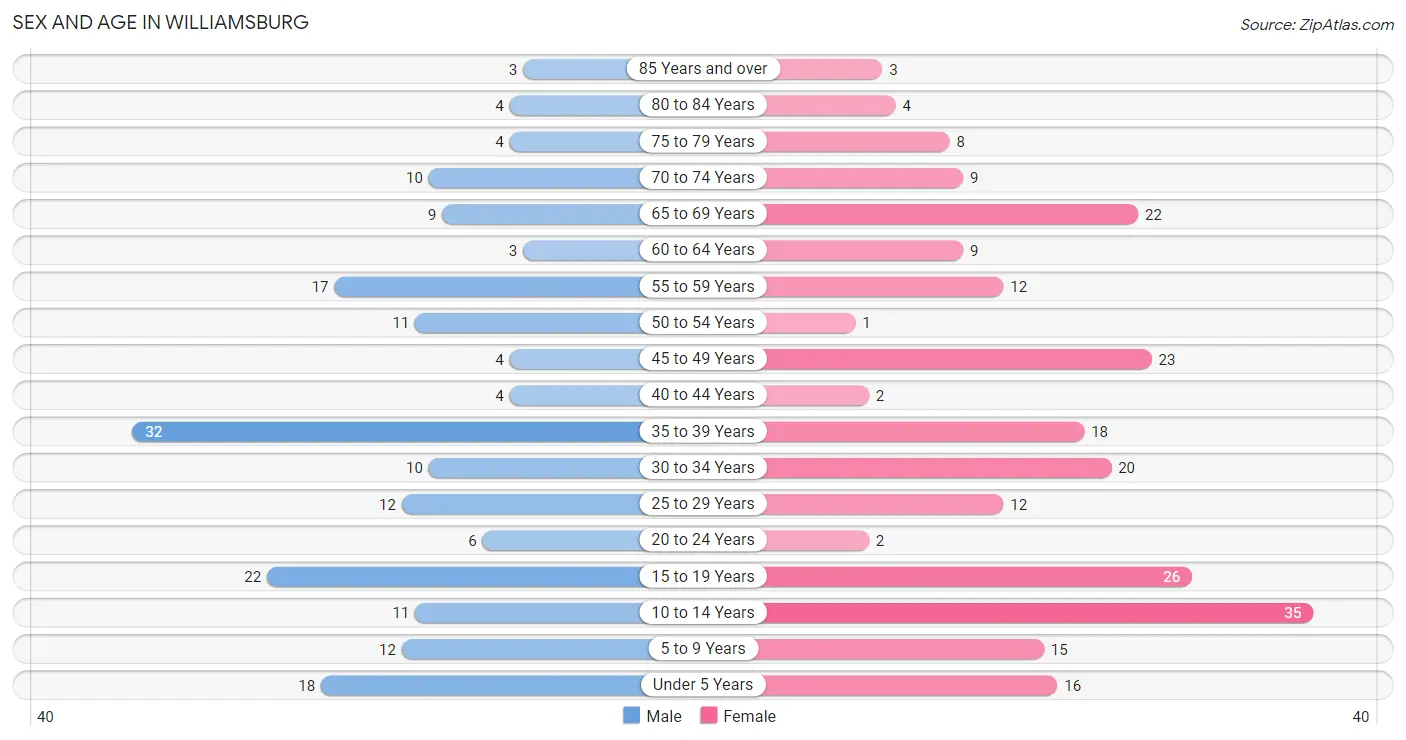
| Age Bracket | Male | Female |
| Under 5 Years | 18 (9.4%) | 16 (6.8%) |
| 5 to 9 Years | 12 (6.2%) | 15 (6.3%) |
| 10 to 14 Years | 11 (5.7%) | 35 (14.8%) |
| 15 to 19 Years | 22 (11.5%) | 26 (11.0%) |
| 20 to 24 Years | 6 (3.1%) | 2 (0.8%) |
| 25 to 29 Years | 12 (6.2%) | 12 (5.1%) |
| 30 to 34 Years | 10 (5.2%) | 20 (8.4%) |
| 35 to 39 Years | 32 (16.7%) | 18 (7.6%) |
| 40 to 44 Years | 4 (2.1%) | 2 (0.8%) |
| 45 to 49 Years | 4 (2.1%) | 23 (9.7%) |
| 50 to 54 Years | 11 (5.7%) | 1 (0.4%) |
| 55 to 59 Years | 17 (8.8%) | 12 (5.1%) |
| 60 to 64 Years | 3 (1.6%) | 9 (3.8%) |
| 65 to 69 Years | 9 (4.7%) | 22 (9.3%) |
| 70 to 74 Years | 10 (5.2%) | 9 (3.8%) |
| 75 to 79 Years | 4 (2.1%) | 8 (3.4%) |
| 80 to 84 Years | 4 (2.1%) | 4 (1.7%) |
| 85 Years and over | 3 (1.6%) | 3 (1.3%) |
| Total | 192 (100.0%) | 237 (100.0%) |
Families and Households in Williamsburg
Median Family Size in Williamsburg
The median family size in Williamsburg is 3.36 persons per family, with single male/father families (5 | 4.2%) accounting for the largest median family size of 4.2 persons per family. On the other hand, single female/mother families (14 | 11.9%) represent the smallest median family size with 2.57 persons per family.
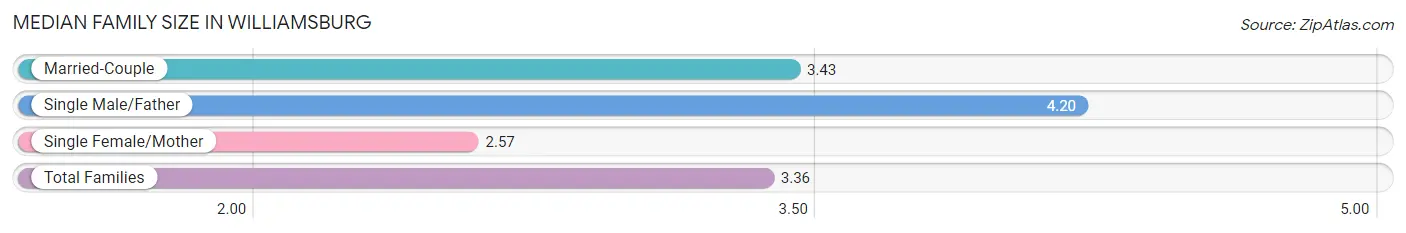
| Family Type | # Families | Family Size |
| Married-Couple | 99 (83.9%) | 3.43 |
| Single Male/Father | 5 (4.2%) | 4.20 |
| Single Female/Mother | 14 (11.9%) | 2.57 |
| Total Families | 118 (100.0%) | 3.36 |
Median Household Size in Williamsburg
The median household size in Williamsburg is 3.25 persons per household, with single male/father households (5 | 3.8%) accounting for the largest median household size of 4.8 persons per household. non-family households (14 | 10.6%) represent the smallest median household size with 1.14 persons per household.
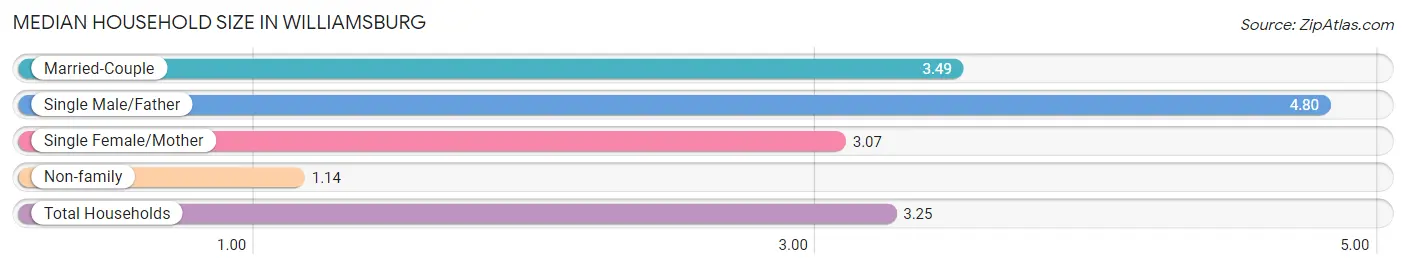
| Household Type | # Households | Household Size |
| Married-Couple | 99 (75.0%) | 3.49 |
| Single Male/Father | 5 (3.8%) | 4.80 |
| Single Female/Mother | 14 (10.6%) | 3.07 |
| Non-family | 14 (10.6%) | 1.14 |
| Total Households | 132 (100.0%) | 3.25 |
Household Size by Marriage Status in Williamsburg
Out of a total of 132 households in Williamsburg, 118 (89.4%) are family households, while 14 (10.6%) are nonfamily households. The most numerous type of family households are 2-person households, comprising 48, and the most common type of nonfamily households are 1-person households, comprising 11.
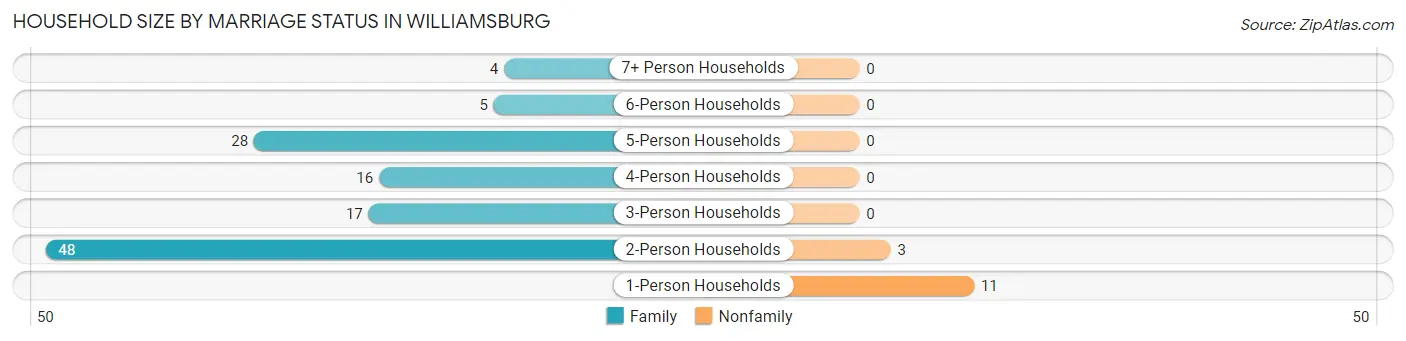
| Household Size | Family Households | Nonfamily Households |
| 1-Person Households | - | 11 (8.3%) |
| 2-Person Households | 48 (36.4%) | 3 (2.3%) |
| 3-Person Households | 17 (12.9%) | 0 (0.0%) |
| 4-Person Households | 16 (12.1%) | 0 (0.0%) |
| 5-Person Households | 28 (21.2%) | 0 (0.0%) |
| 6-Person Households | 5 (3.8%) | 0 (0.0%) |
| 7+ Person Households | 4 (3.0%) | 0 (0.0%) |
| Total | 118 (89.4%) | 14 (10.6%) |
Female Fertility in Williamsburg
Fertility by Age in Williamsburg
Average fertility rate in Williamsburg is 78.0 births per 1,000 women. Women in the age bracket of 20 to 34 years have the highest fertility rate with 235.0 births per 1,000 women. Women in the age bracket of 20 to 34 years acount for 100.0% of all women with births.
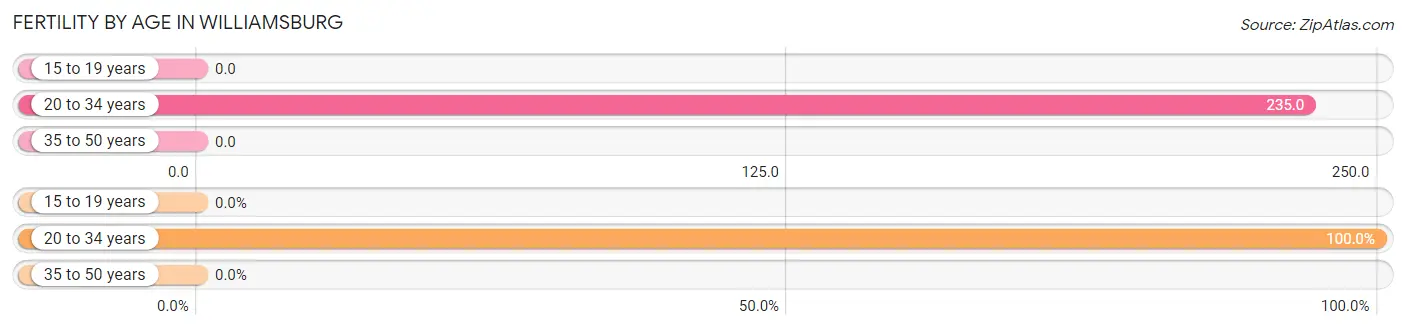
| Age Bracket | Women with Births | Births / 1,000 Women |
| 15 to 19 years | 0 (0.0%) | 0.0 |
| 20 to 34 years | 8 (100.0%) | 235.0 |
| 35 to 50 years | 0 (0.0%) | 0.0 |
| Total | 8 (100.0%) | 78.0 |
Fertility by Age by Marriage Status in Williamsburg
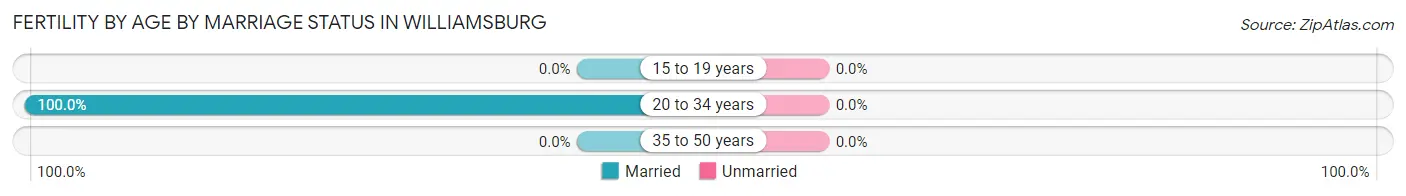
| Age Bracket | Married | Unmarried |
| 15 to 19 years | 0 (0.0%) | 0 (0.0%) |
| 20 to 34 years | 8 (100.0%) | 0 (0.0%) |
| 35 to 50 years | 0 (0.0%) | 0 (0.0%) |
| Total | 8 (100.0%) | 0 (0.0%) |
Fertility by Education in Williamsburg
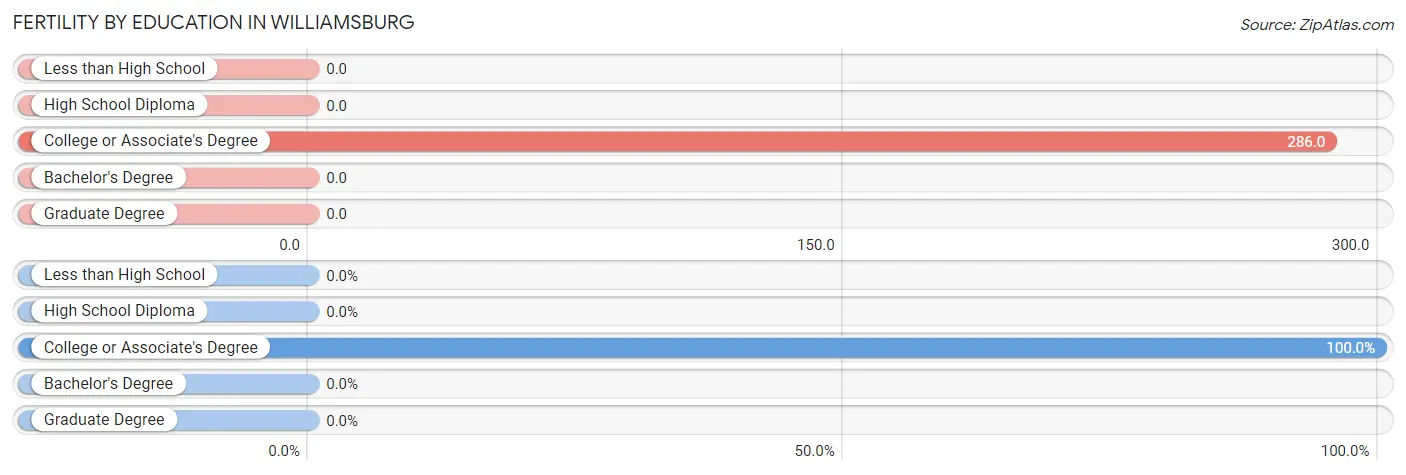
| Educational Attainment | Women with Births | Births / 1,000 Women |
| Less than High School | 0 (0.0%) | 0.0 |
| High School Diploma | 0 (0.0%) | 0.0 |
| College or Associate's Degree | 8 (100.0%) | 286.0 |
| Bachelor's Degree | 0 (0.0%) | 0.0 |
| Graduate Degree | 0 (0.0%) | 0.0 |
| Total | 8 (100.0%) | 78.0 |
Fertility by Education by Marriage Status in Williamsburg
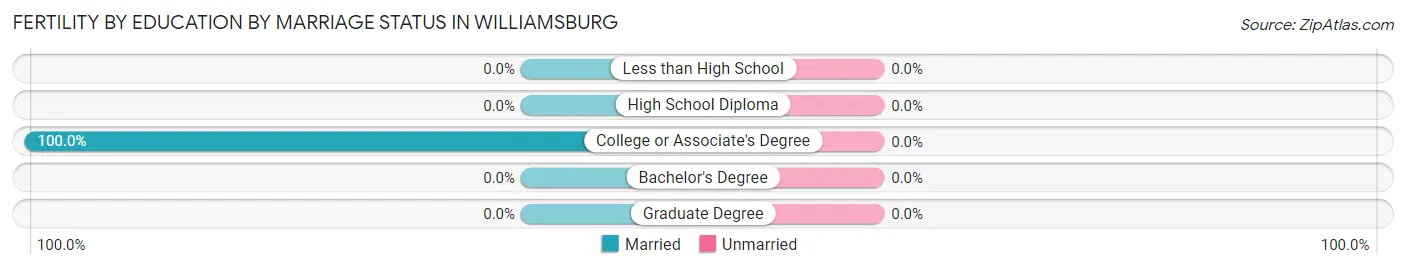
| Educational Attainment | Married | Unmarried |
| Less than High School | 0 (0.0%) | 0 (0.0%) |
| High School Diploma | 0 (0.0%) | 0 (0.0%) |
| College or Associate's Degree | 8 (100.0%) | 0 (0.0%) |
| Bachelor's Degree | 0 (0.0%) | 0 (0.0%) |
| Graduate Degree | 0 (0.0%) | 0 (0.0%) |
| Total | 8 (100.0%) | 0 (0.0%) |
Employment Characteristics in Williamsburg
Employment by Class of Employer in Williamsburg
Among the 166 employed individuals in Williamsburg, private company employees (121 | 72.9%), local government employees (31 | 18.7%), and not-for-profit organizations (4 | 2.4%) make up the most common classes of employment.
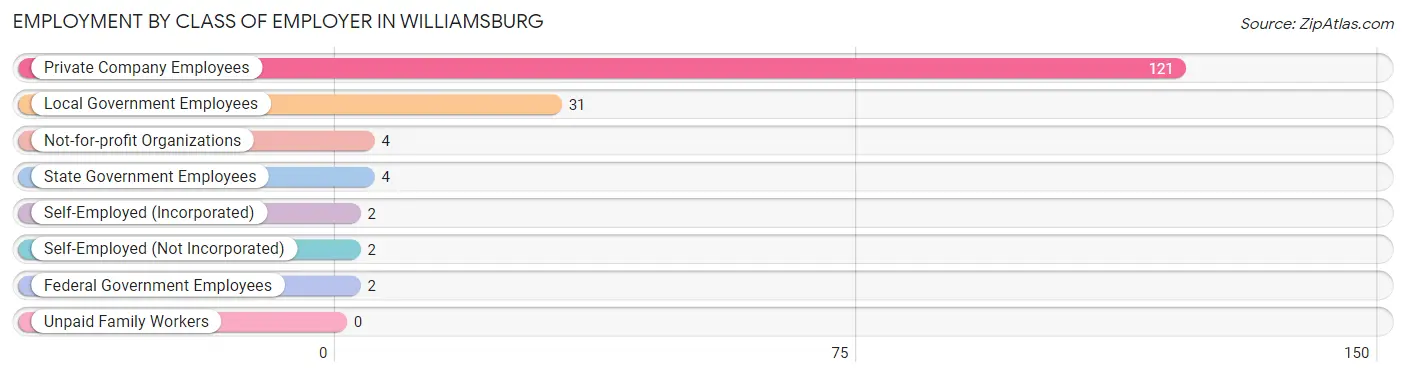
| Employer Class | # Employees | % Employees |
| Private Company Employees | 121 | 72.9% |
| Self-Employed (Incorporated) | 2 | 1.2% |
| Self-Employed (Not Incorporated) | 2 | 1.2% |
| Not-for-profit Organizations | 4 | 2.4% |
| Local Government Employees | 31 | 18.7% |
| State Government Employees | 4 | 2.4% |
| Federal Government Employees | 2 | 1.2% |
| Unpaid Family Workers | 0 | 0.0% |
| Total | 166 | 100.0% |
Employment Status by Age in Williamsburg
According to the labor force statistics for Williamsburg, out of the total population over 16 years of age (302), 59.6% or 180 individuals are in the labor force, with 7.8% or 14 of them unemployed. The age group with the highest labor force participation rate is 25 to 29 years, with 100.0% or 24 individuals in the labor force. Within the labor force, the 16 to 19 years age range has the highest percentage of unemployed individuals, with 50.0% or 11 of them being unemployed.
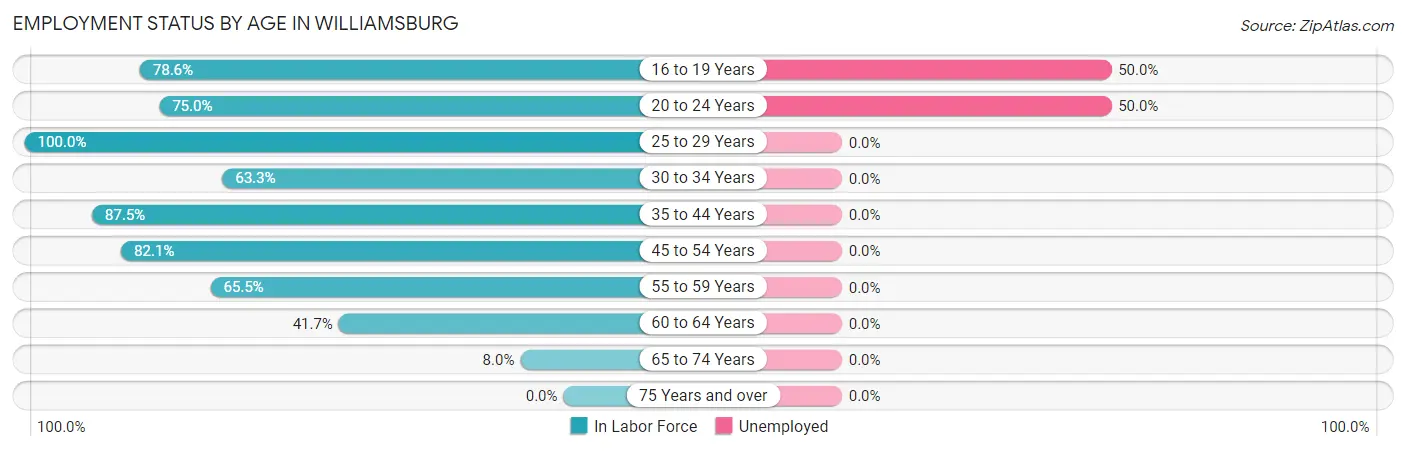
| Age Bracket | In Labor Force | Unemployed |
| 16 to 19 Years | 22 (78.6%) | 11 (50.0%) |
| 20 to 24 Years | 6 (75.0%) | 3 (50.0%) |
| 25 to 29 Years | 24 (100.0%) | 0 (0.0%) |
| 30 to 34 Years | 19 (63.3%) | 0 (0.0%) |
| 35 to 44 Years | 49 (87.5%) | 0 (0.0%) |
| 45 to 54 Years | 32 (82.1%) | 0 (0.0%) |
| 55 to 59 Years | 19 (65.5%) | 0 (0.0%) |
| 60 to 64 Years | 5 (41.7%) | 0 (0.0%) |
| 65 to 74 Years | 4 (8.0%) | 0 (0.0%) |
| 75 Years and over | 0 (0.0%) | 0 (0.0%) |
| Total | 180 (59.6%) | 14 (7.8%) |
Employment Status by Educational Attainment in Williamsburg
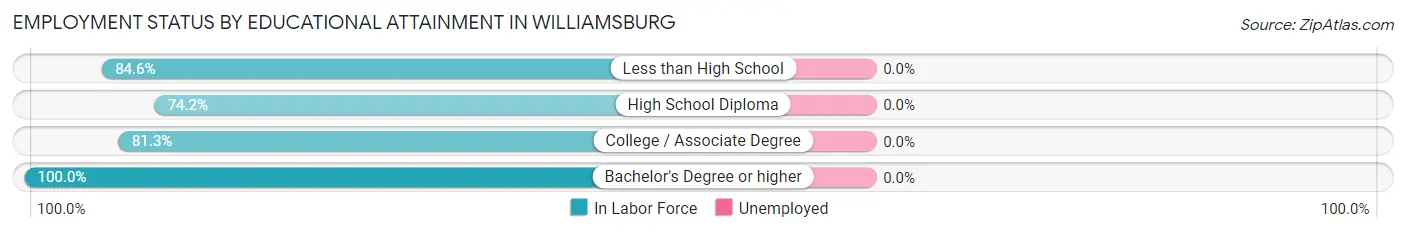
| Educational Attainment | In Labor Force | Unemployed |
| Less than High School | 11 (84.6%) | 0 (0.0%) |
| High School Diploma | 89 (74.2%) | 0 (0.0%) |
| College / Associate Degree | 39 (81.3%) | 0 (0.0%) |
| Bachelor's Degree or higher | 9 (100.0%) | 0 (0.0%) |
| Total | 148 (77.9%) | 0 (0.0%) |
Employment Occupations by Sex in Williamsburg
Management, Business, Science and Arts Occupations
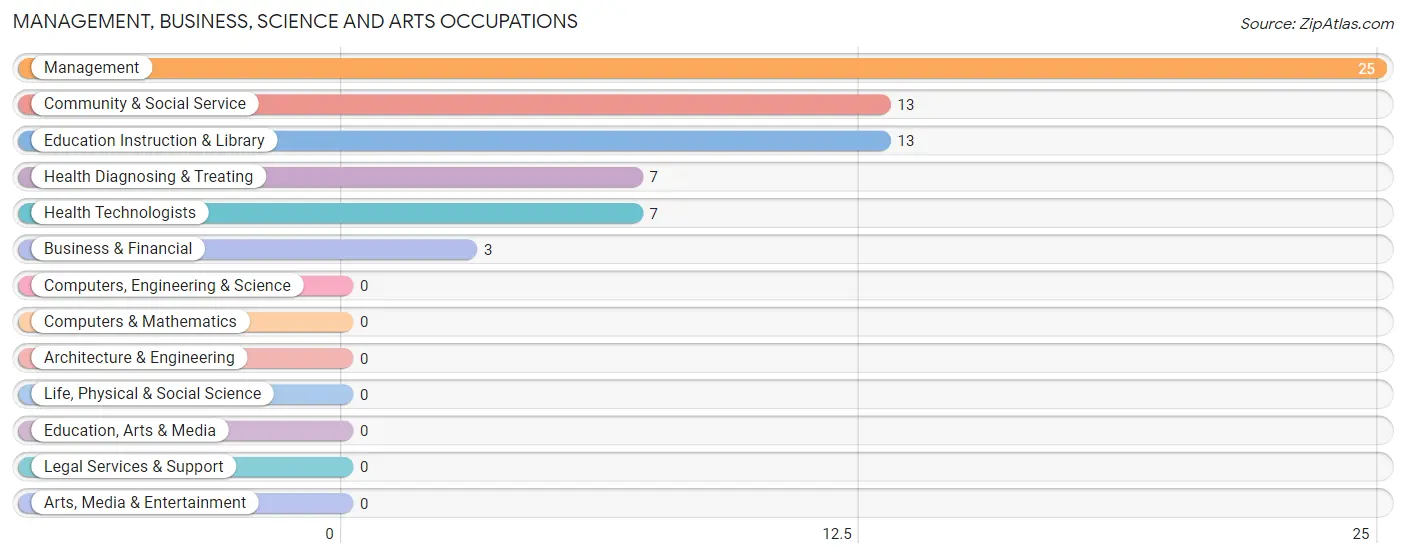
The most common Management, Business, Science and Arts occupations in Williamsburg are Management (25 | 15.1%), Community & Social Service (13 | 7.8%), Education Instruction & Library (13 | 7.8%), Health Diagnosing & Treating (7 | 4.2%), and Health Technologists (7 | 4.2%).
Management, Business, Science and Arts Occupations by Sex
Within the Management, Business, Science and Arts occupations in Williamsburg, the most male-oriented occupations are Business & Financial (66.7%), Management (64.0%), and Health Diagnosing & Treating (28.6%), while the most female-oriented occupations are Community & Social Service (100.0%), Education Instruction & Library (100.0%), and Health Diagnosing & Treating (71.4%).
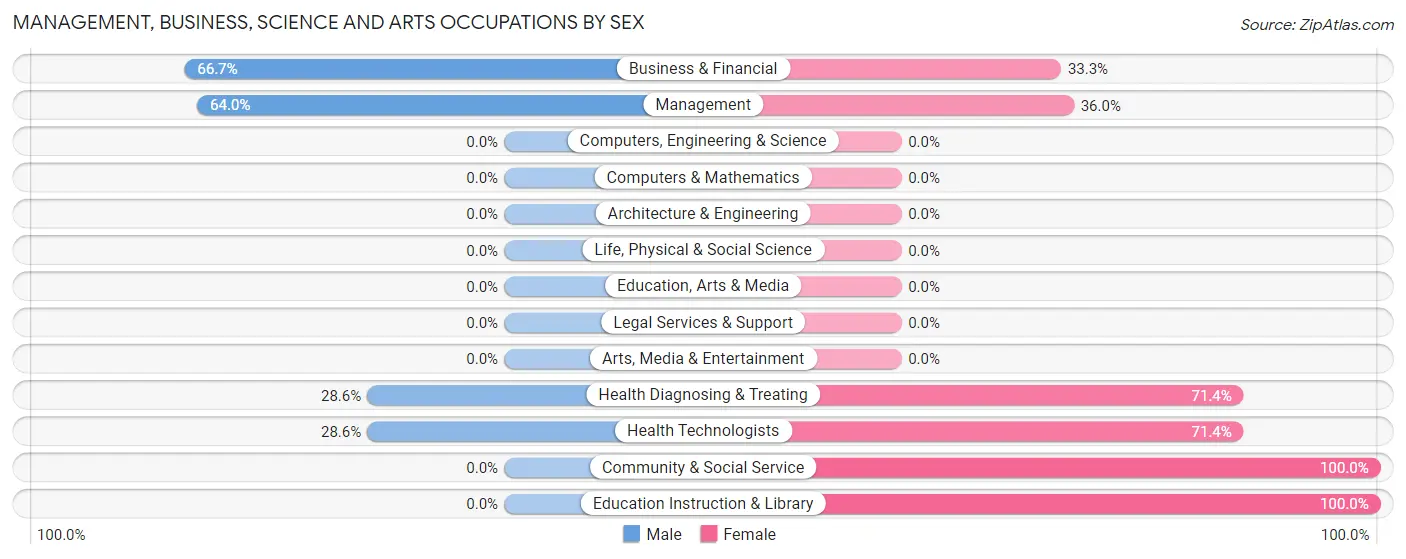
| Occupation | Male | Female |
| Management | 16 (64.0%) | 9 (36.0%) |
| Business & Financial | 2 (66.7%) | 1 (33.3%) |
| Computers, Engineering & Science | 0 (0.0%) | 0 (0.0%) |
| Computers & Mathematics | 0 (0.0%) | 0 (0.0%) |
| Architecture & Engineering | 0 (0.0%) | 0 (0.0%) |
| Life, Physical & Social Science | 0 (0.0%) | 0 (0.0%) |
| Community & Social Service | 0 (0.0%) | 13 (100.0%) |
| Education, Arts & Media | 0 (0.0%) | 0 (0.0%) |
| Legal Services & Support | 0 (0.0%) | 0 (0.0%) |
| Education Instruction & Library | 0 (0.0%) | 13 (100.0%) |
| Arts, Media & Entertainment | 0 (0.0%) | 0 (0.0%) |
| Health Diagnosing & Treating | 2 (28.6%) | 5 (71.4%) |
| Health Technologists | 2 (28.6%) | 5 (71.4%) |
| Total (Category) | 20 (41.7%) | 28 (58.3%) |
| Total (Overall) | 91 (54.8%) | 75 (45.2%) |
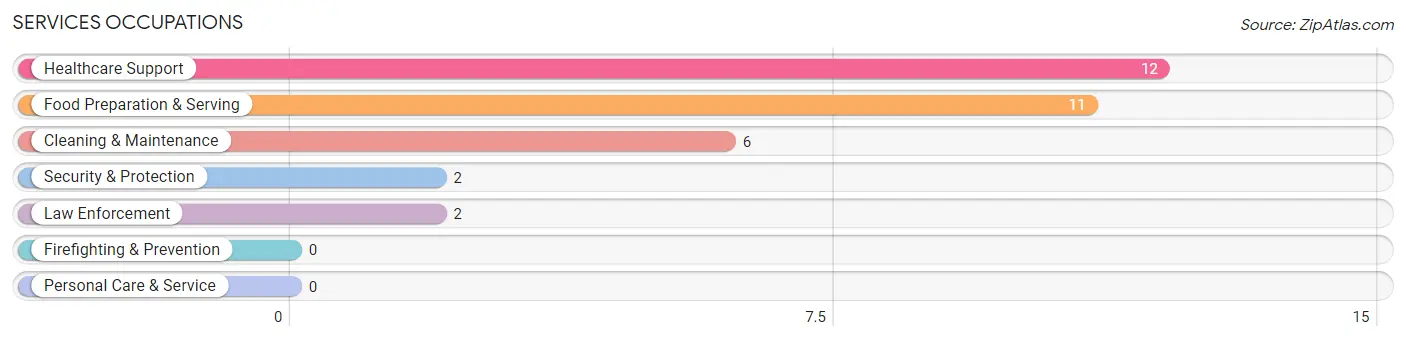
Services Occupations
The most common Services occupations in Williamsburg are Healthcare Support (12 | 7.2%), Food Preparation & Serving (11 | 6.6%), Cleaning & Maintenance (6 | 3.6%), Security & Protection (2 | 1.2%), and Law Enforcement (2 | 1.2%).
Services Occupations by Sex
Within the Services occupations in Williamsburg, the most male-oriented occupations are Security & Protection (100.0%), Law Enforcement (100.0%), and Cleaning & Maintenance (100.0%), while the most female-oriented occupations are Healthcare Support (100.0%), and Food Preparation & Serving (18.2%).
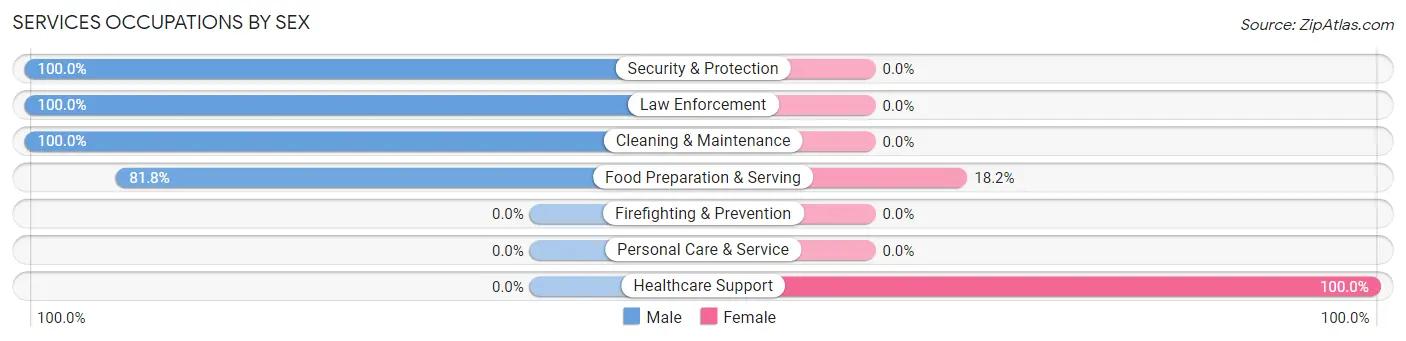
| Occupation | Male | Female |
| Healthcare Support | 0 (0.0%) | 12 (100.0%) |
| Security & Protection | 2 (100.0%) | 0 (0.0%) |
| Firefighting & Prevention | 0 (0.0%) | 0 (0.0%) |
| Law Enforcement | 2 (100.0%) | 0 (0.0%) |
| Food Preparation & Serving | 9 (81.8%) | 2 (18.2%) |
| Cleaning & Maintenance | 6 (100.0%) | 0 (0.0%) |
| Personal Care & Service | 0 (0.0%) | 0 (0.0%) |
| Total (Category) | 17 (54.8%) | 14 (45.2%) |
| Total (Overall) | 91 (54.8%) | 75 (45.2%) |
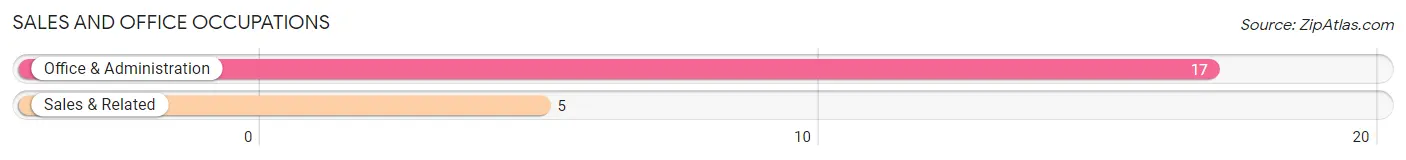
Sales and Office Occupations
The most common Sales and Office occupations in Williamsburg are Office & Administration (17 | 10.2%), and Sales & Related (5 | 3.0%).
Sales and Office Occupations by Sex
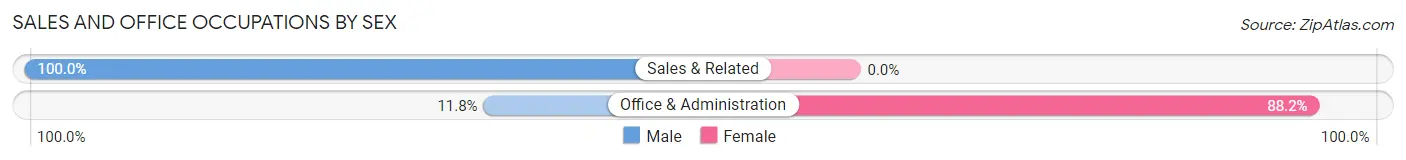
| Occupation | Male | Female |
| Sales & Related | 5 (100.0%) | 0 (0.0%) |
| Office & Administration | 2 (11.8%) | 15 (88.2%) |
| Total (Category) | 7 (31.8%) | 15 (68.2%) |
| Total (Overall) | 91 (54.8%) | 75 (45.2%) |
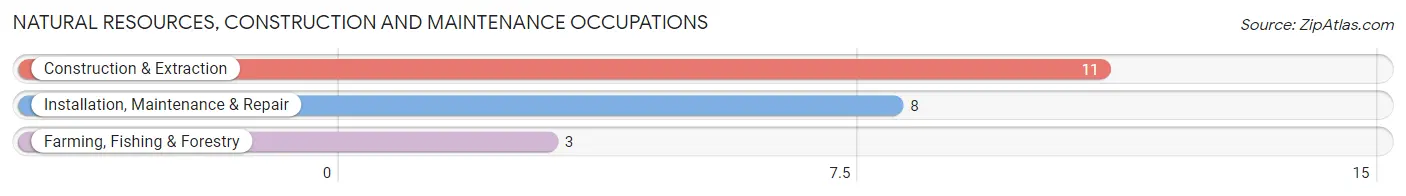
Natural Resources, Construction and Maintenance Occupations
The most common Natural Resources, Construction and Maintenance occupations in Williamsburg are Construction & Extraction (11 | 6.6%), Installation, Maintenance & Repair (8 | 4.8%), and Farming, Fishing & Forestry (3 | 1.8%).
Natural Resources, Construction and Maintenance Occupations by Sex
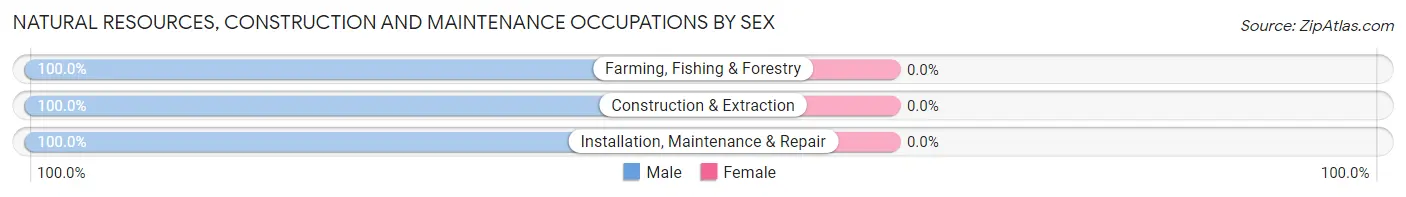
| Occupation | Male | Female |
| Farming, Fishing & Forestry | 3 (100.0%) | 0 (0.0%) |
| Construction & Extraction | 11 (100.0%) | 0 (0.0%) |
| Installation, Maintenance & Repair | 8 (100.0%) | 0 (0.0%) |
| Total (Category) | 22 (100.0%) | 0 (0.0%) |
| Total (Overall) | 91 (54.8%) | 75 (45.2%) |
Production, Transportation and Moving Occupations
The most common Production, Transportation and Moving occupations in Williamsburg are Transportation (18 | 10.8%), Production (15 | 9.0%), and Material Moving (10 | 6.0%).
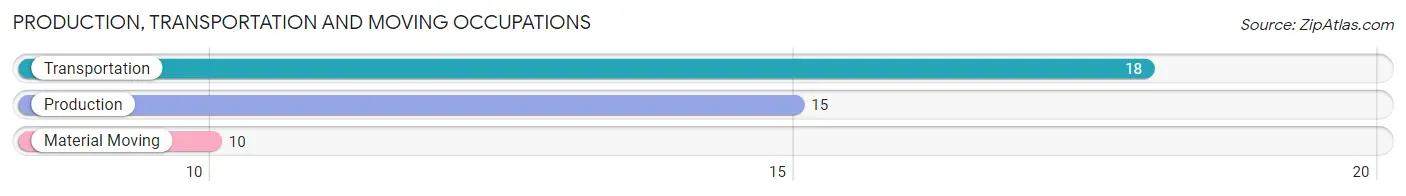
Production, Transportation and Moving Occupations by Sex
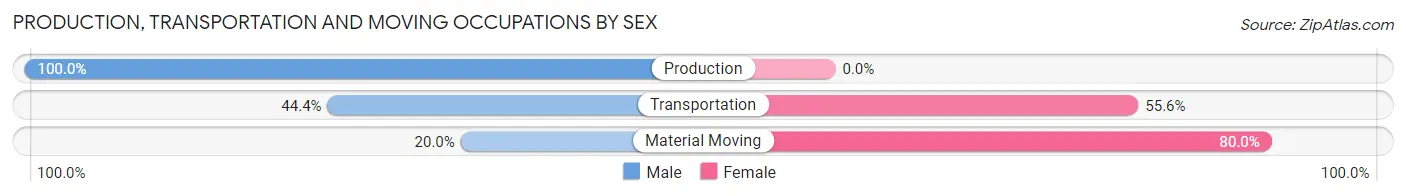
| Occupation | Male | Female |
| Production | 15 (100.0%) | 0 (0.0%) |
| Transportation | 8 (44.4%) | 10 (55.6%) |
| Material Moving | 2 (20.0%) | 8 (80.0%) |
| Total (Category) | 25 (58.1%) | 18 (41.9%) |
| Total (Overall) | 91 (54.8%) | 75 (45.2%) |
Employment Industries by Sex in Williamsburg
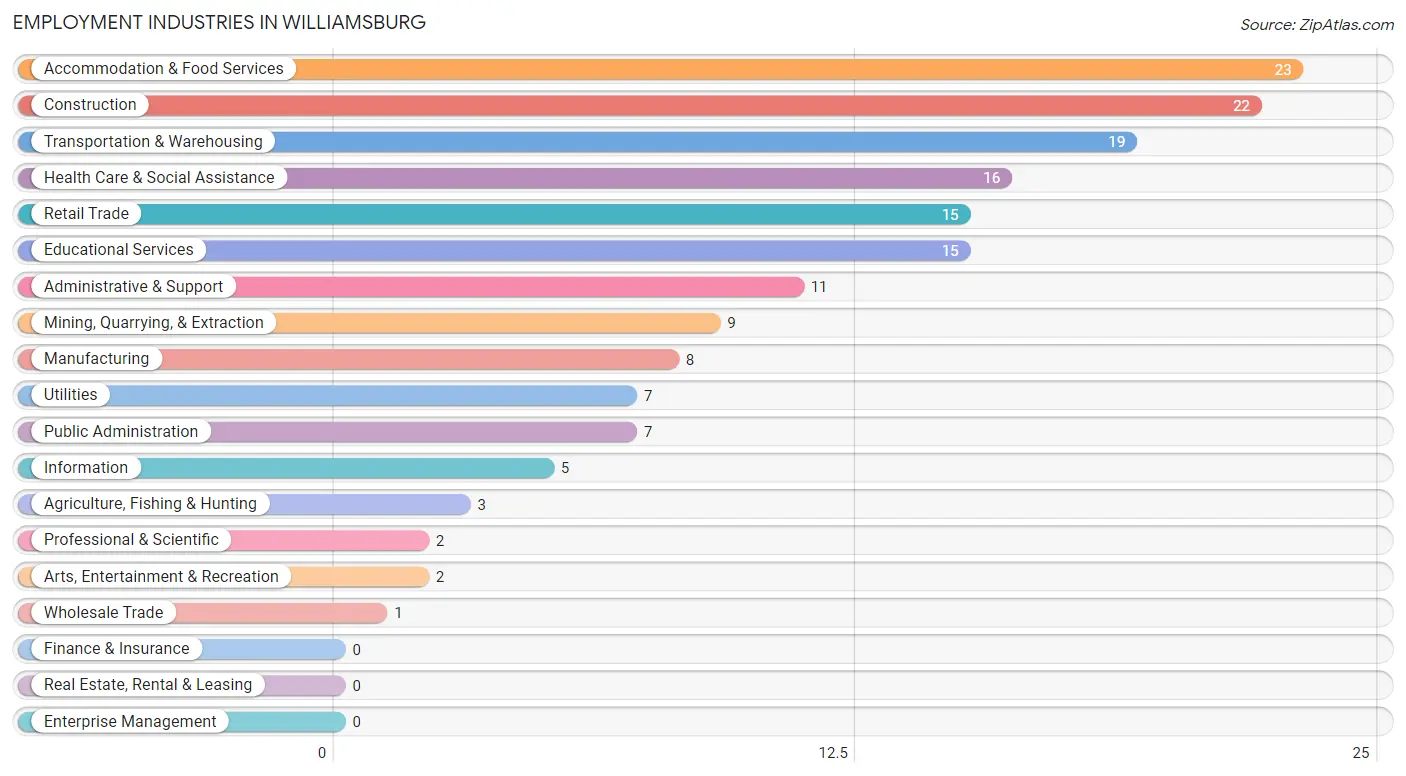
Employment Industries in Williamsburg
The major employment industries in Williamsburg include Accommodation & Food Services (23 | 13.9%), Construction (22 | 13.3%), Transportation & Warehousing (19 | 11.5%), Health Care & Social Assistance (16 | 9.6%), and Retail Trade (15 | 9.0%).
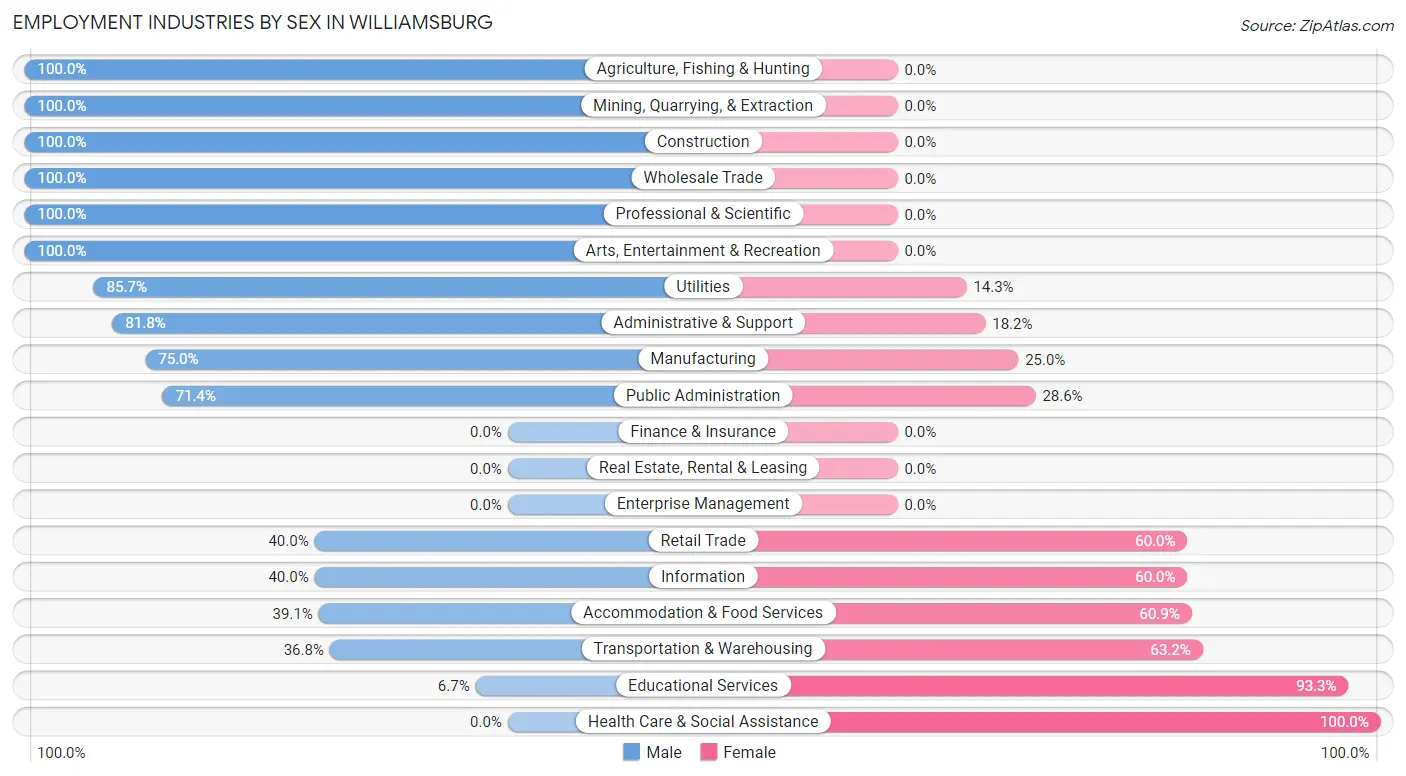
Employment Industries by Sex in Williamsburg
The Williamsburg industries that see more men than women are Agriculture, Fishing & Hunting (100.0%), Mining, Quarrying, & Extraction (100.0%), and Construction (100.0%), whereas the industries that tend to have a higher number of women are Health Care & Social Assistance (100.0%), Educational Services (93.3%), and Transportation & Warehousing (63.2%).
| Industry | Male | Female |
| Agriculture, Fishing & Hunting | 3 (100.0%) | 0 (0.0%) |
| Mining, Quarrying, & Extraction | 9 (100.0%) | 0 (0.0%) |
| Construction | 22 (100.0%) | 0 (0.0%) |
| Manufacturing | 6 (75.0%) | 2 (25.0%) |
| Wholesale Trade | 1 (100.0%) | 0 (0.0%) |
| Retail Trade | 6 (40.0%) | 9 (60.0%) |
| Transportation & Warehousing | 7 (36.8%) | 12 (63.2%) |
| Utilities | 6 (85.7%) | 1 (14.3%) |
| Information | 2 (40.0%) | 3 (60.0%) |
| Finance & Insurance | 0 (0.0%) | 0 (0.0%) |
| Real Estate, Rental & Leasing | 0 (0.0%) | 0 (0.0%) |
| Professional & Scientific | 2 (100.0%) | 0 (0.0%) |
| Enterprise Management | 0 (0.0%) | 0 (0.0%) |
| Administrative & Support | 9 (81.8%) | 2 (18.2%) |
| Educational Services | 1 (6.7%) | 14 (93.3%) |
| Health Care & Social Assistance | 0 (0.0%) | 16 (100.0%) |
| Arts, Entertainment & Recreation | 2 (100.0%) | 0 (0.0%) |
| Accommodation & Food Services | 9 (39.1%) | 14 (60.9%) |
| Public Administration | 5 (71.4%) | 2 (28.6%) |
| Total | 91 (54.8%) | 75 (45.2%) |
Education in Williamsburg
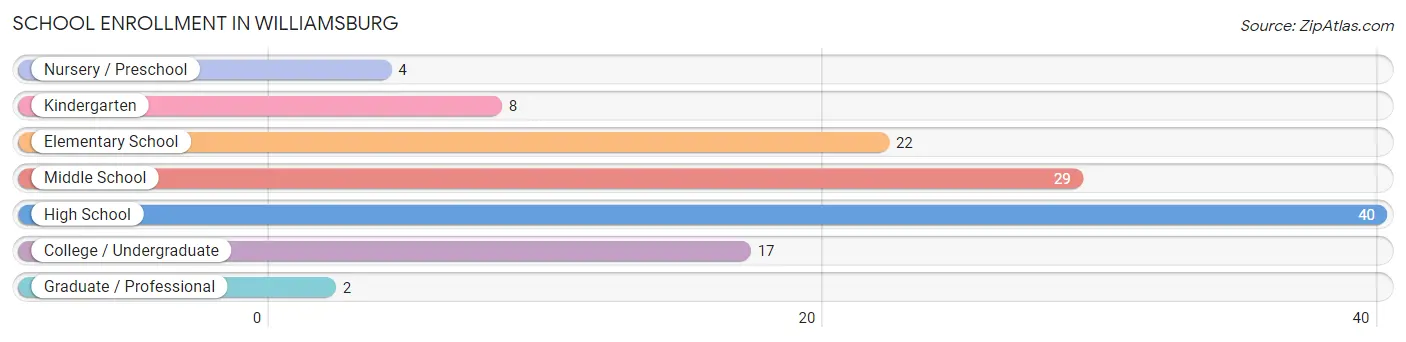
School Enrollment in Williamsburg
The most common levels of schooling among the 122 students in Williamsburg are high school (40 | 32.8%), middle school (29 | 23.8%), and elementary school (22 | 18.0%).
| School Level | # Students | % Students |
| Nursery / Preschool | 4 | 3.3% |
| Kindergarten | 8 | 6.6% |
| Elementary School | 22 | 18.0% |
| Middle School | 29 | 23.8% |
| High School | 40 | 32.8% |
| College / Undergraduate | 17 | 13.9% |
| Graduate / Professional | 2 | 1.6% |
| Total | 122 | 100.0% |
School Enrollment by Age by Funding Source in Williamsburg
Out of a total of 122 students who are enrolled in schools in Williamsburg, 5 (4.1%) attend a private institution, while the remaining 117 (95.9%) are enrolled in public schools. The age group of 20 to 24 year olds has the highest likelihood of being enrolled in private schools, with 2 (100.0% in the age bracket) enrolled. Conversely, the age group of 3 to 4 year olds has the lowest likelihood of being enrolled in a private school, with 2 (100.0% in the age bracket) attending a public institution.
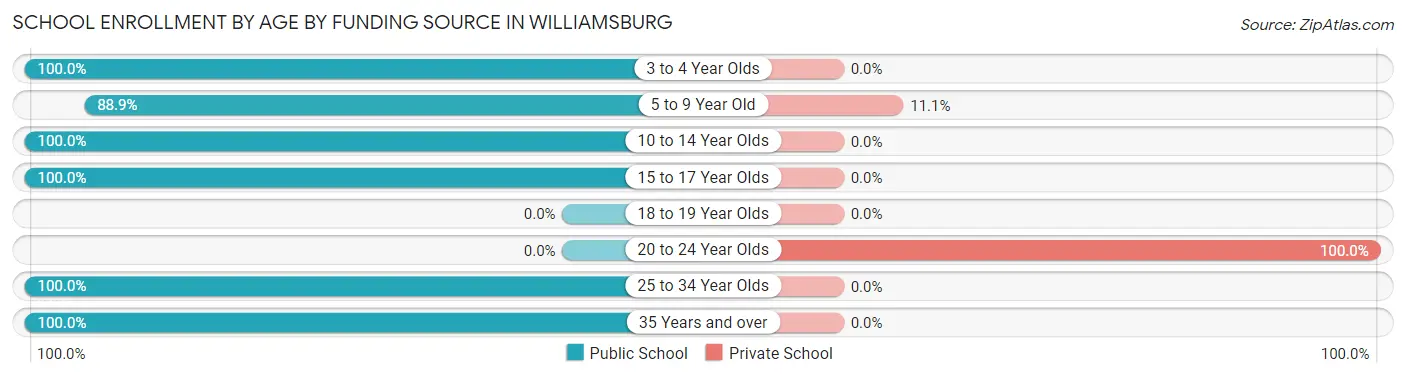
| Age Bracket | Public School | Private School |
| 3 to 4 Year Olds | 2 (100.0%) | 0 (0.0%) |
| 5 to 9 Year Old | 24 (88.9%) | 3 (11.1%) |
| 10 to 14 Year Olds | 46 (100.0%) | 0 (0.0%) |
| 15 to 17 Year Olds | 28 (100.0%) | 0 (0.0%) |
| 18 to 19 Year Olds | 0 (0.0%) | 0 (0.0%) |
| 20 to 24 Year Olds | 0 (0.0%) | 2 (100.0%) |
| 25 to 34 Year Olds | 5 (100.0%) | 0 (0.0%) |
| 35 Years and over | 12 (100.0%) | 0 (0.0%) |
| Total | 117 (95.9%) | 5 (4.1%) |
Educational Attainment by Field of Study in Williamsburg
Bio, nature & agricultural (4 | 36.4%), education (4 | 36.4%), business (2 | 18.2%), and psychology (1 | 9.1%) are the most common fields of study among 11 individuals in Williamsburg who have obtained a bachelor's degree or higher.
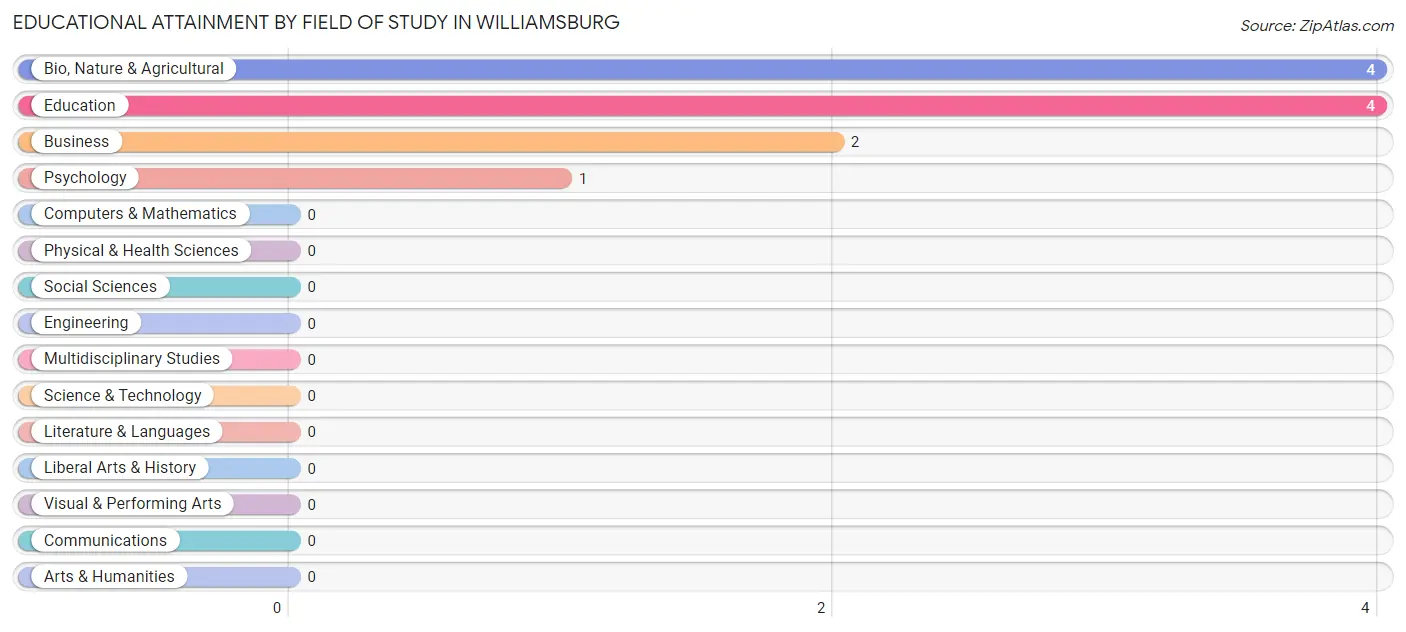
| Field of Study | # Graduates | % Graduates |
| Computers & Mathematics | 0 | 0.0% |
| Bio, Nature & Agricultural | 4 | 36.4% |
| Physical & Health Sciences | 0 | 0.0% |
| Psychology | 1 | 9.1% |
| Social Sciences | 0 | 0.0% |
| Engineering | 0 | 0.0% |
| Multidisciplinary Studies | 0 | 0.0% |
| Science & Technology | 0 | 0.0% |
| Business | 2 | 18.2% |
| Education | 4 | 36.4% |
| Literature & Languages | 0 | 0.0% |
| Liberal Arts & History | 0 | 0.0% |
| Visual & Performing Arts | 0 | 0.0% |
| Communications | 0 | 0.0% |
| Arts & Humanities | 0 | 0.0% |
| Total | 11 | 100.0% |
Transportation & Commute in Williamsburg
Vehicle Availability by Sex in Williamsburg
The most prevalent vehicle ownership categories in Williamsburg are males with 2 vehicles (37, accounting for 40.7%) and females with 2 vehicles (47, making up 49.3%).
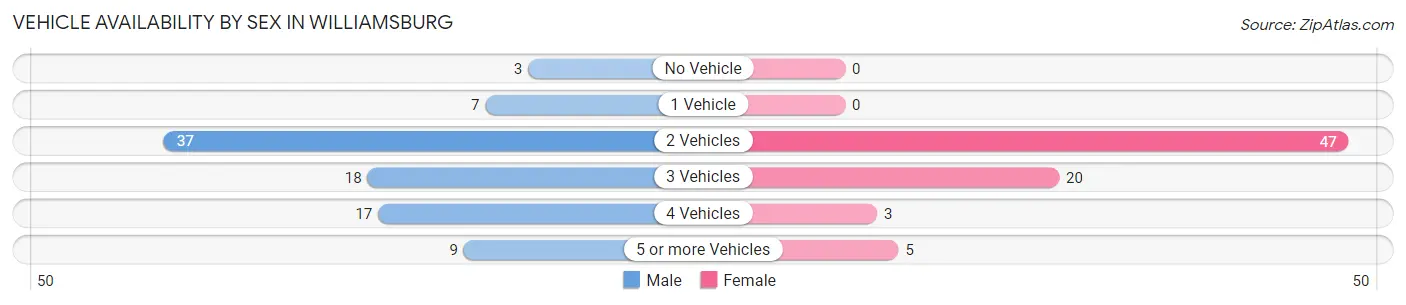
| Vehicles Available | Male | Female |
| No Vehicle | 3 (3.3%) | 0 (0.0%) |
| 1 Vehicle | 7 (7.7%) | 0 (0.0%) |
| 2 Vehicles | 37 (40.7%) | 47 (62.7%) |
| 3 Vehicles | 18 (19.8%) | 20 (26.7%) |
| 4 Vehicles | 17 (18.7%) | 3 (4.0%) |
| 5 or more Vehicles | 9 (9.9%) | 5 (6.7%) |
| Total | 91 (100.0%) | 75 (100.0%) |
Commute Time in Williamsburg
The most frequently occuring commute durations in Williamsburg are 15 to 19 minutes (46 commuters, 29.1%), 45 to 59 minutes (35 commuters, 22.2%), and 20 to 24 minutes (27 commuters, 17.1%).
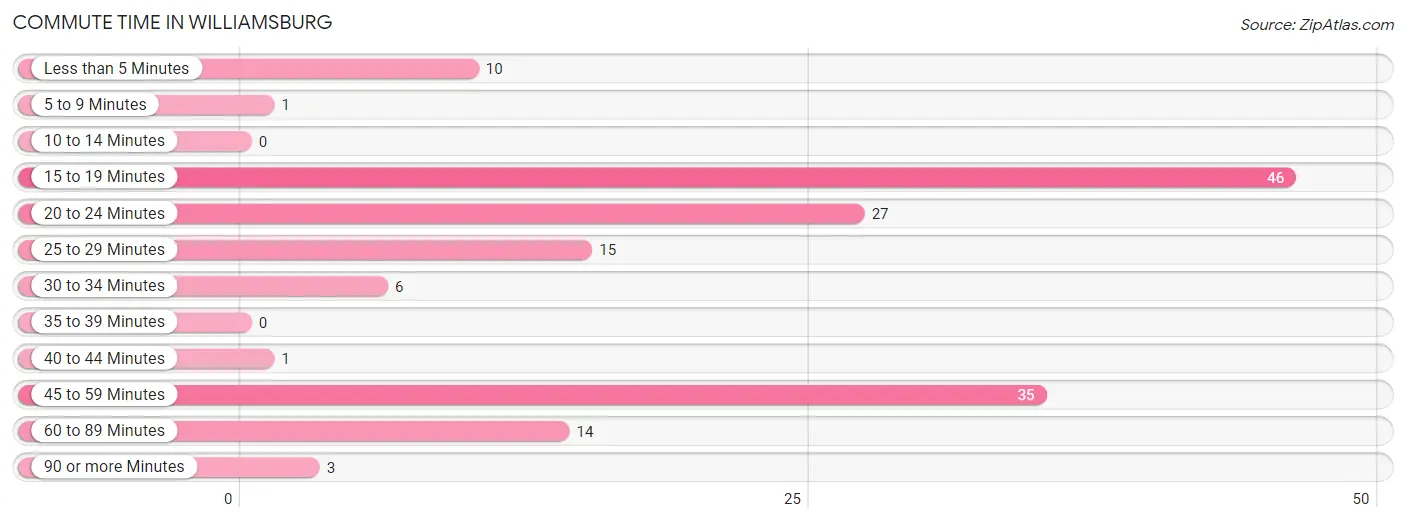
| Commute Time | # Commuters | % Commuters |
| Less than 5 Minutes | 10 | 6.3% |
| 5 to 9 Minutes | 1 | 0.6% |
| 10 to 14 Minutes | 0 | 0.0% |
| 15 to 19 Minutes | 46 | 29.1% |
| 20 to 24 Minutes | 27 | 17.1% |
| 25 to 29 Minutes | 15 | 9.5% |
| 30 to 34 Minutes | 6 | 3.8% |
| 35 to 39 Minutes | 0 | 0.0% |
| 40 to 44 Minutes | 1 | 0.6% |
| 45 to 59 Minutes | 35 | 22.2% |
| 60 to 89 Minutes | 14 | 8.9% |
| 90 or more Minutes | 3 | 1.9% |
Commute Time by Sex in Williamsburg
The most common commute times in Williamsburg are 20 to 24 minutes (22 commuters, 24.2%) for males and 15 to 19 minutes (35 commuters, 52.2%) for females.
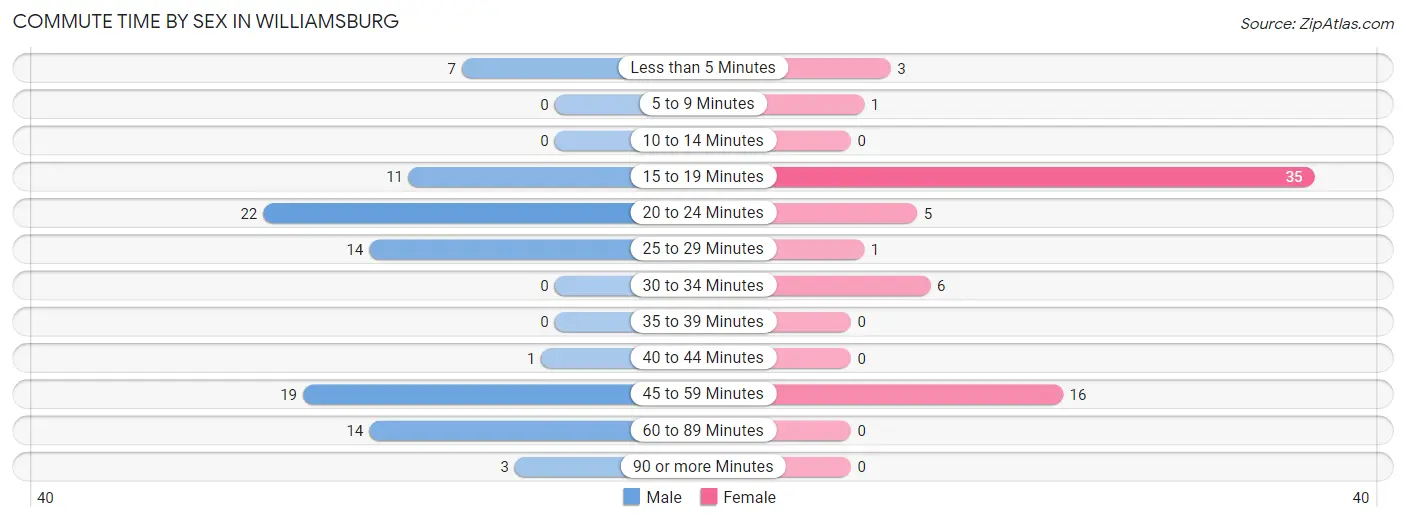
| Commute Time | Male | Female |
| Less than 5 Minutes | 7 (7.7%) | 3 (4.5%) |
| 5 to 9 Minutes | 0 (0.0%) | 1 (1.5%) |
| 10 to 14 Minutes | 0 (0.0%) | 0 (0.0%) |
| 15 to 19 Minutes | 11 (12.1%) | 35 (52.2%) |
| 20 to 24 Minutes | 22 (24.2%) | 5 (7.5%) |
| 25 to 29 Minutes | 14 (15.4%) | 1 (1.5%) |
| 30 to 34 Minutes | 0 (0.0%) | 6 (9.0%) |
| 35 to 39 Minutes | 0 (0.0%) | 0 (0.0%) |
| 40 to 44 Minutes | 1 (1.1%) | 0 (0.0%) |
| 45 to 59 Minutes | 19 (20.9%) | 16 (23.9%) |
| 60 to 89 Minutes | 14 (15.4%) | 0 (0.0%) |
| 90 or more Minutes | 3 (3.3%) | 0 (0.0%) |
Time of Departure to Work by Sex in Williamsburg
The most frequent times of departure to work in Williamsburg are 6:00 AM to 6:29 AM (20, 22.0%) for males and 7:30 AM to 7:59 AM (12, 17.9%) for females.
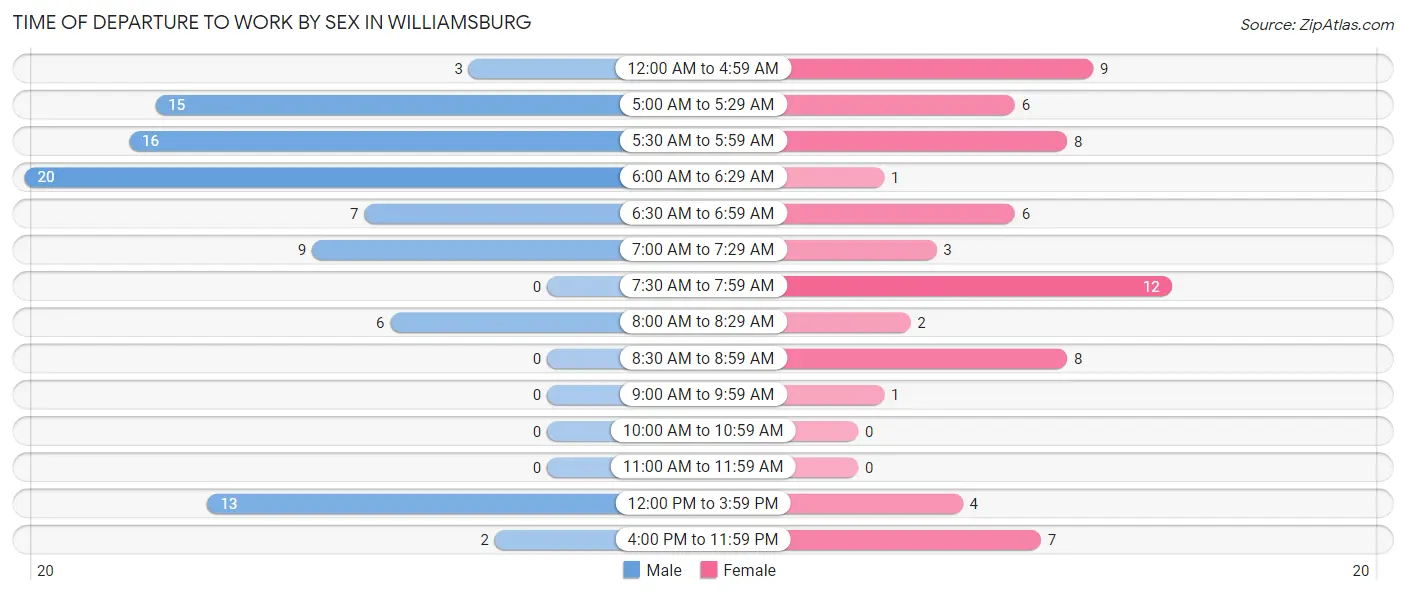
| Time of Departure | Male | Female |
| 12:00 AM to 4:59 AM | 3 (3.3%) | 9 (13.4%) |
| 5:00 AM to 5:29 AM | 15 (16.5%) | 6 (9.0%) |
| 5:30 AM to 5:59 AM | 16 (17.6%) | 8 (11.9%) |
| 6:00 AM to 6:29 AM | 20 (22.0%) | 1 (1.5%) |
| 6:30 AM to 6:59 AM | 7 (7.7%) | 6 (9.0%) |
| 7:00 AM to 7:29 AM | 9 (9.9%) | 3 (4.5%) |
| 7:30 AM to 7:59 AM | 0 (0.0%) | 12 (17.9%) |
| 8:00 AM to 8:29 AM | 6 (6.6%) | 2 (3.0%) |
| 8:30 AM to 8:59 AM | 0 (0.0%) | 8 (11.9%) |
| 9:00 AM to 9:59 AM | 0 (0.0%) | 1 (1.5%) |
| 10:00 AM to 10:59 AM | 0 (0.0%) | 0 (0.0%) |
| 11:00 AM to 11:59 AM | 0 (0.0%) | 0 (0.0%) |
| 12:00 PM to 3:59 PM | 13 (14.3%) | 4 (6.0%) |
| 4:00 PM to 11:59 PM | 2 (2.2%) | 7 (10.4%) |
| Total | 91 (100.0%) | 67 (100.0%) |
Housing Occupancy in Williamsburg
Occupancy by Ownership in Williamsburg
Of the total 132 dwellings in Williamsburg, owner-occupied units account for 95 (72.0%), while renter-occupied units make up 37 (28.0%).
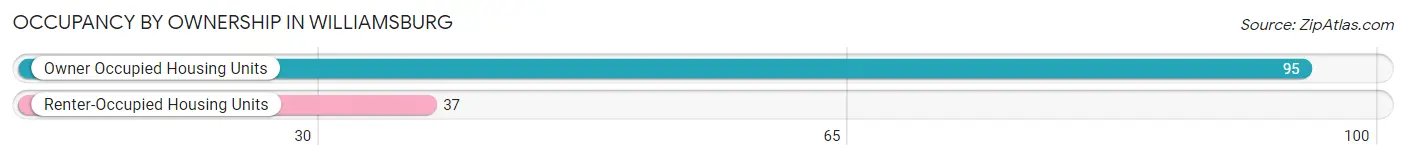
| Occupancy | # Housing Units | % Housing Units |
| Owner Occupied Housing Units | 95 | 72.0% |
| Renter-Occupied Housing Units | 37 | 28.0% |
| Total Occupied Housing Units | 132 | 100.0% |
Occupancy by Household Size in Williamsburg
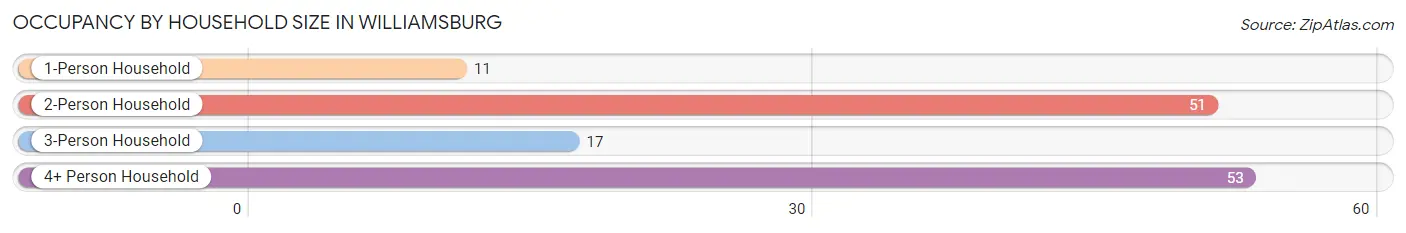
| Household Size | # Housing Units | % Housing Units |
| 1-Person Household | 11 | 8.3% |
| 2-Person Household | 51 | 38.6% |
| 3-Person Household | 17 | 12.9% |
| 4+ Person Household | 53 | 40.2% |
| Total Housing Units | 132 | 100.0% |
Occupancy by Ownership by Household Size in Williamsburg
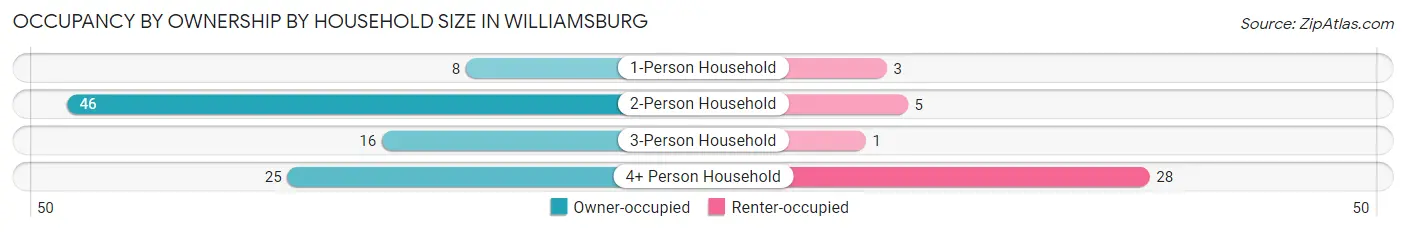
| Household Size | Owner-occupied | Renter-occupied |
| 1-Person Household | 8 (72.7%) | 3 (27.3%) |
| 2-Person Household | 46 (90.2%) | 5 (9.8%) |
| 3-Person Household | 16 (94.1%) | 1 (5.9%) |
| 4+ Person Household | 25 (47.2%) | 28 (52.8%) |
| Total Housing Units | 95 (72.0%) | 37 (28.0%) |
Occupancy by Educational Attainment in Williamsburg
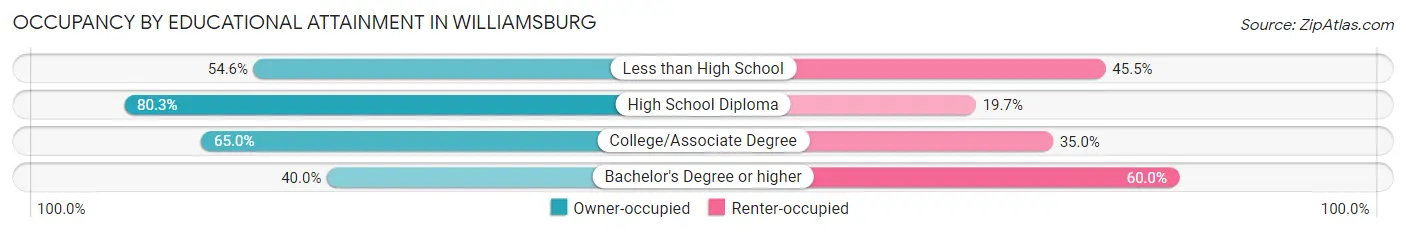
| Household Size | Owner-occupied | Renter-occupied |
| Less than High School | 6 (54.5%) | 5 (45.5%) |
| High School Diploma | 61 (80.3%) | 15 (19.7%) |
| College/Associate Degree | 26 (65.0%) | 14 (35.0%) |
| Bachelor's Degree or higher | 2 (40.0%) | 3 (60.0%) |
Occupancy by Age of Householder in Williamsburg
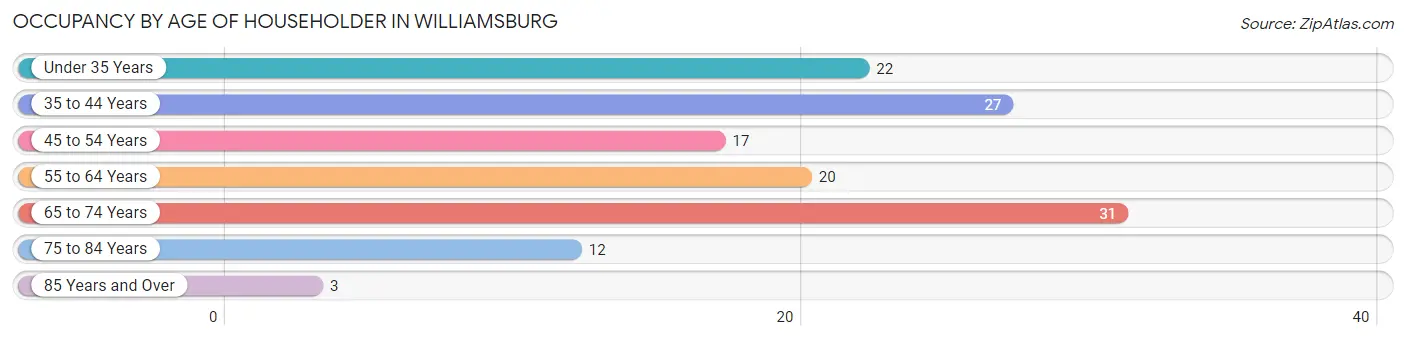
| Age Bracket | # Households | % Households |
| Under 35 Years | 22 | 16.7% |
| 35 to 44 Years | 27 | 20.4% |
| 45 to 54 Years | 17 | 12.9% |
| 55 to 64 Years | 20 | 15.1% |
| 65 to 74 Years | 31 | 23.5% |
| 75 to 84 Years | 12 | 9.1% |
| 85 Years and Over | 3 | 2.3% |
| Total | 132 | 100.0% |
Housing Finances in Williamsburg
Median Income by Occupancy in Williamsburg
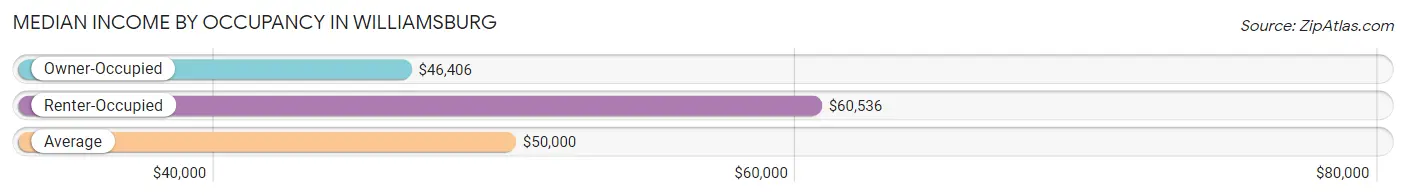
| Occupancy Type | # Households | Median Income |
| Owner-Occupied | 95 (72.0%) | $46,406 |
| Renter-Occupied | 37 (28.0%) | $60,536 |
| Average | 132 (100.0%) | $50,000 |
Occupancy by Householder Income Bracket in Williamsburg
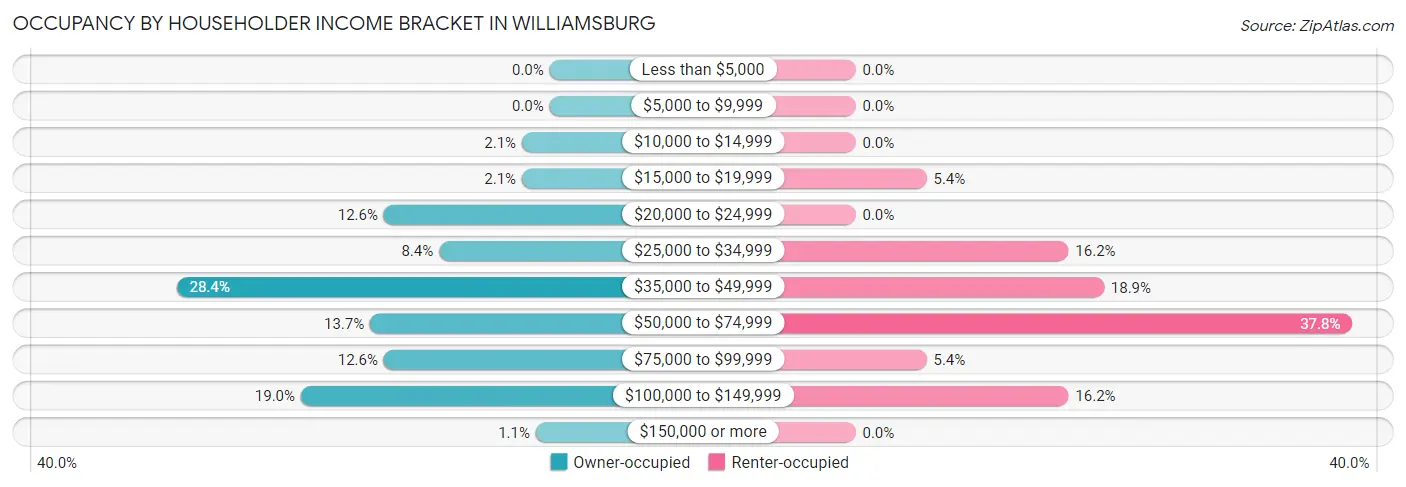
| Income Bracket | Owner-occupied | Renter-occupied |
| Less than $5,000 | 0 (0.0%) | 0 (0.0%) |
| $5,000 to $9,999 | 0 (0.0%) | 0 (0.0%) |
| $10,000 to $14,999 | 2 (2.1%) | 0 (0.0%) |
| $15,000 to $19,999 | 2 (2.1%) | 2 (5.4%) |
| $20,000 to $24,999 | 12 (12.6%) | 0 (0.0%) |
| $25,000 to $34,999 | 8 (8.4%) | 6 (16.2%) |
| $35,000 to $49,999 | 27 (28.4%) | 7 (18.9%) |
| $50,000 to $74,999 | 13 (13.7%) | 14 (37.8%) |
| $75,000 to $99,999 | 12 (12.6%) | 2 (5.4%) |
| $100,000 to $149,999 | 18 (19.0%) | 6 (16.2%) |
| $150,000 or more | 1 (1.1%) | 0 (0.0%) |
| Total | 95 (100.0%) | 37 (100.0%) |
Monthly Housing Cost Tiers in Williamsburg
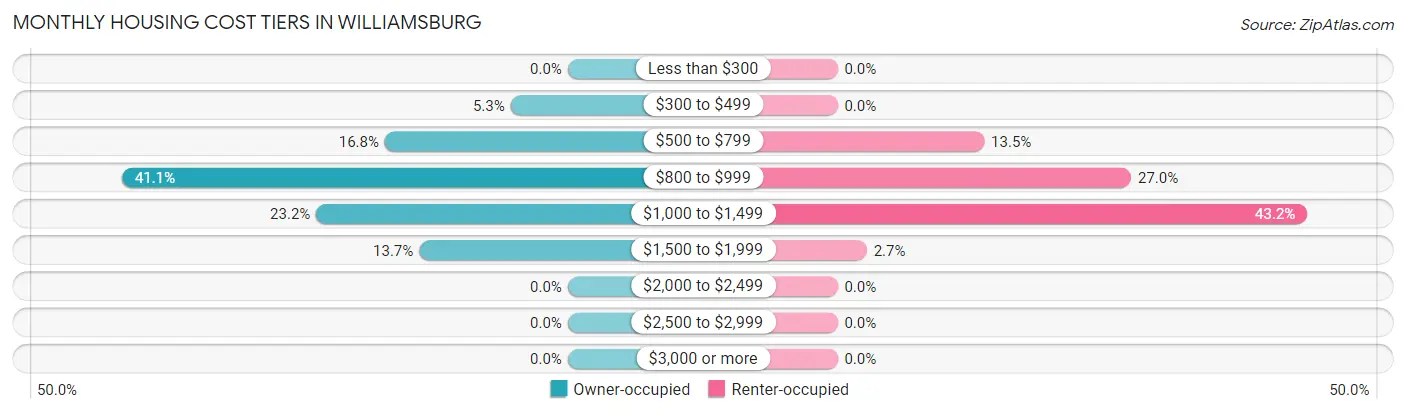
| Monthly Cost | Owner-occupied | Renter-occupied |
| Less than $300 | 0 (0.0%) | 0 (0.0%) |
| $300 to $499 | 5 (5.3%) | 0 (0.0%) |
| $500 to $799 | 16 (16.8%) | 5 (13.5%) |
| $800 to $999 | 39 (41.0%) | 10 (27.0%) |
| $1,000 to $1,499 | 22 (23.2%) | 16 (43.2%) |
| $1,500 to $1,999 | 13 (13.7%) | 1 (2.7%) |
| $2,000 to $2,499 | 0 (0.0%) | 0 (0.0%) |
| $2,500 to $2,999 | 0 (0.0%) | 0 (0.0%) |
| $3,000 or more | 0 (0.0%) | 0 (0.0%) |
| Total | 95 (100.0%) | 37 (100.0%) |
Physical Housing Characteristics in Williamsburg
Housing Structures in Williamsburg
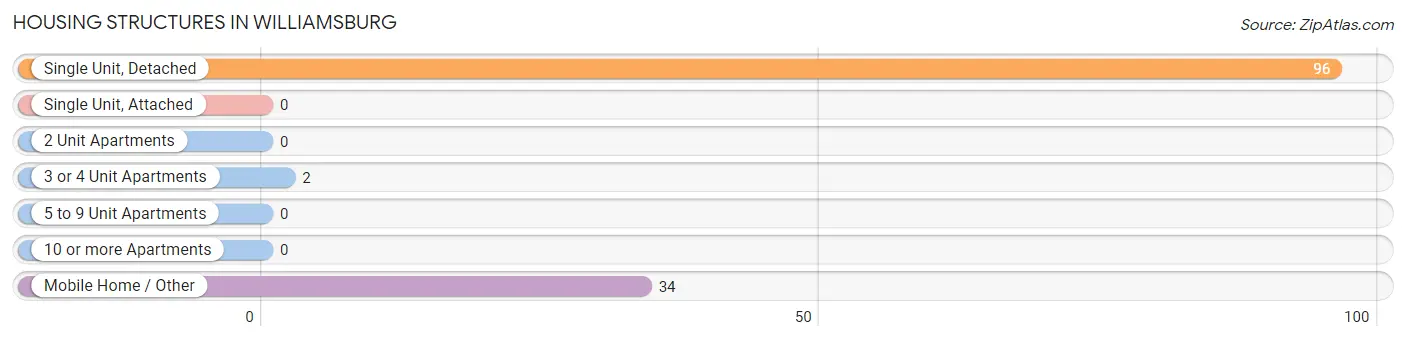
| Structure Type | # Housing Units | % Housing Units |
| Single Unit, Detached | 96 | 72.7% |
| Single Unit, Attached | 0 | 0.0% |
| 2 Unit Apartments | 0 | 0.0% |
| 3 or 4 Unit Apartments | 2 | 1.5% |
| 5 to 9 Unit Apartments | 0 | 0.0% |
| 10 or more Apartments | 0 | 0.0% |
| Mobile Home / Other | 34 | 25.8% |
| Total | 132 | 100.0% |
Housing Structures by Occupancy in Williamsburg
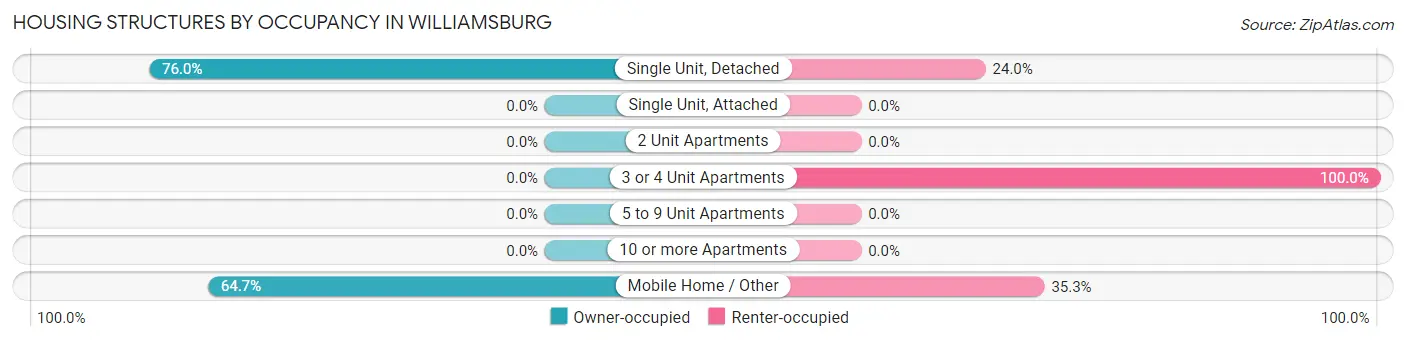
| Structure Type | Owner-occupied | Renter-occupied |
| Single Unit, Detached | 73 (76.0%) | 23 (24.0%) |
| Single Unit, Attached | 0 (0.0%) | 0 (0.0%) |
| 2 Unit Apartments | 0 (0.0%) | 0 (0.0%) |
| 3 or 4 Unit Apartments | 0 (0.0%) | 2 (100.0%) |
| 5 to 9 Unit Apartments | 0 (0.0%) | 0 (0.0%) |
| 10 or more Apartments | 0 (0.0%) | 0 (0.0%) |
| Mobile Home / Other | 22 (64.7%) | 12 (35.3%) |
| Total | 95 (72.0%) | 37 (28.0%) |
Housing Structures by Number of Rooms in Williamsburg
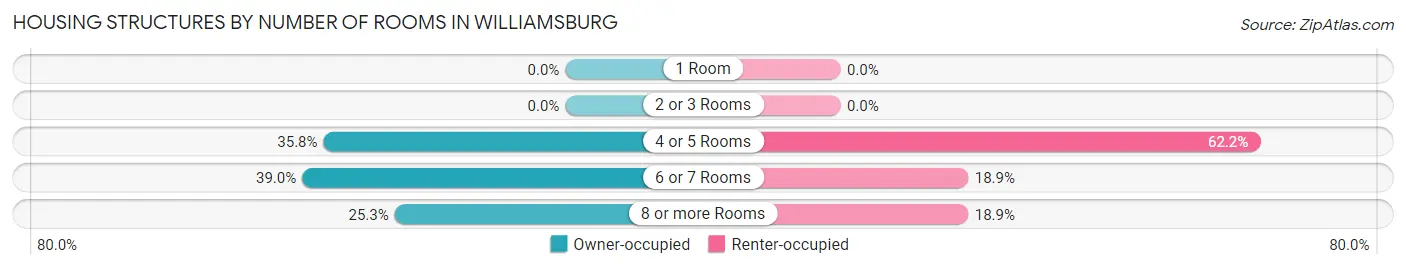
| Number of Rooms | Owner-occupied | Renter-occupied |
| 1 Room | 0 (0.0%) | 0 (0.0%) |
| 2 or 3 Rooms | 0 (0.0%) | 0 (0.0%) |
| 4 or 5 Rooms | 34 (35.8%) | 23 (62.2%) |
| 6 or 7 Rooms | 37 (39.0%) | 7 (18.9%) |
| 8 or more Rooms | 24 (25.3%) | 7 (18.9%) |
| Total | 95 (100.0%) | 37 (100.0%) |
Housing Structure by Heating Type in Williamsburg
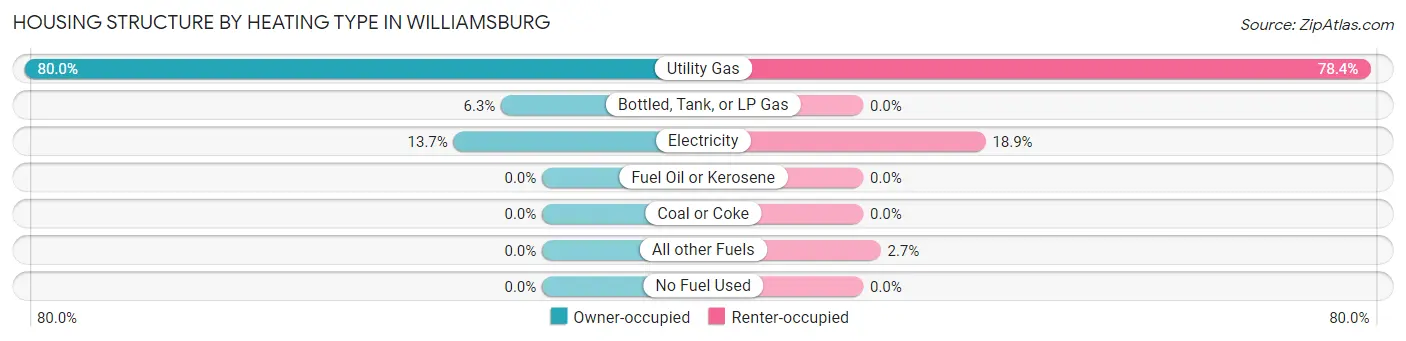
| Heating Type | Owner-occupied | Renter-occupied |
| Utility Gas | 76 (80.0%) | 29 (78.4%) |
| Bottled, Tank, or LP Gas | 6 (6.3%) | 0 (0.0%) |
| Electricity | 13 (13.7%) | 7 (18.9%) |
| Fuel Oil or Kerosene | 0 (0.0%) | 0 (0.0%) |
| Coal or Coke | 0 (0.0%) | 0 (0.0%) |
| All other Fuels | 0 (0.0%) | 1 (2.7%) |
| No Fuel Used | 0 (0.0%) | 0 (0.0%) |
| Total | 95 (100.0%) | 37 (100.0%) |
Household Vehicle Usage in Williamsburg
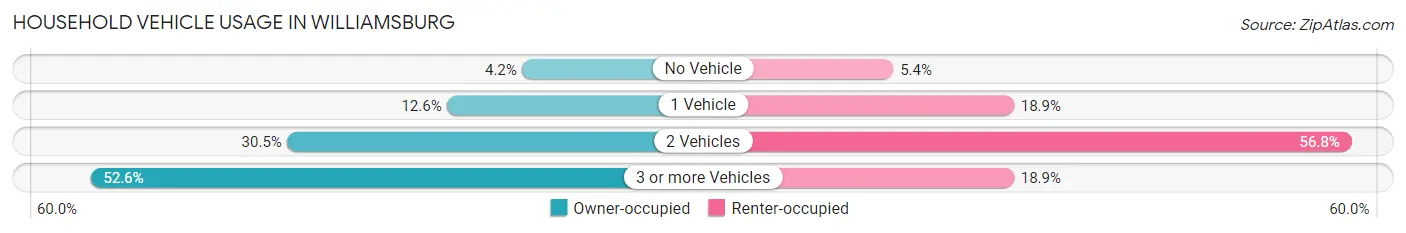
| Vehicles per Household | Owner-occupied | Renter-occupied |
| No Vehicle | 4 (4.2%) | 2 (5.4%) |
| 1 Vehicle | 12 (12.6%) | 7 (18.9%) |
| 2 Vehicles | 29 (30.5%) | 21 (56.8%) |
| 3 or more Vehicles | 50 (52.6%) | 7 (18.9%) |
| Total | 95 (100.0%) | 37 (100.0%) |
Real Estate & Mortgages in Williamsburg
Real Estate and Mortgage Overview in Williamsburg
| Characteristic | Without Mortgage | With Mortgage |
| Housing Units | 35 | 60 |
| Median Property Value | $135,900 | $102,900 |
| Median Household Income | $45,469 | $1 |
| Monthly Housing Costs | $775 | $0 |
| Real Estate Taxes | $2,250 | $2 |
Property Value by Mortgage Status in Williamsburg
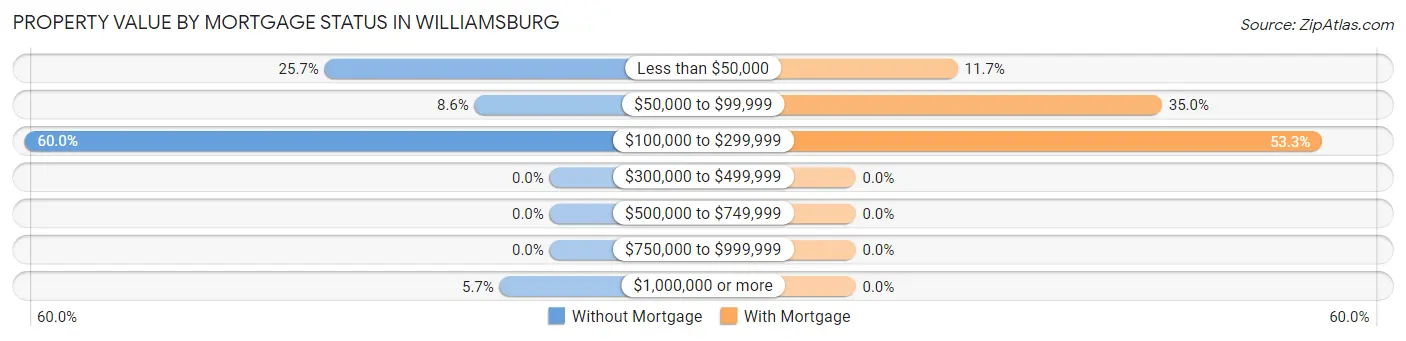
| Property Value | Without Mortgage | With Mortgage |
| Less than $50,000 | 9 (25.7%) | 7 (11.7%) |
| $50,000 to $99,999 | 3 (8.6%) | 21 (35.0%) |
| $100,000 to $299,999 | 21 (60.0%) | 32 (53.3%) |
| $300,000 to $499,999 | 0 (0.0%) | 0 (0.0%) |
| $500,000 to $749,999 | 0 (0.0%) | 0 (0.0%) |
| $750,000 to $999,999 | 0 (0.0%) | 0 (0.0%) |
| $1,000,000 or more | 2 (5.7%) | 0 (0.0%) |
| Total | 35 (100.0%) | 60 (100.0%) |
Household Income by Mortgage Status in Williamsburg
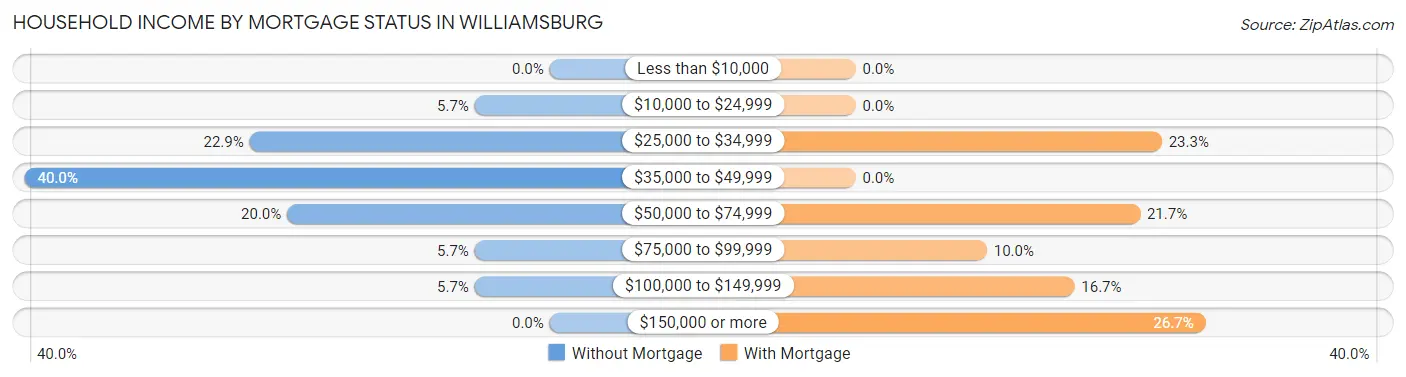
| Household Income | Without Mortgage | With Mortgage |
| Less than $10,000 | 0 (0.0%) | 0 (0.0%) |
| $10,000 to $24,999 | 2 (5.7%) | 0 (0.0%) |
| $25,000 to $34,999 | 8 (22.9%) | 14 (23.3%) |
| $35,000 to $49,999 | 14 (40.0%) | 0 (0.0%) |
| $50,000 to $74,999 | 7 (20.0%) | 13 (21.7%) |
| $75,000 to $99,999 | 2 (5.7%) | 6 (10.0%) |
| $100,000 to $149,999 | 2 (5.7%) | 10 (16.7%) |
| $150,000 or more | 0 (0.0%) | 16 (26.7%) |
| Total | 35 (100.0%) | 60 (100.0%) |
Property Value to Household Income Ratio in Williamsburg
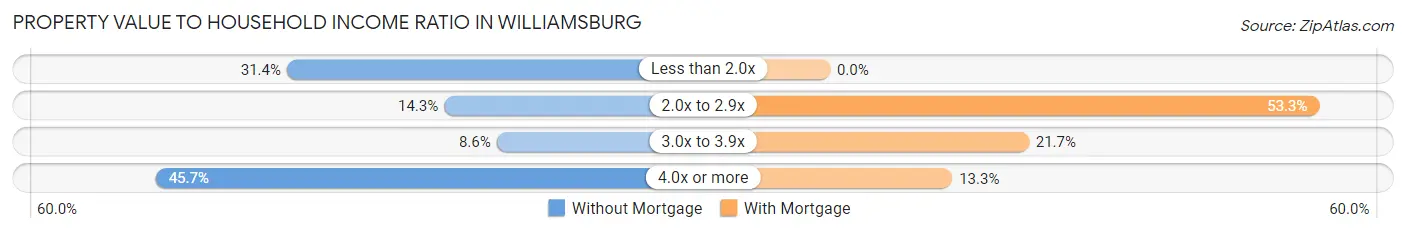
| Value-to-Income Ratio | Without Mortgage | With Mortgage |
| Less than 2.0x | 11 (31.4%) | 0 (0.0%) |
| 2.0x to 2.9x | 5 (14.3%) | 32 (53.3%) |
| 3.0x to 3.9x | 3 (8.6%) | 13 (21.7%) |
| 4.0x or more | 16 (45.7%) | 8 (13.3%) |
| Total | 35 (100.0%) | 60 (100.0%) |
Real Estate Taxes by Mortgage Status in Williamsburg
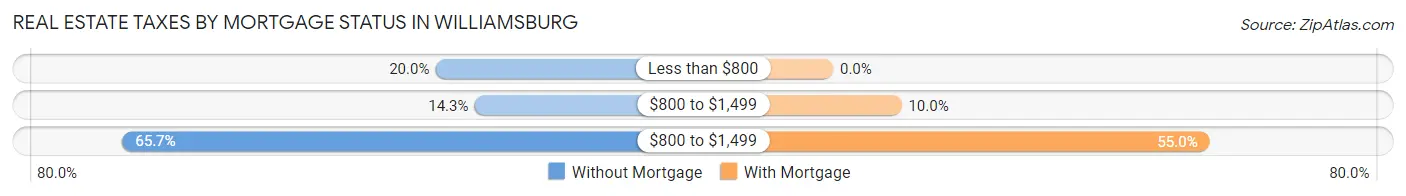
| Property Taxes | Without Mortgage | With Mortgage |
| Less than $800 | 7 (20.0%) | 0 (0.0%) |
| $800 to $1,499 | 5 (14.3%) | 6 (10.0%) |
| $800 to $1,499 | 23 (65.7%) | 33 (55.0%) |
| Total | 35 (100.0%) | 60 (100.0%) |
Health & Disability in Williamsburg
Health Insurance Coverage by Age in Williamsburg
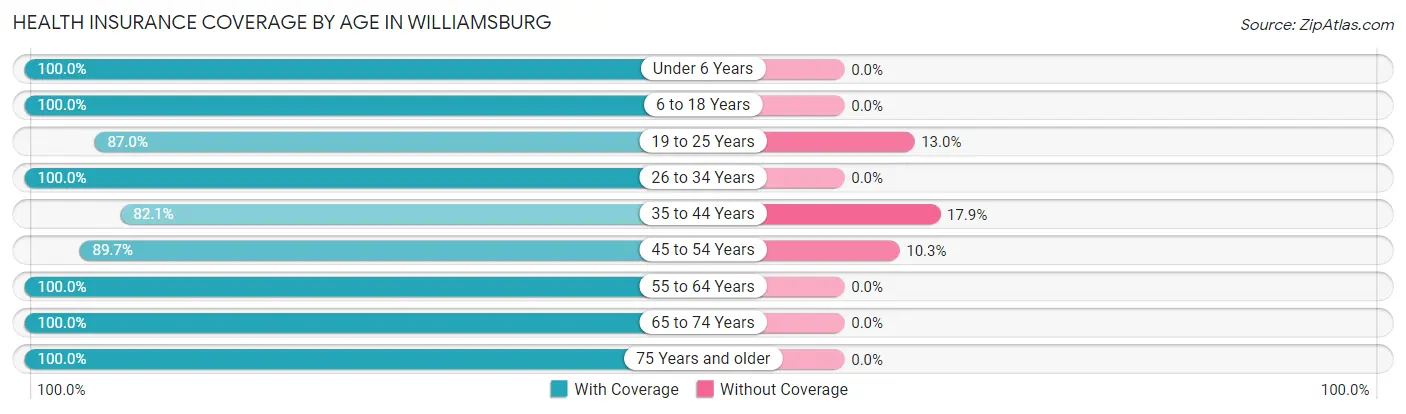
| Age Bracket | With Coverage | Without Coverage |
| Under 6 Years | 42 (100.0%) | 0 (0.0%) |
| 6 to 18 Years | 100 (100.0%) | 0 (0.0%) |
| 19 to 25 Years | 20 (87.0%) | 3 (13.0%) |
| 26 to 34 Years | 52 (100.0%) | 0 (0.0%) |
| 35 to 44 Years | 46 (82.1%) | 10 (17.9%) |
| 45 to 54 Years | 35 (89.7%) | 4 (10.3%) |
| 55 to 64 Years | 41 (100.0%) | 0 (0.0%) |
| 65 to 74 Years | 50 (100.0%) | 0 (0.0%) |
| 75 Years and older | 26 (100.0%) | 0 (0.0%) |
| Total | 412 (96.0%) | 17 (4.0%) |
Health Insurance Coverage by Citizenship Status in Williamsburg
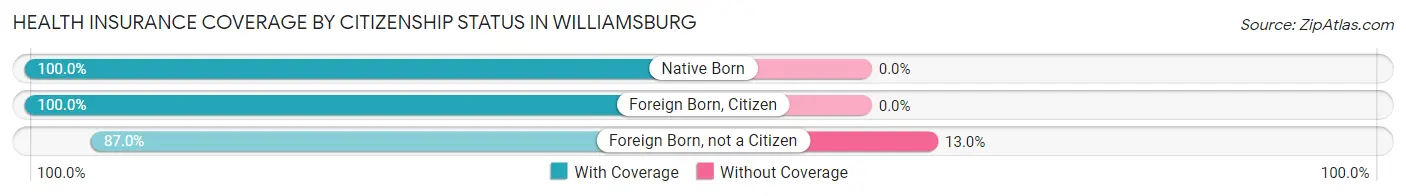
| Citizenship Status | With Coverage | Without Coverage |
| Native Born | 42 (100.0%) | 0 (0.0%) |
| Foreign Born, Citizen | 100 (100.0%) | 0 (0.0%) |
| Foreign Born, not a Citizen | 20 (87.0%) | 3 (13.0%) |
Health Insurance Coverage by Household Income in Williamsburg
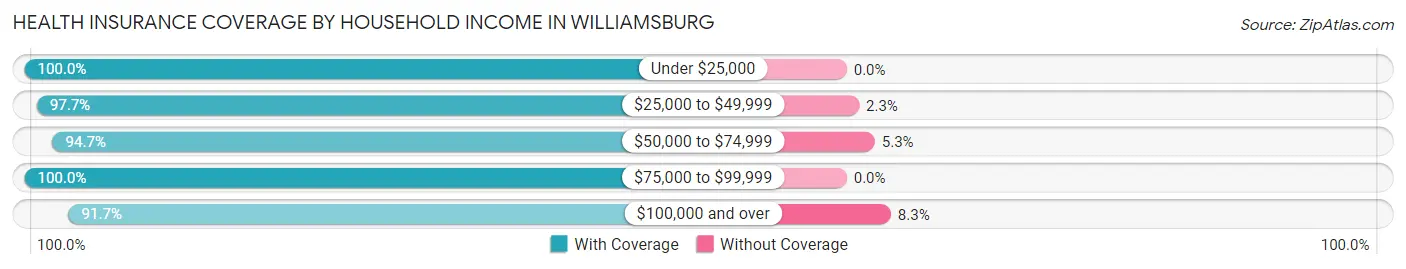
| Household Income | With Coverage | Without Coverage |
| Under $25,000 | 27 (100.0%) | 0 (0.0%) |
| $25,000 to $49,999 | 127 (97.7%) | 3 (2.3%) |
| $50,000 to $74,999 | 90 (94.7%) | 5 (5.3%) |
| $75,000 to $99,999 | 68 (100.0%) | 0 (0.0%) |
| $100,000 and over | 100 (91.7%) | 9 (8.3%) |
Public vs Private Health Insurance Coverage by Age in Williamsburg
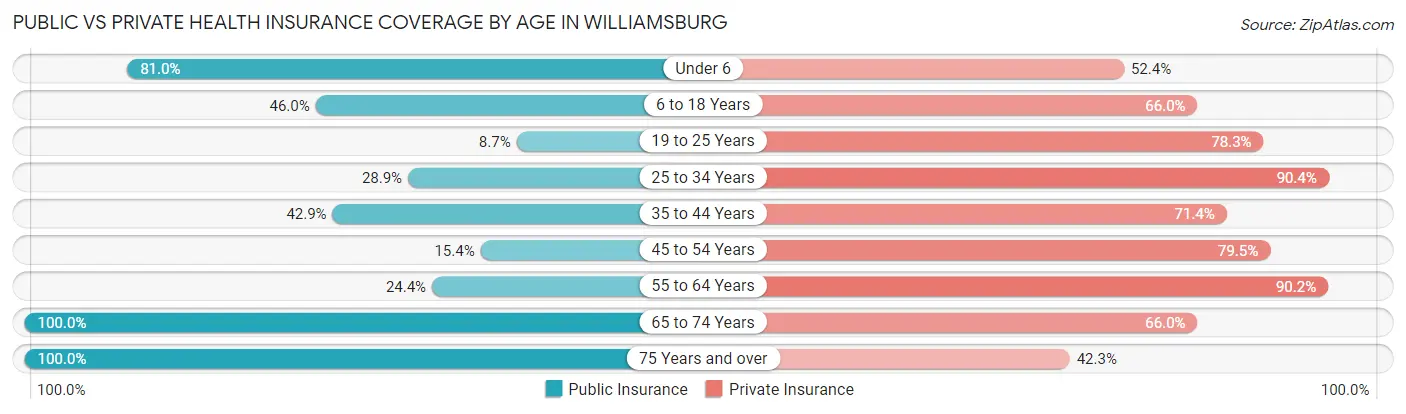
| Age Bracket | Public Insurance | Private Insurance |
| Under 6 | 34 (80.9%) | 22 (52.4%) |
| 6 to 18 Years | 46 (46.0%) | 66 (66.0%) |
| 19 to 25 Years | 2 (8.7%) | 18 (78.3%) |
| 25 to 34 Years | 15 (28.8%) | 47 (90.4%) |
| 35 to 44 Years | 24 (42.9%) | 40 (71.4%) |
| 45 to 54 Years | 6 (15.4%) | 31 (79.5%) |
| 55 to 64 Years | 10 (24.4%) | 37 (90.2%) |
| 65 to 74 Years | 50 (100.0%) | 33 (66.0%) |
| 75 Years and over | 26 (100.0%) | 11 (42.3%) |
| Total | 213 (49.6%) | 305 (71.1%) |
Disability Status by Sex by Age in Williamsburg
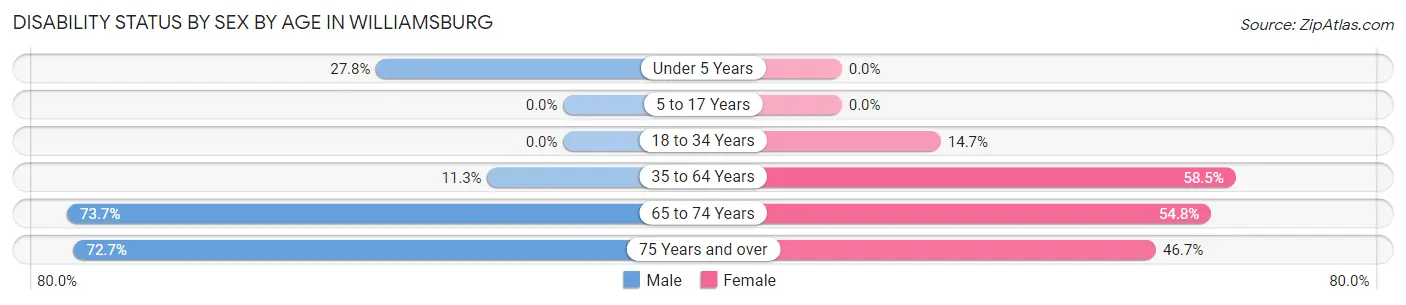
| Age Bracket | Male | Female |
| Under 5 Years | 5 (27.8%) | 0 (0.0%) |
| 5 to 17 Years | 0 (0.0%) | 0 (0.0%) |
| 18 to 34 Years | 0 (0.0%) | 5 (14.7%) |
| 35 to 64 Years | 8 (11.3%) | 38 (58.5%) |
| 65 to 74 Years | 14 (73.7%) | 17 (54.8%) |
| 75 Years and over | 8 (72.7%) | 7 (46.7%) |
Disability Class by Sex by Age in Williamsburg
Disability Class: Hearing Difficulty
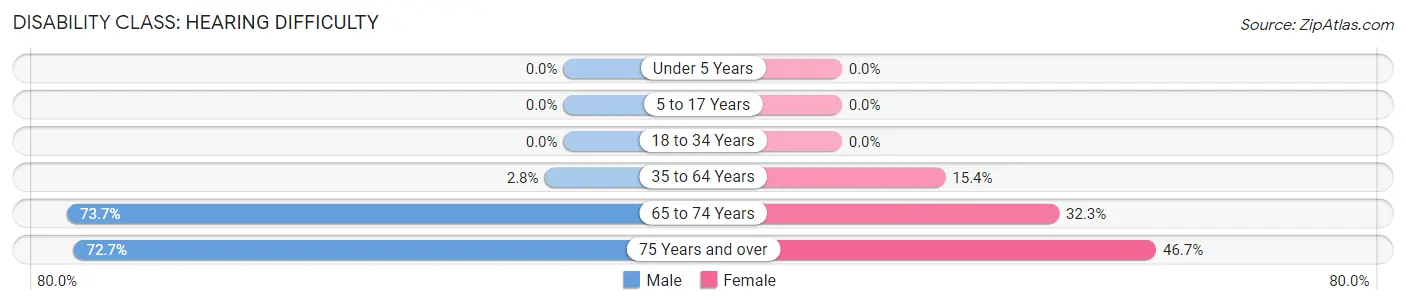
| Age Bracket | Male | Female |
| Under 5 Years | 0 (0.0%) | 0 (0.0%) |
| 5 to 17 Years | 0 (0.0%) | 0 (0.0%) |
| 18 to 34 Years | 0 (0.0%) | 0 (0.0%) |
| 35 to 64 Years | 2 (2.8%) | 10 (15.4%) |
| 65 to 74 Years | 14 (73.7%) | 10 (32.3%) |
| 75 Years and over | 8 (72.7%) | 7 (46.7%) |
Disability Class: Vision Difficulty
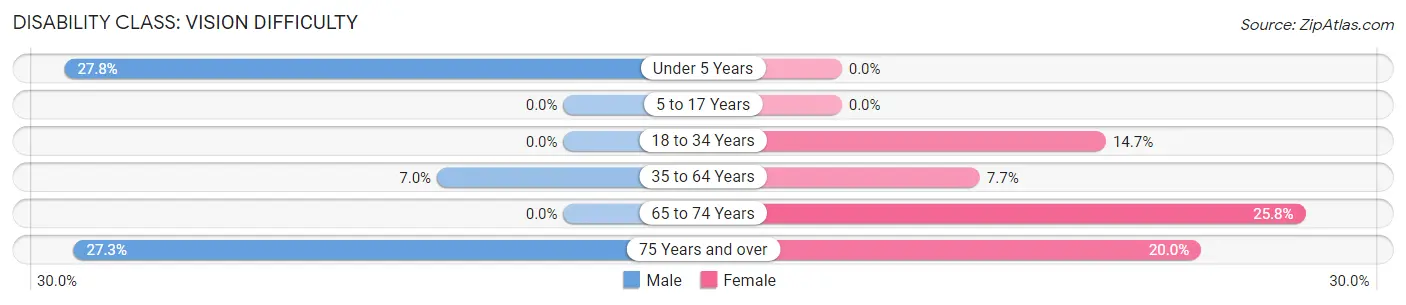
| Age Bracket | Male | Female |
| Under 5 Years | 5 (27.8%) | 0 (0.0%) |
| 5 to 17 Years | 0 (0.0%) | 0 (0.0%) |
| 18 to 34 Years | 0 (0.0%) | 5 (14.7%) |
| 35 to 64 Years | 5 (7.0%) | 5 (7.7%) |
| 65 to 74 Years | 0 (0.0%) | 8 (25.8%) |
| 75 Years and over | 3 (27.3%) | 3 (20.0%) |
Disability Class: Cognitive Difficulty
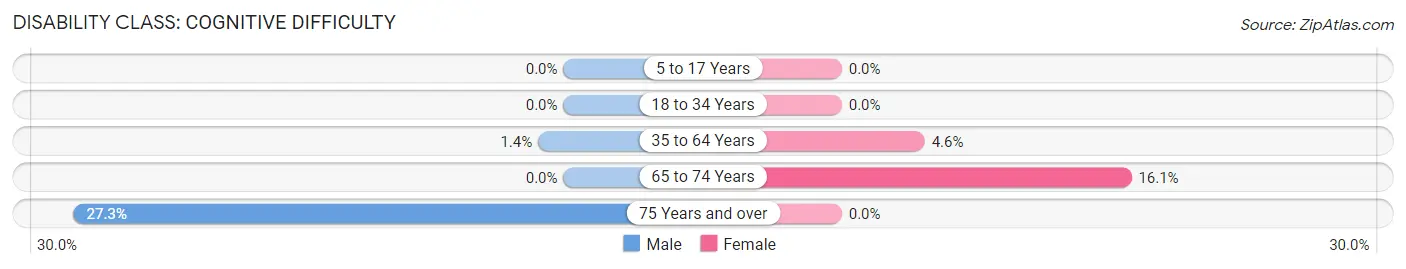
| Age Bracket | Male | Female |
| 5 to 17 Years | 0 (0.0%) | 0 (0.0%) |
| 18 to 34 Years | 0 (0.0%) | 0 (0.0%) |
| 35 to 64 Years | 1 (1.4%) | 3 (4.6%) |
| 65 to 74 Years | 0 (0.0%) | 5 (16.1%) |
| 75 Years and over | 3 (27.3%) | 0 (0.0%) |
Disability Class: Ambulatory Difficulty
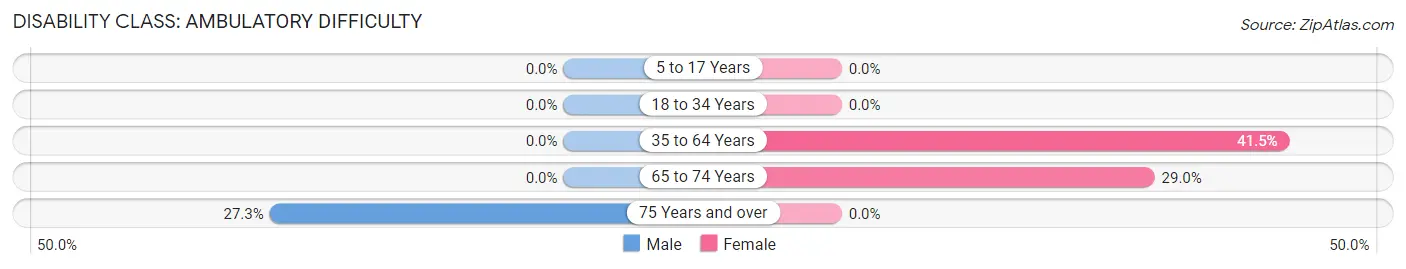
| Age Bracket | Male | Female |
| 5 to 17 Years | 0 (0.0%) | 0 (0.0%) |
| 18 to 34 Years | 0 (0.0%) | 0 (0.0%) |
| 35 to 64 Years | 0 (0.0%) | 27 (41.5%) |
| 65 to 74 Years | 0 (0.0%) | 9 (29.0%) |
| 75 Years and over | 3 (27.3%) | 0 (0.0%) |
Disability Class: Self-Care Difficulty
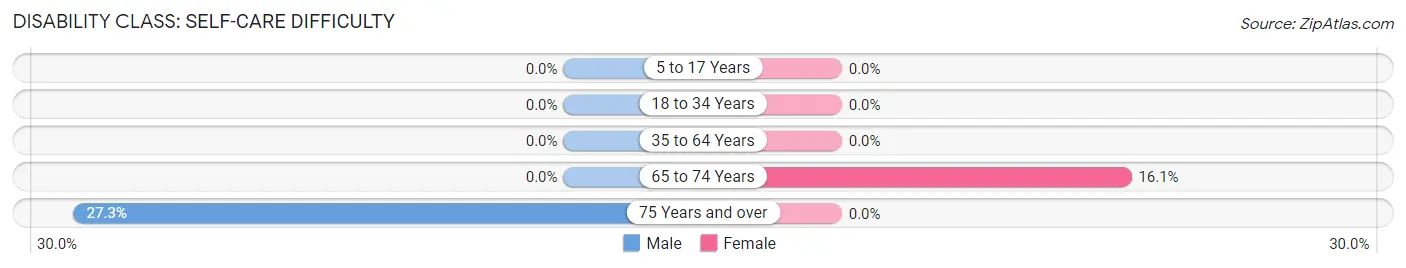
| Age Bracket | Male | Female |
| 5 to 17 Years | 0 (0.0%) | 0 (0.0%) |
| 18 to 34 Years | 0 (0.0%) | 0 (0.0%) |
| 35 to 64 Years | 0 (0.0%) | 0 (0.0%) |
| 65 to 74 Years | 0 (0.0%) | 5 (16.1%) |
| 75 Years and over | 3 (27.3%) | 0 (0.0%) |
Technology Access in Williamsburg
Computing Device Access in Williamsburg
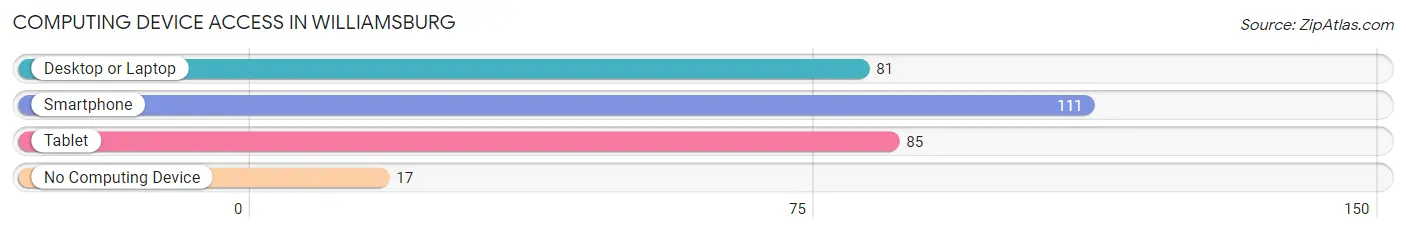
| Device Type | # Households | % Households |
| Desktop or Laptop | 81 | 61.4% |
| Smartphone | 111 | 84.1% |
| Tablet | 85 | 64.4% |
| No Computing Device | 17 | 12.9% |
| Total | 132 | 100.0% |
Internet Access in Williamsburg
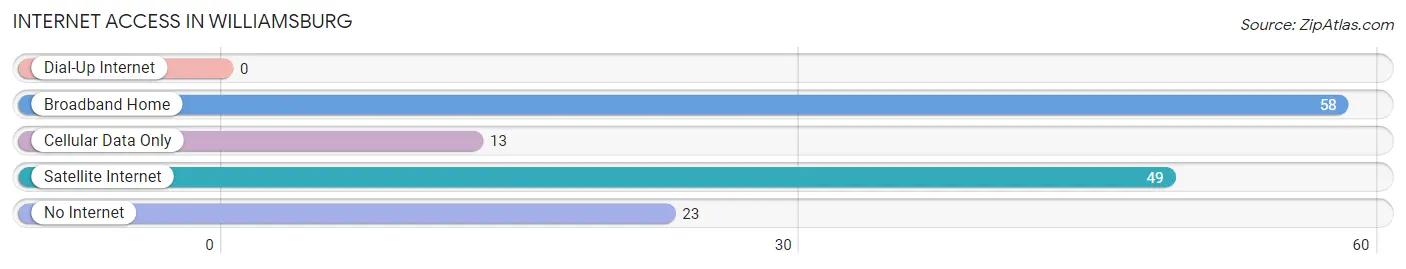
| Internet Type | # Households | % Households |
| Dial-Up Internet | 0 | 0.0% |
| Broadband Home | 58 | 43.9% |
| Cellular Data Only | 13 | 9.9% |
| Satellite Internet | 49 | 37.1% |
| No Internet | 23 | 17.4% |
| Total | 132 | 100.0% |
Williamsburg Summary
Williamsburg, Kansas is a small town located in Franklin County, Kansas. It is situated in the eastern part of the state, about 25 miles south of Topeka. The town was founded in 1854 and was named after William B. Smith, who was a prominent local businessman. The population of Williamsburg was estimated to be 1,093 in 2019.
Geography
Williamsburg is located in the eastern part of Franklin County, Kansas. It is situated on the banks of the Marais des Cygnes River, which is a tributary of the Kansas River. The town is located at an elevation of 890 feet above sea level. The climate in Williamsburg is characterized by hot, humid summers and cold, dry winters. The average annual temperature is around 54 degrees Fahrenheit.
Economy
Williamsburg’s economy is largely based on agriculture. The town is home to several farms, which produce corn, soybeans, wheat, and other crops. The town also has a few small businesses, including a grocery store, a hardware store, and a few restaurants.
Demographics
As of the 2010 census, the population of Williamsburg was 1,093. The racial makeup of the town was 97.3% White, 0.7% African American, 0.3% Native American, 0.2% Asian, 0.1% Pacific Islander, 0.2% from other races, and 1.2% from two or more races. Hispanic or Latino of any race were 1.2% of the population.
The median income for a household in Williamsburg was $41,250, and the median income for a family was $48,750. The per capita income for the town was $19,945. About 8.2% of families and 10.2% of the population were below the poverty line, including 14.3% of those under age 18 and 8.3% of those age 65 or over.
History
Williamsburg was founded in 1854 by William B. Smith, a prominent local businessman. The town was originally known as Smithville, but was later renamed Williamsburg in honor of its founder. The town was incorporated in 1872.
Williamsburg was a stop on the Santa Fe Trail, and the town was a major trading center for the area. The town was also a major stop on the Underground Railroad, and many escaped slaves passed through the town on their way to freedom.
In the late 19th century, Williamsburg was a major center for the cattle industry. The town was home to several large cattle ranches, and the town was a major shipping point for cattle.
Williamsburg was also home to several large flour mills in the late 19th and early 20th centuries. The town was a major producer of flour, and the mills were a major source of employment for the town.
In the early 20th century, Williamsburg was a major center for the oil industry. The town was home to several oil wells, and the town was a major producer of oil.
Today, Williamsburg is a small, rural town. The town is home to several small businesses, and the town is a popular destination for tourists. The town is also home to several historic sites, including the Santa Fe Trail, the Underground Railroad, and several old flour mills.
Common Questions
What is Per Capita Income in Williamsburg?
Per Capita income in Williamsburg is $19,545.
What is the Median Family Income in Williamsburg?
Median Family Income in Williamsburg is $52,000.
What is the Median Household income in Williamsburg?
Median Household Income in Williamsburg is $50,000.
What is Inequality or Gini Index in Williamsburg?
Inequality or Gini Index in Williamsburg is 0.30.
What is the Total Population of Williamsburg?
Total Population of Williamsburg is 429.
What is the Total Male Population of Williamsburg?
Total Male Population of Williamsburg is 192.
What is the Total Female Population of Williamsburg?
Total Female Population of Williamsburg is 237.
What is the Ratio of Males per 100 Females in Williamsburg?
There are 81.01 Males per 100 Females in Williamsburg.
What is the Ratio of Females per 100 Males in Williamsburg?
There are 123.44 Females per 100 Males in Williamsburg.
What is the Median Population Age in Williamsburg?
Median Population Age in Williamsburg is 34.6 Years.
What is the Average Family Size in Williamsburg
Average Family Size in Williamsburg is 3.4 People.
What is the Average Household Size in Williamsburg
Average Household Size in Williamsburg is 3.2 People.
How Large is the Labor Force in Williamsburg?
There are 180 People in the Labor Forcein in Williamsburg.
What is the Percentage of People in the Labor Force in Williamsburg?
59.6% of People are in the Labor Force in Williamsburg.
What is the Unemployment Rate in Williamsburg?
Unemployment Rate in Williamsburg is 7.8%.