Zip Codes with the Highest Percentage of Population Employed in Accommodation & Food Services in Lawrence, KS
RELATED REPORTS & OPTIONS
Accommodation & Food Services
Lawrence
Compare Zip Codes
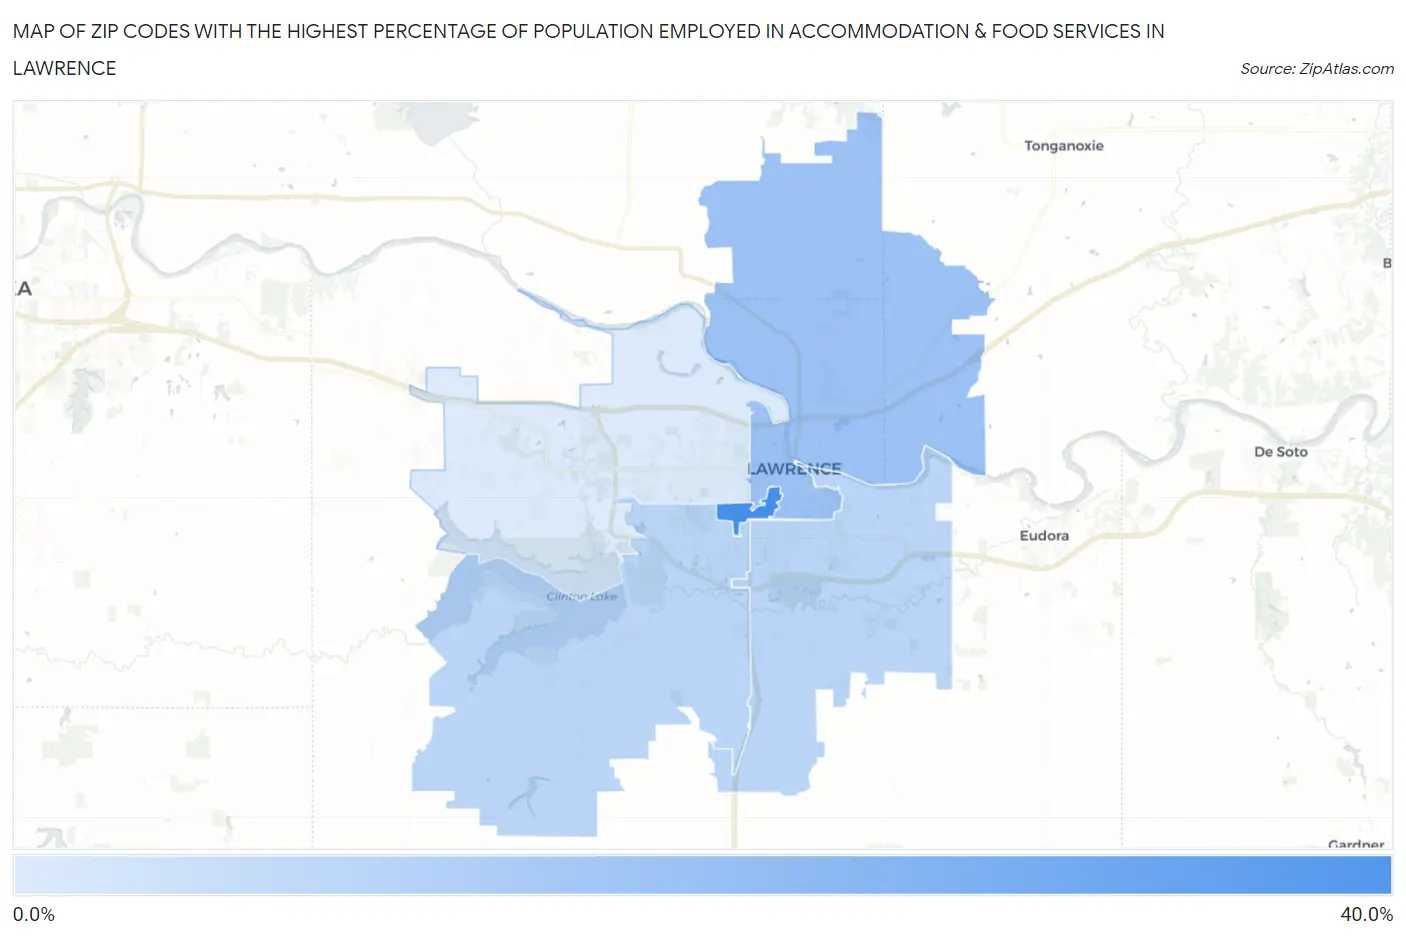
Map of Zip Codes with the Highest Percentage of Population Employed in Accommodation & Food Services in Lawrence
4.3%
30.9%
Zip Codes with the Highest Percentage of Population Employed in Accommodation & Food Services in Lawrence, KS
| Zip Code | % Employed | vs State | vs National | |
| 1. | 66045 | 30.9% | 6.2%(+24.7)#3 | 6.9%(+24.0)#303 |
| 2. | 66044 | 15.4% | 6.2%(+9.17)#23 | 6.9%(+8.52)#1,577 |
| 3. | 66047 | 10.0% | 6.2%(+3.80)#58 | 6.9%(+3.14)#4,503 |
| 4. | 66046 | 9.8% | 6.2%(+3.56)#61 | 6.9%(+2.91)#4,811 |
| 5. | 66049 | 4.3% | 6.2%(-1.91)#272 | 6.9%(-2.57)#19,140 |
1
Common Questions
What are the Top 3 Zip Codes with the Highest Percentage of Population Employed in Accommodation & Food Services in Lawrence, KS?
Top 3 Zip Codes with the Highest Percentage of Population Employed in Accommodation & Food Services in Lawrence, KS are:
What zip code has the Highest Percentage of Population Employed in Accommodation & Food Services in Lawrence, KS?
66045 has the Highest Percentage of Population Employed in Accommodation & Food Services in Lawrence, KS with 30.9%.
What is the Percentage of Population Employed in Accommodation & Food Services in Lawrence, KS?
Percentage of Population Employed in Accommodation & Food Services in Lawrence is 10.6%.
What is the Percentage of Population Employed in Accommodation & Food Services in Kansas?
Percentage of Population Employed in Accommodation & Food Services in Kansas is 6.2%.
What is the Percentage of Population Employed in Accommodation & Food Services in the United States?
Percentage of Population Employed in Accommodation & Food Services in the United States is 6.9%.