Zip Codes with the Highest Percentage of Population Employed in Accommodation & Food Services in Leawood, KS
RELATED REPORTS & OPTIONS
Accommodation & Food Services
Leawood
Compare Zip Codes
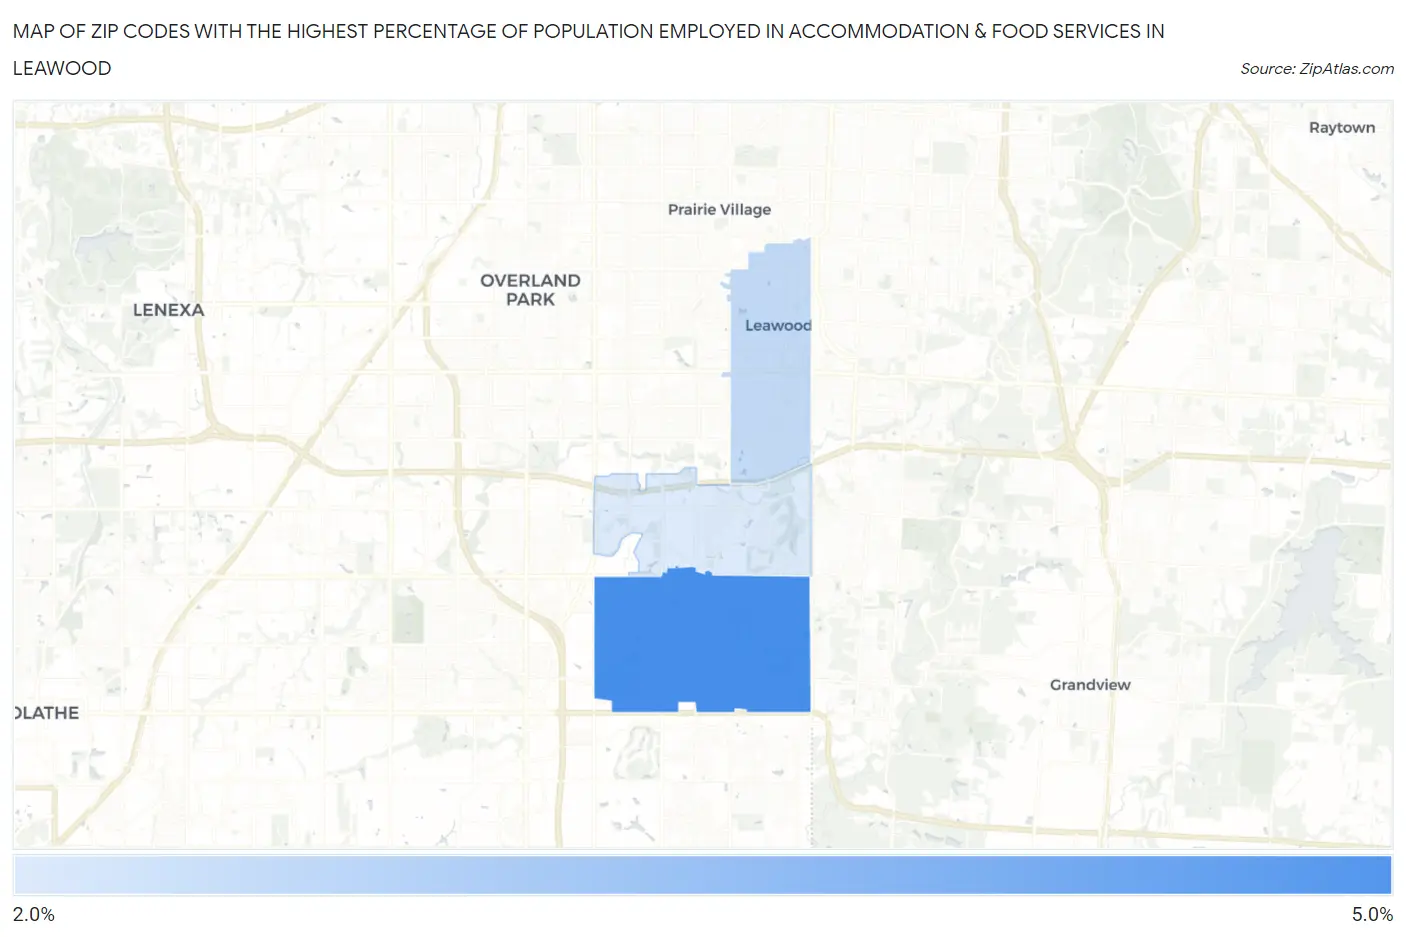
Map of Zip Codes with the Highest Percentage of Population Employed in Accommodation & Food Services in Leawood
2.3%
4.9%
Zip Codes with the Highest Percentage of Population Employed in Accommodation & Food Services in Leawood, KS
| Zip Code | % Employed | vs State | vs National | |
| 1. | 66209 | 4.9% | 6.2%(-1.31)#235 | 6.9%(-1.97)#17,137 |
| 2. | 66206 | 2.7% | 6.2%(-3.48)#389 | 6.9%(-4.13)#23,895 |
| 3. | 66211 | 2.3% | 6.2%(-3.93)#421 | 6.9%(-4.59)#24,953 |
1
Common Questions
What are the Top Zip Codes with the Highest Percentage of Population Employed in Accommodation & Food Services in Leawood, KS?
Top Zip Codes with the Highest Percentage of Population Employed in Accommodation & Food Services in Leawood, KS are:
What zip code has the Highest Percentage of Population Employed in Accommodation & Food Services in Leawood, KS?
66209 has the Highest Percentage of Population Employed in Accommodation & Food Services in Leawood, KS with 4.9%.
What is the Percentage of Population Employed in Accommodation & Food Services in Leawood, KS?
Percentage of Population Employed in Accommodation & Food Services in Leawood is 3.3%.
What is the Percentage of Population Employed in Accommodation & Food Services in Kansas?
Percentage of Population Employed in Accommodation & Food Services in Kansas is 6.2%.
What is the Percentage of Population Employed in Accommodation & Food Services in the United States?
Percentage of Population Employed in Accommodation & Food Services in the United States is 6.9%.