Parkerville, KS Map & Demographics
Parkerville Map
Parkerville Overview
$20,054
PER CAPITA INCOME
$16,556
AVG FAMILY INCOME
$16,505
AVG HOUSEHOLD INCOME
0.32
INEQUALITY / GINI INDEX
84
TOTAL POPULATION
64
MALE POPULATION
20
FEMALE POPULATION
320.00
MALES / 100 FEMALES
31.25
FEMALES / 100 MALES
87.1
MEDIAN AGE
1.3
AVG FAMILY SIZE
1.3
AVG HOUSEHOLD SIZE
7
LABOR FORCE [ PEOPLE ]
8.3%
PERCENT IN LABOR FORCE
Income in Parkerville
Income Overview in Parkerville
Per Capita Income in Parkerville is $20,054, while median incomes of families and households are $16,556 and $16,505 respectively.
| Characteristic | Number | Measure |
| Per Capita Income | 84 | $20,054 |
| Median Family Income | 61 | $16,556 |
| Mean Family Income | 61 | $27,277 |
| Median Household Income | 63 | $16,505 |
| Mean Household Income | 63 | $26,749 |
| Income Deficit | 61 | $0 |
| Wage / Income Gap (%) | 84 | 0.00% |
| Wage / Income Gap ($) | 84 | 100.00¢ per $1 |
| Gini / Inequality Index | 84 | 0.32 |
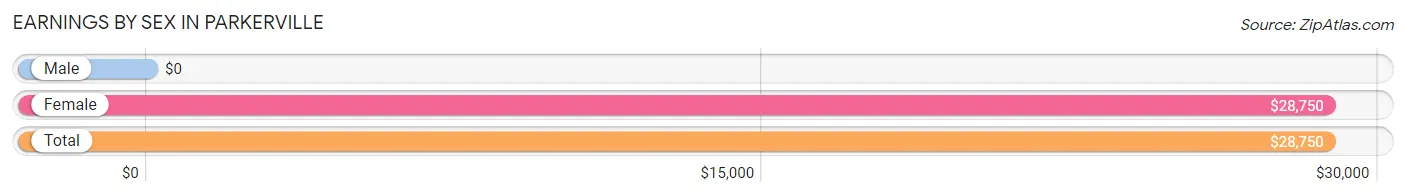
Earnings by Sex in Parkerville
| Sex | Number | Average Earnings |
| Male | 0 (0.0%) | $0 |
| Female | 9 (100.0%) | $28,750 |
| Total | 9 (100.0%) | $28,750 |
Earnings by Sex by Income Bracket in Parkerville
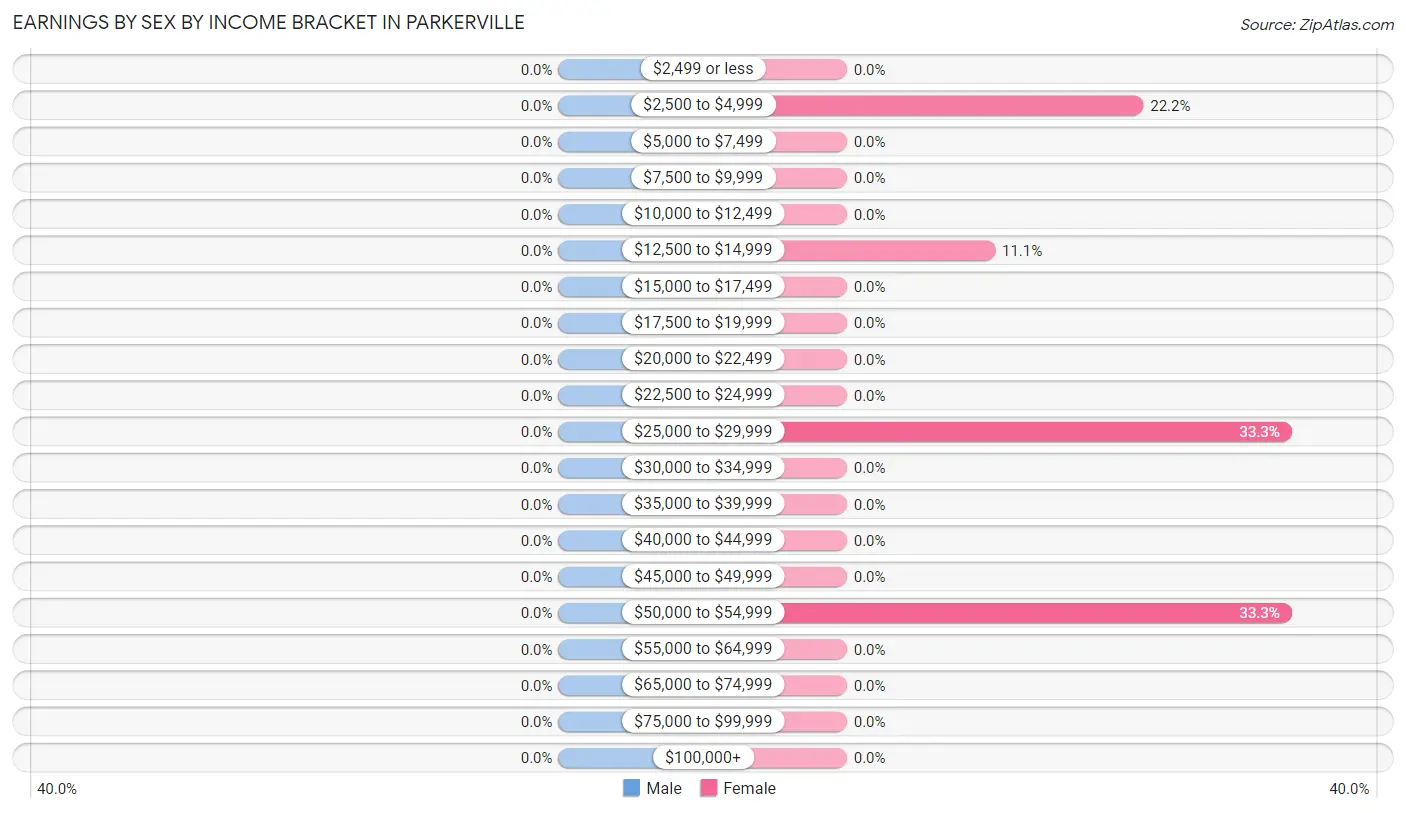
| Income | Male | Female |
| $2,499 or less | 0 (0.0%) | 0 (0.0%) |
| $2,500 to $4,999 | 0 (0.0%) | 2 (22.2%) |
| $5,000 to $7,499 | 0 (0.0%) | 0 (0.0%) |
| $7,500 to $9,999 | 0 (0.0%) | 0 (0.0%) |
| $10,000 to $12,499 | 0 (0.0%) | 0 (0.0%) |
| $12,500 to $14,999 | 0 (0.0%) | 1 (11.1%) |
| $15,000 to $17,499 | 0 (0.0%) | 0 (0.0%) |
| $17,500 to $19,999 | 0 (0.0%) | 0 (0.0%) |
| $20,000 to $22,499 | 0 (0.0%) | 0 (0.0%) |
| $22,500 to $24,999 | 0 (0.0%) | 0 (0.0%) |
| $25,000 to $29,999 | 0 (0.0%) | 3 (33.3%) |
| $30,000 to $34,999 | 0 (0.0%) | 0 (0.0%) |
| $35,000 to $39,999 | 0 (0.0%) | 0 (0.0%) |
| $40,000 to $44,999 | 0 (0.0%) | 0 (0.0%) |
| $45,000 to $49,999 | 0 (0.0%) | 0 (0.0%) |
| $50,000 to $54,999 | 0 (0.0%) | 3 (33.3%) |
| $55,000 to $64,999 | 0 (0.0%) | 0 (0.0%) |
| $65,000 to $74,999 | 0 (0.0%) | 0 (0.0%) |
| $75,000 to $99,999 | 0 (0.0%) | 0 (0.0%) |
| $100,000+ | 0 (0.0%) | 0 (0.0%) |
| Total | 0 (0.0%) | 9 (100.0%) |
Earnings by Sex by Educational Attainment in Parkerville
| Educational Attainment | Male Income | Female Income |
| Less than High School | - | - |
| High School Diploma | - | - |
| College or Associate's Degree | - | - |
| Bachelor's Degree | - | - |
| Graduate Degree | - | - |
| Total | - | - |
Family Income in Parkerville
Family Income Brackets in Parkerville
According to the Parkerville family income data, there are 50 families falling into the $15,000 to $24,999 income range, which is the most common income bracket and makes up 82.0% of all families.
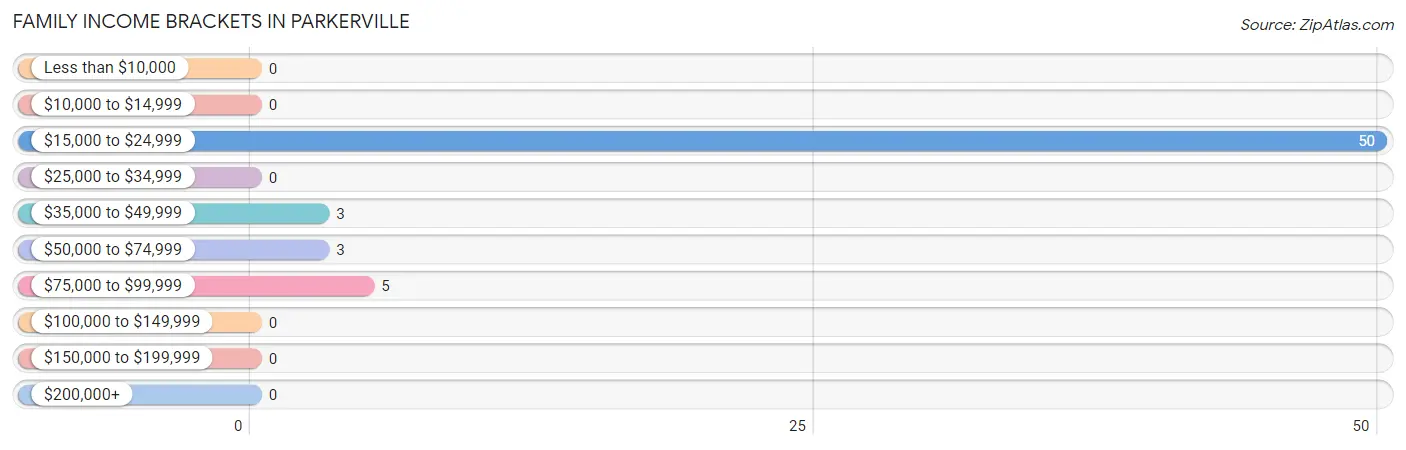
| Income Bracket | # Families | % Families |
| Less than $10,000 | 0 | 0.0% |
| $10,000 to $14,999 | 0 | 0.0% |
| $15,000 to $24,999 | 50 | 82.0% |
| $25,000 to $34,999 | 0 | 0.0% |
| $35,000 to $49,999 | 3 | 4.9% |
| $50,000 to $74,999 | 3 | 4.9% |
| $75,000 to $99,999 | 5 | 8.2% |
| $100,000 to $149,999 | 0 | 0.0% |
| $150,000 to $199,999 | 0 | 0.0% |
| $200,000+ | 0 | 0.0% |
Family Income by Famaliy Size in Parkerville
2-person families (58 | 95.1%) account for the highest median family income in Parkerville with $16,480 per family, while 2-person families (58 | 95.1%) have the highest median income of $8,240 per family member.
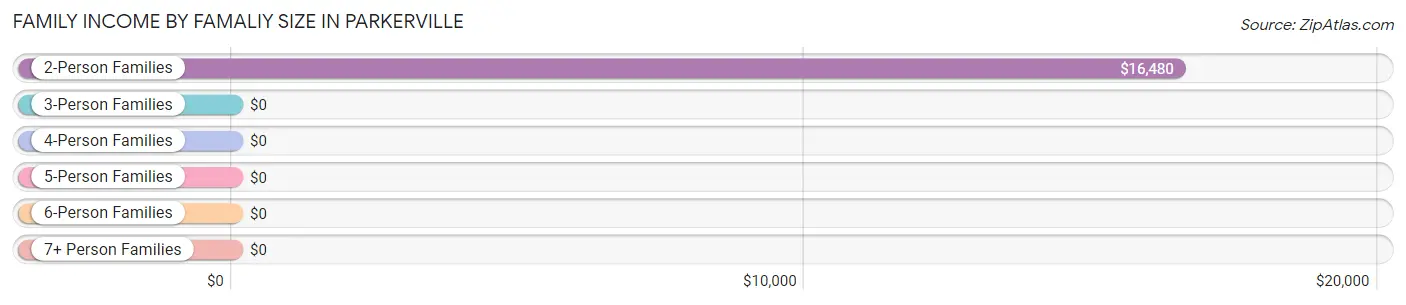
| Income Bracket | # Families | Median Income |
| 2-Person Families | 58 (95.1%) | $16,480 |
| 3-Person Families | 3 (4.9%) | $0 |
| 4-Person Families | 0 (0.0%) | $0 |
| 5-Person Families | 0 (0.0%) | $0 |
| 6-Person Families | 0 (0.0%) | $0 |
| 7+ Person Families | 0 (0.0%) | $0 |
| Total | 61 (100.0%) | $16,556 |
Family Income by Number of Earners in Parkerville
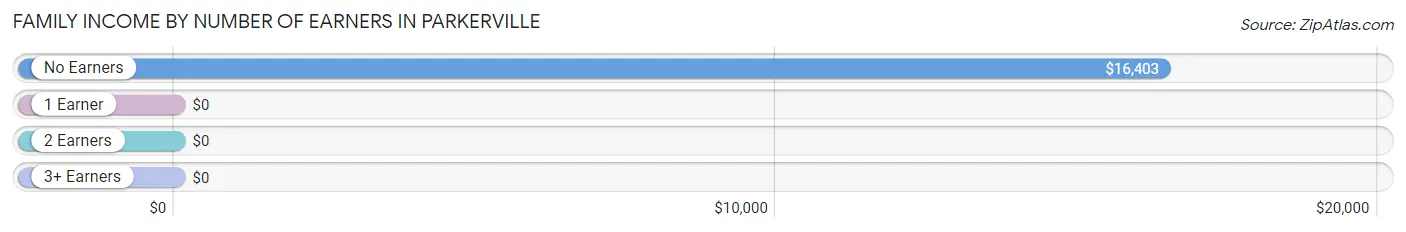
| Number of Earners | # Families | Median Income |
| No Earners | 55 (90.2%) | $16,403 |
| 1 Earner | 6 (9.8%) | $0 |
| 2 Earners | 0 (0.0%) | $0 |
| 3+ Earners | 0 (0.0%) | $0 |
| Total | 61 (100.0%) | $16,556 |
Household Income in Parkerville
Household Income Brackets in Parkerville
With 50 households falling in the category, the $15,000 to $24,999 income range is the most frequent in Parkerville, accounting for 79.4% of all households.
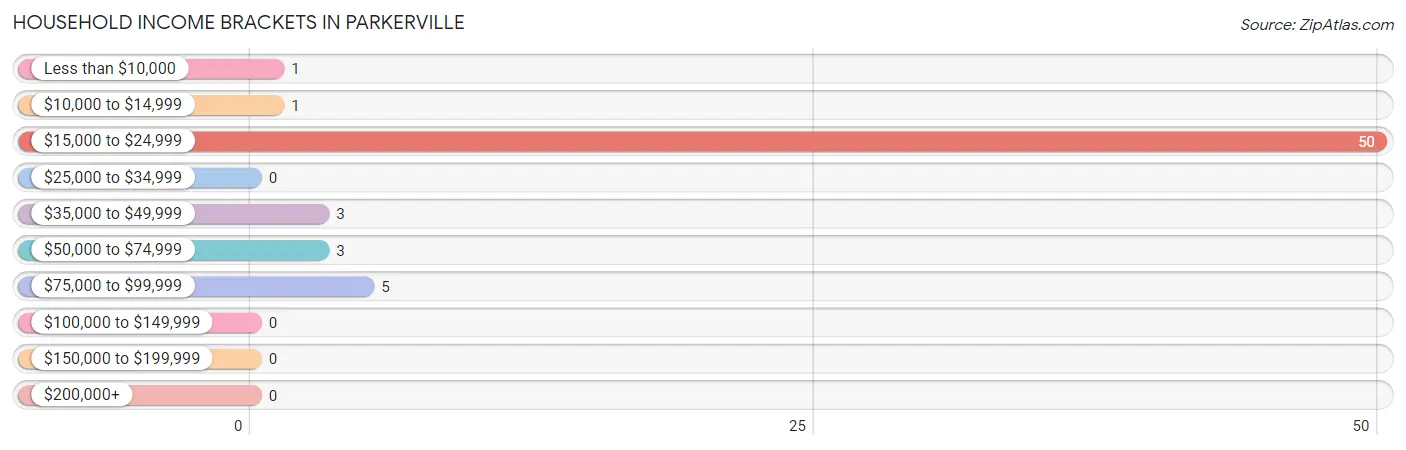
| Income Bracket | # Households | % Households |
| Less than $10,000 | 1 | 1.6% |
| $10,000 to $14,999 | 1 | 1.6% |
| $15,000 to $24,999 | 50 | 79.4% |
| $25,000 to $34,999 | 0 | 0.0% |
| $35,000 to $49,999 | 3 | 4.8% |
| $50,000 to $74,999 | 3 | 4.8% |
| $75,000 to $99,999 | 5 | 7.9% |
| $100,000 to $149,999 | 0 | 0.0% |
| $150,000 to $199,999 | 0 | 0.0% |
| $200,000+ | 0 | 0.0% |
Household Income by Householder Age in Parkerville
The median household income in Parkerville is $16,505, with the highest median household income of $16,327 found in the 65+ years age bracket for the primary householder. A total of 54 households (85.7%) fall into this category.
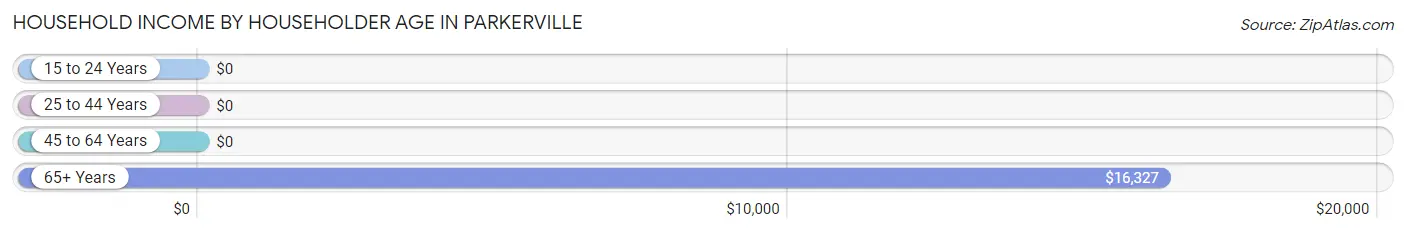
| Income Bracket | # Households | Median Income |
| 15 to 24 Years | 0 (0.0%) | $0 |
| 25 to 44 Years | 5 (7.9%) | $0 |
| 45 to 64 Years | 4 (6.4%) | $0 |
| 65+ Years | 54 (85.7%) | $16,327 |
| Total | 63 (100.0%) | $16,505 |
Poverty in Parkerville
Income Below Poverty by Sex and Age in Parkerville
With 78.1% poverty level for males and 25.0% for females among the residents of Parkerville, 75 year old and over males and 45 to 54 year old females are the most vulnerable to poverty, with 50 males (96.2%) and 1 females (100.0%) in their respective age groups living below the poverty level.
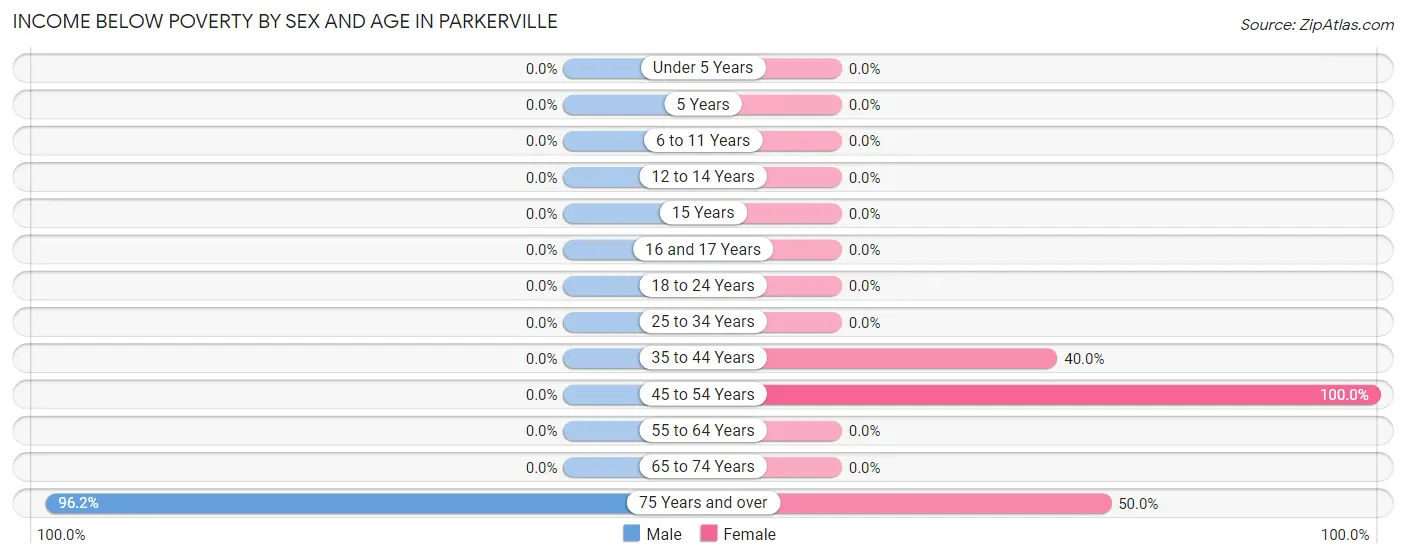
| Age Bracket | Male | Female |
| Under 5 Years | 0 (0.0%) | 0 (0.0%) |
| 5 Years | 0 (0.0%) | 0 (0.0%) |
| 6 to 11 Years | 0 (0.0%) | 0 (0.0%) |
| 12 to 14 Years | 0 (0.0%) | 0 (0.0%) |
| 15 Years | 0 (0.0%) | 0 (0.0%) |
| 16 and 17 Years | 0 (0.0%) | 0 (0.0%) |
| 18 to 24 Years | 0 (0.0%) | 0 (0.0%) |
| 25 to 34 Years | 0 (0.0%) | 0 (0.0%) |
| 35 to 44 Years | 0 (0.0%) | 2 (40.0%) |
| 45 to 54 Years | 0 (0.0%) | 1 (100.0%) |
| 55 to 64 Years | 0 (0.0%) | 0 (0.0%) |
| 65 to 74 Years | 0 (0.0%) | 0 (0.0%) |
| 75 Years and over | 50 (96.2%) | 2 (50.0%) |
| Total | 50 (78.1%) | 5 (25.0%) |
Income Above Poverty by Sex and Age in Parkerville
According to the poverty statistics in Parkerville, males aged 35 to 44 years and females aged 16 and 17 years are the age groups that are most secure financially, with 100.0% of males and 100.0% of females in these age groups living above the poverty line.
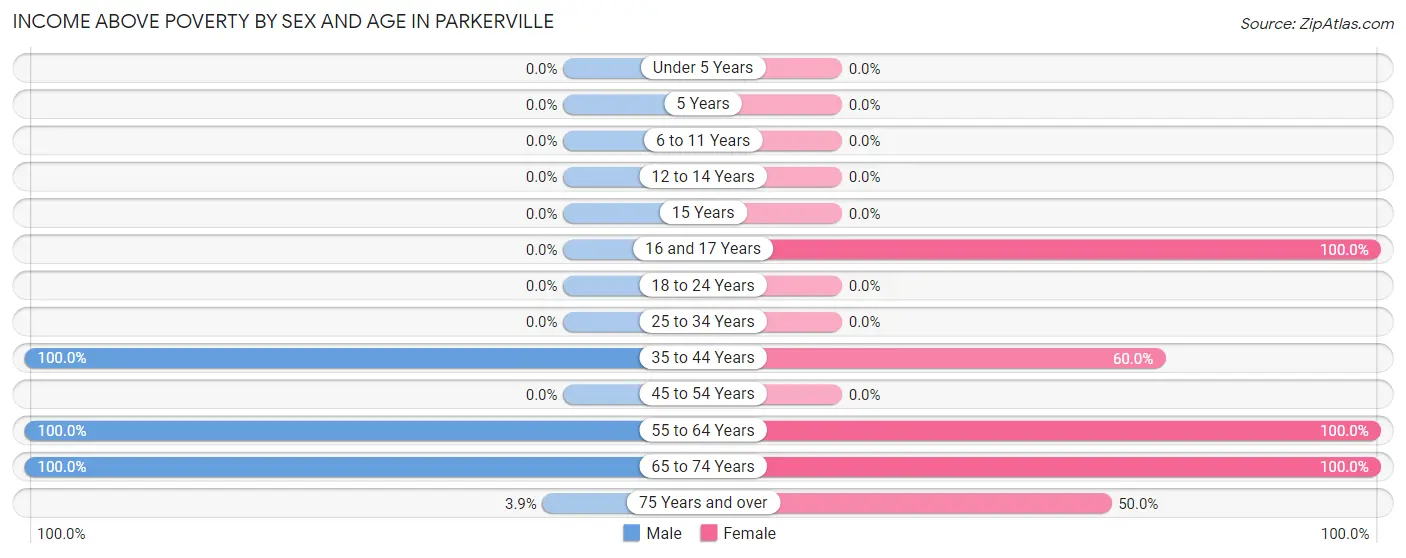
| Age Bracket | Male | Female |
| Under 5 Years | 0 (0.0%) | 0 (0.0%) |
| 5 Years | 0 (0.0%) | 0 (0.0%) |
| 6 to 11 Years | 0 (0.0%) | 0 (0.0%) |
| 12 to 14 Years | 0 (0.0%) | 0 (0.0%) |
| 15 Years | 0 (0.0%) | 0 (0.0%) |
| 16 and 17 Years | 0 (0.0%) | 5 (100.0%) |
| 18 to 24 Years | 0 (0.0%) | 0 (0.0%) |
| 25 to 34 Years | 0 (0.0%) | 0 (0.0%) |
| 35 to 44 Years | 9 (100.0%) | 3 (60.0%) |
| 45 to 54 Years | 0 (0.0%) | 0 (0.0%) |
| 55 to 64 Years | 1 (100.0%) | 3 (100.0%) |
| 65 to 74 Years | 2 (100.0%) | 2 (100.0%) |
| 75 Years and over | 2 (3.8%) | 2 (50.0%) |
| Total | 14 (21.9%) | 15 (75.0%) |
Income Below Poverty Among Married-Couple Families in Parkerville
The poverty statistics for married-couple families in Parkerville show that 87.5% or 49 of the total 56 families live below the poverty line. Families with no children have the highest poverty rate of 92.4%, comprising of 49 families. On the other hand, families with 1 or 2 children have the lowest poverty rate of 0.0%, which includes 0 families.
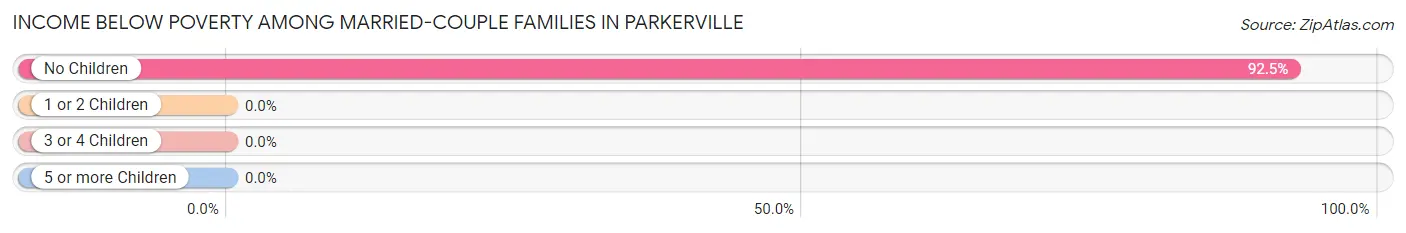
| Children | Above Poverty | Below Poverty |
| No Children | 4 (7.5%) | 49 (92.4%) |
| 1 or 2 Children | 3 (100.0%) | 0 (0.0%) |
| 3 or 4 Children | 0 (0.0%) | 0 (0.0%) |
| 5 or more Children | 0 (0.0%) | 0 (0.0%) |
| Total | 7 (12.5%) | 49 (87.5%) |
Income Below Poverty Among Single-Parent Households in Parkerville
| Children | Single Father | Single Mother |
| No Children | 0 (0.0%) | 0 (0.0%) |
| 1 or 2 Children | 0 (0.0%) | 0 (0.0%) |
| 3 or 4 Children | 0 (0.0%) | 0 (0.0%) |
| 5 or more Children | 0 (0.0%) | 0 (0.0%) |
| Total | 0 (0.0%) | 0 (0.0%) |
Income Below Poverty Among Married-Couple vs Single-Parent Households in Parkerville
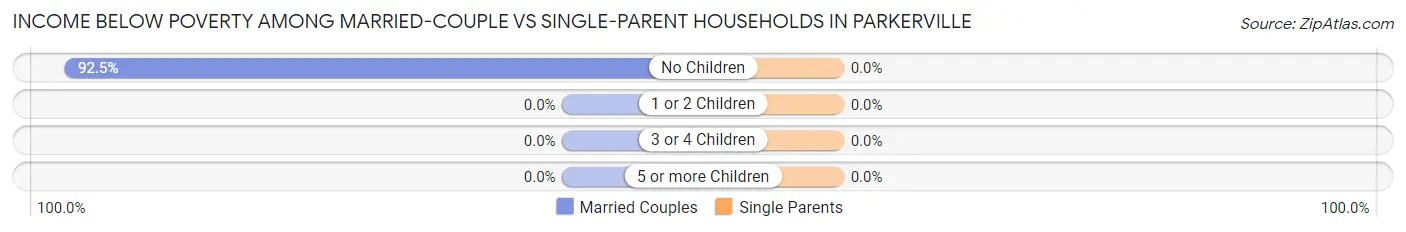
| Children | Married-Couple Families | Single-Parent Households |
| No Children | 49 (92.4%) | 0 (0.0%) |
| 1 or 2 Children | 0 (0.0%) | 0 (0.0%) |
| 3 or 4 Children | 0 (0.0%) | 0 (0.0%) |
| 5 or more Children | 0 (0.0%) | 0 (0.0%) |
| Total | 49 (87.5%) | 0 (0.0%) |
Race in Parkerville
The most populous races in Parkerville are , and White / Caucasian (84 | 100.0%).
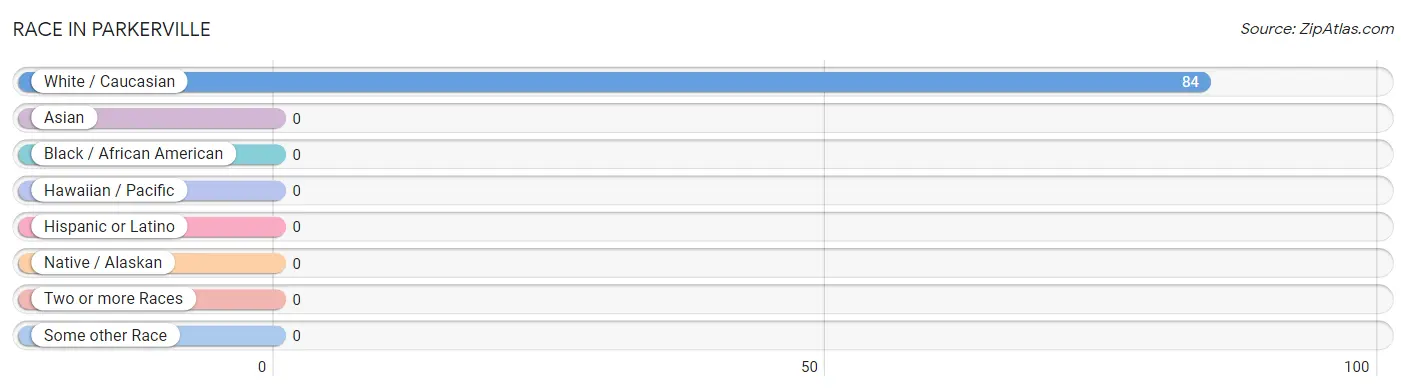
| Race | # Population | % Population |
| Asian | 0 | 0.0% |
| Black / African American | 0 | 0.0% |
| Hawaiian / Pacific | 0 | 0.0% |
| Hispanic or Latino | 0 | 0.0% |
| Native / Alaskan | 0 | 0.0% |
| White / Caucasian | 84 | 100.0% |
| Two or more Races | 0 | 0.0% |
| Some other Race | 0 | 0.0% |
| Total | 84 | 100.0% |
Ancestry in Parkerville
The most populous ancestries reported in Parkerville are Swedish (49 | 58.3%), American (20 | 23.8%), Irish (6 | 7.1%), German (4 | 4.8%), and English (2 | 2.4%), together accounting for 96.4% of all Parkerville residents.
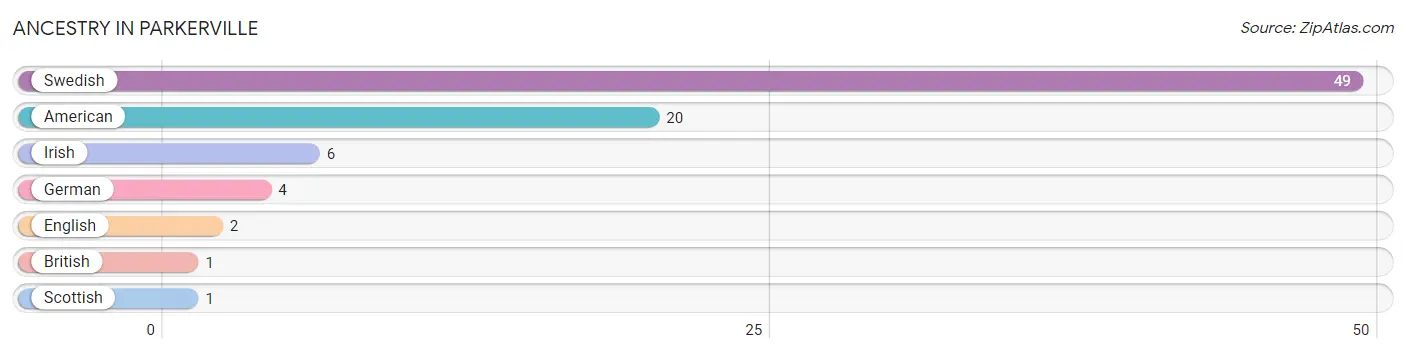
| Ancestry | # Population | % Population |
| American | 20 | 23.8% |
| British | 1 | 1.2% |
| English | 2 | 2.4% |
| German | 4 | 4.8% |
| Irish | 6 | 7.1% |
| Scottish | 1 | 1.2% |
| Swedish | 49 | 58.3% | View All 7 Rows |
Immigrants in Parkerville

| Immigration Origin | # Population | % Population | View All 0 Rows |
Sex and Age in Parkerville
Sex and Age in Parkerville
The most populous age groups in Parkerville are 85 Years and over (50 | 78.1%) for men and 15 to 19 Years (5 | 25.0%) for women.
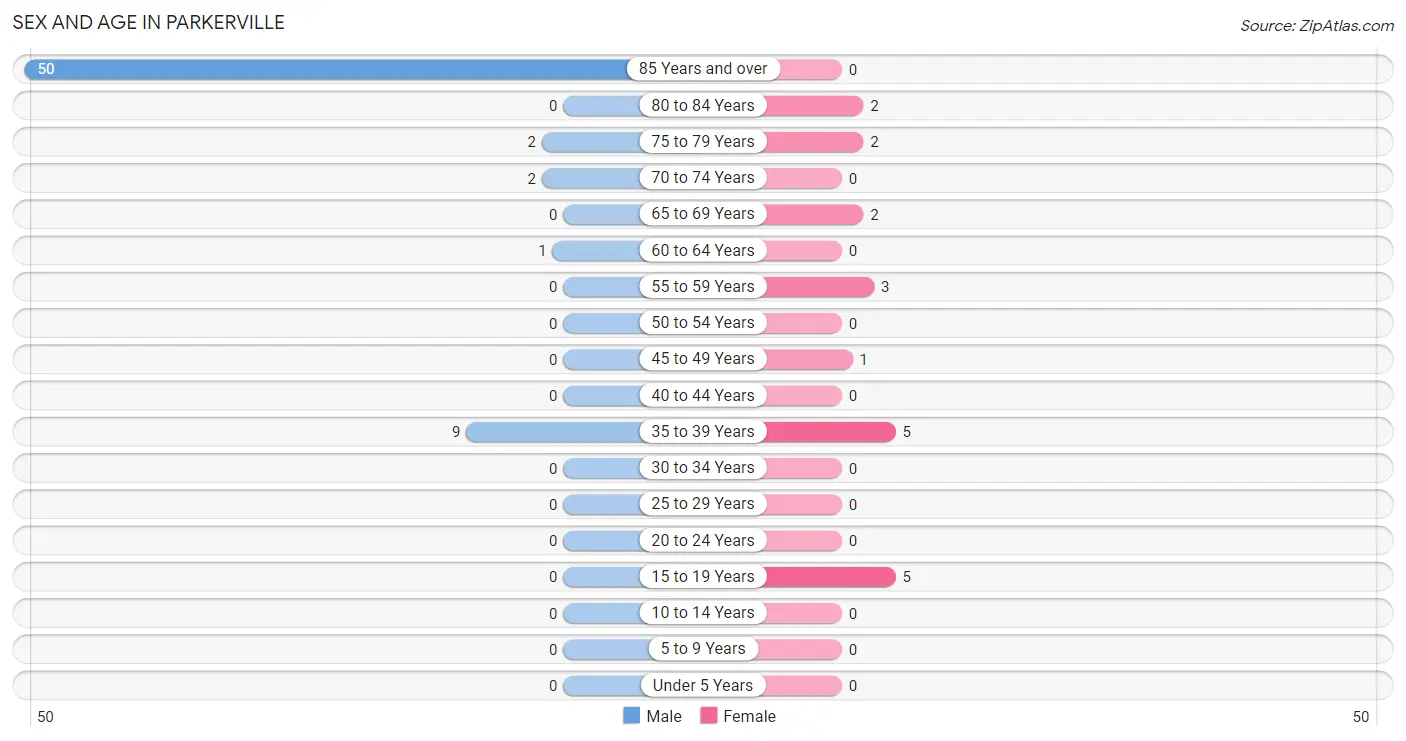
| Age Bracket | Male | Female |
| Under 5 Years | 0 (0.0%) | 0 (0.0%) |
| 5 to 9 Years | 0 (0.0%) | 0 (0.0%) |
| 10 to 14 Years | 0 (0.0%) | 0 (0.0%) |
| 15 to 19 Years | 0 (0.0%) | 5 (25.0%) |
| 20 to 24 Years | 0 (0.0%) | 0 (0.0%) |
| 25 to 29 Years | 0 (0.0%) | 0 (0.0%) |
| 30 to 34 Years | 0 (0.0%) | 0 (0.0%) |
| 35 to 39 Years | 9 (14.1%) | 5 (25.0%) |
| 40 to 44 Years | 0 (0.0%) | 0 (0.0%) |
| 45 to 49 Years | 0 (0.0%) | 1 (5.0%) |
| 50 to 54 Years | 0 (0.0%) | 0 (0.0%) |
| 55 to 59 Years | 0 (0.0%) | 3 (15.0%) |
| 60 to 64 Years | 1 (1.6%) | 0 (0.0%) |
| 65 to 69 Years | 0 (0.0%) | 2 (10.0%) |
| 70 to 74 Years | 2 (3.1%) | 0 (0.0%) |
| 75 to 79 Years | 2 (3.1%) | 2 (10.0%) |
| 80 to 84 Years | 0 (0.0%) | 2 (10.0%) |
| 85 Years and over | 50 (78.1%) | 0 (0.0%) |
| Total | 64 (100.0%) | 20 (100.0%) |
Families and Households in Parkerville
Median Family Size in Parkerville
The median family size in Parkerville is 1.31 persons per family, with single female/mother families (3 | 4.9%) accounting for the largest median family size of 2.33 persons per family. On the other hand, married-couple families (56 | 91.8%) represent the smallest median family size with 1.25 persons per family.
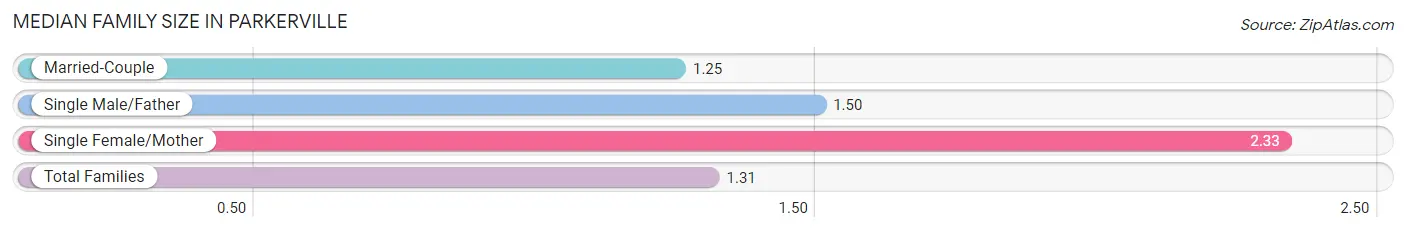
| Family Type | # Families | Family Size |
| Married-Couple | 56 (91.8%) | 1.25 |
| Single Male/Father | 2 (3.3%) | 1.50 |
| Single Female/Mother | 3 (4.9%) | 2.33 |
| Total Families | 61 (100.0%) | 1.31 |
Median Household Size in Parkerville
The median household size in Parkerville is 1.33 persons per household, with single male/father households (2 | 3.2%) accounting for the largest median household size of 2.5 persons per household. non-family households (2 | 3.2%) represent the smallest median household size with 1.00 persons per household.
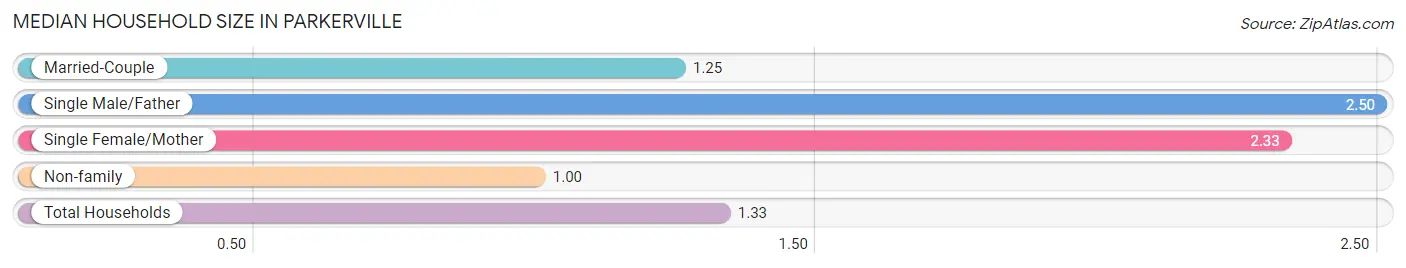
| Household Type | # Households | Household Size |
| Married-Couple | 56 (88.9%) | 1.25 |
| Single Male/Father | 2 (3.2%) | 2.50 |
| Single Female/Mother | 3 (4.8%) | 2.33 |
| Non-family | 2 (3.2%) | 1.00 |
| Total Households | 63 (100.0%) | 1.33 |
Household Size by Marriage Status in Parkerville
Out of a total of 63 households in Parkerville, 61 (96.8%) are family households, while 2 (3.2%) are nonfamily households. The most numerous type of family households are 2-person households, comprising 56, and the most common type of nonfamily households are 1-person households, comprising 2.
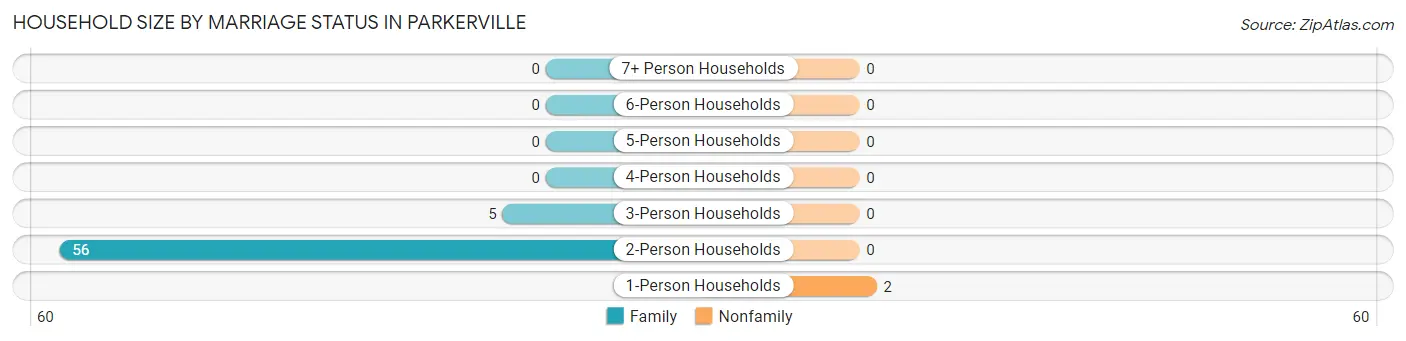
| Household Size | Family Households | Nonfamily Households |
| 1-Person Households | - | 2 (3.2%) |
| 2-Person Households | 56 (88.9%) | 0 (0.0%) |
| 3-Person Households | 5 (7.9%) | 0 (0.0%) |
| 4-Person Households | 0 (0.0%) | 0 (0.0%) |
| 5-Person Households | 0 (0.0%) | 0 (0.0%) |
| 6-Person Households | 0 (0.0%) | 0 (0.0%) |
| 7+ Person Households | 0 (0.0%) | 0 (0.0%) |
| Total | 61 (96.8%) | 2 (3.2%) |
Female Fertility in Parkerville
Fertility by Age in Parkerville
| Age Bracket | Women with Births | Births / 1,000 Women |
| 15 to 19 years | 0 (0.0%) | 0.0 |
| 20 to 34 years | 0 (0.0%) | 0.0 |
| 35 to 50 years | 0 (0.0%) | 0.0 |
| Total | 0 (0.0%) | 0.0 |
Fertility by Age by Marriage Status in Parkerville
| Age Bracket | Married | Unmarried |
| 15 to 19 years | 0 (0.0%) | 0 (0.0%) |
| 20 to 34 years | 0 (0.0%) | 0 (0.0%) |
| 35 to 50 years | 0 (0.0%) | 0 (0.0%) |
| Total | 0 (0.0%) | 0 (0.0%) |
Fertility by Education in Parkerville
| Educational Attainment | Women with Births | Births / 1,000 Women |
| Less than High School | 0 (0.0%) | 0.0 |
| High School Diploma | 0 (0.0%) | 0.0 |
| College or Associate's Degree | 0 (0.0%) | 0.0 |
| Bachelor's Degree | 0 (0.0%) | 0.0 |
| Graduate Degree | 0 (0.0%) | 0.0 |
| Total | 0 (0.0%) | 0.0 |
Fertility by Education by Marriage Status in Parkerville
| Educational Attainment | Married | Unmarried |
| Less than High School | 0 (0.0%) | 0 (0.0%) |
| High School Diploma | 0 (0.0%) | 0 (0.0%) |
| College or Associate's Degree | 0 (0.0%) | 0 (0.0%) |
| Bachelor's Degree | 0 (0.0%) | 0 (0.0%) |
| Graduate Degree | 0 (0.0%) | 0 (0.0%) |
| Total | 0 (0.0%) | 0 (0.0%) |
Employment Characteristics in Parkerville
Employment by Class of Employer in Parkerville
Among the 7 employed individuals in Parkerville, , and private company employees (7 | 100.0%) make up the most common classes of employment.
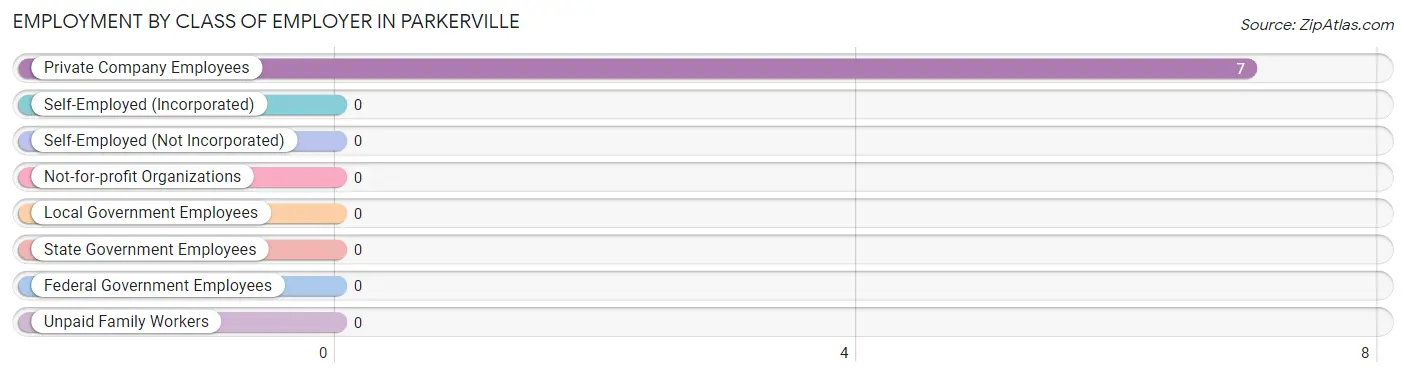
| Employer Class | # Employees | % Employees |
| Private Company Employees | 7 | 100.0% |
| Self-Employed (Incorporated) | 0 | 0.0% |
| Self-Employed (Not Incorporated) | 0 | 0.0% |
| Not-for-profit Organizations | 0 | 0.0% |
| Local Government Employees | 0 | 0.0% |
| State Government Employees | 0 | 0.0% |
| Federal Government Employees | 0 | 0.0% |
| Unpaid Family Workers | 0 | 0.0% |
| Total | 7 | 100.0% |
Employment Status by Age in Parkerville
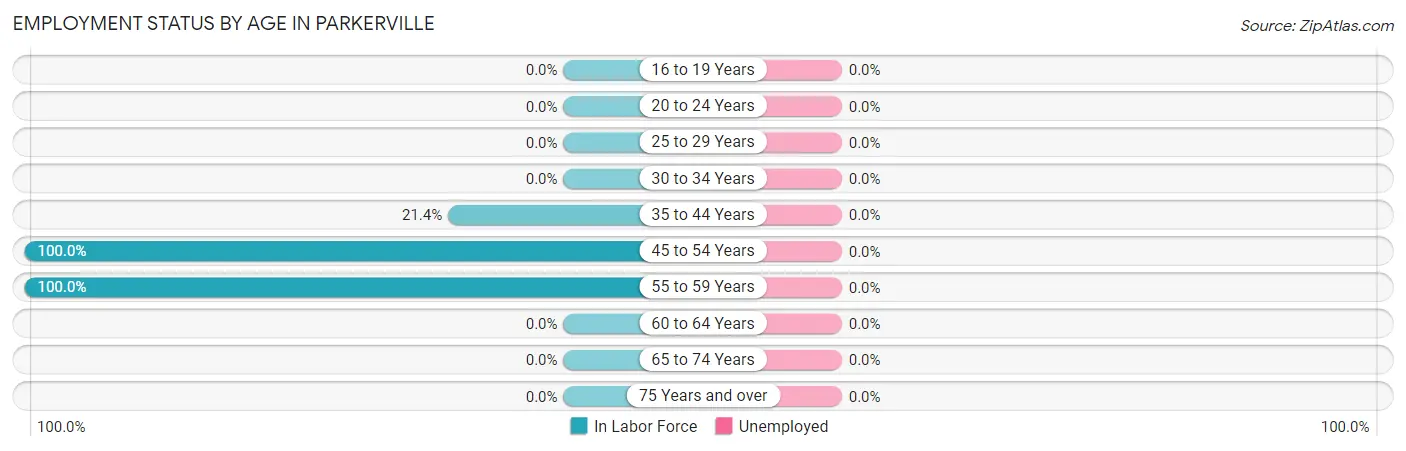
| Age Bracket | In Labor Force | Unemployed |
| 16 to 19 Years | 0 (0.0%) | 0 (0.0%) |
| 20 to 24 Years | 0 (0.0%) | 0 (0.0%) |
| 25 to 29 Years | 0 (0.0%) | 0 (0.0%) |
| 30 to 34 Years | 0 (0.0%) | 0 (0.0%) |
| 35 to 44 Years | 3 (21.4%) | 0 (0.0%) |
| 45 to 54 Years | 1 (100.0%) | 0 (0.0%) |
| 55 to 59 Years | 3 (100.0%) | 0 (0.0%) |
| 60 to 64 Years | 0 (0.0%) | 0 (0.0%) |
| 65 to 74 Years | 0 (0.0%) | 0 (0.0%) |
| 75 Years and over | 0 (0.0%) | 0 (0.0%) |
| Total | 7 (8.3%) | 0 (0.0%) |
Employment Status by Educational Attainment in Parkerville
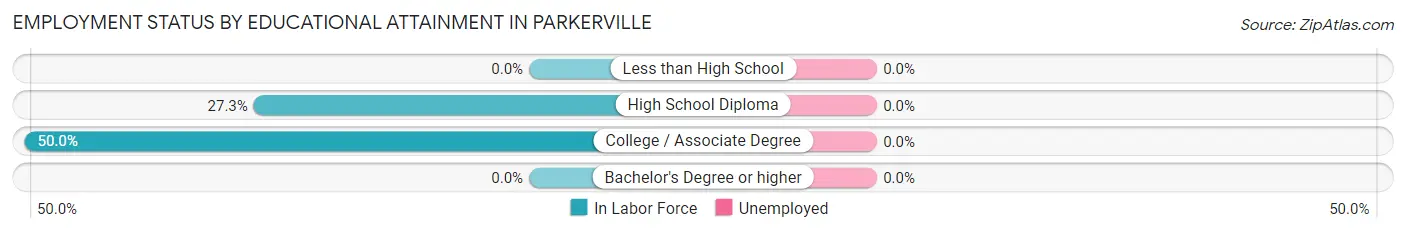
| Educational Attainment | In Labor Force | Unemployed |
| Less than High School | 0 (0.0%) | 0 (0.0%) |
| High School Diploma | 3 (27.3%) | 0 (0.0%) |
| College / Associate Degree | 4 (50.0%) | 0 (0.0%) |
| Bachelor's Degree or higher | 0 (0.0%) | 0 (0.0%) |
| Total | 7 (36.8%) | 0 (0.0%) |
Employment Occupations by Sex in Parkerville
Management, Business, Science and Arts Occupations
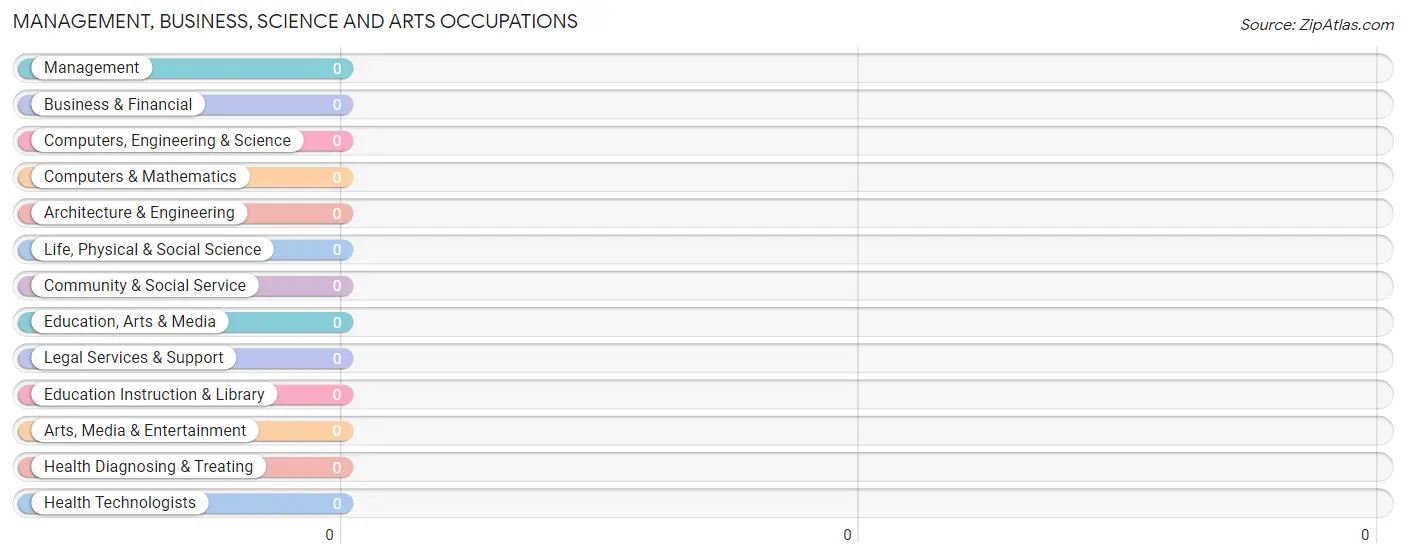
Management, Business, Science and Arts Occupations by Sex
| Occupation | Male | Female |
| Management | 0 (0.0%) | 0 (0.0%) |
| Business & Financial | 0 (0.0%) | 0 (0.0%) |
| Computers, Engineering & Science | 0 (0.0%) | 0 (0.0%) |
| Computers & Mathematics | 0 (0.0%) | 0 (0.0%) |
| Architecture & Engineering | 0 (0.0%) | 0 (0.0%) |
| Life, Physical & Social Science | 0 (0.0%) | 0 (0.0%) |
| Community & Social Service | 0 (0.0%) | 0 (0.0%) |
| Education, Arts & Media | 0 (0.0%) | 0 (0.0%) |
| Legal Services & Support | 0 (0.0%) | 0 (0.0%) |
| Education Instruction & Library | 0 (0.0%) | 0 (0.0%) |
| Arts, Media & Entertainment | 0 (0.0%) | 0 (0.0%) |
| Health Diagnosing & Treating | 0 (0.0%) | 0 (0.0%) |
| Health Technologists | 0 (0.0%) | 0 (0.0%) |
| Total (Category) | 0 (0.0%) | 0 (0.0%) |
| Total (Overall) | 0 (0.0%) | 7 (100.0%) |
Services Occupations
The most common Services occupations in Parkerville are , and Food Preparation & Serving (3 | 42.9%).
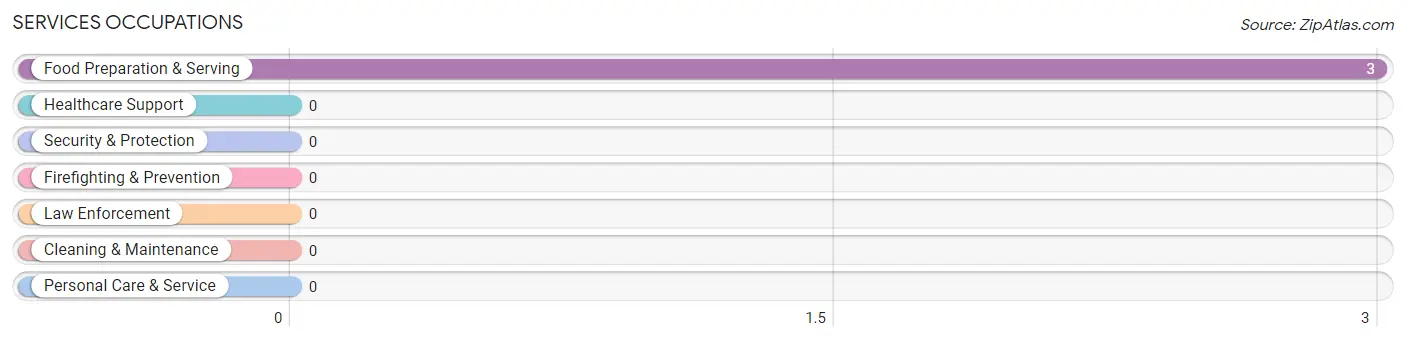
Services Occupations by Sex
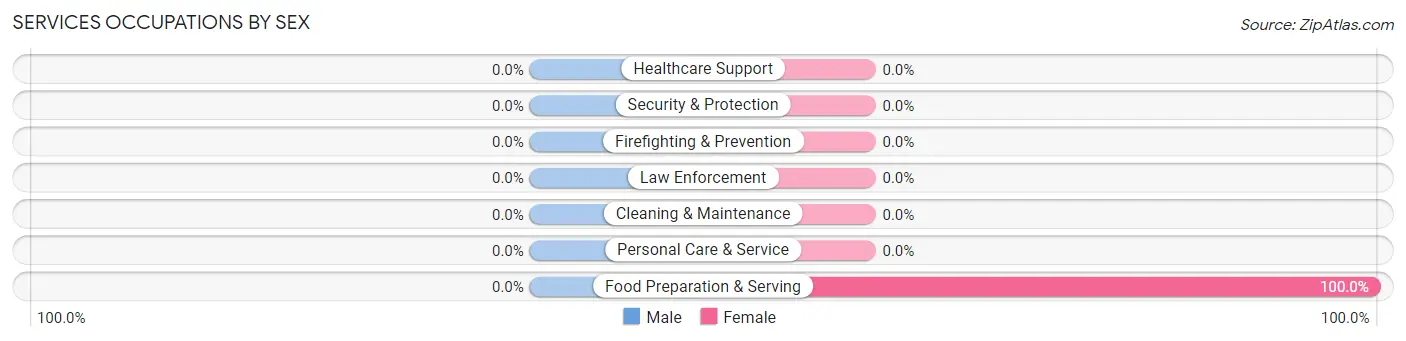
| Occupation | Male | Female |
| Healthcare Support | 0 (0.0%) | 0 (0.0%) |
| Security & Protection | 0 (0.0%) | 0 (0.0%) |
| Firefighting & Prevention | 0 (0.0%) | 0 (0.0%) |
| Law Enforcement | 0 (0.0%) | 0 (0.0%) |
| Food Preparation & Serving | 0 (0.0%) | 3 (100.0%) |
| Cleaning & Maintenance | 0 (0.0%) | 0 (0.0%) |
| Personal Care & Service | 0 (0.0%) | 0 (0.0%) |
| Total (Category) | 0 (0.0%) | 3 (100.0%) |
| Total (Overall) | 0 (0.0%) | 7 (100.0%) |
Sales and Office Occupations
The most common Sales and Office occupations in Parkerville are , and Sales & Related (3 | 42.9%).

Sales and Office Occupations by Sex

| Occupation | Male | Female |
| Sales & Related | 0 (0.0%) | 3 (100.0%) |
| Office & Administration | 0 (0.0%) | 0 (0.0%) |
| Total (Category) | 0 (0.0%) | 3 (100.0%) |
| Total (Overall) | 0 (0.0%) | 7 (100.0%) |
Natural Resources, Construction and Maintenance Occupations

Natural Resources, Construction and Maintenance Occupations by Sex

| Occupation | Male | Female |
| Farming, Fishing & Forestry | 0 (0.0%) | 0 (0.0%) |
| Construction & Extraction | 0 (0.0%) | 0 (0.0%) |
| Installation, Maintenance & Repair | 0 (0.0%) | 0 (0.0%) |
| Total (Category) | 0 (0.0%) | 0 (0.0%) |
| Total (Overall) | 0 (0.0%) | 7 (100.0%) |
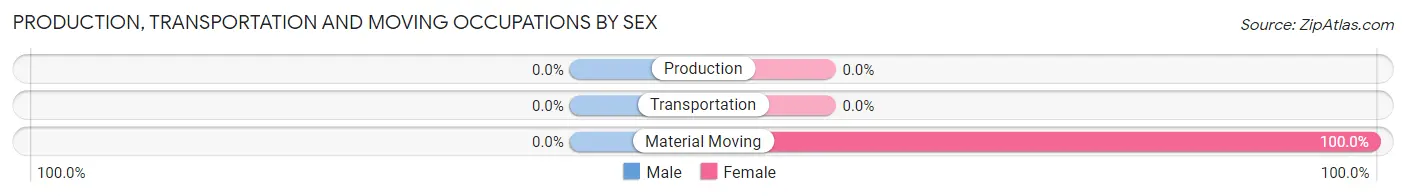
Production, Transportation and Moving Occupations
The most common Production, Transportation and Moving occupations in Parkerville are , and Material Moving (1 | 14.3%).
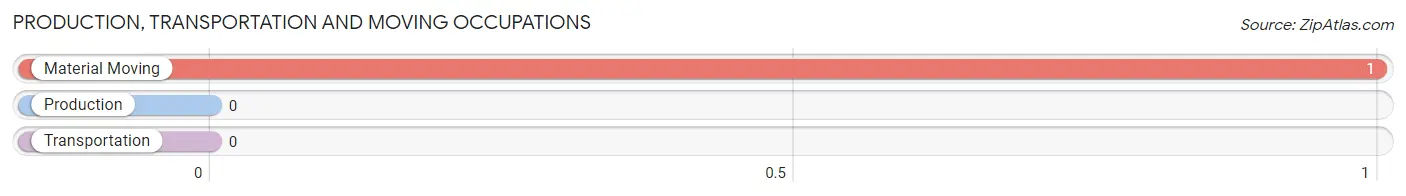
Production, Transportation and Moving Occupations by Sex
| Occupation | Male | Female |
| Production | 0 (0.0%) | 0 (0.0%) |
| Transportation | 0 (0.0%) | 0 (0.0%) |
| Material Moving | 0 (0.0%) | 1 (100.0%) |
| Total (Category) | 0 (0.0%) | 1 (100.0%) |
| Total (Overall) | 0 (0.0%) | 7 (100.0%) |
Employment Industries by Sex in Parkerville
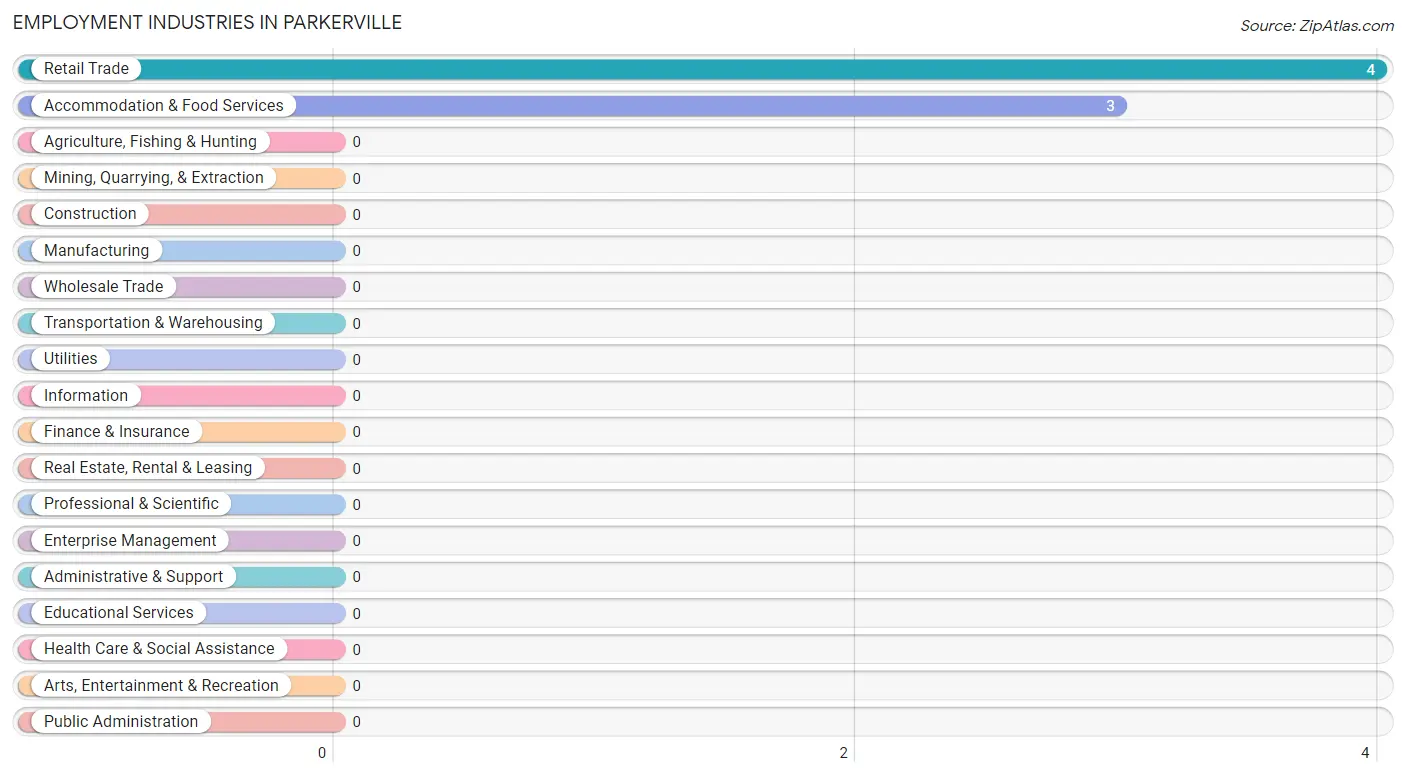
Employment Industries in Parkerville
The major employment industries in Parkerville include Retail Trade (4 | 57.1%), and Accommodation & Food Services (3 | 42.9%).
Employment Industries by Sex in Parkerville
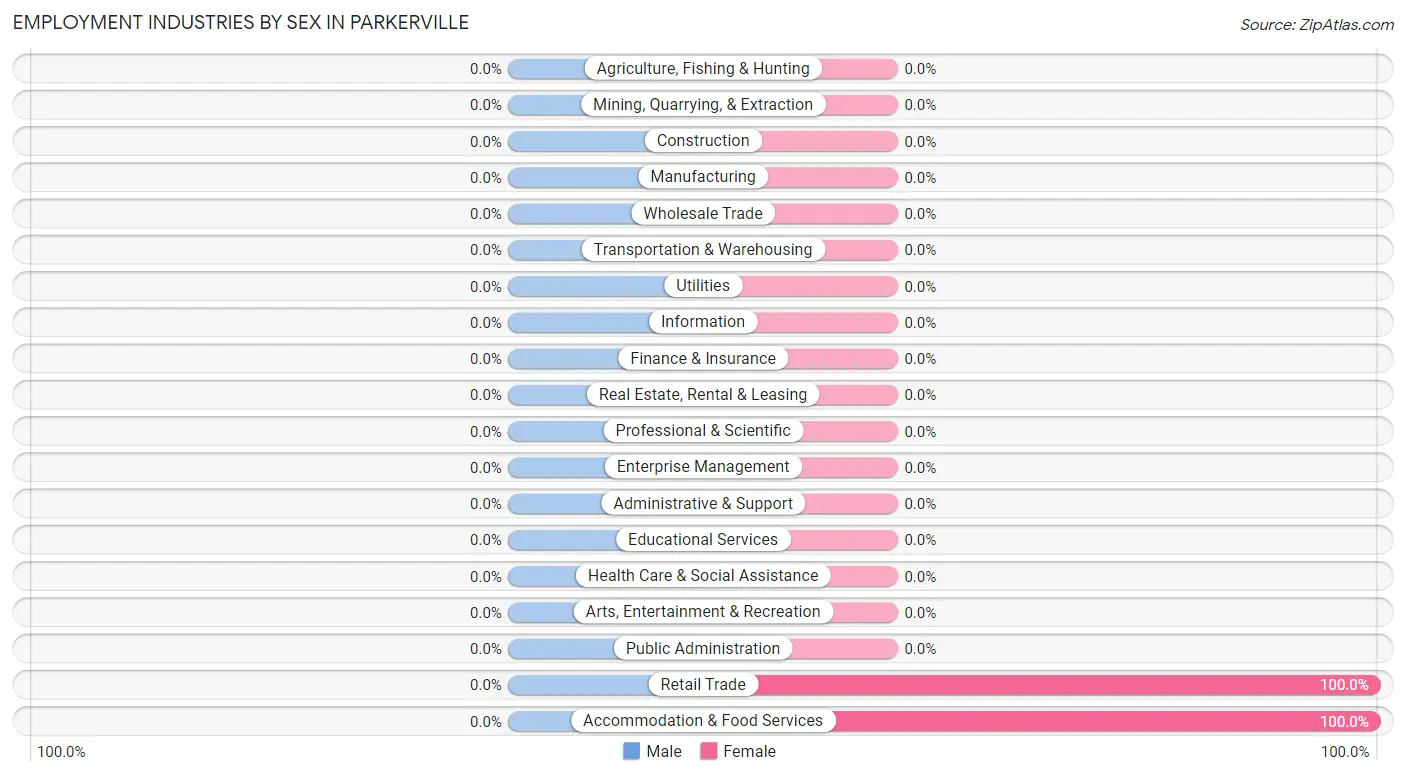
| Industry | Male | Female |
| Agriculture, Fishing & Hunting | 0 (0.0%) | 0 (0.0%) |
| Mining, Quarrying, & Extraction | 0 (0.0%) | 0 (0.0%) |
| Construction | 0 (0.0%) | 0 (0.0%) |
| Manufacturing | 0 (0.0%) | 0 (0.0%) |
| Wholesale Trade | 0 (0.0%) | 0 (0.0%) |
| Retail Trade | 0 (0.0%) | 4 (100.0%) |
| Transportation & Warehousing | 0 (0.0%) | 0 (0.0%) |
| Utilities | 0 (0.0%) | 0 (0.0%) |
| Information | 0 (0.0%) | 0 (0.0%) |
| Finance & Insurance | 0 (0.0%) | 0 (0.0%) |
| Real Estate, Rental & Leasing | 0 (0.0%) | 0 (0.0%) |
| Professional & Scientific | 0 (0.0%) | 0 (0.0%) |
| Enterprise Management | 0 (0.0%) | 0 (0.0%) |
| Administrative & Support | 0 (0.0%) | 0 (0.0%) |
| Educational Services | 0 (0.0%) | 0 (0.0%) |
| Health Care & Social Assistance | 0 (0.0%) | 0 (0.0%) |
| Arts, Entertainment & Recreation | 0 (0.0%) | 0 (0.0%) |
| Accommodation & Food Services | 0 (0.0%) | 3 (100.0%) |
| Public Administration | 0 (0.0%) | 0 (0.0%) |
| Total | 0 (0.0%) | 7 (100.0%) |
Education in Parkerville
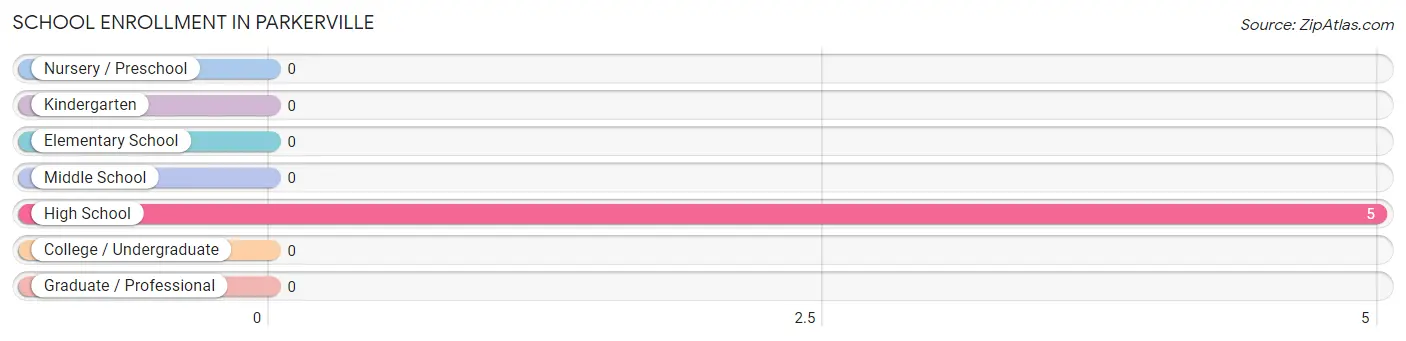
School Enrollment in Parkerville
| School Level | # Students | % Students |
| Nursery / Preschool | 0 | 0.0% |
| Kindergarten | 0 | 0.0% |
| Elementary School | 0 | 0.0% |
| Middle School | 0 | 0.0% |
| High School | 5 | 100.0% |
| College / Undergraduate | 0 | 0.0% |
| Graduate / Professional | 0 | 0.0% |
| Total | 5 | 100.0% |
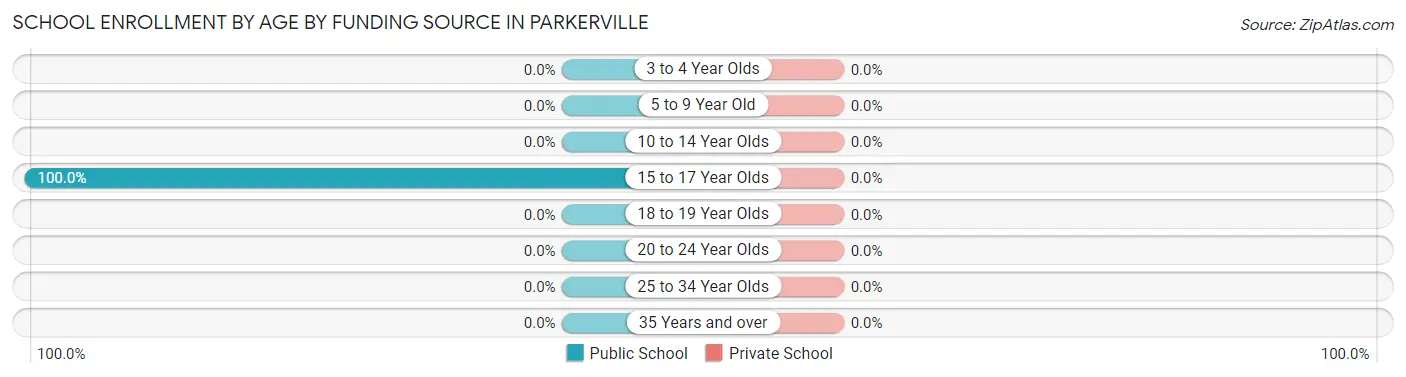
School Enrollment by Age by Funding Source in Parkerville
| Age Bracket | Public School | Private School |
| 3 to 4 Year Olds | 0 (0.0%) | 0 (0.0%) |
| 5 to 9 Year Old | 0 (0.0%) | 0 (0.0%) |
| 10 to 14 Year Olds | 0 (0.0%) | 0 (0.0%) |
| 15 to 17 Year Olds | 5 (100.0%) | 0 (0.0%) |
| 18 to 19 Year Olds | 0 (0.0%) | 0 (0.0%) |
| 20 to 24 Year Olds | 0 (0.0%) | 0 (0.0%) |
| 25 to 34 Year Olds | 0 (0.0%) | 0 (0.0%) |
| 35 Years and over | 0 (0.0%) | 0 (0.0%) |
| Total | 5 (100.0%) | 0 (0.0%) |
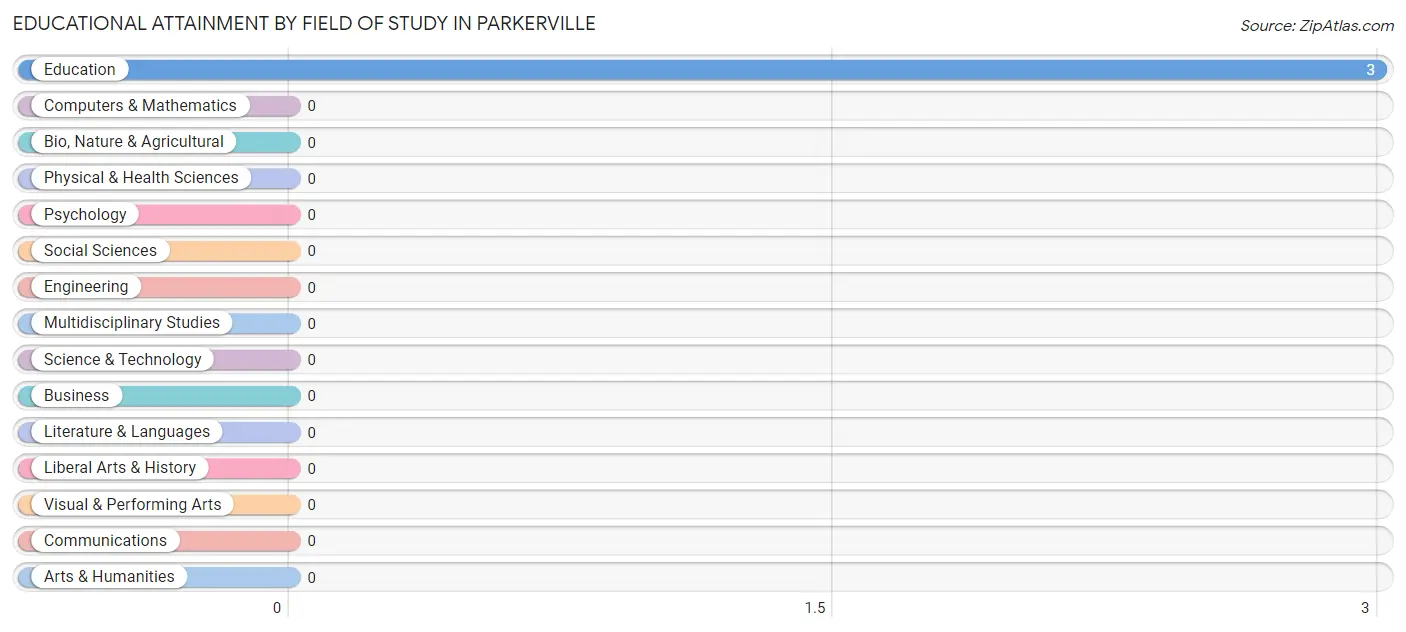
Educational Attainment by Field of Study in Parkerville
, and education (3 | 100.0%) are the most common fields of study among 3 individuals in Parkerville who have obtained a bachelor's degree or higher.
| Field of Study | # Graduates | % Graduates |
| Computers & Mathematics | 0 | 0.0% |
| Bio, Nature & Agricultural | 0 | 0.0% |
| Physical & Health Sciences | 0 | 0.0% |
| Psychology | 0 | 0.0% |
| Social Sciences | 0 | 0.0% |
| Engineering | 0 | 0.0% |
| Multidisciplinary Studies | 0 | 0.0% |
| Science & Technology | 0 | 0.0% |
| Business | 0 | 0.0% |
| Education | 3 | 100.0% |
| Literature & Languages | 0 | 0.0% |
| Liberal Arts & History | 0 | 0.0% |
| Visual & Performing Arts | 0 | 0.0% |
| Communications | 0 | 0.0% |
| Arts & Humanities | 0 | 0.0% |
| Total | 3 | 100.0% |
Transportation & Commute in Parkerville
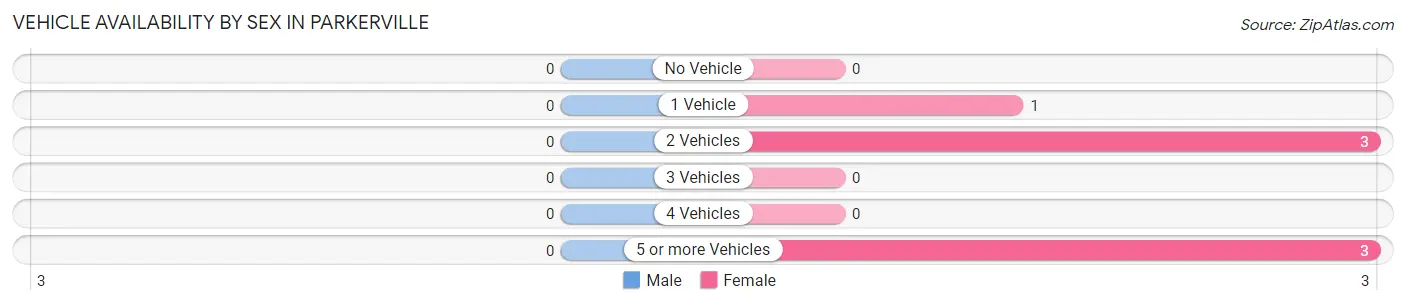
Vehicle Availability by Sex in Parkerville
| Vehicles Available | Male | Female |
| No Vehicle | 0 (0.0%) | 0 (0.0%) |
| 1 Vehicle | 0 (0.0%) | 1 (14.3%) |
| 2 Vehicles | 0 (0.0%) | 3 (42.9%) |
| 3 Vehicles | 0 (0.0%) | 0 (0.0%) |
| 4 Vehicles | 0 (0.0%) | 0 (0.0%) |
| 5 or more Vehicles | 0 (0.0%) | 3 (42.9%) |
| Total | 0 (0.0%) | 7 (100.0%) |
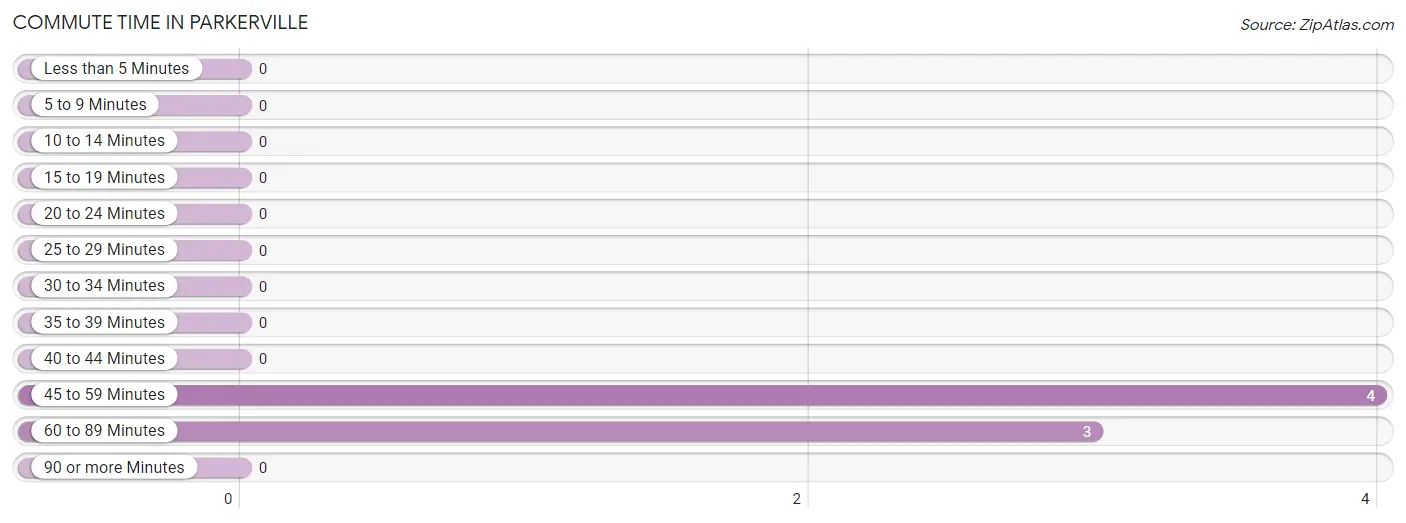
Commute Time in Parkerville
The most frequently occuring commute durations in Parkerville are 45 to 59 minutes (4 commuters, 57.1%), 60 to 89 minutes (3 commuters, 42.9%), and less than 5 minutes (0 commuters, 0.0%).
| Commute Time | # Commuters | % Commuters |
| Less than 5 Minutes | 0 | 0.0% |
| 5 to 9 Minutes | 0 | 0.0% |
| 10 to 14 Minutes | 0 | 0.0% |
| 15 to 19 Minutes | 0 | 0.0% |
| 20 to 24 Minutes | 0 | 0.0% |
| 25 to 29 Minutes | 0 | 0.0% |
| 30 to 34 Minutes | 0 | 0.0% |
| 35 to 39 Minutes | 0 | 0.0% |
| 40 to 44 Minutes | 0 | 0.0% |
| 45 to 59 Minutes | 4 | 57.1% |
| 60 to 89 Minutes | 3 | 42.9% |
| 90 or more Minutes | 0 | 0.0% |
Commute Time by Sex in Parkerville
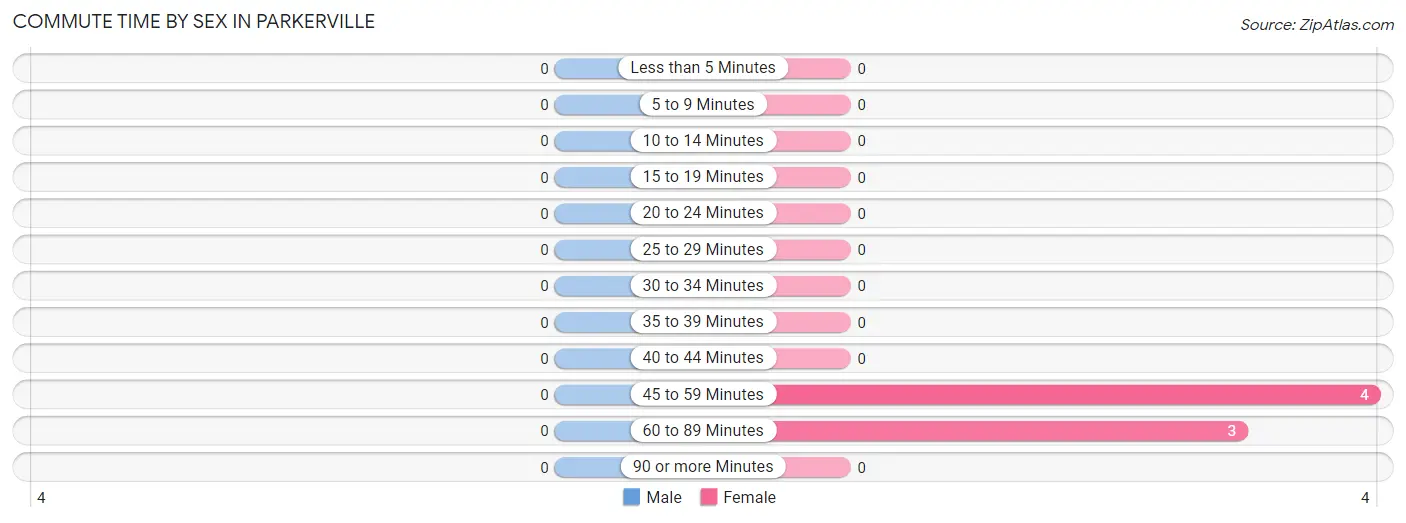
| Commute Time | Male | Female |
| Less than 5 Minutes | 0 (0.0%) | 0 (0.0%) |
| 5 to 9 Minutes | 0 (0.0%) | 0 (0.0%) |
| 10 to 14 Minutes | 0 (0.0%) | 0 (0.0%) |
| 15 to 19 Minutes | 0 (0.0%) | 0 (0.0%) |
| 20 to 24 Minutes | 0 (0.0%) | 0 (0.0%) |
| 25 to 29 Minutes | 0 (0.0%) | 0 (0.0%) |
| 30 to 34 Minutes | 0 (0.0%) | 0 (0.0%) |
| 35 to 39 Minutes | 0 (0.0%) | 0 (0.0%) |
| 40 to 44 Minutes | 0 (0.0%) | 0 (0.0%) |
| 45 to 59 Minutes | 0 (0.0%) | 4 (57.1%) |
| 60 to 89 Minutes | 0 (0.0%) | 3 (42.9%) |
| 90 or more Minutes | 0 (0.0%) | 0 (0.0%) |
Time of Departure to Work by Sex in Parkerville
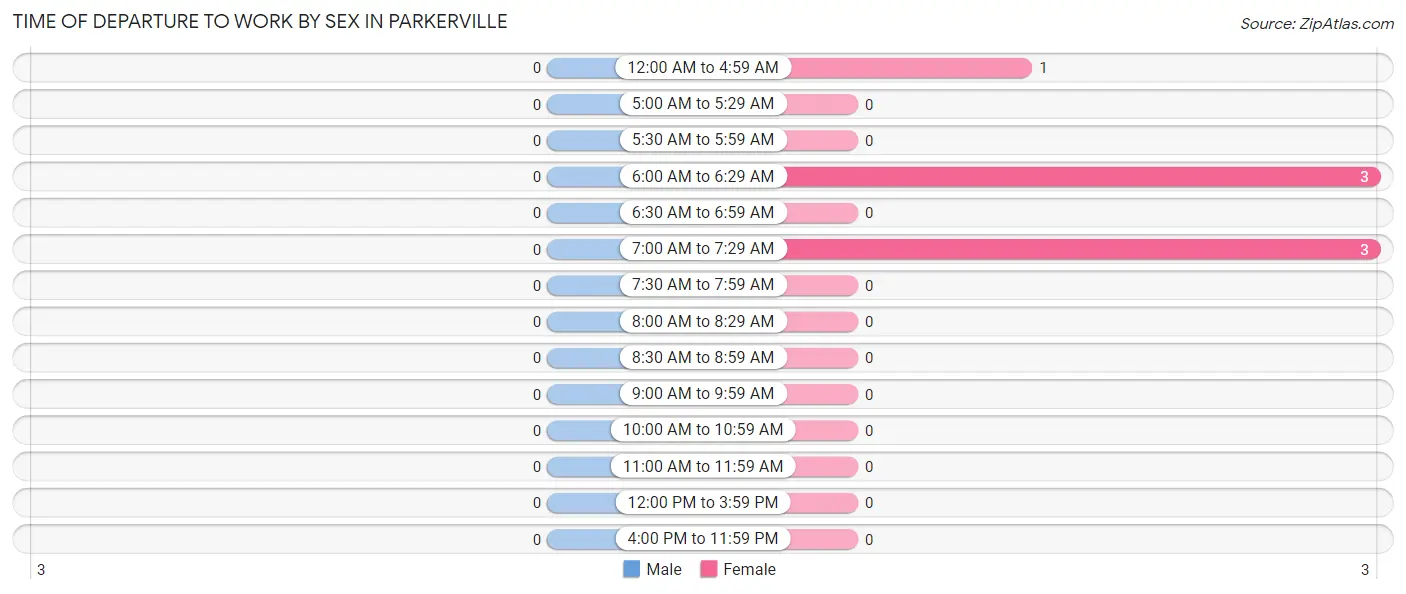
| Time of Departure | Male | Female |
| 12:00 AM to 4:59 AM | 0 (0.0%) | 1 (14.3%) |
| 5:00 AM to 5:29 AM | 0 (0.0%) | 0 (0.0%) |
| 5:30 AM to 5:59 AM | 0 (0.0%) | 0 (0.0%) |
| 6:00 AM to 6:29 AM | 0 (0.0%) | 3 (42.9%) |
| 6:30 AM to 6:59 AM | 0 (0.0%) | 0 (0.0%) |
| 7:00 AM to 7:29 AM | 0 (0.0%) | 3 (42.9%) |
| 7:30 AM to 7:59 AM | 0 (0.0%) | 0 (0.0%) |
| 8:00 AM to 8:29 AM | 0 (0.0%) | 0 (0.0%) |
| 8:30 AM to 8:59 AM | 0 (0.0%) | 0 (0.0%) |
| 9:00 AM to 9:59 AM | 0 (0.0%) | 0 (0.0%) |
| 10:00 AM to 10:59 AM | 0 (0.0%) | 0 (0.0%) |
| 11:00 AM to 11:59 AM | 0 (0.0%) | 0 (0.0%) |
| 12:00 PM to 3:59 PM | 0 (0.0%) | 0 (0.0%) |
| 4:00 PM to 11:59 PM | 0 (0.0%) | 0 (0.0%) |
| Total | 0 (0.0%) | 7 (100.0%) |
Housing Occupancy in Parkerville
Occupancy by Ownership in Parkerville
Of the total 63 dwellings in Parkerville, owner-occupied units account for 62 (98.4%), while renter-occupied units make up 1 (1.6%).
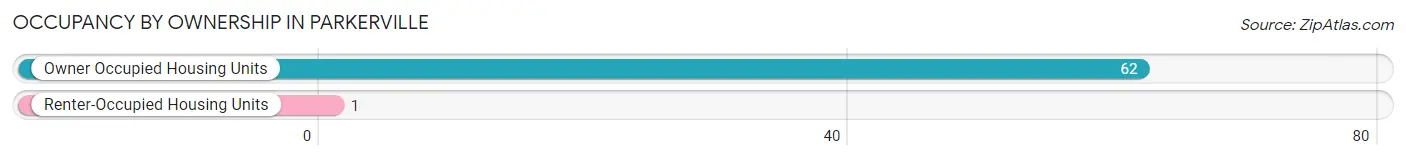
| Occupancy | # Housing Units | % Housing Units |
| Owner Occupied Housing Units | 62 | 98.4% |
| Renter-Occupied Housing Units | 1 | 1.6% |
| Total Occupied Housing Units | 63 | 100.0% |
Occupancy by Household Size in Parkerville
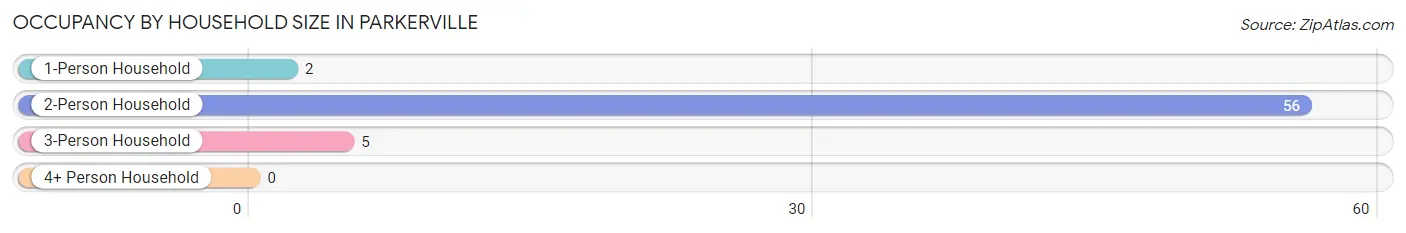
| Household Size | # Housing Units | % Housing Units |
| 1-Person Household | 2 | 3.2% |
| 2-Person Household | 56 | 88.9% |
| 3-Person Household | 5 | 7.9% |
| 4+ Person Household | 0 | 0.0% |
| Total Housing Units | 63 | 100.0% |
Occupancy by Ownership by Household Size in Parkerville
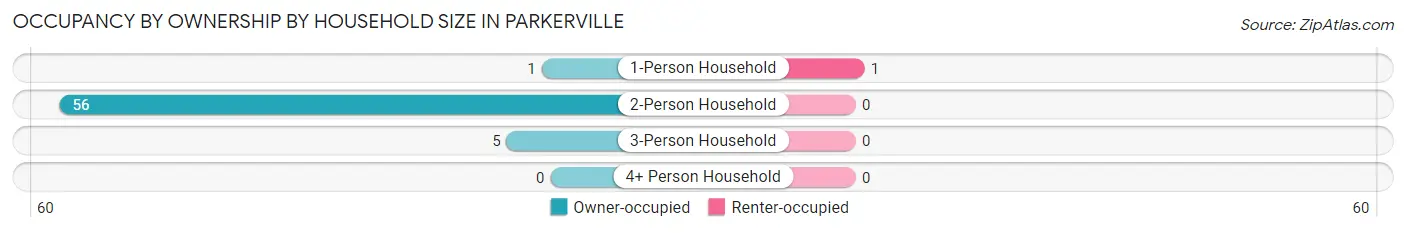
| Household Size | Owner-occupied | Renter-occupied |
| 1-Person Household | 1 (50.0%) | 1 (50.0%) |
| 2-Person Household | 56 (100.0%) | 0 (0.0%) |
| 3-Person Household | 5 (100.0%) | 0 (0.0%) |
| 4+ Person Household | 0 (0.0%) | 0 (0.0%) |
| Total Housing Units | 62 (98.4%) | 1 (1.6%) |
Occupancy by Educational Attainment in Parkerville
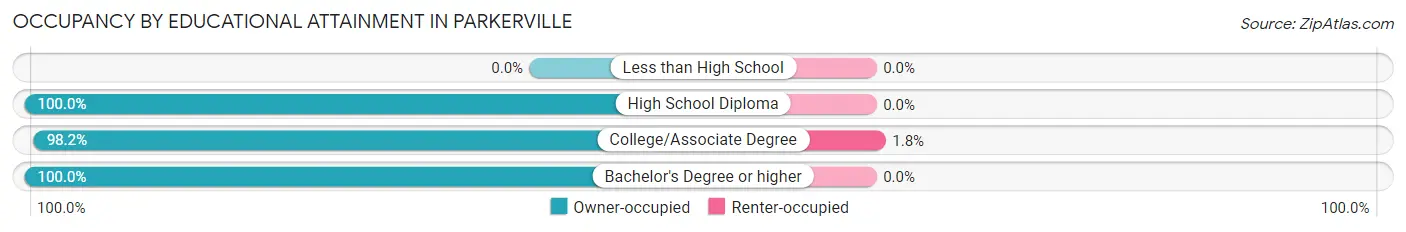
| Household Size | Owner-occupied | Renter-occupied |
| Less than High School | 0 (0.0%) | 0 (0.0%) |
| High School Diploma | 5 (100.0%) | 0 (0.0%) |
| College/Associate Degree | 54 (98.2%) | 1 (1.8%) |
| Bachelor's Degree or higher | 3 (100.0%) | 0 (0.0%) |
Occupancy by Age of Householder in Parkerville
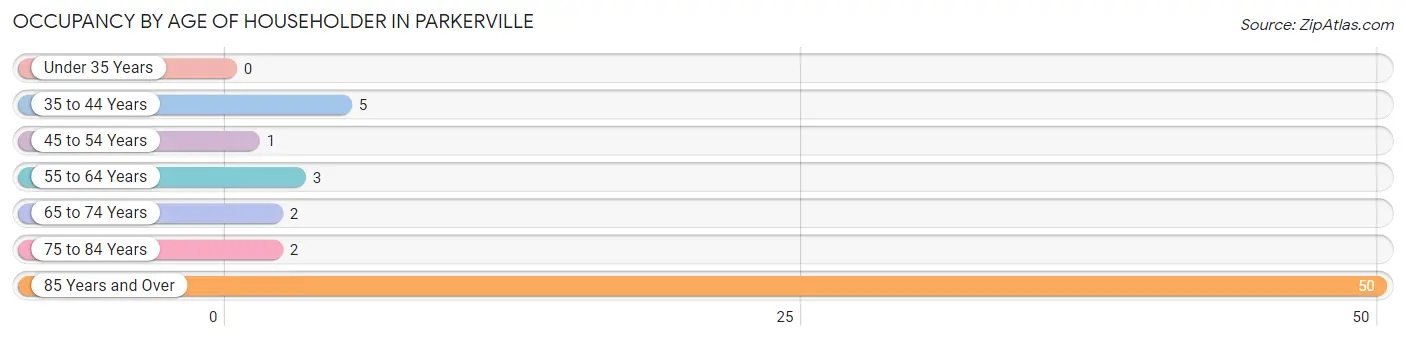
| Age Bracket | # Households | % Households |
| Under 35 Years | 0 | 0.0% |
| 35 to 44 Years | 5 | 7.9% |
| 45 to 54 Years | 1 | 1.6% |
| 55 to 64 Years | 3 | 4.8% |
| 65 to 74 Years | 2 | 3.2% |
| 75 to 84 Years | 2 | 3.2% |
| 85 Years and Over | 50 | 79.4% |
| Total | 63 | 100.0% |
Housing Finances in Parkerville
Median Income by Occupancy in Parkerville
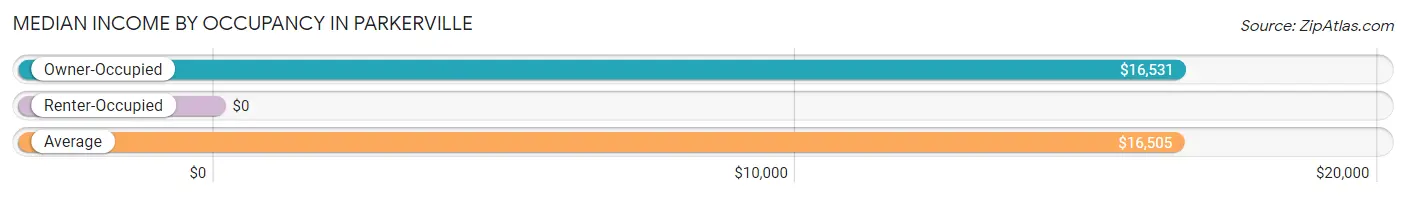
| Occupancy Type | # Households | Median Income |
| Owner-Occupied | 62 (98.4%) | $16,531 |
| Renter-Occupied | 1 (1.6%) | $0 |
| Average | 63 (100.0%) | $16,505 |
Occupancy by Householder Income Bracket in Parkerville
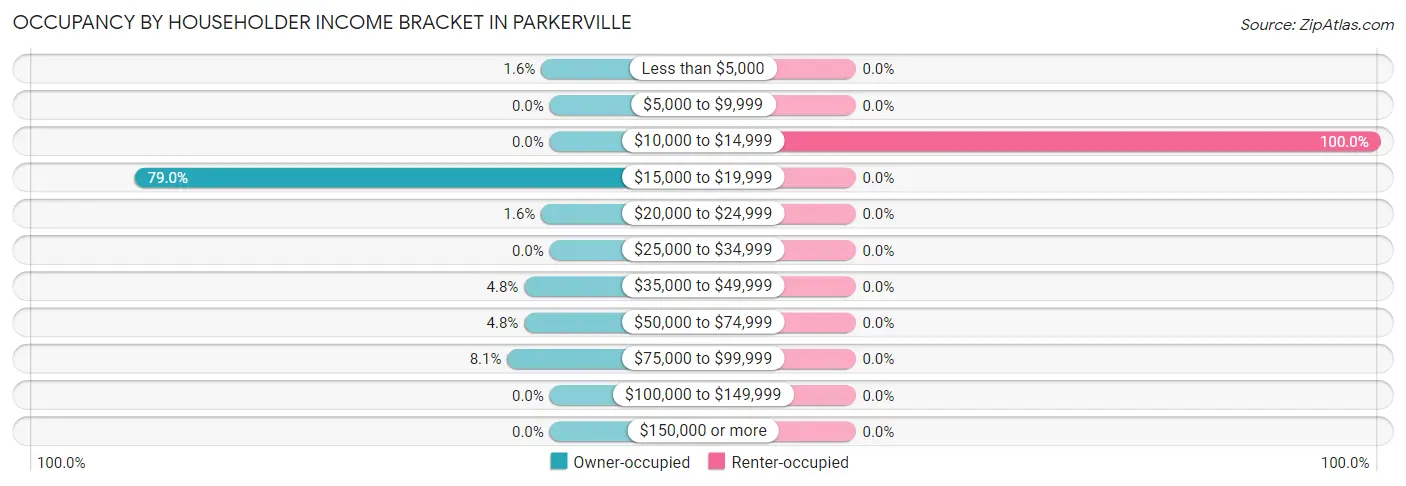
| Income Bracket | Owner-occupied | Renter-occupied |
| Less than $5,000 | 1 (1.6%) | 0 (0.0%) |
| $5,000 to $9,999 | 0 (0.0%) | 0 (0.0%) |
| $10,000 to $14,999 | 0 (0.0%) | 1 (100.0%) |
| $15,000 to $19,999 | 49 (79.0%) | 0 (0.0%) |
| $20,000 to $24,999 | 1 (1.6%) | 0 (0.0%) |
| $25,000 to $34,999 | 0 (0.0%) | 0 (0.0%) |
| $35,000 to $49,999 | 3 (4.8%) | 0 (0.0%) |
| $50,000 to $74,999 | 3 (4.8%) | 0 (0.0%) |
| $75,000 to $99,999 | 5 (8.1%) | 0 (0.0%) |
| $100,000 to $149,999 | 0 (0.0%) | 0 (0.0%) |
| $150,000 or more | 0 (0.0%) | 0 (0.0%) |
| Total | 62 (100.0%) | 1 (100.0%) |
Monthly Housing Cost Tiers in Parkerville
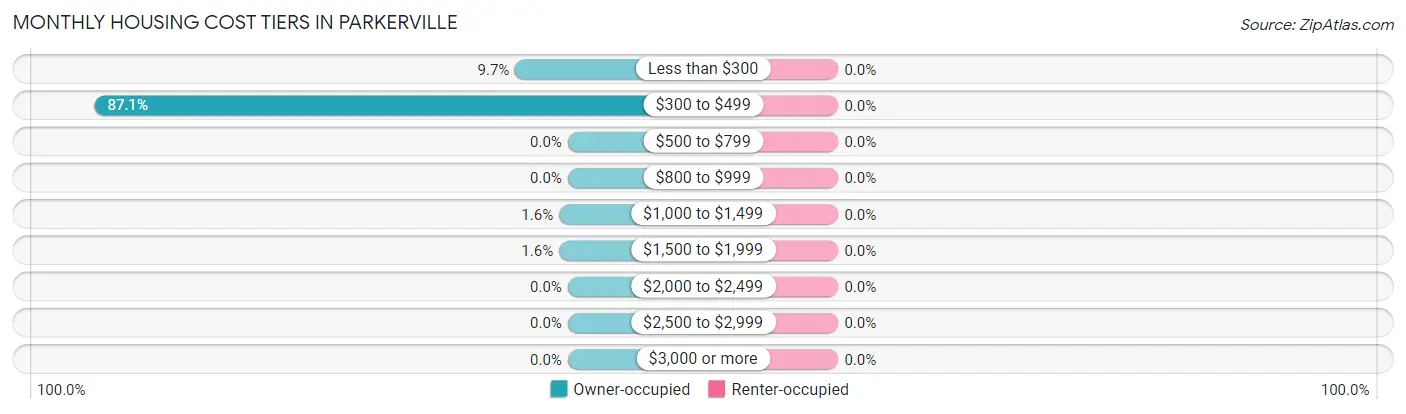
| Monthly Cost | Owner-occupied | Renter-occupied |
| Less than $300 | 6 (9.7%) | 0 (0.0%) |
| $300 to $499 | 54 (87.1%) | 0 (0.0%) |
| $500 to $799 | 0 (0.0%) | 0 (0.0%) |
| $800 to $999 | 0 (0.0%) | 0 (0.0%) |
| $1,000 to $1,499 | 1 (1.6%) | 0 (0.0%) |
| $1,500 to $1,999 | 1 (1.6%) | 0 (0.0%) |
| $2,000 to $2,499 | 0 (0.0%) | 0 (0.0%) |
| $2,500 to $2,999 | 0 (0.0%) | 0 (0.0%) |
| $3,000 or more | 0 (0.0%) | 0 (0.0%) |
| Total | 62 (100.0%) | 1 (100.0%) |
Physical Housing Characteristics in Parkerville
Housing Structures in Parkerville
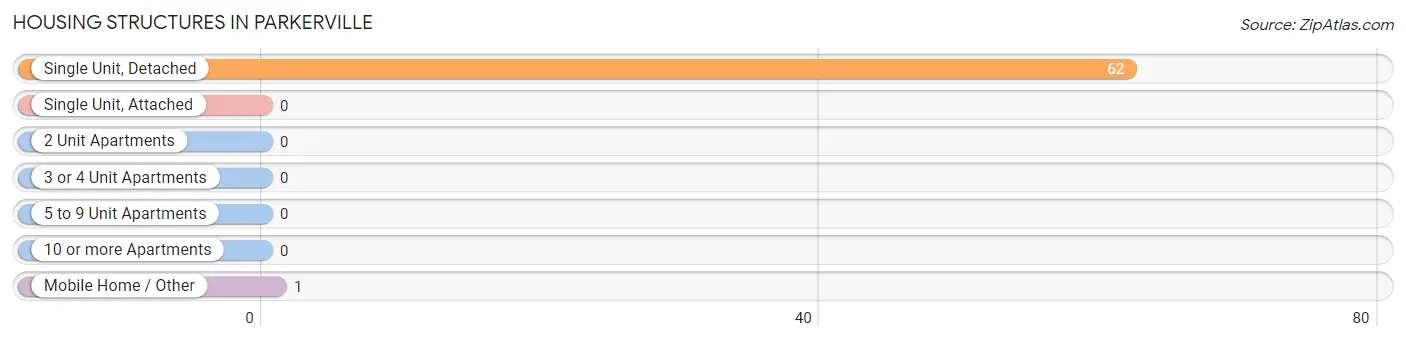
| Structure Type | # Housing Units | % Housing Units |
| Single Unit, Detached | 62 | 98.4% |
| Single Unit, Attached | 0 | 0.0% |
| 2 Unit Apartments | 0 | 0.0% |
| 3 or 4 Unit Apartments | 0 | 0.0% |
| 5 to 9 Unit Apartments | 0 | 0.0% |
| 10 or more Apartments | 0 | 0.0% |
| Mobile Home / Other | 1 | 1.6% |
| Total | 63 | 100.0% |
Housing Structures by Occupancy in Parkerville
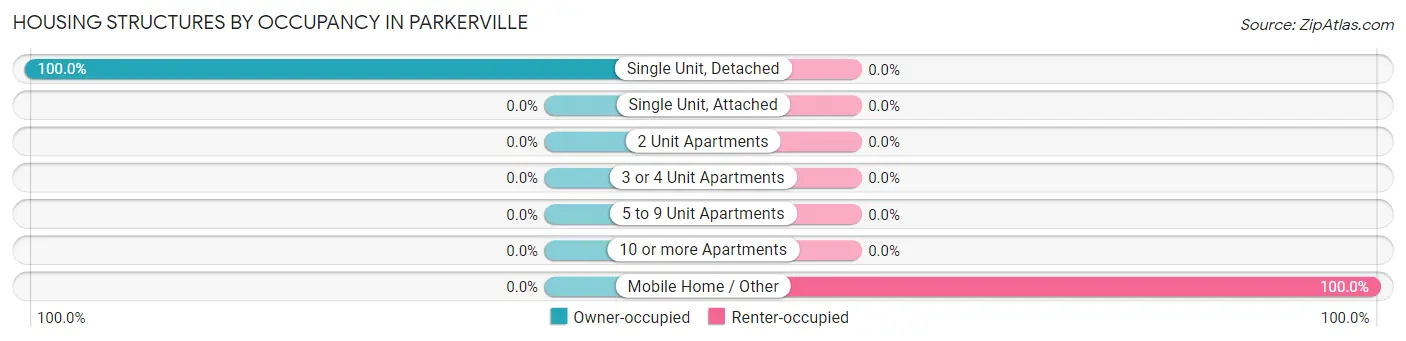
| Structure Type | Owner-occupied | Renter-occupied |
| Single Unit, Detached | 62 (100.0%) | 0 (0.0%) |
| Single Unit, Attached | 0 (0.0%) | 0 (0.0%) |
| 2 Unit Apartments | 0 (0.0%) | 0 (0.0%) |
| 3 or 4 Unit Apartments | 0 (0.0%) | 0 (0.0%) |
| 5 to 9 Unit Apartments | 0 (0.0%) | 0 (0.0%) |
| 10 or more Apartments | 0 (0.0%) | 0 (0.0%) |
| Mobile Home / Other | 0 (0.0%) | 1 (100.0%) |
| Total | 62 (98.4%) | 1 (1.6%) |
Housing Structures by Number of Rooms in Parkerville
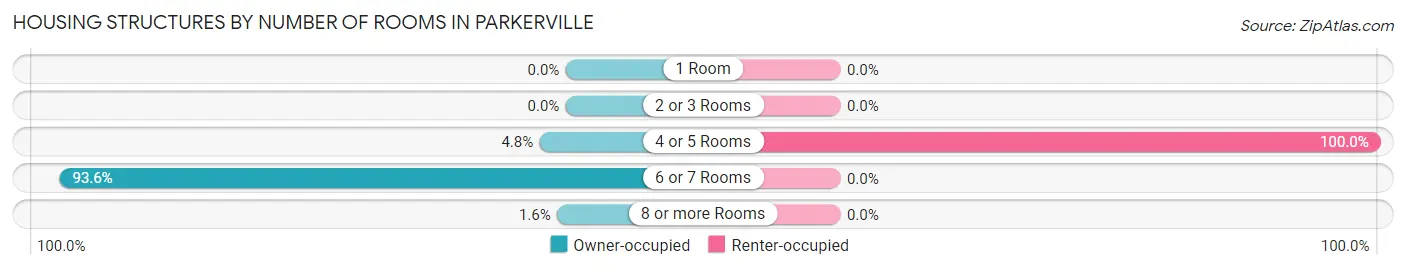
| Number of Rooms | Owner-occupied | Renter-occupied |
| 1 Room | 0 (0.0%) | 0 (0.0%) |
| 2 or 3 Rooms | 0 (0.0%) | 0 (0.0%) |
| 4 or 5 Rooms | 3 (4.8%) | 1 (100.0%) |
| 6 or 7 Rooms | 58 (93.5%) | 0 (0.0%) |
| 8 or more Rooms | 1 (1.6%) | 0 (0.0%) |
| Total | 62 (100.0%) | 1 (100.0%) |
Housing Structure by Heating Type in Parkerville
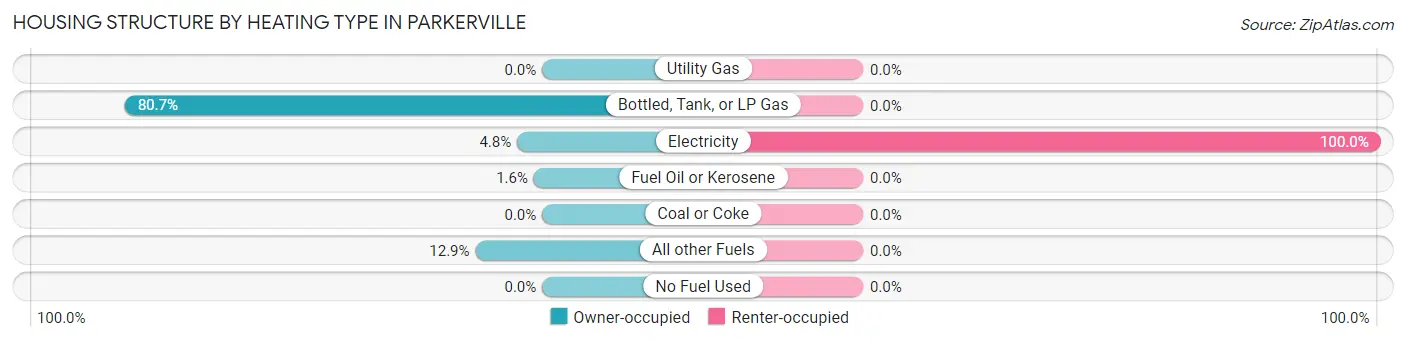
| Heating Type | Owner-occupied | Renter-occupied |
| Utility Gas | 0 (0.0%) | 0 (0.0%) |
| Bottled, Tank, or LP Gas | 50 (80.6%) | 0 (0.0%) |
| Electricity | 3 (4.8%) | 1 (100.0%) |
| Fuel Oil or Kerosene | 1 (1.6%) | 0 (0.0%) |
| Coal or Coke | 0 (0.0%) | 0 (0.0%) |
| All other Fuels | 8 (12.9%) | 0 (0.0%) |
| No Fuel Used | 0 (0.0%) | 0 (0.0%) |
| Total | 62 (100.0%) | 1 (100.0%) |
Household Vehicle Usage in Parkerville
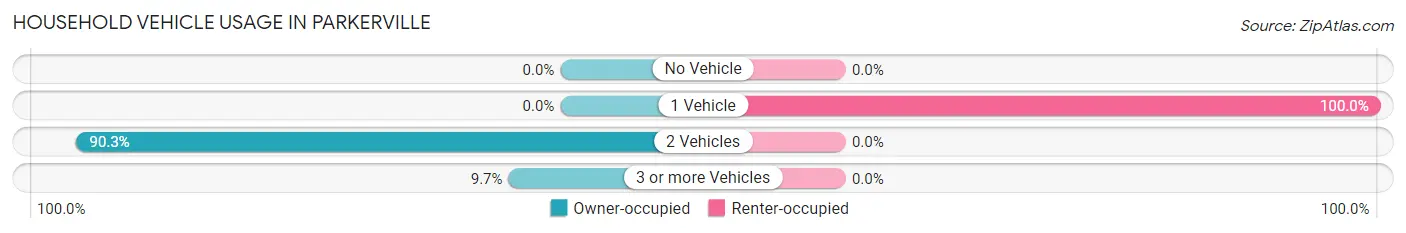
| Vehicles per Household | Owner-occupied | Renter-occupied |
| No Vehicle | 0 (0.0%) | 0 (0.0%) |
| 1 Vehicle | 0 (0.0%) | 1 (100.0%) |
| 2 Vehicles | 56 (90.3%) | 0 (0.0%) |
| 3 or more Vehicles | 6 (9.7%) | 0 (0.0%) |
| Total | 62 (100.0%) | 1 (100.0%) |
Real Estate & Mortgages in Parkerville
Real Estate and Mortgage Overview in Parkerville
| Characteristic | Without Mortgage | With Mortgage |
| Housing Units | 60 | 2 |
| Median Property Value | $53,900 | $0 |
| Median Household Income | $16,480 | $0 |
| Monthly Housing Costs | $442 | $0 |
| Real Estate Taxes | $1,194 | $0 |
Property Value by Mortgage Status in Parkerville
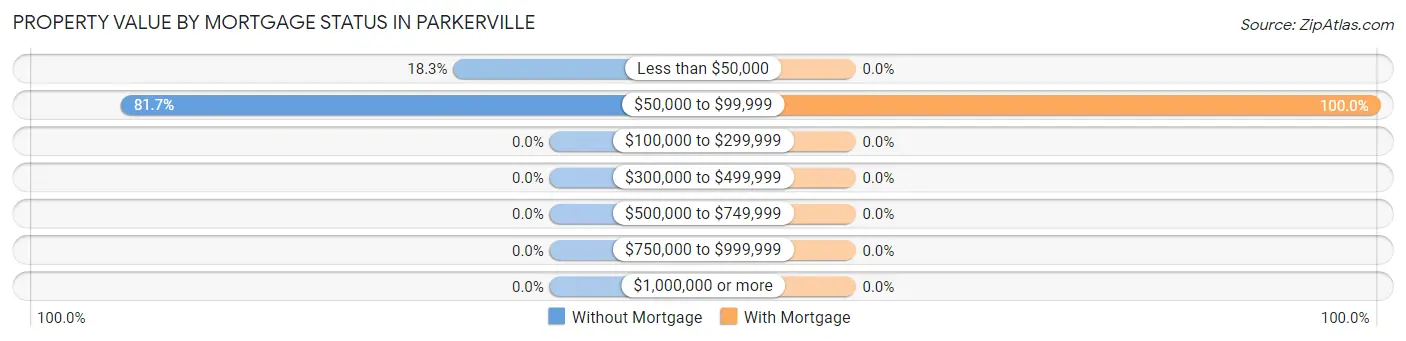
| Property Value | Without Mortgage | With Mortgage |
| Less than $50,000 | 11 (18.3%) | 0 (0.0%) |
| $50,000 to $99,999 | 49 (81.7%) | 2 (100.0%) |
| $100,000 to $299,999 | 0 (0.0%) | 0 (0.0%) |
| $300,000 to $499,999 | 0 (0.0%) | 0 (0.0%) |
| $500,000 to $749,999 | 0 (0.0%) | 0 (0.0%) |
| $750,000 to $999,999 | 0 (0.0%) | 0 (0.0%) |
| $1,000,000 or more | 0 (0.0%) | 0 (0.0%) |
| Total | 60 (100.0%) | 2 (100.0%) |
Household Income by Mortgage Status in Parkerville
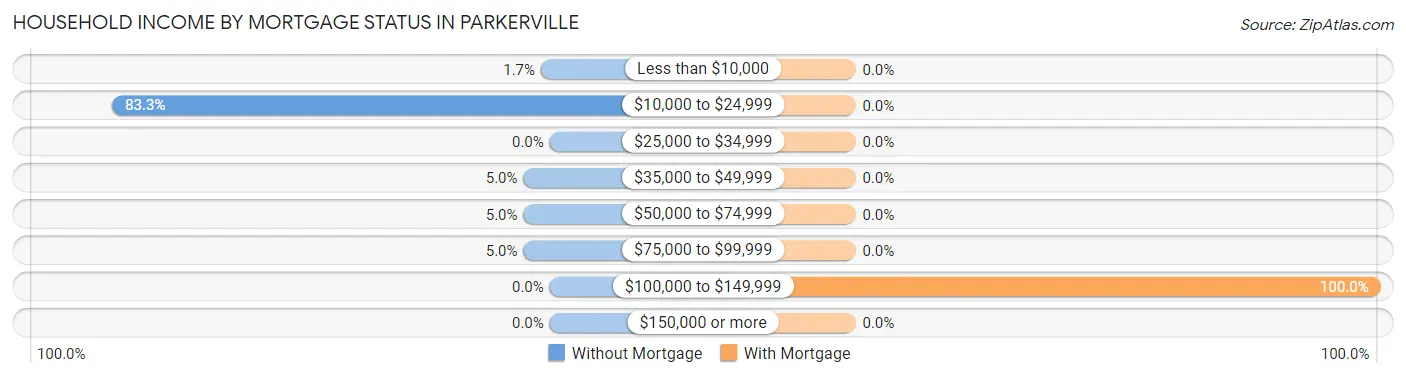
| Household Income | Without Mortgage | With Mortgage |
| Less than $10,000 | 1 (1.7%) | 0 (0.0%) |
| $10,000 to $24,999 | 50 (83.3%) | 0 (0.0%) |
| $25,000 to $34,999 | 0 (0.0%) | 0 (0.0%) |
| $35,000 to $49,999 | 3 (5.0%) | 0 (0.0%) |
| $50,000 to $74,999 | 3 (5.0%) | 0 (0.0%) |
| $75,000 to $99,999 | 3 (5.0%) | 0 (0.0%) |
| $100,000 to $149,999 | 0 (0.0%) | 2 (100.0%) |
| $150,000 or more | 0 (0.0%) | 0 (0.0%) |
| Total | 60 (100.0%) | 2 (100.0%) |
Property Value to Household Income Ratio in Parkerville
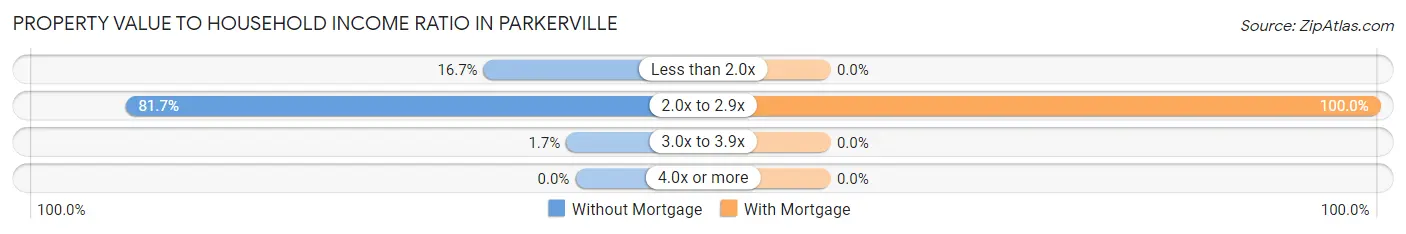
| Value-to-Income Ratio | Without Mortgage | With Mortgage |
| Less than 2.0x | 10 (16.7%) | 0 (0.0%) |
| 2.0x to 2.9x | 49 (81.7%) | 2 (100.0%) |
| 3.0x to 3.9x | 1 (1.7%) | 0 (0.0%) |
| 4.0x or more | 0 (0.0%) | 0 (0.0%) |
| Total | 60 (100.0%) | 2 (100.0%) |
Real Estate Taxes by Mortgage Status in Parkerville
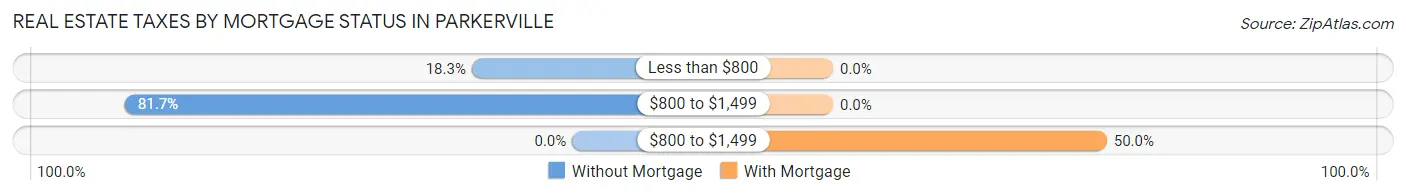
| Property Taxes | Without Mortgage | With Mortgage |
| Less than $800 | 11 (18.3%) | 0 (0.0%) |
| $800 to $1,499 | 49 (81.7%) | 0 (0.0%) |
| $800 to $1,499 | 0 (0.0%) | 1 (50.0%) |
| Total | 60 (100.0%) | 2 (100.0%) |
Health & Disability in Parkerville
Health Insurance Coverage by Age in Parkerville
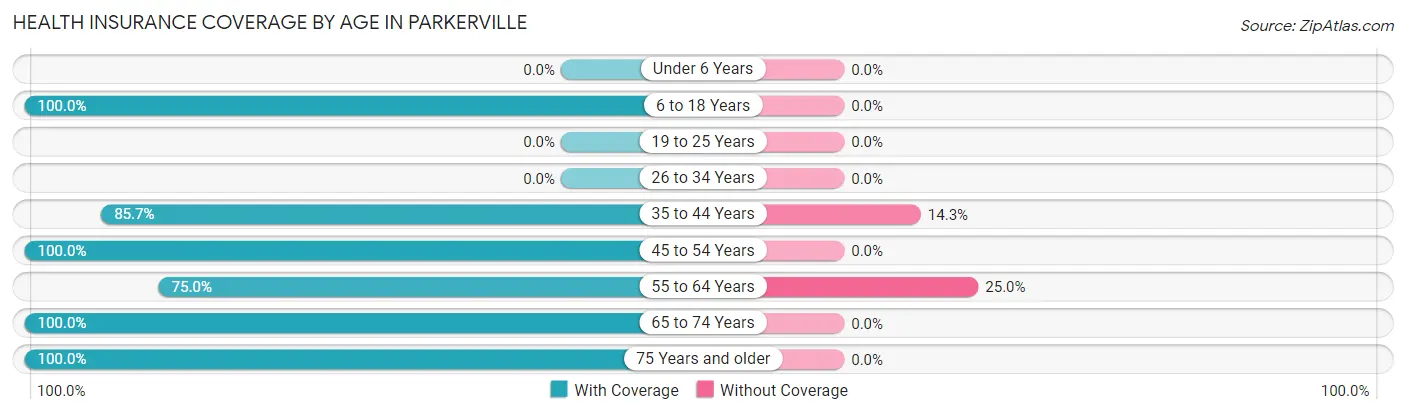
| Age Bracket | With Coverage | Without Coverage |
| Under 6 Years | 0 (0.0%) | 0 (0.0%) |
| 6 to 18 Years | 5 (100.0%) | 0 (0.0%) |
| 19 to 25 Years | 0 (0.0%) | 0 (0.0%) |
| 26 to 34 Years | 0 (0.0%) | 0 (0.0%) |
| 35 to 44 Years | 12 (85.7%) | 2 (14.3%) |
| 45 to 54 Years | 1 (100.0%) | 0 (0.0%) |
| 55 to 64 Years | 3 (75.0%) | 1 (25.0%) |
| 65 to 74 Years | 4 (100.0%) | 0 (0.0%) |
| 75 Years and older | 56 (100.0%) | 0 (0.0%) |
| Total | 81 (96.4%) | 3 (3.6%) |
Health Insurance Coverage by Citizenship Status in Parkerville
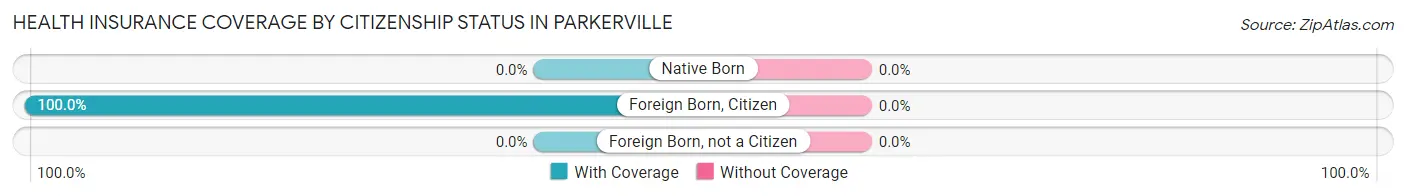
| Citizenship Status | With Coverage | Without Coverage |
| Native Born | 0 (0.0%) | 0 (0.0%) |
| Foreign Born, Citizen | 5 (100.0%) | 0 (0.0%) |
| Foreign Born, not a Citizen | 0 (0.0%) | 0 (0.0%) |
Health Insurance Coverage by Household Income in Parkerville
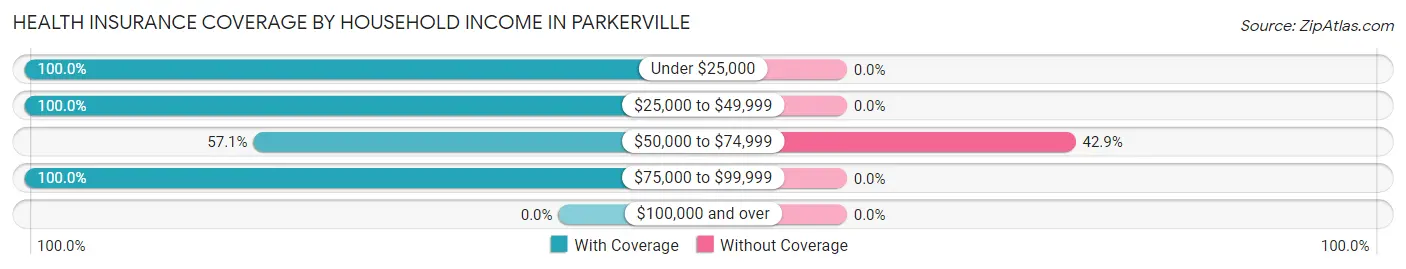
| Household Income | With Coverage | Without Coverage |
| Under $25,000 | 55 (100.0%) | 0 (0.0%) |
| $25,000 to $49,999 | 7 (100.0%) | 0 (0.0%) |
| $50,000 to $74,999 | 4 (57.1%) | 3 (42.9%) |
| $75,000 to $99,999 | 15 (100.0%) | 0 (0.0%) |
| $100,000 and over | 0 (0.0%) | 0 (0.0%) |
Public vs Private Health Insurance Coverage by Age in Parkerville
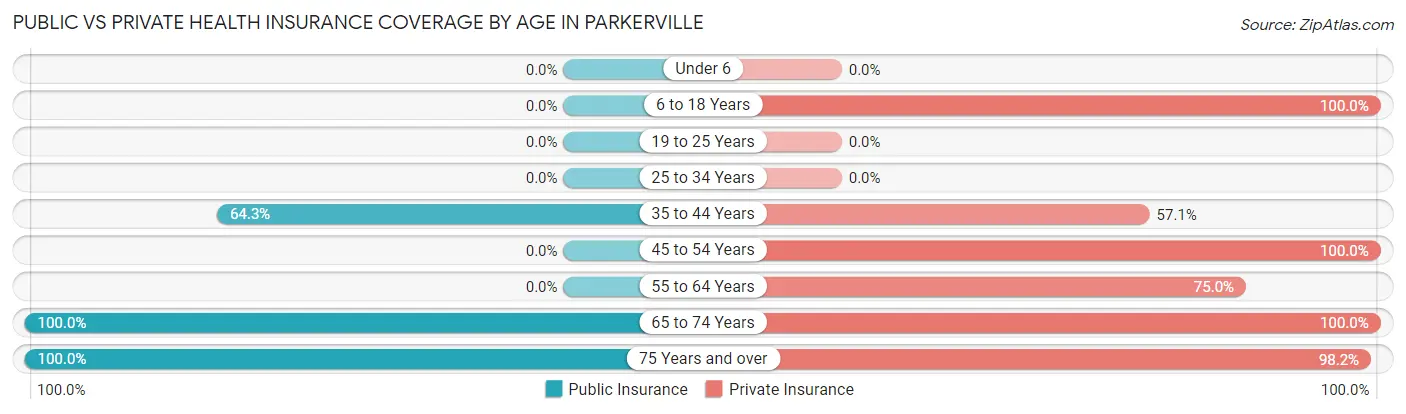
| Age Bracket | Public Insurance | Private Insurance |
| Under 6 | 0 (0.0%) | 0 (0.0%) |
| 6 to 18 Years | 0 (0.0%) | 5 (100.0%) |
| 19 to 25 Years | 0 (0.0%) | 0 (0.0%) |
| 25 to 34 Years | 0 (0.0%) | 0 (0.0%) |
| 35 to 44 Years | 9 (64.3%) | 8 (57.1%) |
| 45 to 54 Years | 0 (0.0%) | 1 (100.0%) |
| 55 to 64 Years | 0 (0.0%) | 3 (75.0%) |
| 65 to 74 Years | 4 (100.0%) | 4 (100.0%) |
| 75 Years and over | 56 (100.0%) | 55 (98.2%) |
| Total | 69 (82.1%) | 76 (90.5%) |
Disability Status by Sex by Age in Parkerville
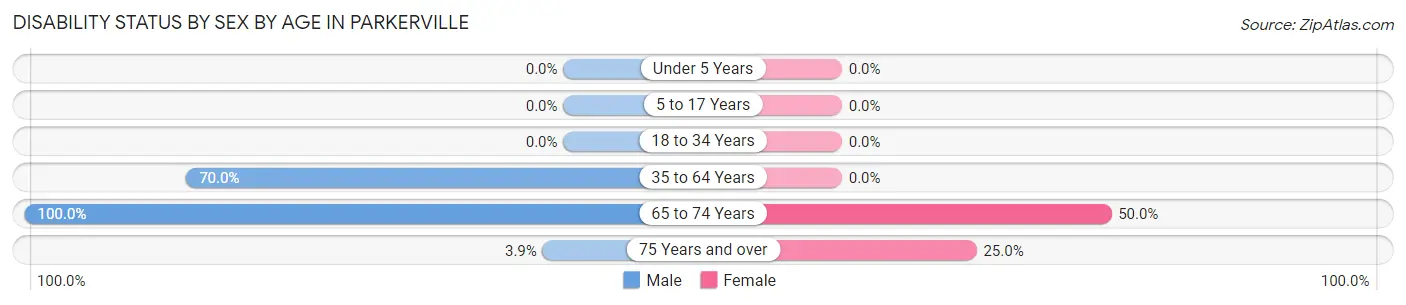
| Age Bracket | Male | Female |
| Under 5 Years | 0 (0.0%) | 0 (0.0%) |
| 5 to 17 Years | 0 (0.0%) | 0 (0.0%) |
| 18 to 34 Years | 0 (0.0%) | 0 (0.0%) |
| 35 to 64 Years | 7 (70.0%) | 0 (0.0%) |
| 65 to 74 Years | 2 (100.0%) | 1 (50.0%) |
| 75 Years and over | 2 (3.8%) | 1 (25.0%) |
Disability Class by Sex by Age in Parkerville
Disability Class: Hearing Difficulty
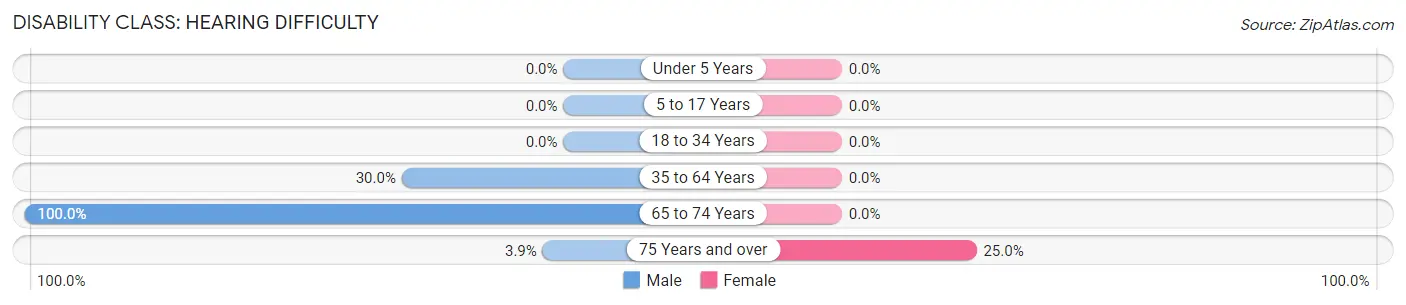
| Age Bracket | Male | Female |
| Under 5 Years | 0 (0.0%) | 0 (0.0%) |
| 5 to 17 Years | 0 (0.0%) | 0 (0.0%) |
| 18 to 34 Years | 0 (0.0%) | 0 (0.0%) |
| 35 to 64 Years | 3 (30.0%) | 0 (0.0%) |
| 65 to 74 Years | 2 (100.0%) | 0 (0.0%) |
| 75 Years and over | 2 (3.8%) | 1 (25.0%) |
Disability Class: Vision Difficulty
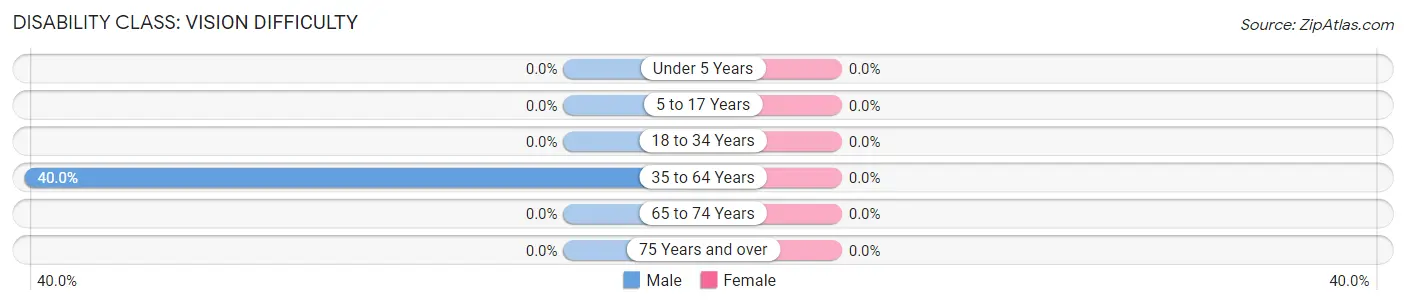
| Age Bracket | Male | Female |
| Under 5 Years | 0 (0.0%) | 0 (0.0%) |
| 5 to 17 Years | 0 (0.0%) | 0 (0.0%) |
| 18 to 34 Years | 0 (0.0%) | 0 (0.0%) |
| 35 to 64 Years | 4 (40.0%) | 0 (0.0%) |
| 65 to 74 Years | 0 (0.0%) | 0 (0.0%) |
| 75 Years and over | 0 (0.0%) | 0 (0.0%) |
Disability Class: Cognitive Difficulty
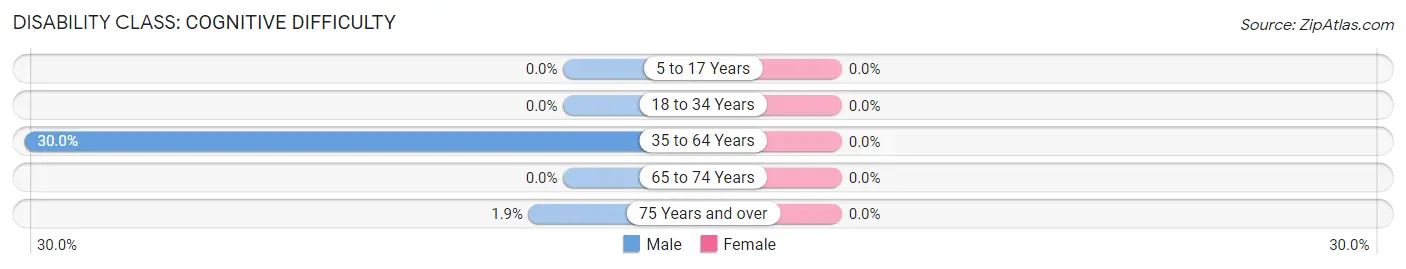
| Age Bracket | Male | Female |
| 5 to 17 Years | 0 (0.0%) | 0 (0.0%) |
| 18 to 34 Years | 0 (0.0%) | 0 (0.0%) |
| 35 to 64 Years | 3 (30.0%) | 0 (0.0%) |
| 65 to 74 Years | 0 (0.0%) | 0 (0.0%) |
| 75 Years and over | 1 (1.9%) | 0 (0.0%) |
Disability Class: Ambulatory Difficulty
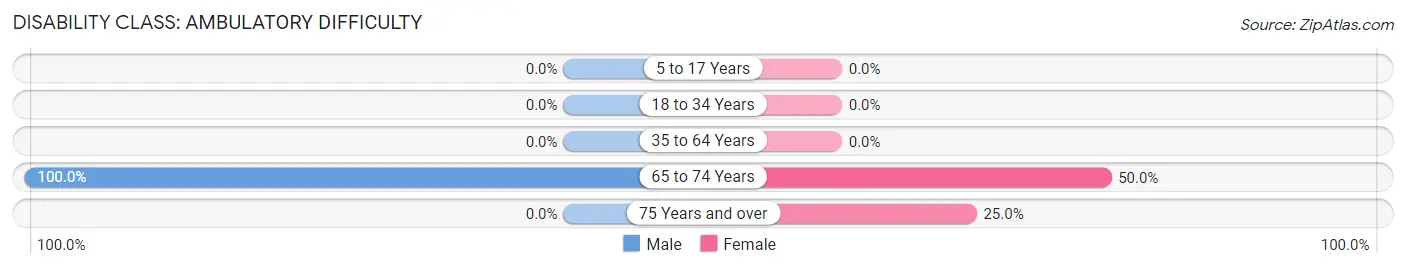
| Age Bracket | Male | Female |
| 5 to 17 Years | 0 (0.0%) | 0 (0.0%) |
| 18 to 34 Years | 0 (0.0%) | 0 (0.0%) |
| 35 to 64 Years | 0 (0.0%) | 0 (0.0%) |
| 65 to 74 Years | 2 (100.0%) | 1 (50.0%) |
| 75 Years and over | 0 (0.0%) | 1 (25.0%) |
Disability Class: Self-Care Difficulty
| Age Bracket | Male | Female |
| 5 to 17 Years | 0 (0.0%) | 0 (0.0%) |
| 18 to 34 Years | 0 (0.0%) | 0 (0.0%) |
| 35 to 64 Years | 0 (0.0%) | 0 (0.0%) |
| 65 to 74 Years | 0 (0.0%) | 0 (0.0%) |
| 75 Years and over | 0 (0.0%) | 0 (0.0%) |
Technology Access in Parkerville
Computing Device Access in Parkerville
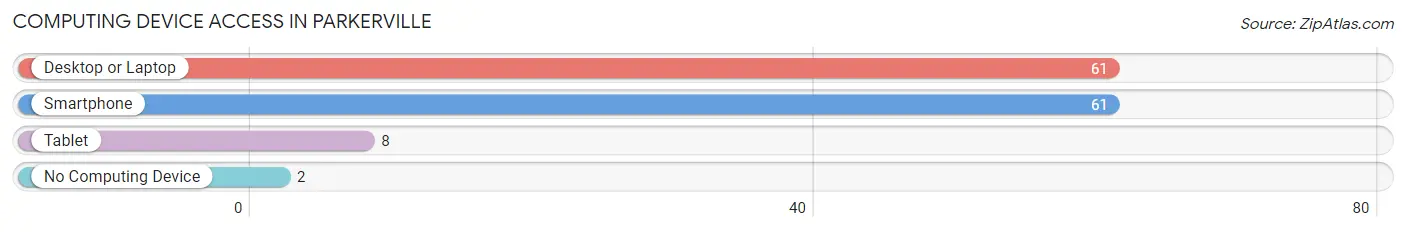
| Device Type | # Households | % Households |
| Desktop or Laptop | 61 | 96.8% |
| Smartphone | 61 | 96.8% |
| Tablet | 8 | 12.7% |
| No Computing Device | 2 | 3.2% |
| Total | 63 | 100.0% |
Internet Access in Parkerville
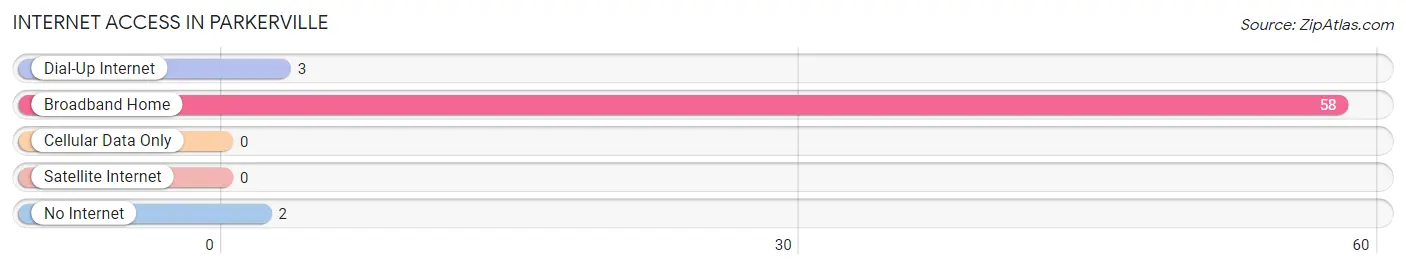
| Internet Type | # Households | % Households |
| Dial-Up Internet | 3 | 4.8% |
| Broadband Home | 58 | 92.1% |
| Cellular Data Only | 0 | 0.0% |
| Satellite Internet | 0 | 0.0% |
| No Internet | 2 | 3.2% |
| Total | 63 | 100.0% |
Parkerville Summary
Parkerville, Kansas is a small town located in the northeastern corner of the state, in the county of Pottawatomie. It is situated on the banks of the Kansas River, and is surrounded by rolling hills and farmland. The town was founded in 1867, and has a population of approximately 1,000 people.
History
Parkerville was founded in 1867 by a group of settlers from Ohio. The town was named after the Parkers, a family of settlers who had moved to the area from Ohio. The town was originally a farming community, and the settlers grew wheat, corn, and other crops. The town also had a sawmill, a blacksmith shop, and a general store.
In the late 1800s, the town began to grow and prosper. The railroad came to Parkerville in 1887, and the town became a shipping point for grain and other goods. The town also had a flour mill, a creamery, and a brickyard.
In the early 1900s, Parkerville was a thriving community. The town had a bank, a hotel, a newspaper, and several churches. The town also had a movie theater, a bowling alley, and a library.
Geography
Parkerville is located in the northeastern corner of Kansas, in the county of Pottawatomie. The town is situated on the banks of the Kansas River, and is surrounded by rolling hills and farmland. The town is located about 25 miles east of Topeka, the state capital.
The climate in Parkerville is typical of the Midwest, with hot summers and cold winters. The average temperature in the summer is around 80 degrees Fahrenheit, and the average temperature in the winter is around 30 degrees Fahrenheit.
Economy
The economy of Parkerville is largely based on agriculture. The town is surrounded by farmland, and the main crops grown in the area are wheat, corn, and soybeans. The town also has a few small businesses, including a grocery store, a hardware store, and a few restaurants.
Demographics
As of the 2010 census, the population of Parkerville was 1,000 people. The racial makeup of the town was 97.2% White, 0.7% African American, 0.3% Native American, 0.2% Asian, and 1.6% from other races. The median household income in Parkerville was $41,250, and the median family income was $50,000. The per capita income in Parkerville was $19,000.
Common Questions
What is Per Capita Income in Parkerville?
Per Capita income in Parkerville is $20,054.
What is the Median Family Income in Parkerville?
Median Family Income in Parkerville is $16,556.
What is the Median Household income in Parkerville?
Median Household Income in Parkerville is $16,505.
What is Inequality or Gini Index in Parkerville?
Inequality or Gini Index in Parkerville is 0.32.
What is the Total Population of Parkerville?
Total Population of Parkerville is 84.
What is the Total Male Population of Parkerville?
Total Male Population of Parkerville is 64.
What is the Total Female Population of Parkerville?
Total Female Population of Parkerville is 20.
What is the Ratio of Males per 100 Females in Parkerville?
There are 320.00 Males per 100 Females in Parkerville.
What is the Ratio of Females per 100 Males in Parkerville?
There are 31.25 Females per 100 Males in Parkerville.
What is the Median Population Age in Parkerville?
Median Population Age in Parkerville is 87.1 Years.
What is the Average Family Size in Parkerville
Average Family Size in Parkerville is 1.3 People.
What is the Average Household Size in Parkerville
Average Household Size in Parkerville is 1.3 People.
How Large is the Labor Force in Parkerville?
There are 7 People in the Labor Forcein in Parkerville.
What is the Percentage of People in the Labor Force in Parkerville?
8.3% of People are in the Labor Force in Parkerville.