Rockford, ID Map & Demographics
Rockford Map
Rockford Overview
$20,068
PER CAPITA INCOME
$60,000
AVG FAMILY INCOME
$56,250
AVG HOUSEHOLD INCOME
0.23
INEQUALITY / GINI INDEX
199
TOTAL POPULATION
121
MALE POPULATION
78
FEMALE POPULATION
155.13
MALES / 100 FEMALES
64.46
FEMALES / 100 MALES
32.6
MEDIAN AGE
3.7
AVG FAMILY SIZE
3.4
AVG HOUSEHOLD SIZE
61
LABOR FORCE [ PEOPLE ]
50.4%
PERCENT IN LABOR FORCE
Income in Rockford
Income Overview in Rockford
Per Capita Income in Rockford is $20,068, while median incomes of families and households are $60,000 and $56,250 respectively.
| Characteristic | Number | Measure |
| Per Capita Income | 199 | $20,068 |
| Median Family Income | 52 | $60,000 |
| Mean Family Income | 52 | $66,263 |
| Median Household Income | 59 | $56,250 |
| Mean Household Income | 59 | $64,975 |
| Income Deficit | 52 | $0 |
| Wage / Income Gap (%) | 199 | 0.00% |
| Wage / Income Gap ($) | 199 | 100.00¢ per $1 |
| Gini / Inequality Index | 199 | 0.23 |
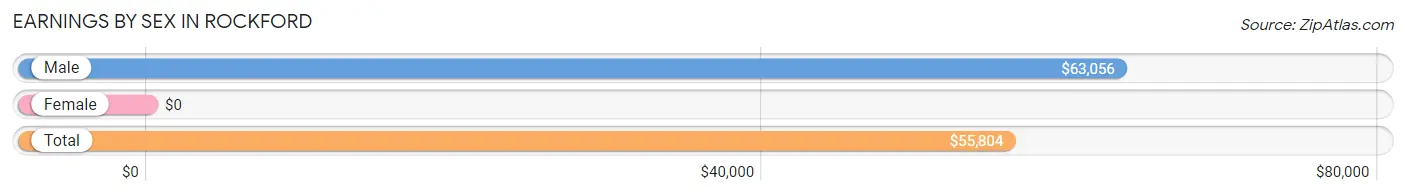
Earnings by Sex in Rockford
| Sex | Number | Average Earnings |
| Male | 38 (62.3%) | $63,056 |
| Female | 23 (37.7%) | $0 |
| Total | 61 (100.0%) | $55,804 |
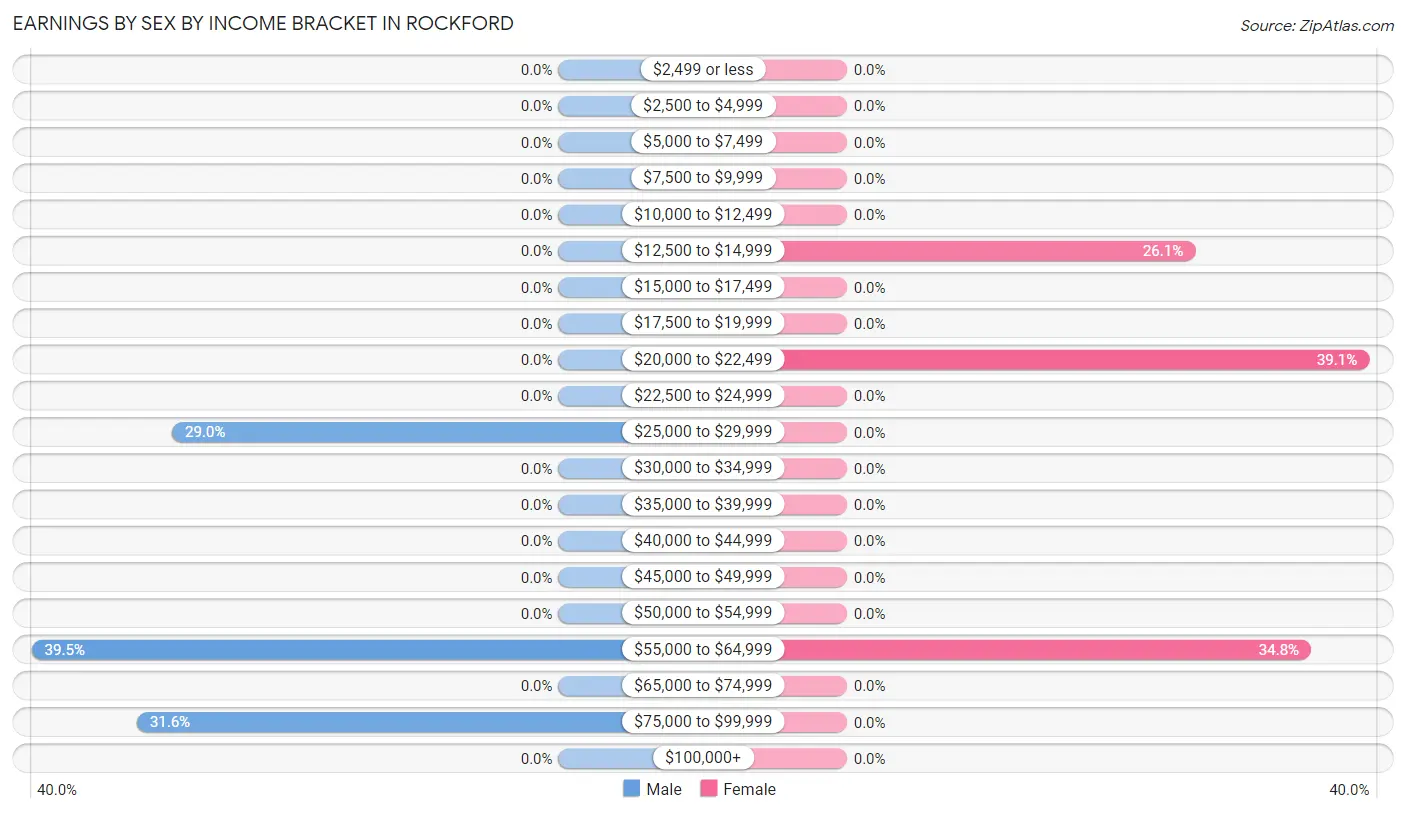
Earnings by Sex by Income Bracket in Rockford
The most common earnings brackets in Rockford are $55,000 to $64,999 for men (15 | 39.5%) and $20,000 to $22,499 for women (9 | 39.1%).
| Income | Male | Female |
| $2,499 or less | 0 (0.0%) | 0 (0.0%) |
| $2,500 to $4,999 | 0 (0.0%) | 0 (0.0%) |
| $5,000 to $7,499 | 0 (0.0%) | 0 (0.0%) |
| $7,500 to $9,999 | 0 (0.0%) | 0 (0.0%) |
| $10,000 to $12,499 | 0 (0.0%) | 0 (0.0%) |
| $12,500 to $14,999 | 0 (0.0%) | 6 (26.1%) |
| $15,000 to $17,499 | 0 (0.0%) | 0 (0.0%) |
| $17,500 to $19,999 | 0 (0.0%) | 0 (0.0%) |
| $20,000 to $22,499 | 0 (0.0%) | 9 (39.1%) |
| $22,500 to $24,999 | 0 (0.0%) | 0 (0.0%) |
| $25,000 to $29,999 | 11 (28.9%) | 0 (0.0%) |
| $30,000 to $34,999 | 0 (0.0%) | 0 (0.0%) |
| $35,000 to $39,999 | 0 (0.0%) | 0 (0.0%) |
| $40,000 to $44,999 | 0 (0.0%) | 0 (0.0%) |
| $45,000 to $49,999 | 0 (0.0%) | 0 (0.0%) |
| $50,000 to $54,999 | 0 (0.0%) | 0 (0.0%) |
| $55,000 to $64,999 | 15 (39.5%) | 8 (34.8%) |
| $65,000 to $74,999 | 0 (0.0%) | 0 (0.0%) |
| $75,000 to $99,999 | 12 (31.6%) | 0 (0.0%) |
| $100,000+ | 0 (0.0%) | 0 (0.0%) |
| Total | 38 (100.0%) | 23 (100.0%) |
Earnings by Sex by Educational Attainment in Rockford
| Educational Attainment | Male Income | Female Income |
| Less than High School | - | - |
| High School Diploma | - | - |
| College or Associate's Degree | - | - |
| Bachelor's Degree | - | - |
| Graduate Degree | - | - |
| Total | $63,056 | $0 |
Family Income in Rockford
Family Income Brackets in Rockford
According to the Rockford family income data, there are 15 families falling into the $35,000 to $49,999 income range, which is the most common income bracket and makes up 28.8% of all families.
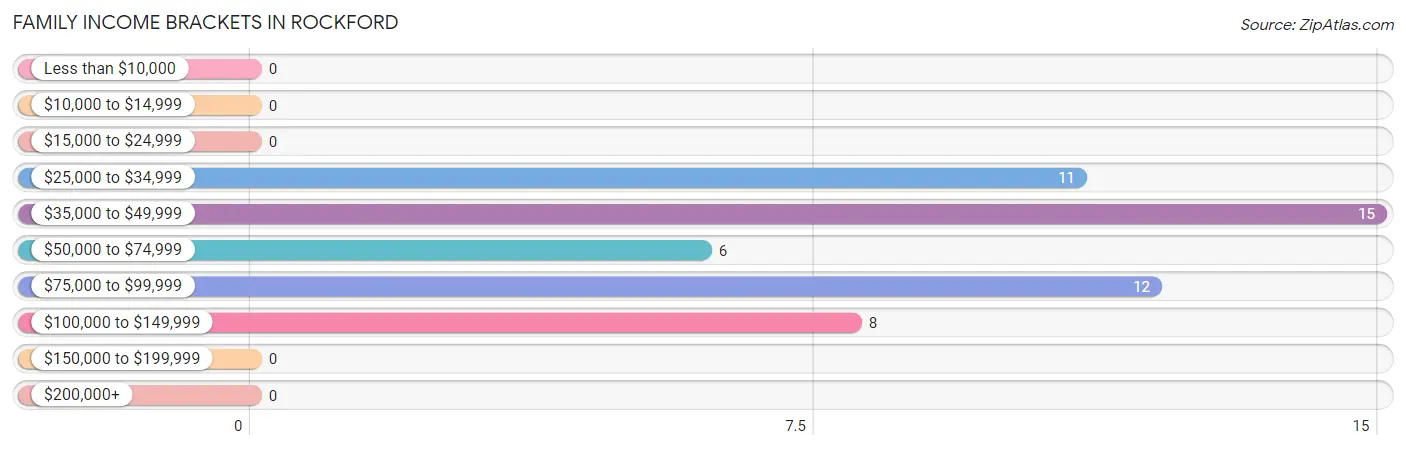
| Income Bracket | # Families | % Families |
| Less than $10,000 | 0 | 0.0% |
| $10,000 to $14,999 | 0 | 0.0% |
| $15,000 to $24,999 | 0 | 0.0% |
| $25,000 to $34,999 | 11 | 21.2% |
| $35,000 to $49,999 | 15 | 28.8% |
| $50,000 to $74,999 | 6 | 11.5% |
| $75,000 to $99,999 | 12 | 23.1% |
| $100,000 to $149,999 | 8 | 15.4% |
| $150,000 to $199,999 | 0 | 0.0% |
| $200,000+ | 0 | 0.0% |
Family Income by Famaliy Size in Rockford
2-person families (26 | 50.0%) account for the highest median family income in Rockford with $43,333 per family, while 2-person families (26 | 50.0%) have the highest median income of $21,666 per family member.
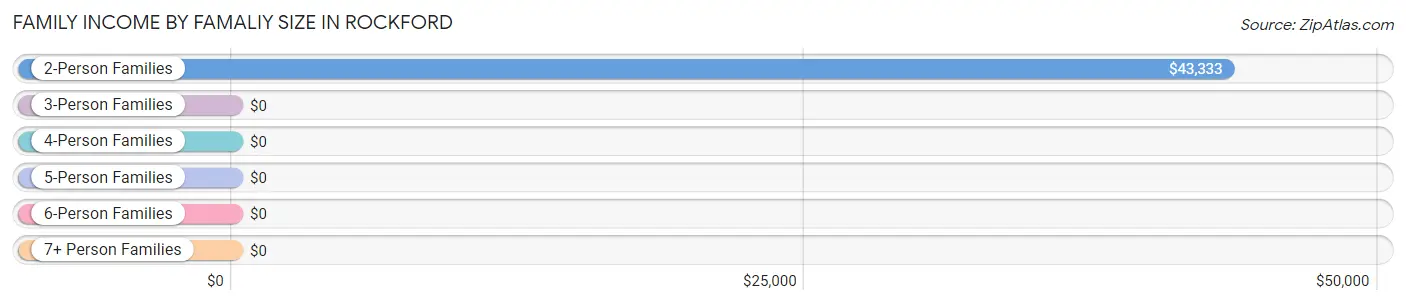
| Income Bracket | # Families | Median Income |
| 2-Person Families | 26 (50.0%) | $43,333 |
| 3-Person Families | 6 (11.5%) | $0 |
| 4-Person Families | 0 (0.0%) | $0 |
| 5-Person Families | 8 (15.4%) | $0 |
| 6-Person Families | 0 (0.0%) | $0 |
| 7+ Person Families | 12 (23.1%) | $0 |
| Total | 52 (100.0%) | $60,000 |
Family Income by Number of Earners in Rockford
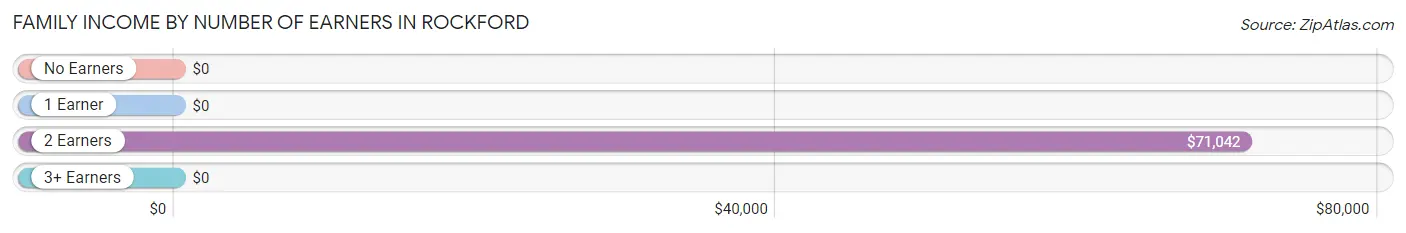
| Number of Earners | # Families | Median Income |
| No Earners | 17 (32.7%) | $0 |
| 1 Earner | 12 (23.1%) | $0 |
| 2 Earners | 23 (44.2%) | $71,042 |
| 3+ Earners | 0 (0.0%) | $0 |
| Total | 52 (100.0%) | $60,000 |
Household Income in Rockford
Household Income Brackets in Rockford
With 15 households falling in the category, the $35,000 to $49,999 income range is the most frequent in Rockford, accounting for 25.4% of all households.
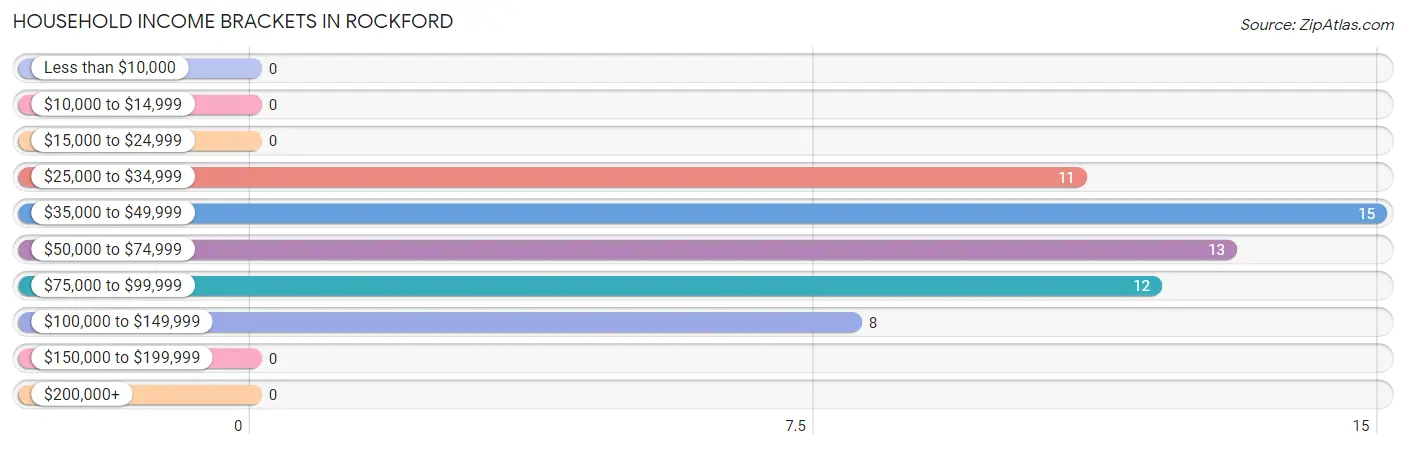
| Income Bracket | # Households | % Households |
| Less than $10,000 | 0 | 0.0% |
| $10,000 to $14,999 | 0 | 0.0% |
| $15,000 to $24,999 | 0 | 0.0% |
| $25,000 to $34,999 | 11 | 18.6% |
| $35,000 to $49,999 | 15 | 25.4% |
| $50,000 to $74,999 | 13 | 22.0% |
| $75,000 to $99,999 | 12 | 20.3% |
| $100,000 to $149,999 | 8 | 13.6% |
| $150,000 to $199,999 | 0 | 0.0% |
| $200,000+ | 0 | 0.0% |
Household Income by Householder Age in Rockford
The median household income in Rockford is $56,250, with the highest median household income of $81,458 found in the 25 to 44 years age bracket for the primary householder. A total of 26 households (44.1%) fall into this category.
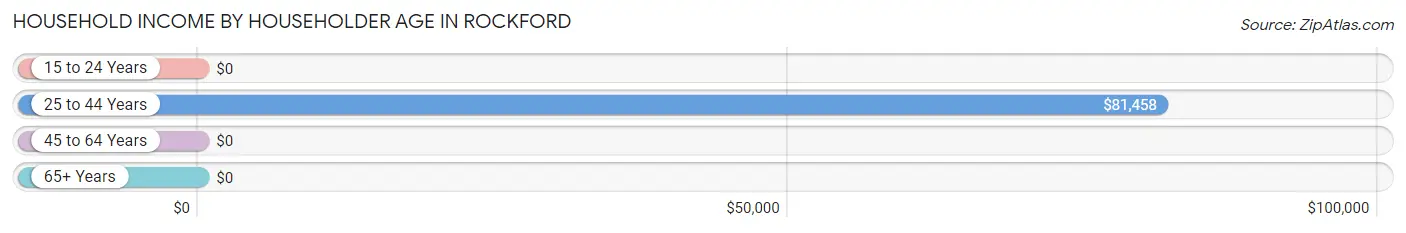
| Income Bracket | # Households | Median Income |
| 15 to 24 Years | 0 (0.0%) | $0 |
| 25 to 44 Years | 26 (44.1%) | $81,458 |
| 45 to 64 Years | 20 (33.9%) | $0 |
| 65+ Years | 13 (22.0%) | $0 |
| Total | 59 (100.0%) | $56,250 |
Poverty in Rockford
Income Below Poverty by Sex and Age in Rockford
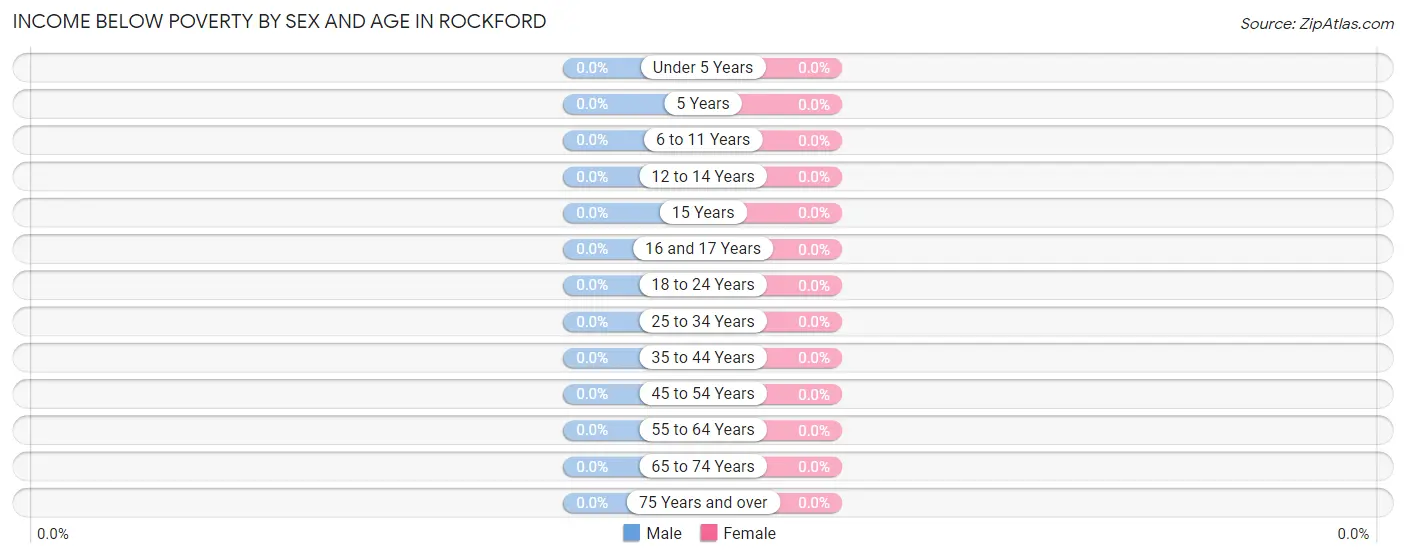
| Age Bracket | Male | Female |
| Under 5 Years | 0 (0.0%) | 0 (0.0%) |
| 5 Years | 0 (0.0%) | 0 (0.0%) |
| 6 to 11 Years | 0 (0.0%) | 0 (0.0%) |
| 12 to 14 Years | 0 (0.0%) | 0 (0.0%) |
| 15 Years | 0 (0.0%) | 0 (0.0%) |
| 16 and 17 Years | 0 (0.0%) | 0 (0.0%) |
| 18 to 24 Years | 0 (0.0%) | 0 (0.0%) |
| 25 to 34 Years | 0 (0.0%) | 0 (0.0%) |
| 35 to 44 Years | 0 (0.0%) | 0 (0.0%) |
| 45 to 54 Years | 0 (0.0%) | 0 (0.0%) |
| 55 to 64 Years | 0 (0.0%) | 0 (0.0%) |
| 65 to 74 Years | 0 (0.0%) | 0 (0.0%) |
| 75 Years and over | 0 (0.0%) | 0 (0.0%) |
| Total | 0 (0.0%) | 0 (0.0%) |
Income Above Poverty by Sex and Age in Rockford
According to the poverty statistics in Rockford, males aged under 5 years and females aged 6 to 11 years are the age groups that are most secure financially, with 100.0% of males and 100.0% of females in these age groups living above the poverty line.
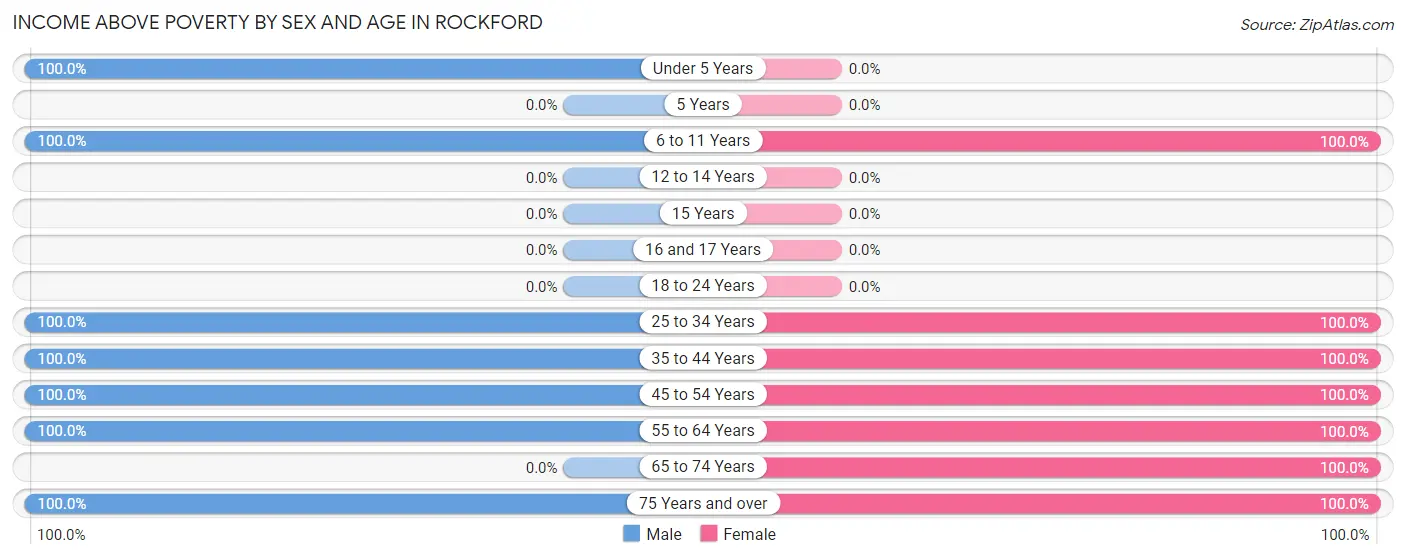
| Age Bracket | Male | Female |
| Under 5 Years | 21 (100.0%) | 0 (0.0%) |
| 5 Years | 0 (0.0%) | 0 (0.0%) |
| 6 to 11 Years | 41 (100.0%) | 16 (100.0%) |
| 12 to 14 Years | 0 (0.0%) | 0 (0.0%) |
| 15 Years | 0 (0.0%) | 0 (0.0%) |
| 16 and 17 Years | 0 (0.0%) | 0 (0.0%) |
| 18 to 24 Years | 0 (0.0%) | 0 (0.0%) |
| 25 to 34 Years | 18 (100.0%) | 22 (100.0%) |
| 35 to 44 Years | 9 (100.0%) | 8 (100.0%) |
| 45 to 54 Years | 11 (100.0%) | 9 (100.0%) |
| 55 to 64 Years | 15 (100.0%) | 11 (100.0%) |
| 65 to 74 Years | 0 (0.0%) | 7 (100.0%) |
| 75 Years and over | 6 (100.0%) | 5 (100.0%) |
| Total | 121 (100.0%) | 78 (100.0%) |
Income Below Poverty Among Married-Couple Families in Rockford
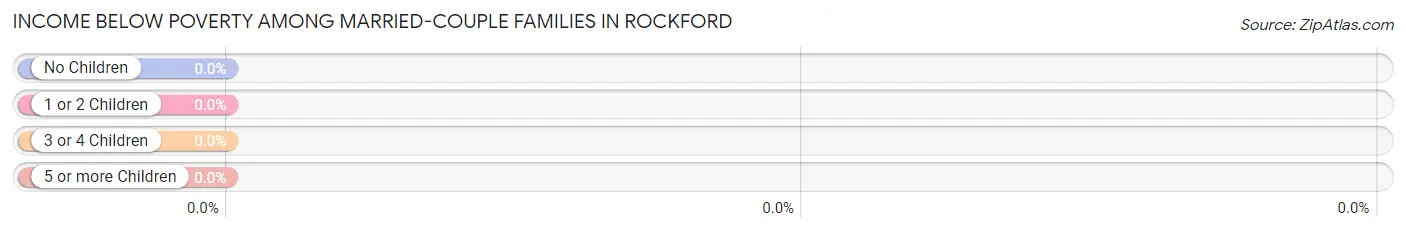
| Children | Above Poverty | Below Poverty |
| No Children | 26 (100.0%) | 0 (0.0%) |
| 1 or 2 Children | 6 (100.0%) | 0 (0.0%) |
| 3 or 4 Children | 8 (100.0%) | 0 (0.0%) |
| 5 or more Children | 12 (100.0%) | 0 (0.0%) |
| Total | 52 (100.0%) | 0 (0.0%) |
Income Below Poverty Among Single-Parent Households in Rockford
| Children | Single Father | Single Mother |
| No Children | 0 (0.0%) | 0 (0.0%) |
| 1 or 2 Children | 0 (0.0%) | 0 (0.0%) |
| 3 or 4 Children | 0 (0.0%) | 0 (0.0%) |
| 5 or more Children | 0 (0.0%) | 0 (0.0%) |
| Total | 0 (0.0%) | 0 (0.0%) |
Income Below Poverty Among Married-Couple vs Single-Parent Households in Rockford
| Children | Married-Couple Families | Single-Parent Households |
| No Children | 0 (0.0%) | 0 (0.0%) |
| 1 or 2 Children | 0 (0.0%) | 0 (0.0%) |
| 3 or 4 Children | 0 (0.0%) | 0 (0.0%) |
| 5 or more Children | 0 (0.0%) | 0 (0.0%) |
| Total | 0 (0.0%) | 0 (0.0%) |
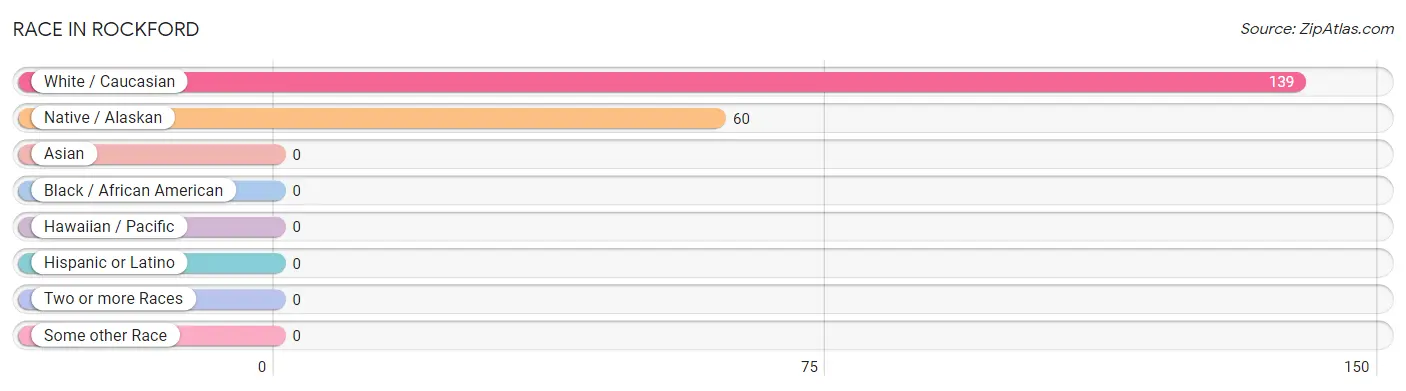
Race in Rockford
The most populous races in Rockford are White / Caucasian (139 | 69.9%), and Native / Alaskan (60 | 30.1%).
| Race | # Population | % Population |
| Asian | 0 | 0.0% |
| Black / African American | 0 | 0.0% |
| Hawaiian / Pacific | 0 | 0.0% |
| Hispanic or Latino | 0 | 0.0% |
| Native / Alaskan | 60 | 30.1% |
| White / Caucasian | 139 | 69.9% |
| Two or more Races | 0 | 0.0% |
| Some other Race | 0 | 0.0% |
| Total | 199 | 100.0% |
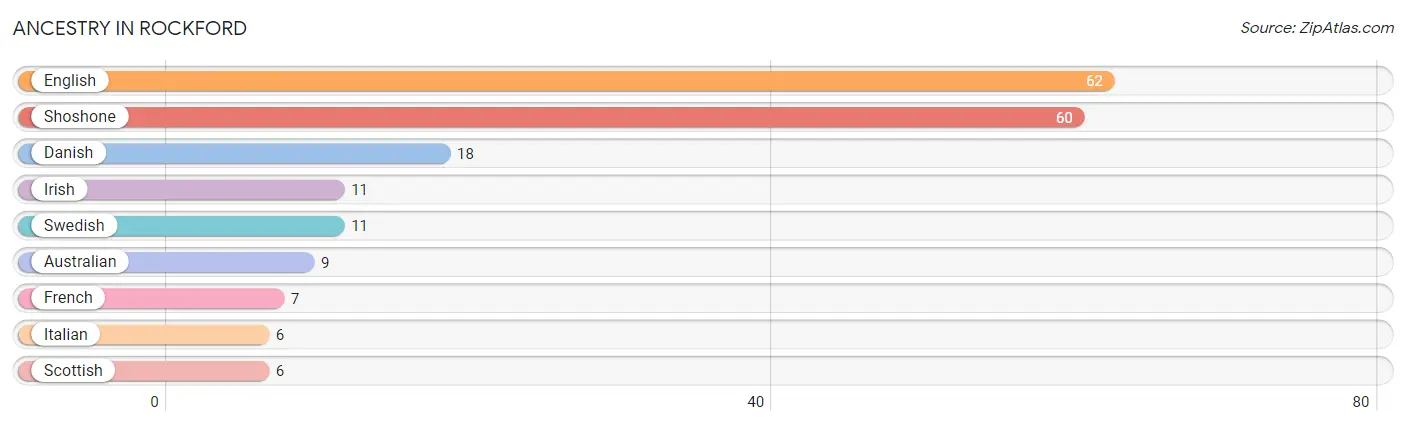
Ancestry in Rockford
The most populous ancestries reported in Rockford are English (62 | 31.2%), Shoshone (60 | 30.1%), Danish (18 | 9.0%), Irish (11 | 5.5%), and Swedish (11 | 5.5%), together accounting for 81.4% of all Rockford residents.
| Ancestry | # Population | % Population |
| Australian | 9 | 4.5% |
| Danish | 18 | 9.0% |
| English | 62 | 31.2% |
| French | 7 | 3.5% |
| Irish | 11 | 5.5% |
| Italian | 6 | 3.0% |
| Scottish | 6 | 3.0% |
| Shoshone | 60 | 30.1% |
| Swedish | 11 | 5.5% | View All 9 Rows |
Immigrants in Rockford

| Immigration Origin | # Population | % Population | View All 0 Rows |
Sex and Age in Rockford
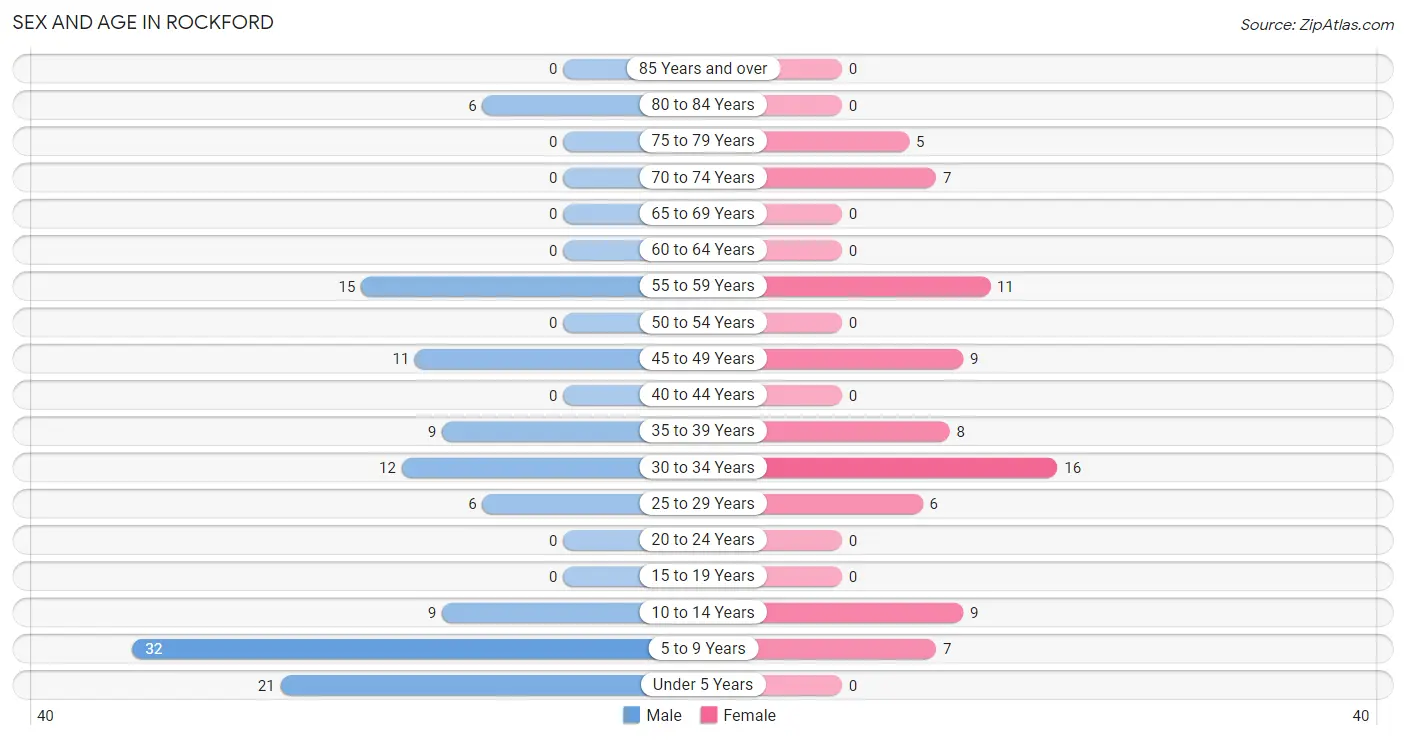
Sex and Age in Rockford
The most populous age groups in Rockford are 5 to 9 Years (32 | 26.5%) for men and 30 to 34 Years (16 | 20.5%) for women.
| Age Bracket | Male | Female |
| Under 5 Years | 21 (17.4%) | 0 (0.0%) |
| 5 to 9 Years | 32 (26.5%) | 7 (9.0%) |
| 10 to 14 Years | 9 (7.4%) | 9 (11.5%) |
| 15 to 19 Years | 0 (0.0%) | 0 (0.0%) |
| 20 to 24 Years | 0 (0.0%) | 0 (0.0%) |
| 25 to 29 Years | 6 (5.0%) | 6 (7.7%) |
| 30 to 34 Years | 12 (9.9%) | 16 (20.5%) |
| 35 to 39 Years | 9 (7.4%) | 8 (10.3%) |
| 40 to 44 Years | 0 (0.0%) | 0 (0.0%) |
| 45 to 49 Years | 11 (9.1%) | 9 (11.5%) |
| 50 to 54 Years | 0 (0.0%) | 0 (0.0%) |
| 55 to 59 Years | 15 (12.4%) | 11 (14.1%) |
| 60 to 64 Years | 0 (0.0%) | 0 (0.0%) |
| 65 to 69 Years | 0 (0.0%) | 0 (0.0%) |
| 70 to 74 Years | 0 (0.0%) | 7 (9.0%) |
| 75 to 79 Years | 0 (0.0%) | 5 (6.4%) |
| 80 to 84 Years | 6 (5.0%) | 0 (0.0%) |
| 85 Years and over | 0 (0.0%) | 0 (0.0%) |
| Total | 121 (100.0%) | 78 (100.0%) |
Families and Households in Rockford
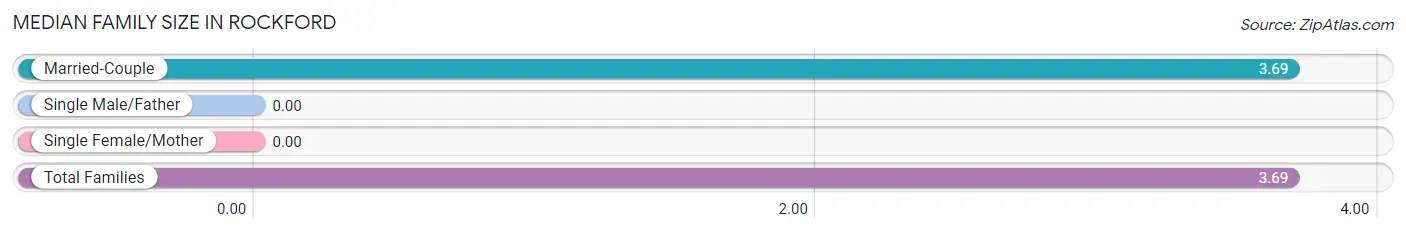
Median Family Size in Rockford
| Family Type | # Families | Family Size |
| Married-Couple | 52 (100.0%) | 3.69 |
| Single Male/Father | 0 (0.0%) | - |
| Single Female/Mother | 0 (0.0%) | - |
| Total Families | 52 (100.0%) | 3.69 |
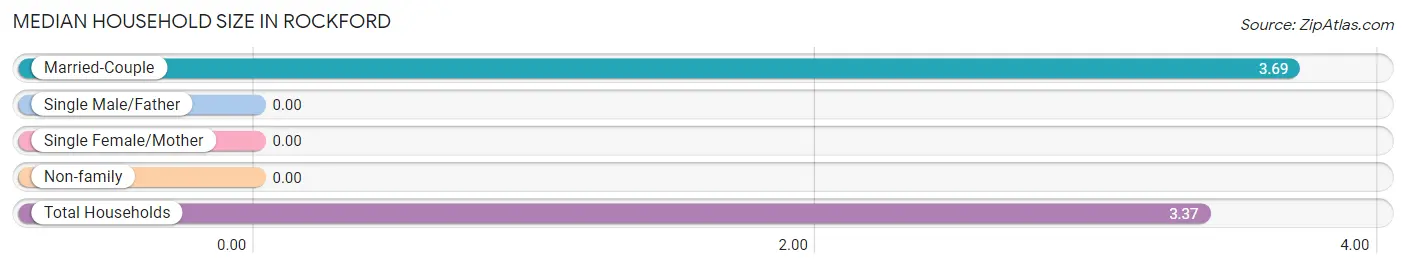
Median Household Size in Rockford
| Household Type | # Households | Household Size |
| Married-Couple | 52 (88.1%) | 3.69 |
| Single Male/Father | 0 (0.0%) | - |
| Single Female/Mother | 0 (0.0%) | - |
| Non-family | 7 (11.9%) | - |
| Total Households | 59 (100.0%) | 3.37 |
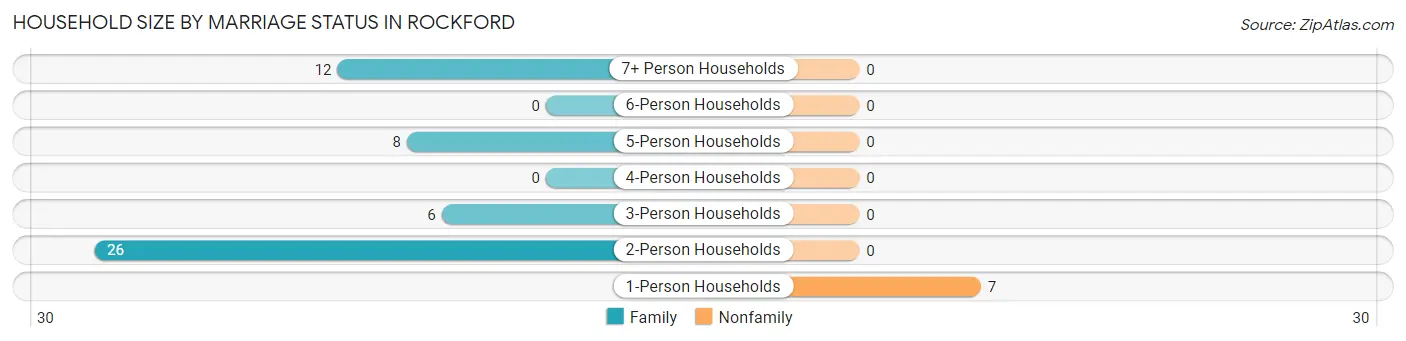
Household Size by Marriage Status in Rockford
Out of a total of 59 households in Rockford, 52 (88.1%) are family households, while 7 (11.9%) are nonfamily households. The most numerous type of family households are 2-person households, comprising 26, and the most common type of nonfamily households are 1-person households, comprising 7.
| Household Size | Family Households | Nonfamily Households |
| 1-Person Households | - | 7 (11.9%) |
| 2-Person Households | 26 (44.1%) | 0 (0.0%) |
| 3-Person Households | 6 (10.2%) | 0 (0.0%) |
| 4-Person Households | 0 (0.0%) | 0 (0.0%) |
| 5-Person Households | 8 (13.6%) | 0 (0.0%) |
| 6-Person Households | 0 (0.0%) | 0 (0.0%) |
| 7+ Person Households | 12 (20.3%) | 0 (0.0%) |
| Total | 52 (88.1%) | 7 (11.9%) |
Female Fertility in Rockford
Fertility by Age in Rockford
| Age Bracket | Women with Births | Births / 1,000 Women |
| 15 to 19 years | 0 (0.0%) | 0.0 |
| 20 to 34 years | 0 (0.0%) | 0.0 |
| 35 to 50 years | 0 (0.0%) | 0.0 |
| Total | 0 (0.0%) | 0.0 |
Fertility by Age by Marriage Status in Rockford
| Age Bracket | Married | Unmarried |
| 15 to 19 years | 0 (0.0%) | 0 (0.0%) |
| 20 to 34 years | 0 (0.0%) | 0 (0.0%) |
| 35 to 50 years | 0 (0.0%) | 0 (0.0%) |
| Total | 0 (0.0%) | 0 (0.0%) |
Fertility by Education in Rockford
| Educational Attainment | Women with Births | Births / 1,000 Women |
| Less than High School | 0 (0.0%) | 0.0 |
| High School Diploma | 0 (0.0%) | 0.0 |
| College or Associate's Degree | 0 (0.0%) | 0.0 |
| Bachelor's Degree | 0 (0.0%) | 0.0 |
| Graduate Degree | 0 (0.0%) | 0.0 |
| Total | 0 (0.0%) | 0.0 |
Fertility by Education by Marriage Status in Rockford
| Educational Attainment | Married | Unmarried |
| Less than High School | 0 (0.0%) | 0 (0.0%) |
| High School Diploma | 0 (0.0%) | 0 (0.0%) |
| College or Associate's Degree | 0 (0.0%) | 0 (0.0%) |
| Bachelor's Degree | 0 (0.0%) | 0 (0.0%) |
| Graduate Degree | 0 (0.0%) | 0 (0.0%) |
| Total | 0 (0.0%) | 0 (0.0%) |
Employment Characteristics in Rockford
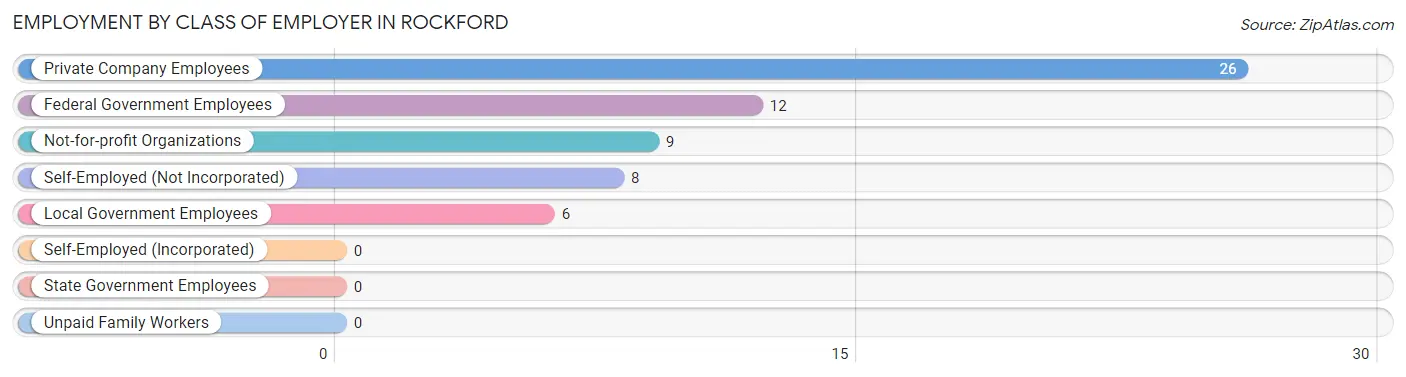
Employment by Class of Employer in Rockford
Among the 61 employed individuals in Rockford, private company employees (26 | 42.6%), federal government employees (12 | 19.7%), and not-for-profit organizations (9 | 14.7%) make up the most common classes of employment.
| Employer Class | # Employees | % Employees |
| Private Company Employees | 26 | 42.6% |
| Self-Employed (Incorporated) | 0 | 0.0% |
| Self-Employed (Not Incorporated) | 8 | 13.1% |
| Not-for-profit Organizations | 9 | 14.7% |
| Local Government Employees | 6 | 9.8% |
| State Government Employees | 0 | 0.0% |
| Federal Government Employees | 12 | 19.7% |
| Unpaid Family Workers | 0 | 0.0% |
| Total | 61 | 100.0% |
Employment Status by Age in Rockford
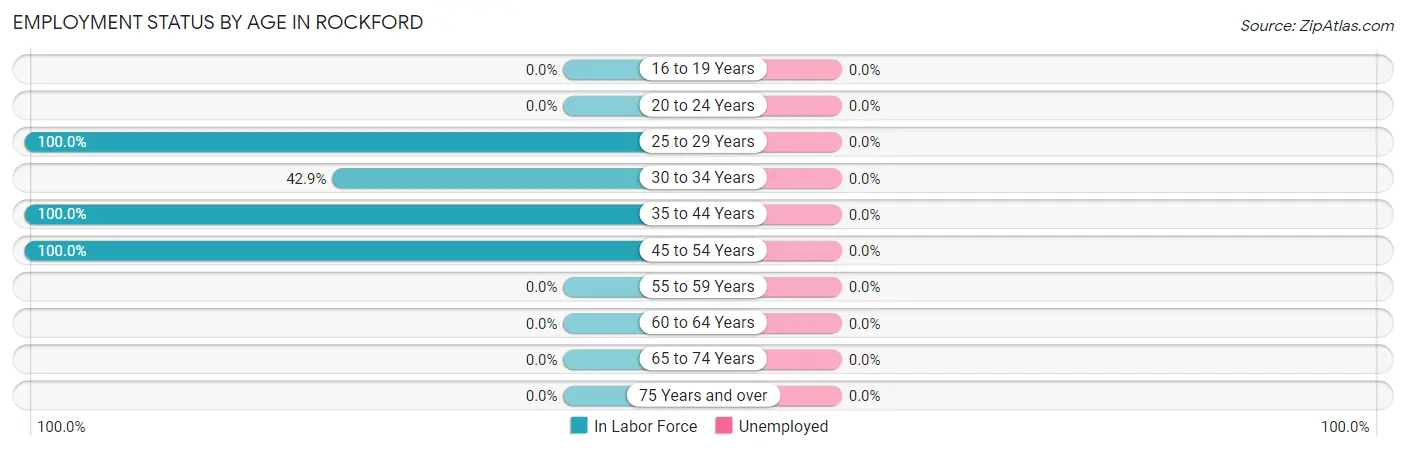
| Age Bracket | In Labor Force | Unemployed |
| 16 to 19 Years | 0 (0.0%) | 0 (0.0%) |
| 20 to 24 Years | 0 (0.0%) | 0 (0.0%) |
| 25 to 29 Years | 12 (100.0%) | 0 (0.0%) |
| 30 to 34 Years | 12 (42.9%) | 0 (0.0%) |
| 35 to 44 Years | 17 (100.0%) | 0 (0.0%) |
| 45 to 54 Years | 20 (100.0%) | 0 (0.0%) |
| 55 to 59 Years | 0 (0.0%) | 0 (0.0%) |
| 60 to 64 Years | 0 (0.0%) | 0 (0.0%) |
| 65 to 74 Years | 0 (0.0%) | 0 (0.0%) |
| 75 Years and over | 0 (0.0%) | 0 (0.0%) |
| Total | 61 (50.4%) | 0 (0.0%) |
Employment Status by Educational Attainment in Rockford
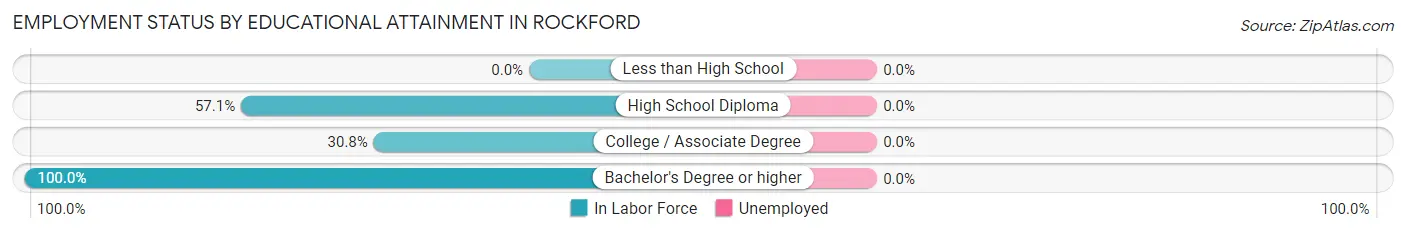
| Educational Attainment | In Labor Force | Unemployed |
| Less than High School | 0 (0.0%) | 0 (0.0%) |
| High School Diploma | 20 (57.1%) | 0 (0.0%) |
| College / Associate Degree | 12 (30.8%) | 0 (0.0%) |
| Bachelor's Degree or higher | 29 (100.0%) | 0 (0.0%) |
| Total | 61 (59.2%) | 0 (0.0%) |
Employment Occupations by Sex in Rockford
Management, Business, Science and Arts Occupations
The most common Management, Business, Science and Arts occupations in Rockford are Community & Social Service (15 | 24.6%), Education Instruction & Library (15 | 24.6%), and Business & Financial (8 | 13.1%).
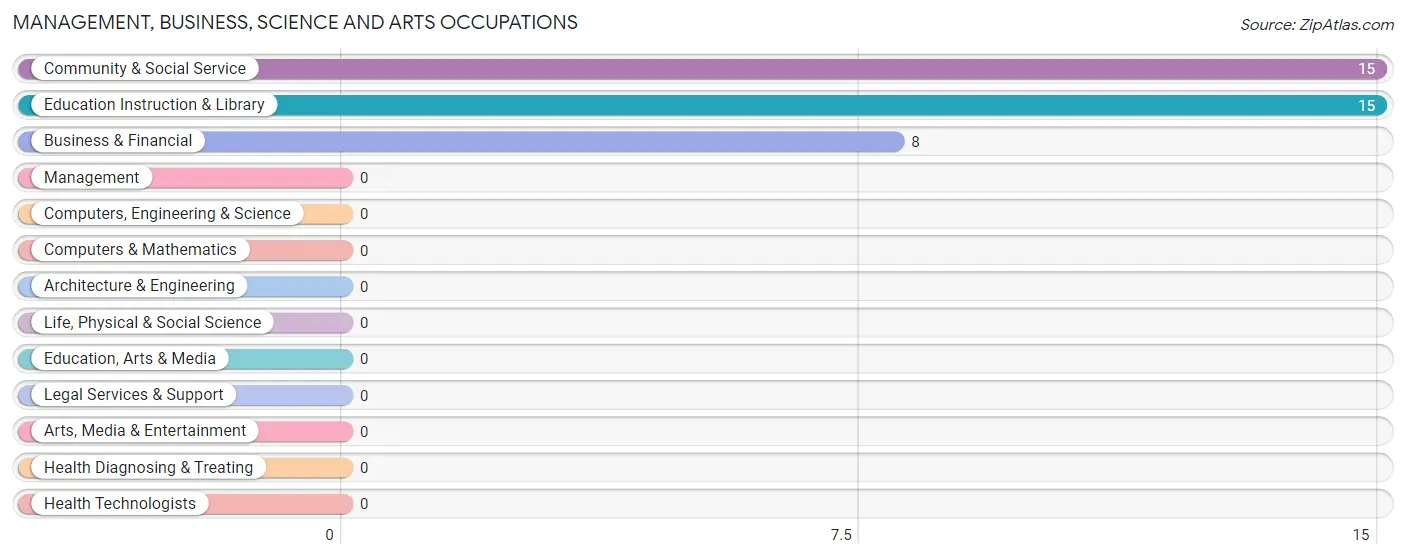
Management, Business, Science and Arts Occupations by Sex
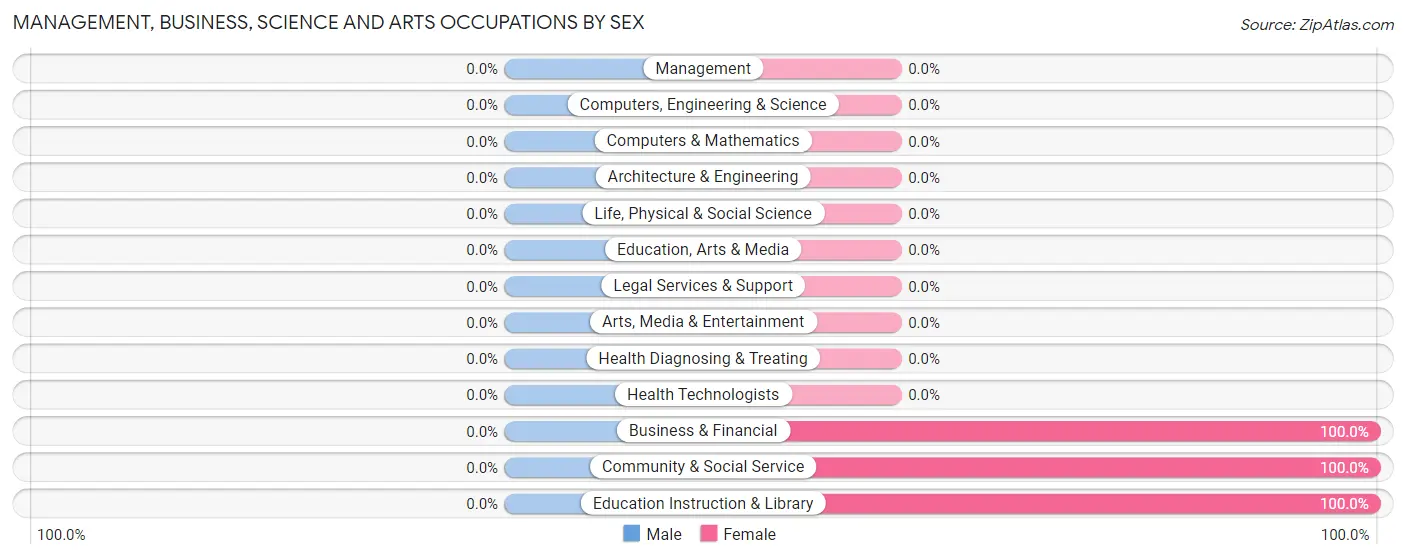
| Occupation | Male | Female |
| Management | 0 (0.0%) | 0 (0.0%) |
| Business & Financial | 0 (0.0%) | 8 (100.0%) |
| Computers, Engineering & Science | 0 (0.0%) | 0 (0.0%) |
| Computers & Mathematics | 0 (0.0%) | 0 (0.0%) |
| Architecture & Engineering | 0 (0.0%) | 0 (0.0%) |
| Life, Physical & Social Science | 0 (0.0%) | 0 (0.0%) |
| Community & Social Service | 0 (0.0%) | 15 (100.0%) |
| Education, Arts & Media | 0 (0.0%) | 0 (0.0%) |
| Legal Services & Support | 0 (0.0%) | 0 (0.0%) |
| Education Instruction & Library | 0 (0.0%) | 15 (100.0%) |
| Arts, Media & Entertainment | 0 (0.0%) | 0 (0.0%) |
| Health Diagnosing & Treating | 0 (0.0%) | 0 (0.0%) |
| Health Technologists | 0 (0.0%) | 0 (0.0%) |
| Total (Category) | 0 (0.0%) | 23 (100.0%) |
| Total (Overall) | 38 (62.3%) | 23 (37.7%) |
Services Occupations
Services Occupations by Sex
| Occupation | Male | Female |
| Healthcare Support | 0 (0.0%) | 0 (0.0%) |
| Security & Protection | 0 (0.0%) | 0 (0.0%) |
| Firefighting & Prevention | 0 (0.0%) | 0 (0.0%) |
| Law Enforcement | 0 (0.0%) | 0 (0.0%) |
| Food Preparation & Serving | 0 (0.0%) | 0 (0.0%) |
| Cleaning & Maintenance | 0 (0.0%) | 0 (0.0%) |
| Personal Care & Service | 0 (0.0%) | 0 (0.0%) |
| Total (Category) | 0 (0.0%) | 0 (0.0%) |
| Total (Overall) | 38 (62.3%) | 23 (37.7%) |
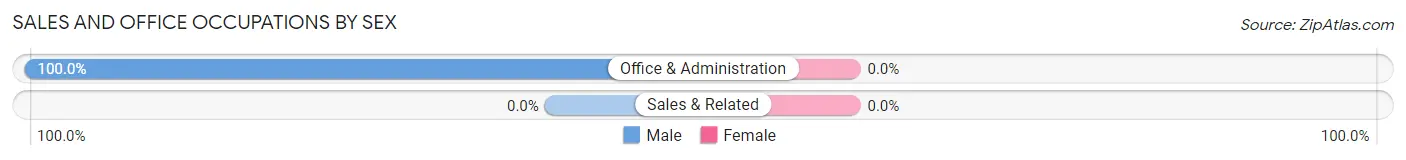
Sales and Office Occupations
The most common Sales and Office occupations in Rockford are , and Office & Administration (12 | 19.7%).
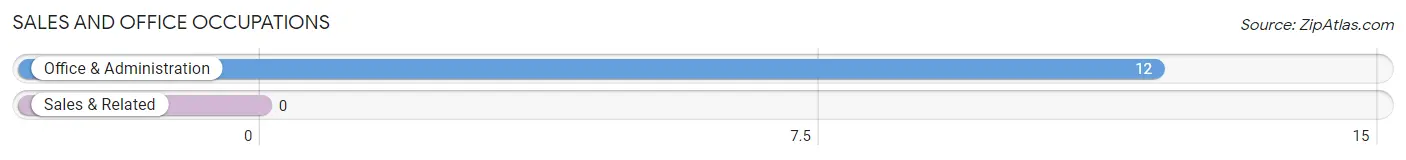
Sales and Office Occupations by Sex
| Occupation | Male | Female |
| Sales & Related | 0 (0.0%) | 0 (0.0%) |
| Office & Administration | 12 (100.0%) | 0 (0.0%) |
| Total (Category) | 12 (100.0%) | 0 (0.0%) |
| Total (Overall) | 38 (62.3%) | 23 (37.7%) |
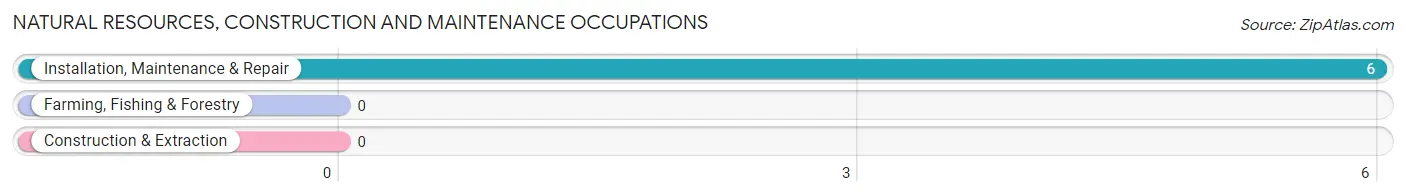
Natural Resources, Construction and Maintenance Occupations
The most common Natural Resources, Construction and Maintenance occupations in Rockford are , and Installation, Maintenance & Repair (6 | 9.8%).
Natural Resources, Construction and Maintenance Occupations by Sex
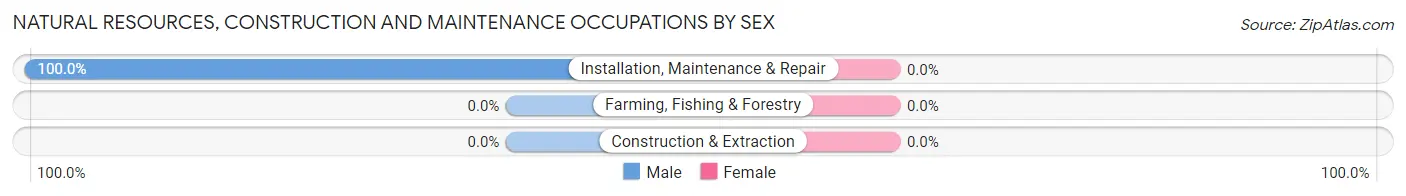
| Occupation | Male | Female |
| Farming, Fishing & Forestry | 0 (0.0%) | 0 (0.0%) |
| Construction & Extraction | 0 (0.0%) | 0 (0.0%) |
| Installation, Maintenance & Repair | 6 (100.0%) | 0 (0.0%) |
| Total (Category) | 6 (100.0%) | 0 (0.0%) |
| Total (Overall) | 38 (62.3%) | 23 (37.7%) |
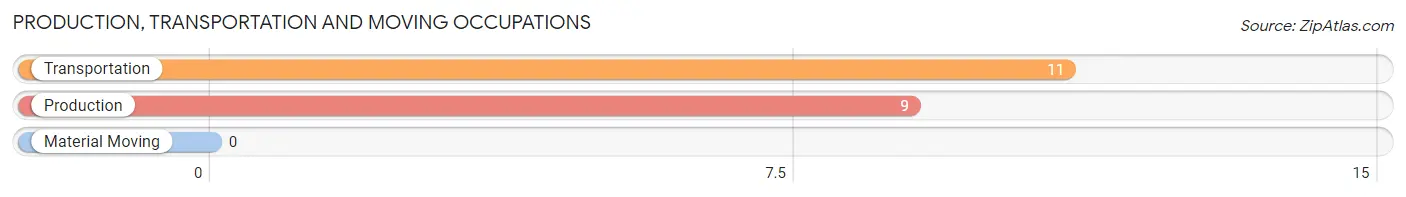
Production, Transportation and Moving Occupations
The most common Production, Transportation and Moving occupations in Rockford are Transportation (11 | 18.0%), and Production (9 | 14.7%).
Production, Transportation and Moving Occupations by Sex
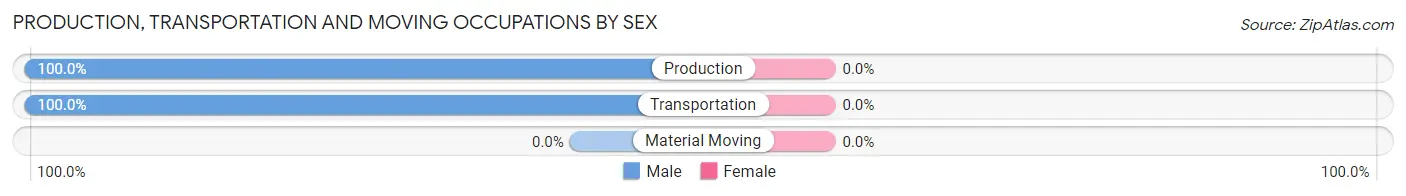
| Occupation | Male | Female |
| Production | 9 (100.0%) | 0 (0.0%) |
| Transportation | 11 (100.0%) | 0 (0.0%) |
| Material Moving | 0 (0.0%) | 0 (0.0%) |
| Total (Category) | 20 (100.0%) | 0 (0.0%) |
| Total (Overall) | 38 (62.3%) | 23 (37.7%) |
Employment Industries by Sex in Rockford
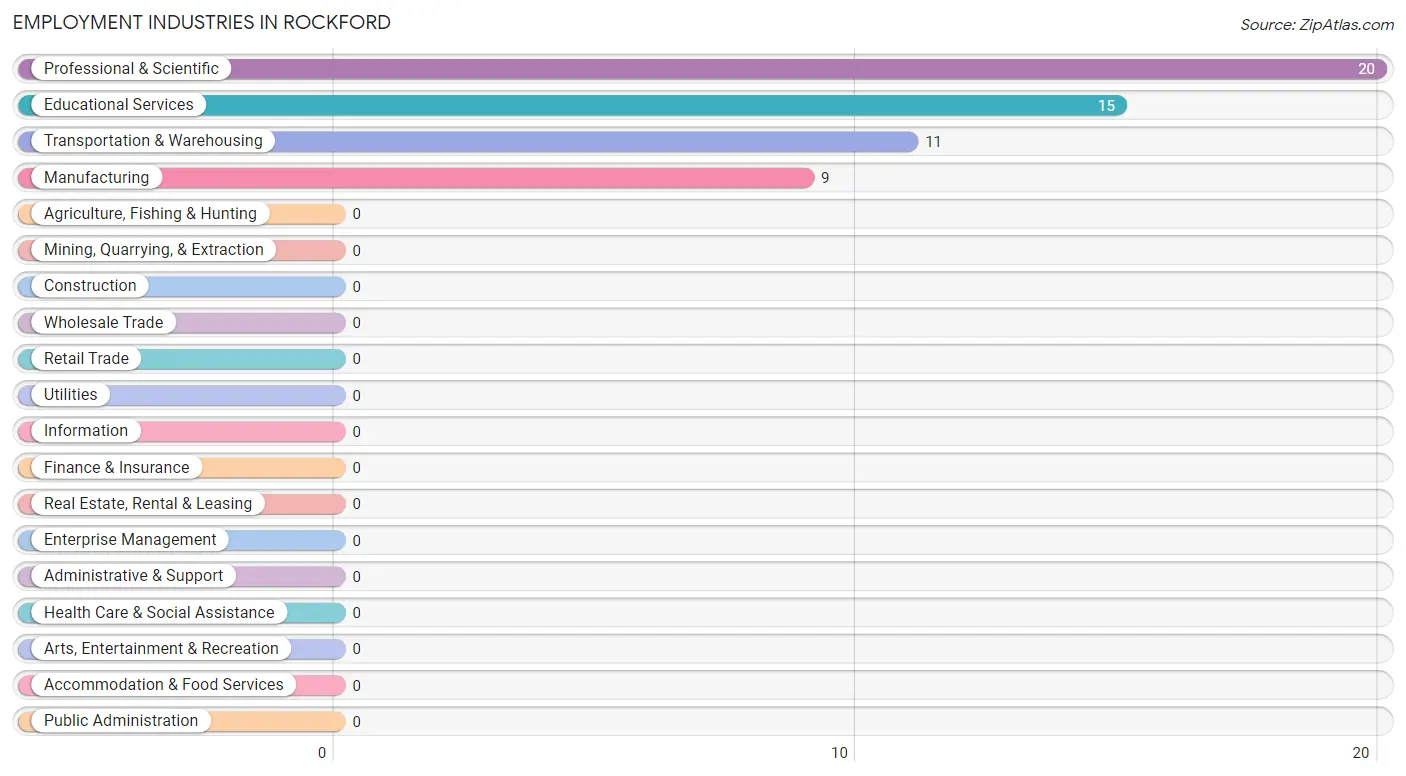
Employment Industries in Rockford
The major employment industries in Rockford include Professional & Scientific (20 | 32.8%), Educational Services (15 | 24.6%), Transportation & Warehousing (11 | 18.0%), and Manufacturing (9 | 14.7%).
Employment Industries by Sex in Rockford
The Rockford industries that see more men than women are Manufacturing (100.0%), Transportation & Warehousing (100.0%), and Professional & Scientific (60.0%), whereas the industries that tend to have a higher number of women are Educational Services (100.0%), and Professional & Scientific (40.0%).
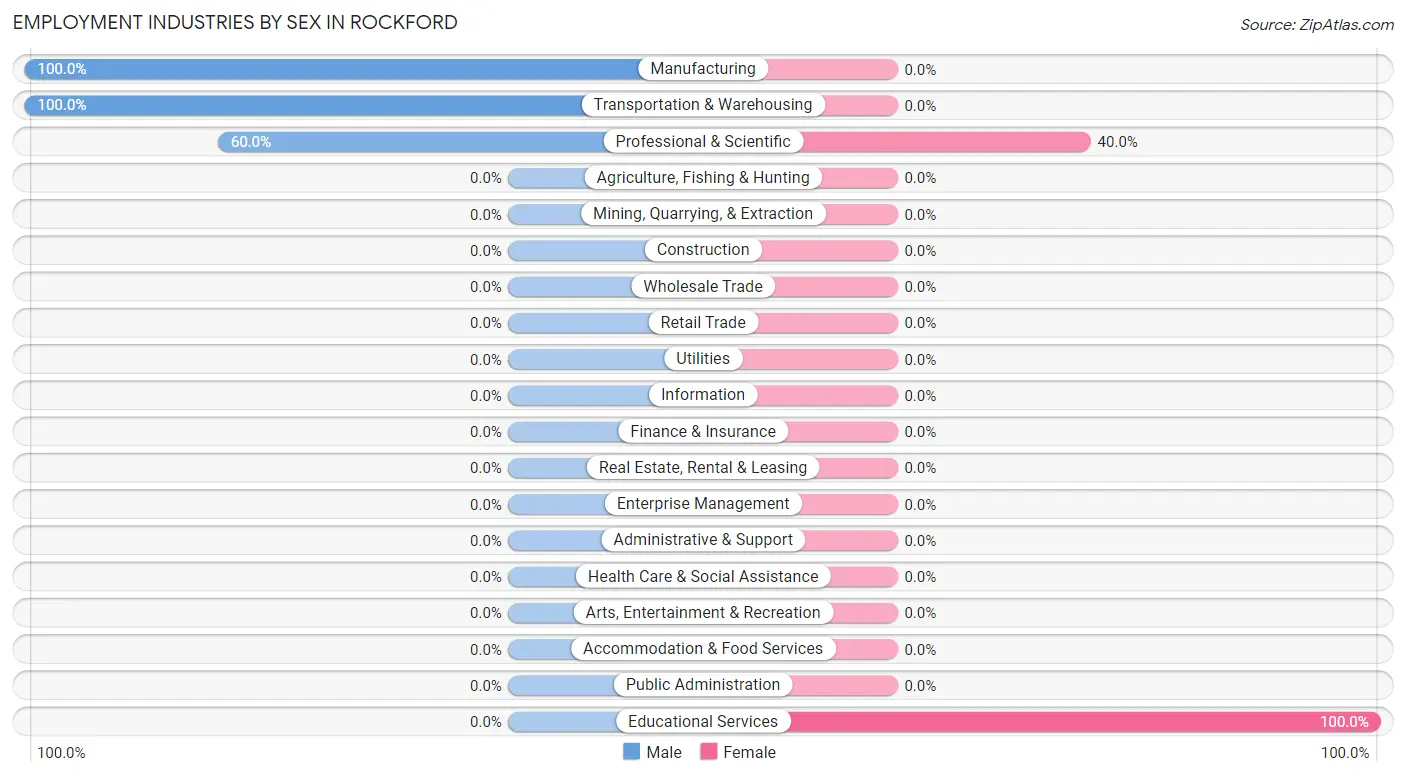
| Industry | Male | Female |
| Agriculture, Fishing & Hunting | 0 (0.0%) | 0 (0.0%) |
| Mining, Quarrying, & Extraction | 0 (0.0%) | 0 (0.0%) |
| Construction | 0 (0.0%) | 0 (0.0%) |
| Manufacturing | 9 (100.0%) | 0 (0.0%) |
| Wholesale Trade | 0 (0.0%) | 0 (0.0%) |
| Retail Trade | 0 (0.0%) | 0 (0.0%) |
| Transportation & Warehousing | 11 (100.0%) | 0 (0.0%) |
| Utilities | 0 (0.0%) | 0 (0.0%) |
| Information | 0 (0.0%) | 0 (0.0%) |
| Finance & Insurance | 0 (0.0%) | 0 (0.0%) |
| Real Estate, Rental & Leasing | 0 (0.0%) | 0 (0.0%) |
| Professional & Scientific | 12 (60.0%) | 8 (40.0%) |
| Enterprise Management | 0 (0.0%) | 0 (0.0%) |
| Administrative & Support | 0 (0.0%) | 0 (0.0%) |
| Educational Services | 0 (0.0%) | 15 (100.0%) |
| Health Care & Social Assistance | 0 (0.0%) | 0 (0.0%) |
| Arts, Entertainment & Recreation | 0 (0.0%) | 0 (0.0%) |
| Accommodation & Food Services | 0 (0.0%) | 0 (0.0%) |
| Public Administration | 0 (0.0%) | 0 (0.0%) |
| Total | 38 (62.3%) | 23 (37.7%) |
Education in Rockford
School Enrollment in Rockford
The most common levels of schooling among the 91 students in Rockford are elementary school (36 | 39.6%), college / undergraduate (20 | 22.0%), and nursery / preschool (14 | 15.4%).
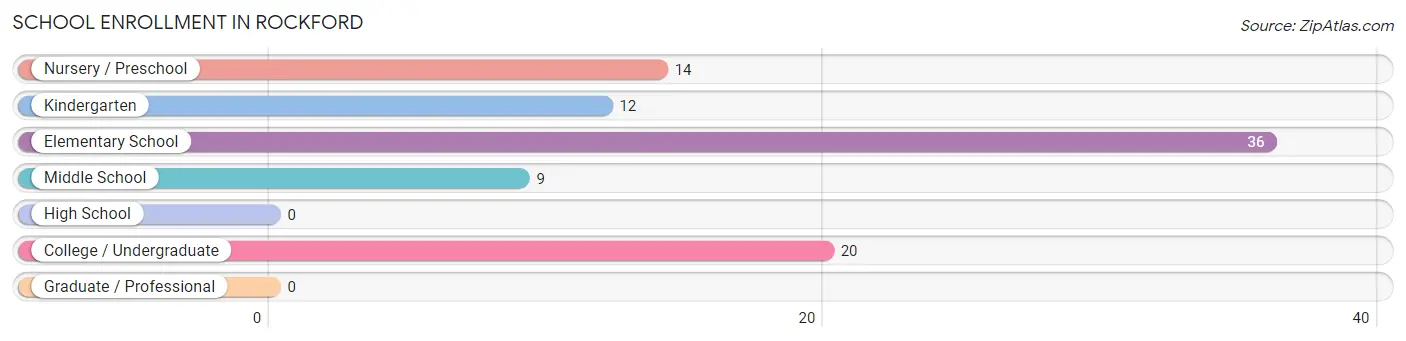
| School Level | # Students | % Students |
| Nursery / Preschool | 14 | 15.4% |
| Kindergarten | 12 | 13.2% |
| Elementary School | 36 | 39.6% |
| Middle School | 9 | 9.9% |
| High School | 0 | 0.0% |
| College / Undergraduate | 20 | 22.0% |
| Graduate / Professional | 0 | 0.0% |
| Total | 91 | 100.0% |
School Enrollment by Age by Funding Source in Rockford
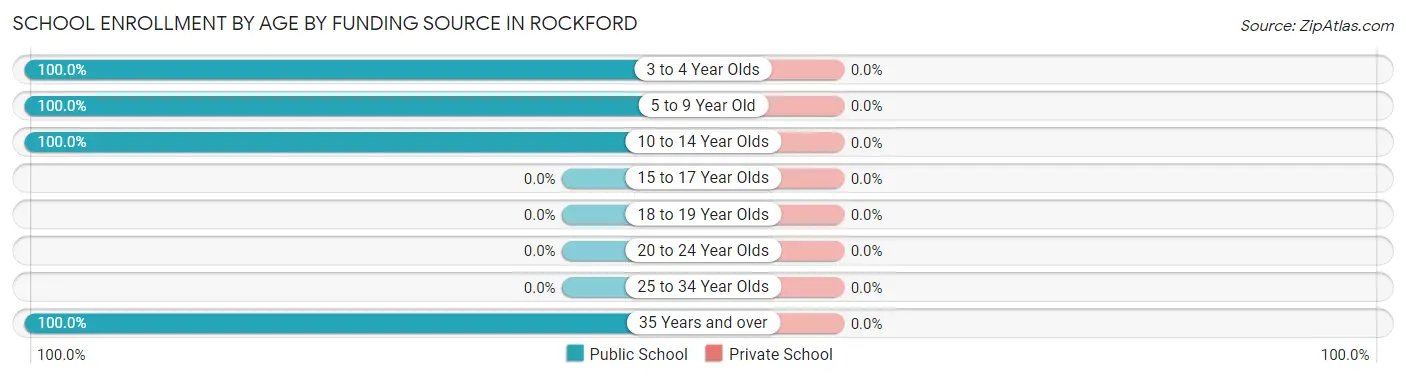
| Age Bracket | Public School | Private School |
| 3 to 4 Year Olds | 14 (100.0%) | 0 (0.0%) |
| 5 to 9 Year Old | 39 (100.0%) | 0 (0.0%) |
| 10 to 14 Year Olds | 18 (100.0%) | 0 (0.0%) |
| 15 to 17 Year Olds | 0 (0.0%) | 0 (0.0%) |
| 18 to 19 Year Olds | 0 (0.0%) | 0 (0.0%) |
| 20 to 24 Year Olds | 0 (0.0%) | 0 (0.0%) |
| 25 to 34 Year Olds | 0 (0.0%) | 0 (0.0%) |
| 35 Years and over | 20 (100.0%) | 0 (0.0%) |
| Total | 91 (100.0%) | 0 (0.0%) |
Educational Attainment by Field of Study in Rockford
Business (35 | 59.3%), education (12 | 20.3%), and arts & humanities (12 | 20.3%) are the most common fields of study among 59 individuals in Rockford who have obtained a bachelor's degree or higher.
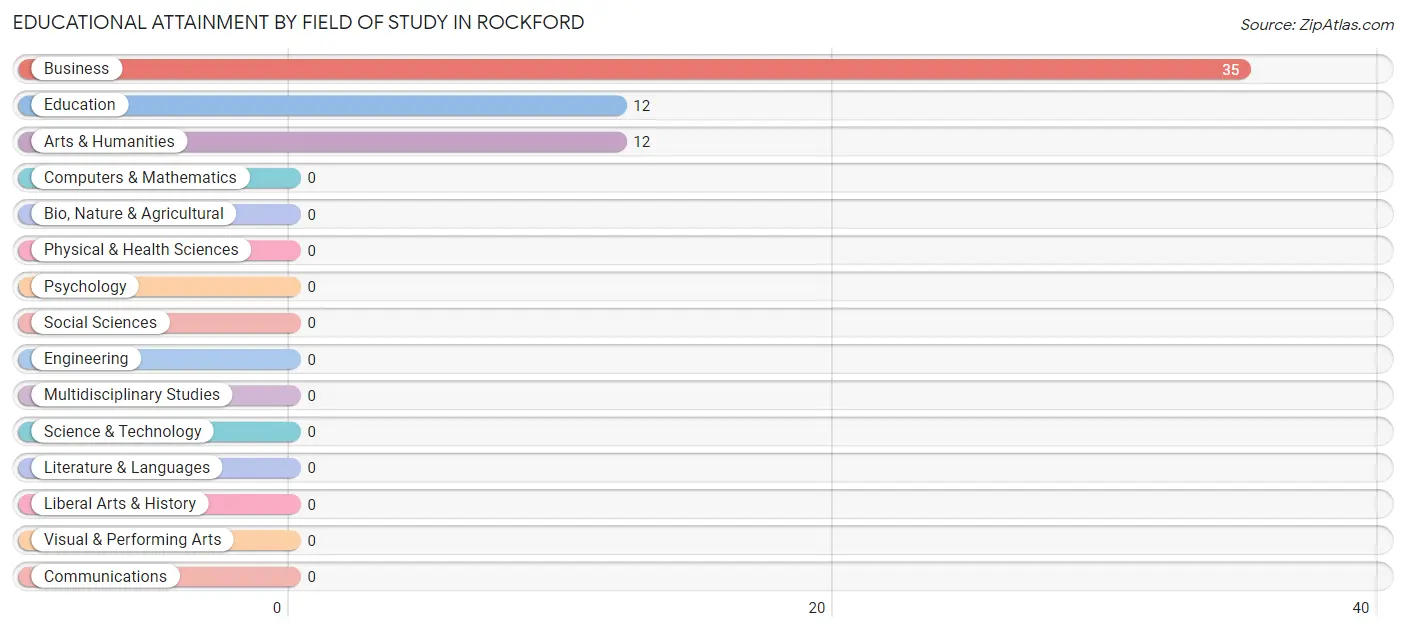
| Field of Study | # Graduates | % Graduates |
| Computers & Mathematics | 0 | 0.0% |
| Bio, Nature & Agricultural | 0 | 0.0% |
| Physical & Health Sciences | 0 | 0.0% |
| Psychology | 0 | 0.0% |
| Social Sciences | 0 | 0.0% |
| Engineering | 0 | 0.0% |
| Multidisciplinary Studies | 0 | 0.0% |
| Science & Technology | 0 | 0.0% |
| Business | 35 | 59.3% |
| Education | 12 | 20.3% |
| Literature & Languages | 0 | 0.0% |
| Liberal Arts & History | 0 | 0.0% |
| Visual & Performing Arts | 0 | 0.0% |
| Communications | 0 | 0.0% |
| Arts & Humanities | 12 | 20.3% |
| Total | 59 | 100.0% |
Transportation & Commute in Rockford
Vehicle Availability by Sex in Rockford
The most prevalent vehicle ownership categories in Rockford are males with 3 vehicles (17, accounting for 44.7%) and females with 3 vehicles (15, making up 73.9%).
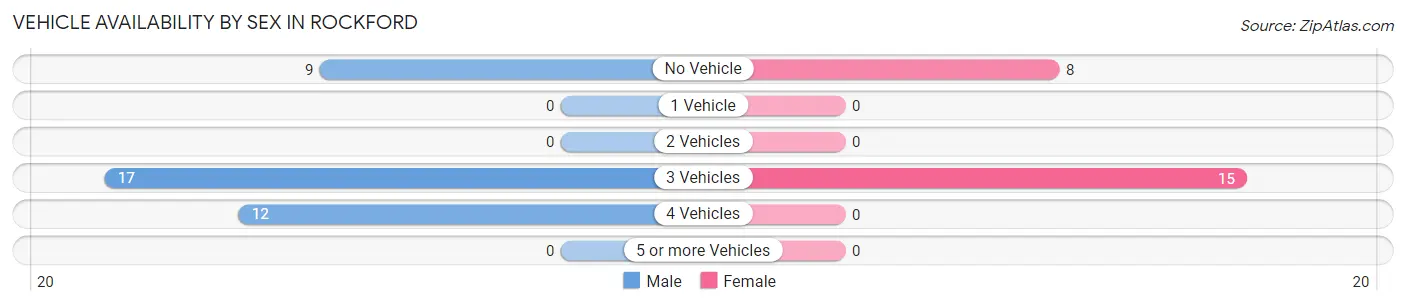
| Vehicles Available | Male | Female |
| No Vehicle | 9 (23.7%) | 8 (34.8%) |
| 1 Vehicle | 0 (0.0%) | 0 (0.0%) |
| 2 Vehicles | 0 (0.0%) | 0 (0.0%) |
| 3 Vehicles | 17 (44.7%) | 15 (65.2%) |
| 4 Vehicles | 12 (31.6%) | 0 (0.0%) |
| 5 or more Vehicles | 0 (0.0%) | 0 (0.0%) |
| Total | 38 (100.0%) | 23 (100.0%) |
Commute Time in Rockford
The most frequently occuring commute durations in Rockford are 25 to 29 minutes (12 commuters, 27.3%), 45 to 59 minutes (11 commuters, 25.0%), and 5 to 9 minutes (9 commuters, 20.4%).
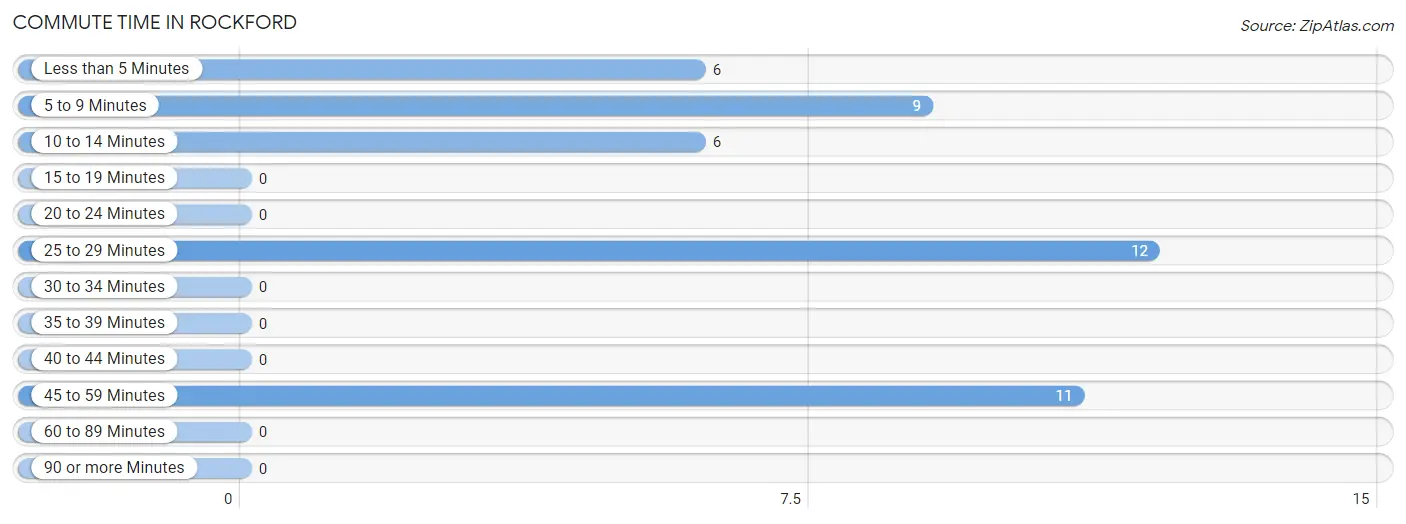
| Commute Time | # Commuters | % Commuters |
| Less than 5 Minutes | 6 | 13.6% |
| 5 to 9 Minutes | 9 | 20.4% |
| 10 to 14 Minutes | 6 | 13.6% |
| 15 to 19 Minutes | 0 | 0.0% |
| 20 to 24 Minutes | 0 | 0.0% |
| 25 to 29 Minutes | 12 | 27.3% |
| 30 to 34 Minutes | 0 | 0.0% |
| 35 to 39 Minutes | 0 | 0.0% |
| 40 to 44 Minutes | 0 | 0.0% |
| 45 to 59 Minutes | 11 | 25.0% |
| 60 to 89 Minutes | 0 | 0.0% |
| 90 or more Minutes | 0 | 0.0% |
Commute Time by Sex in Rockford
The most common commute times in Rockford are 25 to 29 minutes (12 commuters, 41.4%) for males and 5 to 9 minutes (9 commuters, 60.0%) for females.
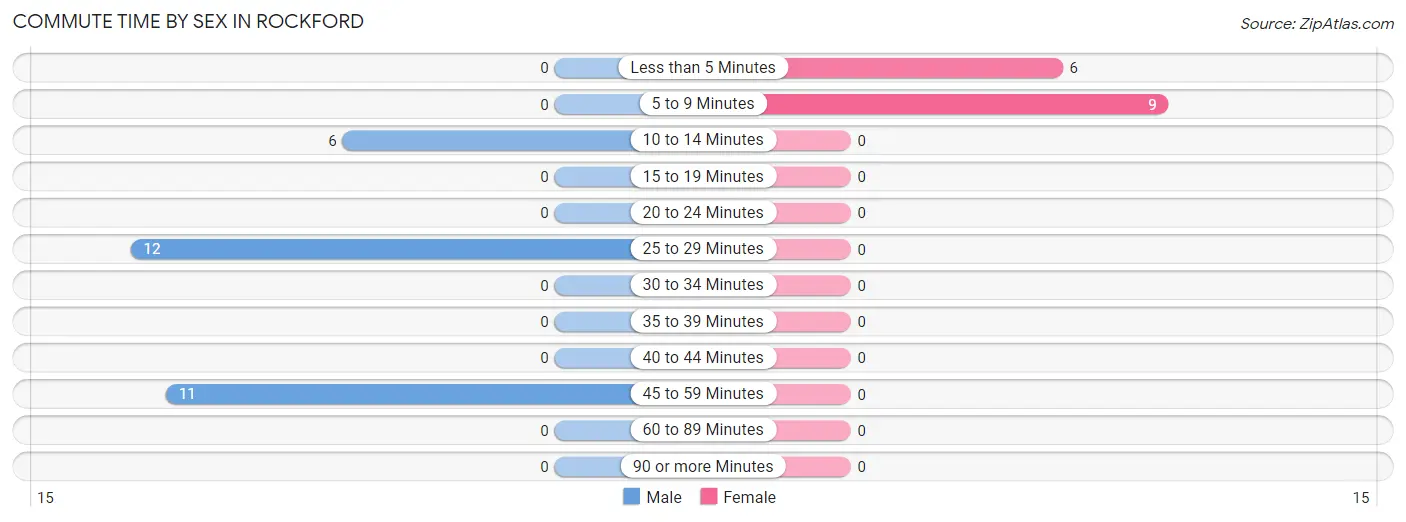
| Commute Time | Male | Female |
| Less than 5 Minutes | 0 (0.0%) | 6 (40.0%) |
| 5 to 9 Minutes | 0 (0.0%) | 9 (60.0%) |
| 10 to 14 Minutes | 6 (20.7%) | 0 (0.0%) |
| 15 to 19 Minutes | 0 (0.0%) | 0 (0.0%) |
| 20 to 24 Minutes | 0 (0.0%) | 0 (0.0%) |
| 25 to 29 Minutes | 12 (41.4%) | 0 (0.0%) |
| 30 to 34 Minutes | 0 (0.0%) | 0 (0.0%) |
| 35 to 39 Minutes | 0 (0.0%) | 0 (0.0%) |
| 40 to 44 Minutes | 0 (0.0%) | 0 (0.0%) |
| 45 to 59 Minutes | 11 (37.9%) | 0 (0.0%) |
| 60 to 89 Minutes | 0 (0.0%) | 0 (0.0%) |
| 90 or more Minutes | 0 (0.0%) | 0 (0.0%) |
Time of Departure to Work by Sex in Rockford
The most frequent times of departure to work in Rockford are 7:30 AM to 7:59 AM (12, 41.4%) for males and 7:30 AM to 7:59 AM (9, 60.0%) for females.
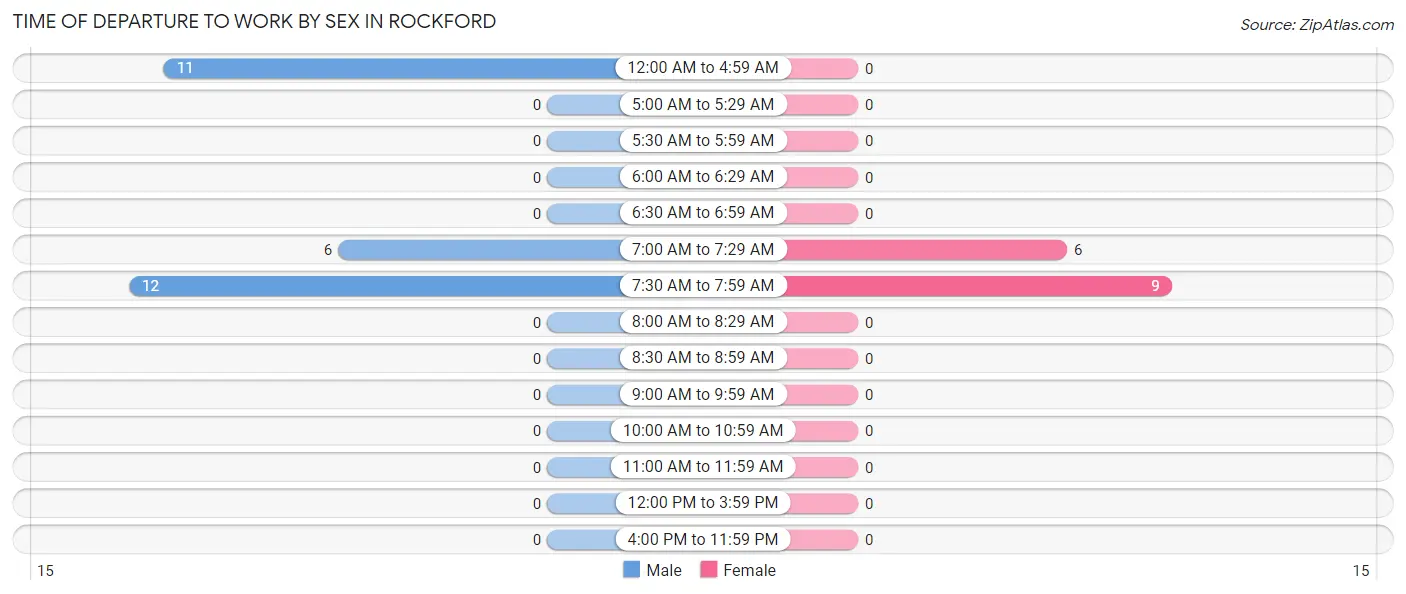
| Time of Departure | Male | Female |
| 12:00 AM to 4:59 AM | 11 (37.9%) | 0 (0.0%) |
| 5:00 AM to 5:29 AM | 0 (0.0%) | 0 (0.0%) |
| 5:30 AM to 5:59 AM | 0 (0.0%) | 0 (0.0%) |
| 6:00 AM to 6:29 AM | 0 (0.0%) | 0 (0.0%) |
| 6:30 AM to 6:59 AM | 0 (0.0%) | 0 (0.0%) |
| 7:00 AM to 7:29 AM | 6 (20.7%) | 6 (40.0%) |
| 7:30 AM to 7:59 AM | 12 (41.4%) | 9 (60.0%) |
| 8:00 AM to 8:29 AM | 0 (0.0%) | 0 (0.0%) |
| 8:30 AM to 8:59 AM | 0 (0.0%) | 0 (0.0%) |
| 9:00 AM to 9:59 AM | 0 (0.0%) | 0 (0.0%) |
| 10:00 AM to 10:59 AM | 0 (0.0%) | 0 (0.0%) |
| 11:00 AM to 11:59 AM | 0 (0.0%) | 0 (0.0%) |
| 12:00 PM to 3:59 PM | 0 (0.0%) | 0 (0.0%) |
| 4:00 PM to 11:59 PM | 0 (0.0%) | 0 (0.0%) |
| Total | 29 (100.0%) | 15 (100.0%) |
Housing Occupancy in Rockford
Occupancy by Ownership in Rockford
Of the total 59 dwellings in Rockford, owner-occupied units account for 59 (100.0%), while renter-occupied units make up 0 (0.0%).
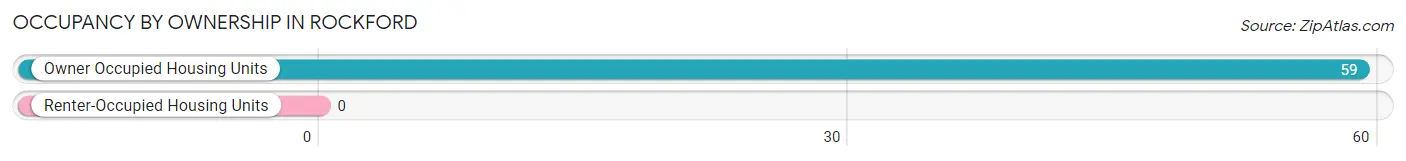
| Occupancy | # Housing Units | % Housing Units |
| Owner Occupied Housing Units | 59 | 100.0% |
| Renter-Occupied Housing Units | 0 | 0.0% |
| Total Occupied Housing Units | 59 | 100.0% |
Occupancy by Household Size in Rockford
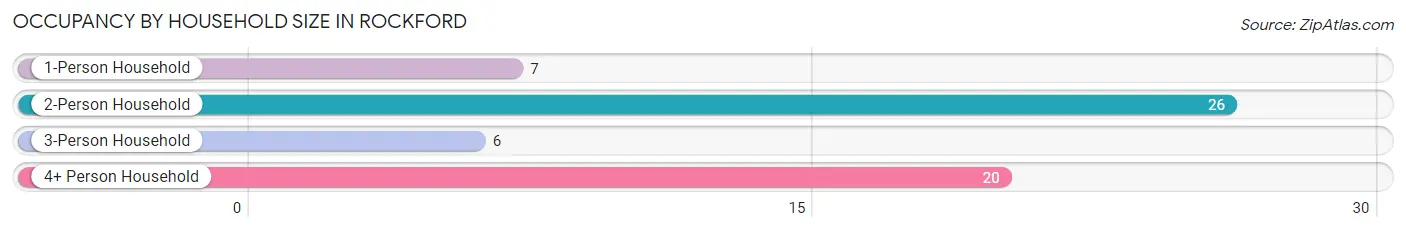
| Household Size | # Housing Units | % Housing Units |
| 1-Person Household | 7 | 11.9% |
| 2-Person Household | 26 | 44.1% |
| 3-Person Household | 6 | 10.2% |
| 4+ Person Household | 20 | 33.9% |
| Total Housing Units | 59 | 100.0% |
Occupancy by Ownership by Household Size in Rockford
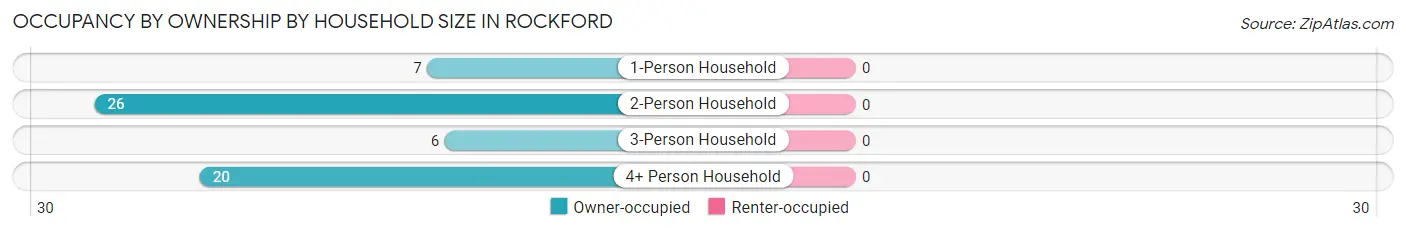
| Household Size | Owner-occupied | Renter-occupied |
| 1-Person Household | 7 (100.0%) | 0 (0.0%) |
| 2-Person Household | 26 (100.0%) | 0 (0.0%) |
| 3-Person Household | 6 (100.0%) | 0 (0.0%) |
| 4+ Person Household | 20 (100.0%) | 0 (0.0%) |
| Total Housing Units | 59 (100.0%) | 0 (0.0%) |
Occupancy by Educational Attainment in Rockford
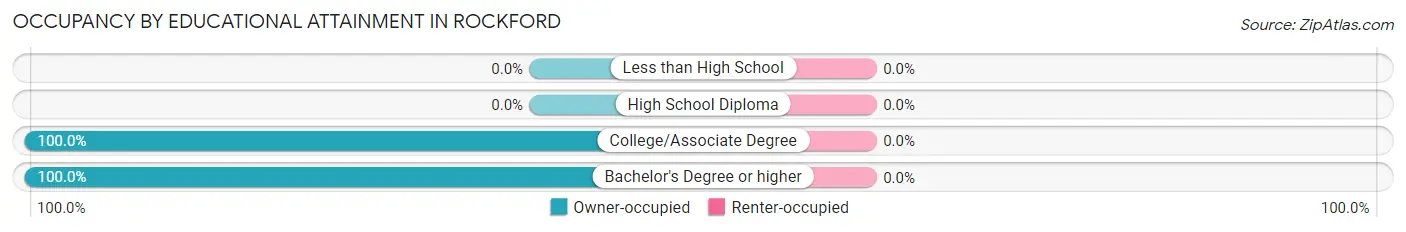
| Household Size | Owner-occupied | Renter-occupied |
| Less than High School | 0 (0.0%) | 0 (0.0%) |
| High School Diploma | 0 (0.0%) | 0 (0.0%) |
| College/Associate Degree | 17 (100.0%) | 0 (0.0%) |
| Bachelor's Degree or higher | 42 (100.0%) | 0 (0.0%) |
Occupancy by Age of Householder in Rockford
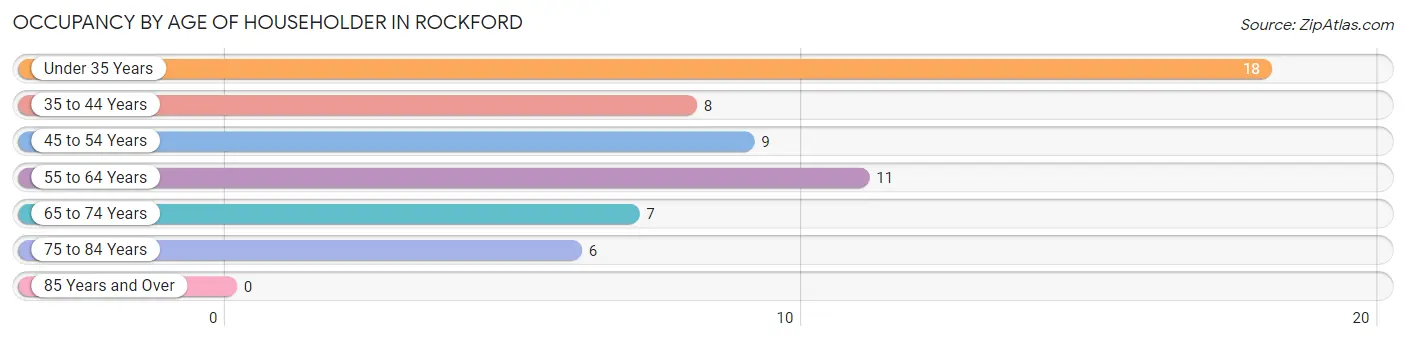
| Age Bracket | # Households | % Households |
| Under 35 Years | 18 | 30.5% |
| 35 to 44 Years | 8 | 13.6% |
| 45 to 54 Years | 9 | 15.2% |
| 55 to 64 Years | 11 | 18.6% |
| 65 to 74 Years | 7 | 11.9% |
| 75 to 84 Years | 6 | 10.2% |
| 85 Years and Over | 0 | 0.0% |
| Total | 59 | 100.0% |
Housing Finances in Rockford
Median Income by Occupancy in Rockford
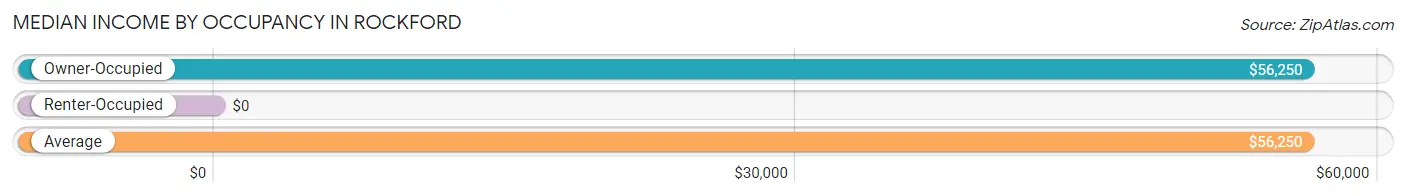
| Occupancy Type | # Households | Median Income |
| Owner-Occupied | 59 (100.0%) | $56,250 |
| Renter-Occupied | 0 (0.0%) | $0 |
| Average | 59 (100.0%) | $56,250 |
Occupancy by Householder Income Bracket in Rockford
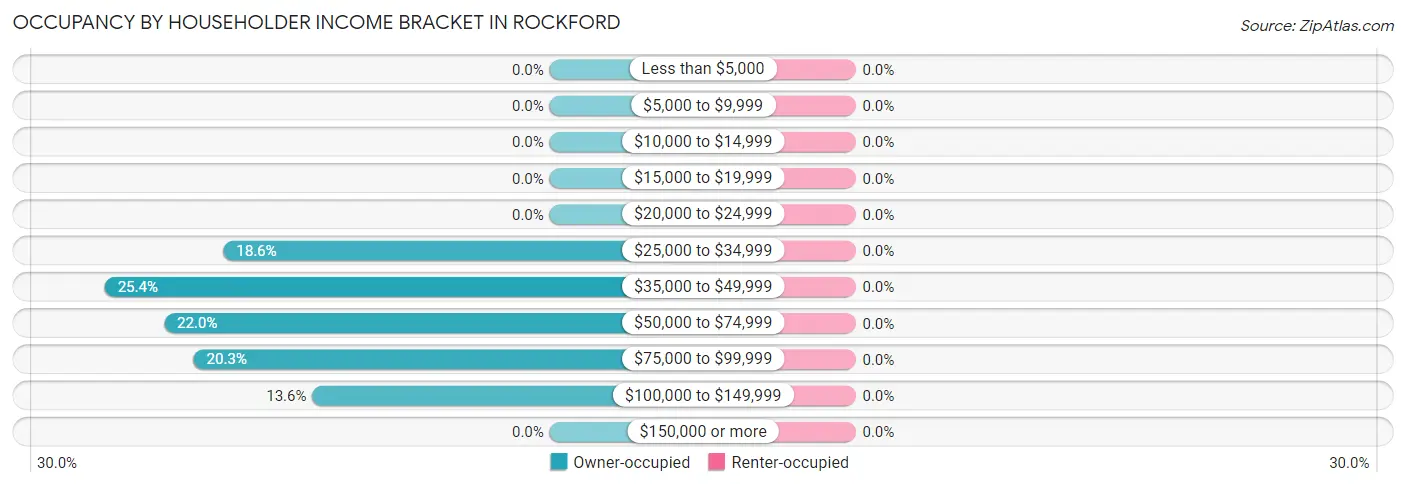
| Income Bracket | Owner-occupied | Renter-occupied |
| Less than $5,000 | 0 (0.0%) | 0 (0.0%) |
| $5,000 to $9,999 | 0 (0.0%) | 0 (0.0%) |
| $10,000 to $14,999 | 0 (0.0%) | 0 (0.0%) |
| $15,000 to $19,999 | 0 (0.0%) | 0 (0.0%) |
| $20,000 to $24,999 | 0 (0.0%) | 0 (0.0%) |
| $25,000 to $34,999 | 11 (18.6%) | 0 (0.0%) |
| $35,000 to $49,999 | 15 (25.4%) | 0 (0.0%) |
| $50,000 to $74,999 | 13 (22.0%) | 0 (0.0%) |
| $75,000 to $99,999 | 12 (20.3%) | 0 (0.0%) |
| $100,000 to $149,999 | 8 (13.6%) | 0 (0.0%) |
| $150,000 or more | 0 (0.0%) | 0 (0.0%) |
| Total | 59 (100.0%) | 0 (0.0%) |
Monthly Housing Cost Tiers in Rockford
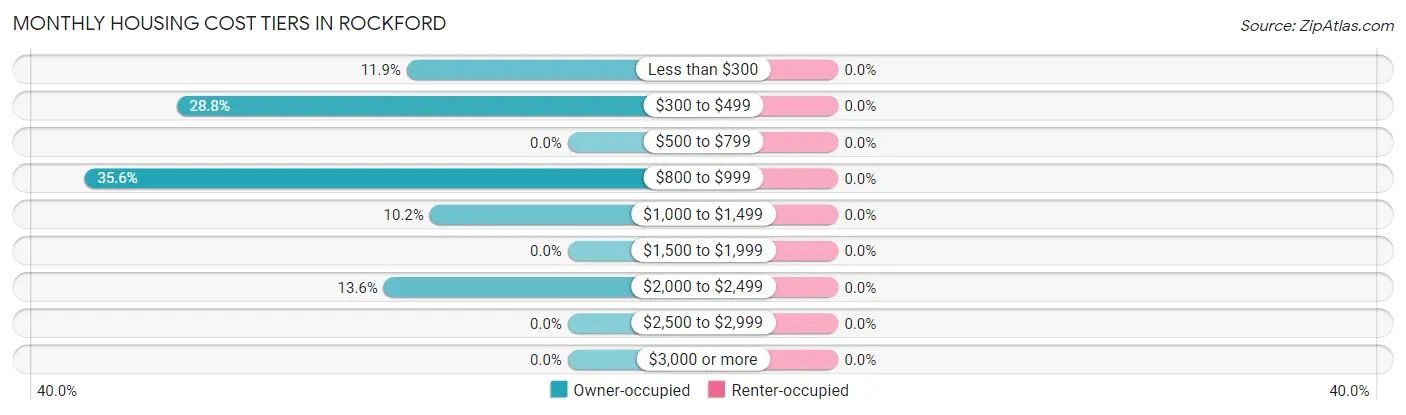
| Monthly Cost | Owner-occupied | Renter-occupied |
| Less than $300 | 7 (11.9%) | 0 (0.0%) |
| $300 to $499 | 17 (28.8%) | 0 (0.0%) |
| $500 to $799 | 0 (0.0%) | 0 (0.0%) |
| $800 to $999 | 21 (35.6%) | 0 (0.0%) |
| $1,000 to $1,499 | 6 (10.2%) | 0 (0.0%) |
| $1,500 to $1,999 | 0 (0.0%) | 0 (0.0%) |
| $2,000 to $2,499 | 8 (13.6%) | 0 (0.0%) |
| $2,500 to $2,999 | 0 (0.0%) | 0 (0.0%) |
| $3,000 or more | 0 (0.0%) | 0 (0.0%) |
| Total | 59 (100.0%) | 0 (0.0%) |
Physical Housing Characteristics in Rockford
Housing Structures in Rockford
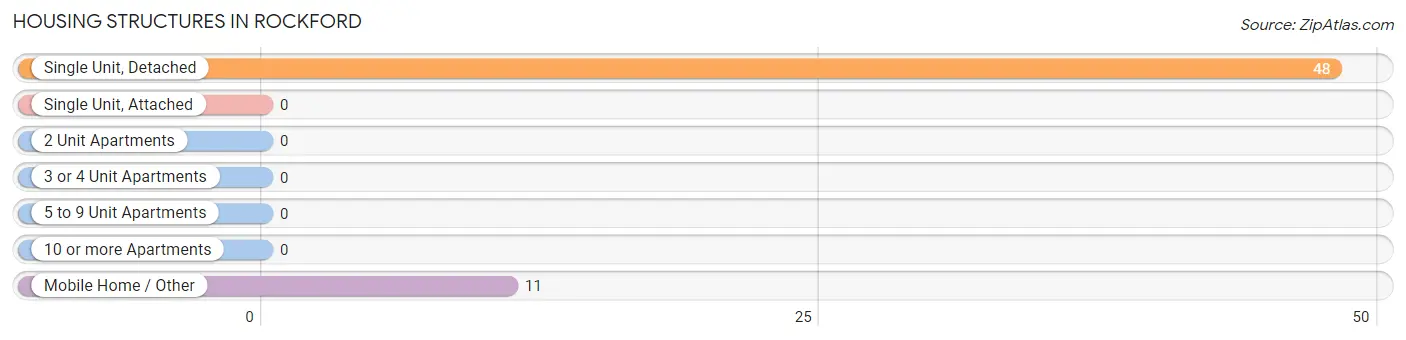
| Structure Type | # Housing Units | % Housing Units |
| Single Unit, Detached | 48 | 81.4% |
| Single Unit, Attached | 0 | 0.0% |
| 2 Unit Apartments | 0 | 0.0% |
| 3 or 4 Unit Apartments | 0 | 0.0% |
| 5 to 9 Unit Apartments | 0 | 0.0% |
| 10 or more Apartments | 0 | 0.0% |
| Mobile Home / Other | 11 | 18.6% |
| Total | 59 | 100.0% |
Housing Structures by Occupancy in Rockford
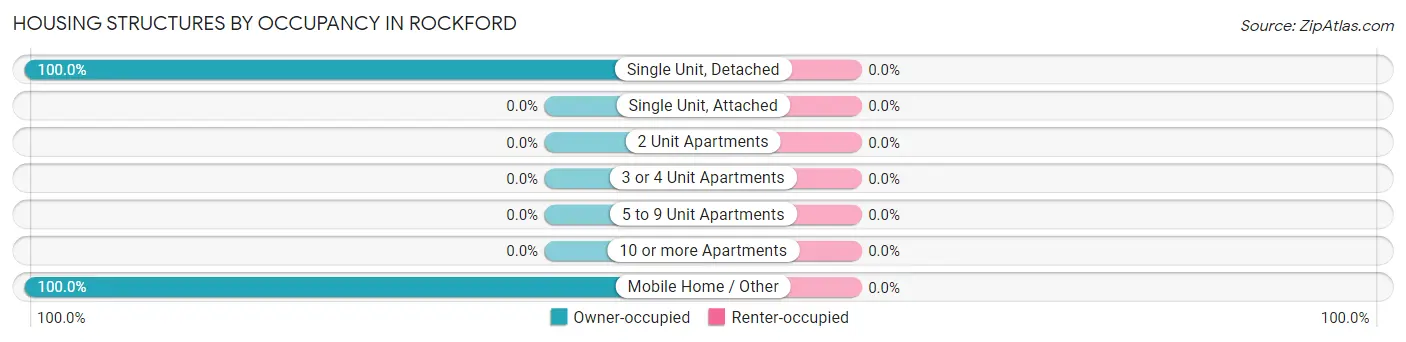
| Structure Type | Owner-occupied | Renter-occupied |
| Single Unit, Detached | 48 (100.0%) | 0 (0.0%) |
| Single Unit, Attached | 0 (0.0%) | 0 (0.0%) |
| 2 Unit Apartments | 0 (0.0%) | 0 (0.0%) |
| 3 or 4 Unit Apartments | 0 (0.0%) | 0 (0.0%) |
| 5 to 9 Unit Apartments | 0 (0.0%) | 0 (0.0%) |
| 10 or more Apartments | 0 (0.0%) | 0 (0.0%) |
| Mobile Home / Other | 11 (100.0%) | 0 (0.0%) |
| Total | 59 (100.0%) | 0 (0.0%) |
Housing Structures by Number of Rooms in Rockford
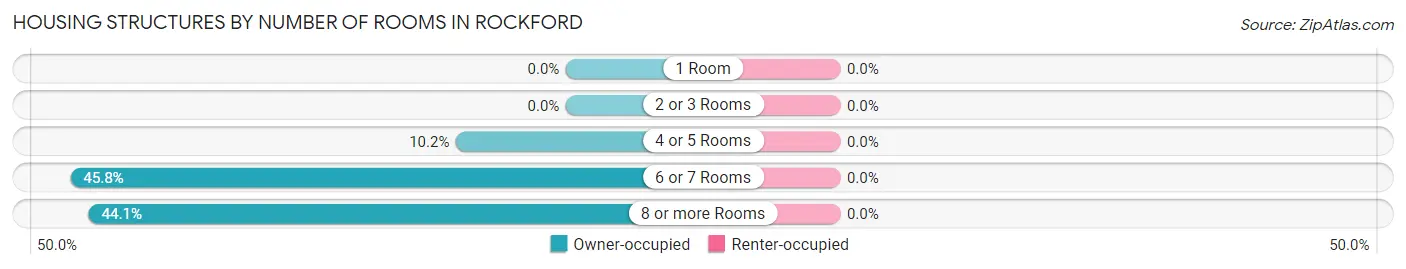
| Number of Rooms | Owner-occupied | Renter-occupied |
| 1 Room | 0 (0.0%) | 0 (0.0%) |
| 2 or 3 Rooms | 0 (0.0%) | 0 (0.0%) |
| 4 or 5 Rooms | 6 (10.2%) | 0 (0.0%) |
| 6 or 7 Rooms | 27 (45.8%) | 0 (0.0%) |
| 8 or more Rooms | 26 (44.1%) | 0 (0.0%) |
| Total | 59 (100.0%) | 0 (0.0%) |
Housing Structure by Heating Type in Rockford
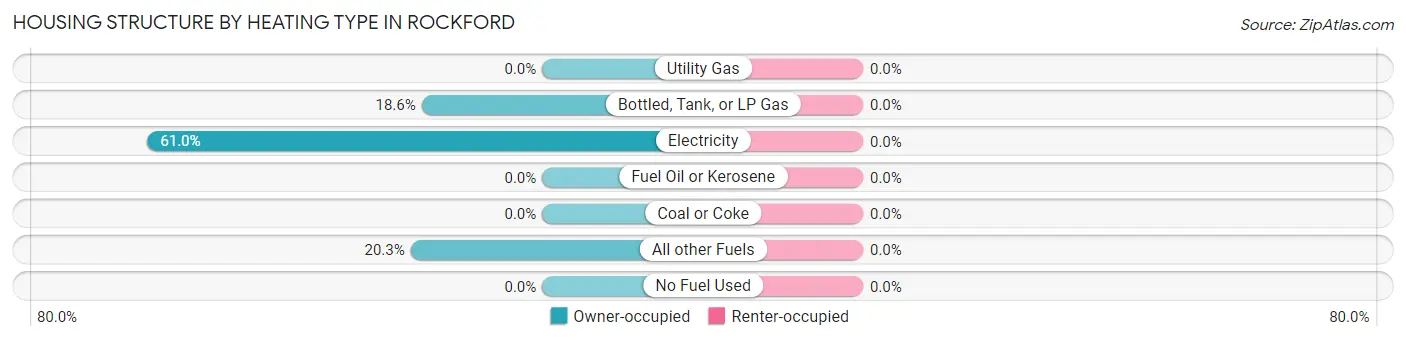
| Heating Type | Owner-occupied | Renter-occupied |
| Utility Gas | 0 (0.0%) | 0 (0.0%) |
| Bottled, Tank, or LP Gas | 11 (18.6%) | 0 (0.0%) |
| Electricity | 36 (61.0%) | 0 (0.0%) |
| Fuel Oil or Kerosene | 0 (0.0%) | 0 (0.0%) |
| Coal or Coke | 0 (0.0%) | 0 (0.0%) |
| All other Fuels | 12 (20.3%) | 0 (0.0%) |
| No Fuel Used | 0 (0.0%) | 0 (0.0%) |
| Total | 59 (100.0%) | 0 (0.0%) |
Household Vehicle Usage in Rockford
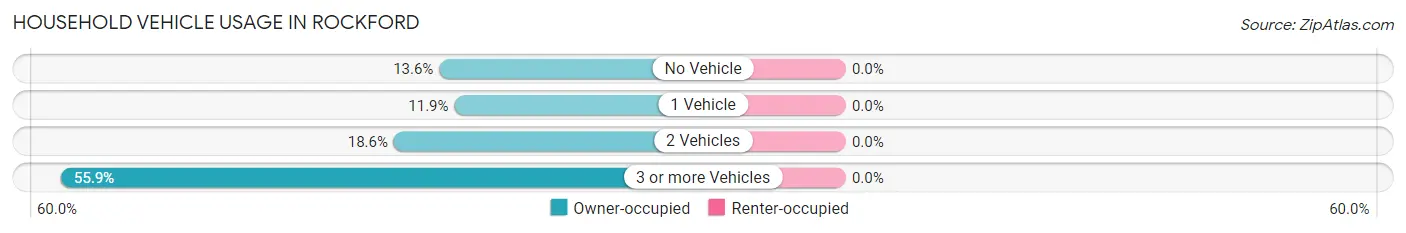
| Vehicles per Household | Owner-occupied | Renter-occupied |
| No Vehicle | 8 (13.6%) | 0 (0.0%) |
| 1 Vehicle | 7 (11.9%) | 0 (0.0%) |
| 2 Vehicles | 11 (18.6%) | 0 (0.0%) |
| 3 or more Vehicles | 33 (55.9%) | 0 (0.0%) |
| Total | 59 (100.0%) | 0 (0.0%) |
Real Estate & Mortgages in Rockford
Real Estate and Mortgage Overview in Rockford
| Characteristic | Without Mortgage | With Mortgage |
| Housing Units | 24 | 35 |
| Median Property Value | $161,400 | $312,500 |
| Median Household Income | $42,917 | $0 |
| Monthly Housing Costs | $323 | $0 |
| Real Estate Taxes | $1,417 | $0 |
Property Value by Mortgage Status in Rockford
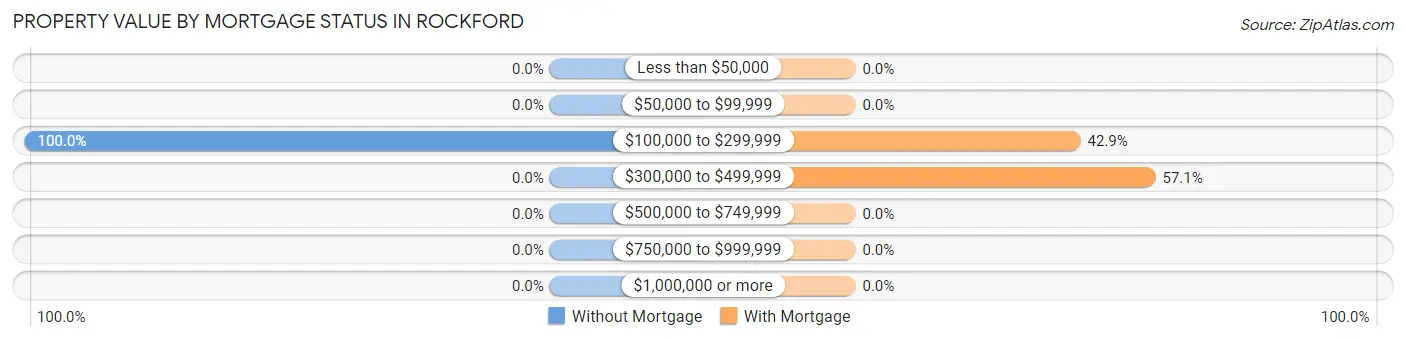
| Property Value | Without Mortgage | With Mortgage |
| Less than $50,000 | 0 (0.0%) | 0 (0.0%) |
| $50,000 to $99,999 | 0 (0.0%) | 0 (0.0%) |
| $100,000 to $299,999 | 24 (100.0%) | 15 (42.9%) |
| $300,000 to $499,999 | 0 (0.0%) | 20 (57.1%) |
| $500,000 to $749,999 | 0 (0.0%) | 0 (0.0%) |
| $750,000 to $999,999 | 0 (0.0%) | 0 (0.0%) |
| $1,000,000 or more | 0 (0.0%) | 0 (0.0%) |
| Total | 24 (100.0%) | 35 (100.0%) |
Household Income by Mortgage Status in Rockford
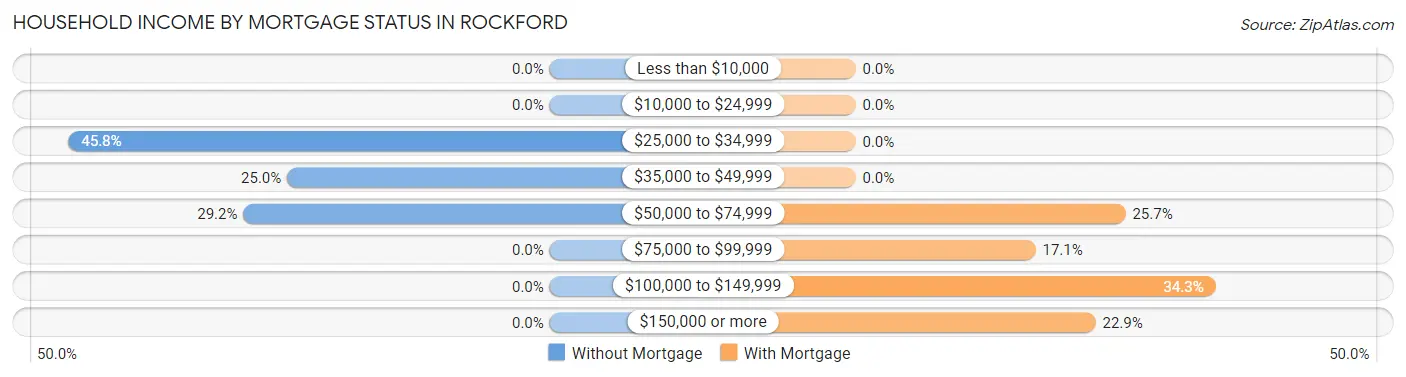
| Household Income | Without Mortgage | With Mortgage |
| Less than $10,000 | 0 (0.0%) | 0 (0.0%) |
| $10,000 to $24,999 | 0 (0.0%) | 0 (0.0%) |
| $25,000 to $34,999 | 11 (45.8%) | 0 (0.0%) |
| $35,000 to $49,999 | 6 (25.0%) | 0 (0.0%) |
| $50,000 to $74,999 | 7 (29.2%) | 9 (25.7%) |
| $75,000 to $99,999 | 0 (0.0%) | 6 (17.1%) |
| $100,000 to $149,999 | 0 (0.0%) | 12 (34.3%) |
| $150,000 or more | 0 (0.0%) | 8 (22.9%) |
| Total | 24 (100.0%) | 35 (100.0%) |
Property Value to Household Income Ratio in Rockford
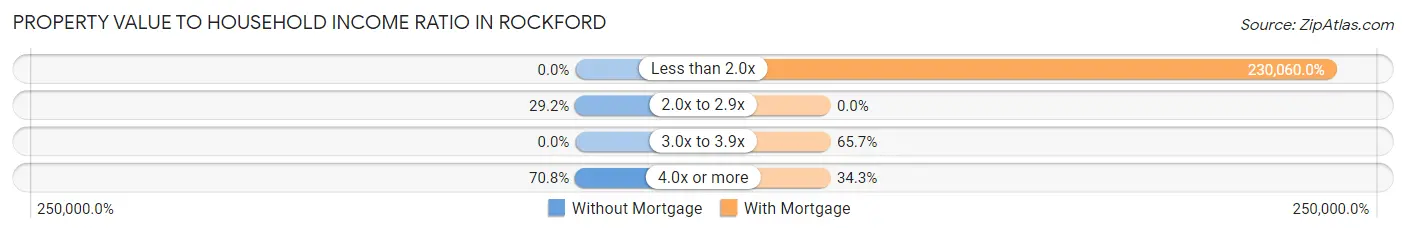
| Value-to-Income Ratio | Without Mortgage | With Mortgage |
| Less than 2.0x | 0 (0.0%) | 80,521 (230,060.0%) |
| 2.0x to 2.9x | 7 (29.2%) | 0 (0.0%) |
| 3.0x to 3.9x | 0 (0.0%) | 23 (65.7%) |
| 4.0x or more | 17 (70.8%) | 12 (34.3%) |
| Total | 24 (100.0%) | 35 (100.0%) |
Real Estate Taxes by Mortgage Status in Rockford
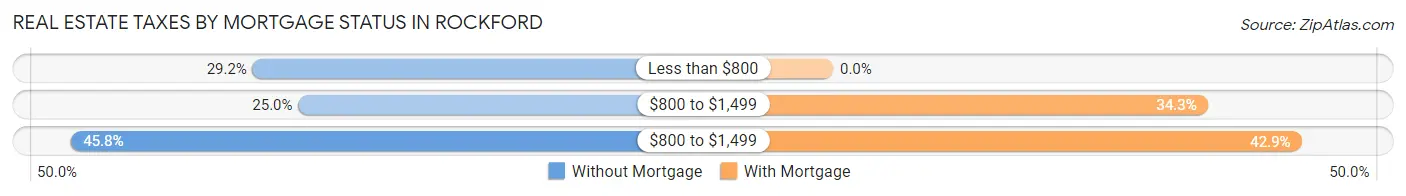
| Property Taxes | Without Mortgage | With Mortgage |
| Less than $800 | 7 (29.2%) | 0 (0.0%) |
| $800 to $1,499 | 6 (25.0%) | 12 (34.3%) |
| $800 to $1,499 | 11 (45.8%) | 15 (42.9%) |
| Total | 24 (100.0%) | 35 (100.0%) |
Health & Disability in Rockford
Health Insurance Coverage by Age in Rockford
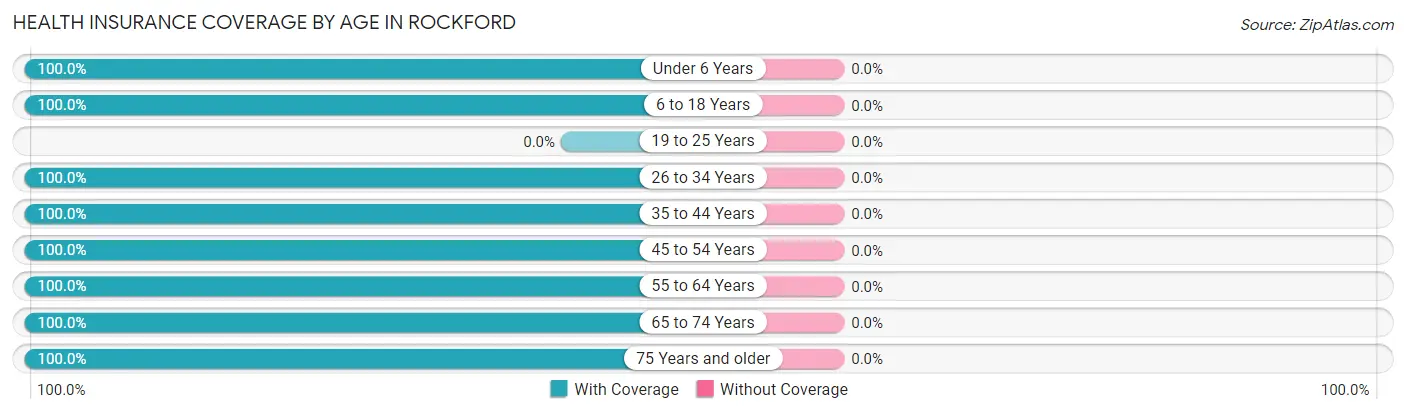
| Age Bracket | With Coverage | Without Coverage |
| Under 6 Years | 21 (100.0%) | 0 (0.0%) |
| 6 to 18 Years | 57 (100.0%) | 0 (0.0%) |
| 19 to 25 Years | 0 (0.0%) | 0 (0.0%) |
| 26 to 34 Years | 40 (100.0%) | 0 (0.0%) |
| 35 to 44 Years | 17 (100.0%) | 0 (0.0%) |
| 45 to 54 Years | 20 (100.0%) | 0 (0.0%) |
| 55 to 64 Years | 26 (100.0%) | 0 (0.0%) |
| 65 to 74 Years | 7 (100.0%) | 0 (0.0%) |
| 75 Years and older | 11 (100.0%) | 0 (0.0%) |
| Total | 199 (100.0%) | 0 (0.0%) |
Health Insurance Coverage by Citizenship Status in Rockford
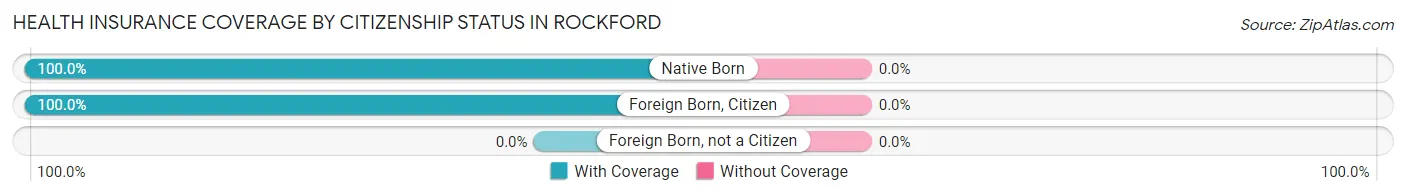
| Citizenship Status | With Coverage | Without Coverage |
| Native Born | 21 (100.0%) | 0 (0.0%) |
| Foreign Born, Citizen | 57 (100.0%) | 0 (0.0%) |
| Foreign Born, not a Citizen | 0 (0.0%) | 0 (0.0%) |
Health Insurance Coverage by Household Income in Rockford
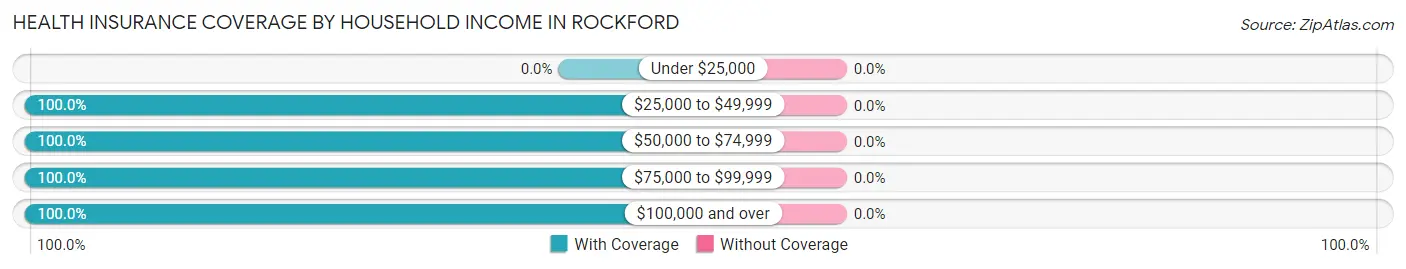
| Household Income | With Coverage | Without Coverage |
| Under $25,000 | 0 (0.0%) | 0 (0.0%) |
| $25,000 to $49,999 | 57 (100.0%) | 0 (0.0%) |
| $50,000 to $74,999 | 26 (100.0%) | 0 (0.0%) |
| $75,000 to $99,999 | 76 (100.0%) | 0 (0.0%) |
| $100,000 and over | 40 (100.0%) | 0 (0.0%) |
Public vs Private Health Insurance Coverage by Age in Rockford
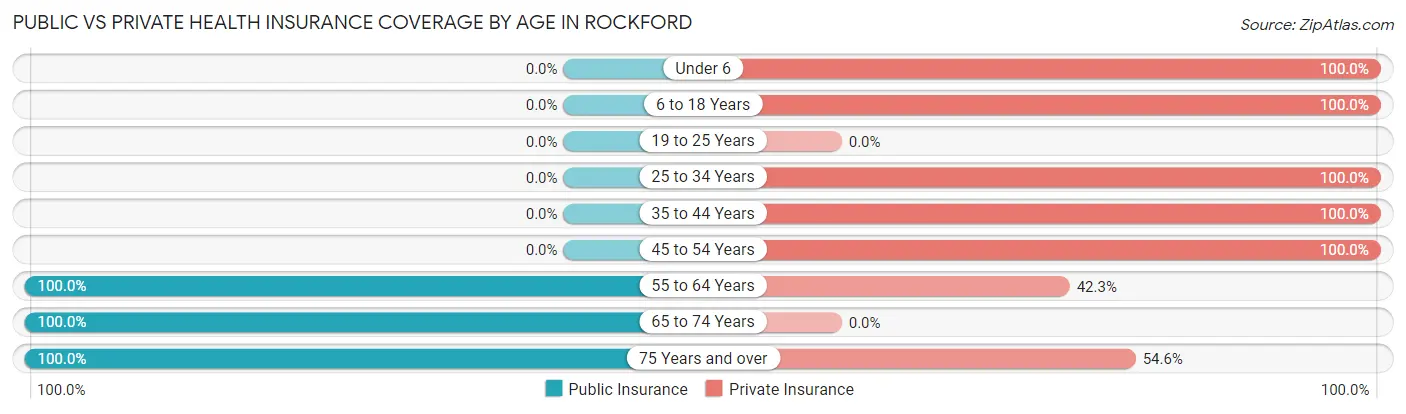
| Age Bracket | Public Insurance | Private Insurance |
| Under 6 | 0 (0.0%) | 21 (100.0%) |
| 6 to 18 Years | 0 (0.0%) | 57 (100.0%) |
| 19 to 25 Years | 0 (0.0%) | 0 (0.0%) |
| 25 to 34 Years | 0 (0.0%) | 40 (100.0%) |
| 35 to 44 Years | 0 (0.0%) | 17 (100.0%) |
| 45 to 54 Years | 0 (0.0%) | 20 (100.0%) |
| 55 to 64 Years | 26 (100.0%) | 11 (42.3%) |
| 65 to 74 Years | 7 (100.0%) | 0 (0.0%) |
| 75 Years and over | 11 (100.0%) | 6 (54.5%) |
| Total | 44 (22.1%) | 172 (86.4%) |
Disability Status by Sex by Age in Rockford
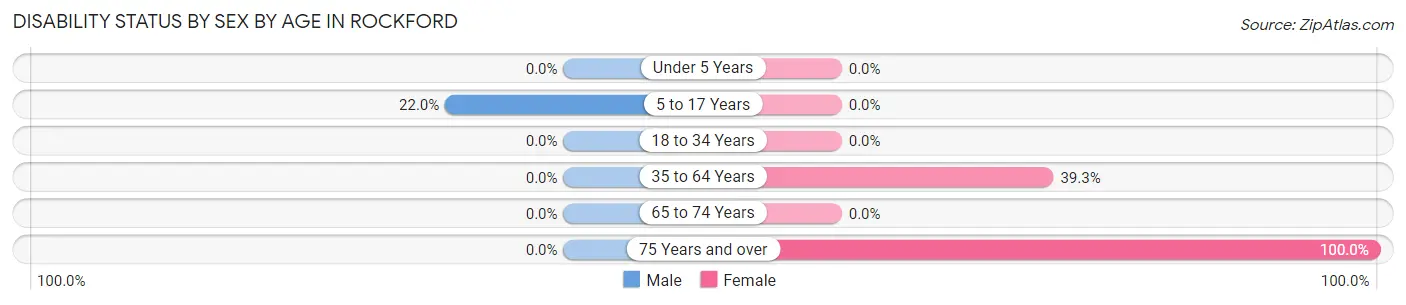
| Age Bracket | Male | Female |
| Under 5 Years | 0 (0.0%) | 0 (0.0%) |
| 5 to 17 Years | 9 (22.0%) | 0 (0.0%) |
| 18 to 34 Years | 0 (0.0%) | 0 (0.0%) |
| 35 to 64 Years | 0 (0.0%) | 11 (39.3%) |
| 65 to 74 Years | 0 (0.0%) | 0 (0.0%) |
| 75 Years and over | 0 (0.0%) | 5 (100.0%) |
Disability Class by Sex by Age in Rockford
Disability Class: Hearing Difficulty
| Age Bracket | Male | Female |
| Under 5 Years | 0 (0.0%) | 0 (0.0%) |
| 5 to 17 Years | 0 (0.0%) | 0 (0.0%) |
| 18 to 34 Years | 0 (0.0%) | 0 (0.0%) |
| 35 to 64 Years | 0 (0.0%) | 0 (0.0%) |
| 65 to 74 Years | 0 (0.0%) | 0 (0.0%) |
| 75 Years and over | 0 (0.0%) | 0 (0.0%) |
Disability Class: Vision Difficulty
| Age Bracket | Male | Female |
| Under 5 Years | 0 (0.0%) | 0 (0.0%) |
| 5 to 17 Years | 0 (0.0%) | 0 (0.0%) |
| 18 to 34 Years | 0 (0.0%) | 0 (0.0%) |
| 35 to 64 Years | 0 (0.0%) | 0 (0.0%) |
| 65 to 74 Years | 0 (0.0%) | 0 (0.0%) |
| 75 Years and over | 0 (0.0%) | 0 (0.0%) |
Disability Class: Cognitive Difficulty
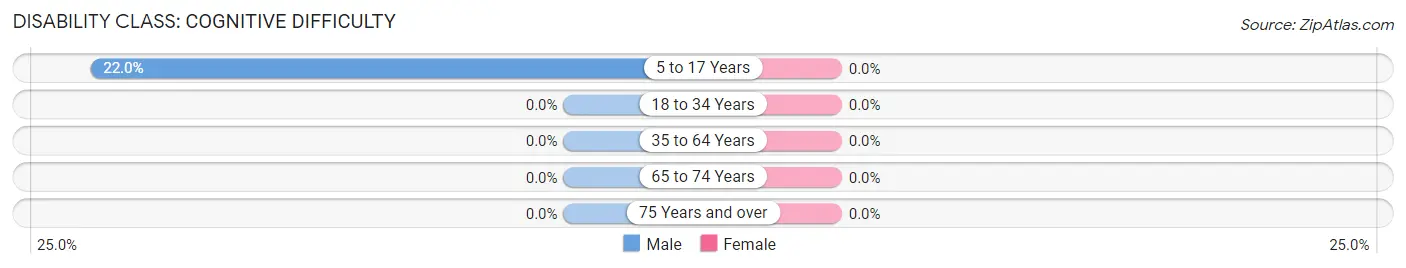
| Age Bracket | Male | Female |
| 5 to 17 Years | 9 (22.0%) | 0 (0.0%) |
| 18 to 34 Years | 0 (0.0%) | 0 (0.0%) |
| 35 to 64 Years | 0 (0.0%) | 0 (0.0%) |
| 65 to 74 Years | 0 (0.0%) | 0 (0.0%) |
| 75 Years and over | 0 (0.0%) | 0 (0.0%) |
Disability Class: Ambulatory Difficulty
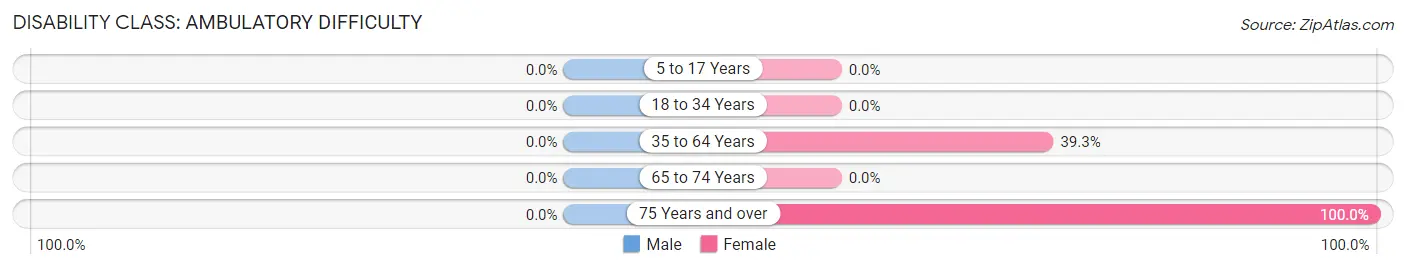
| Age Bracket | Male | Female |
| 5 to 17 Years | 0 (0.0%) | 0 (0.0%) |
| 18 to 34 Years | 0 (0.0%) | 0 (0.0%) |
| 35 to 64 Years | 0 (0.0%) | 11 (39.3%) |
| 65 to 74 Years | 0 (0.0%) | 0 (0.0%) |
| 75 Years and over | 0 (0.0%) | 5 (100.0%) |
Disability Class: Self-Care Difficulty
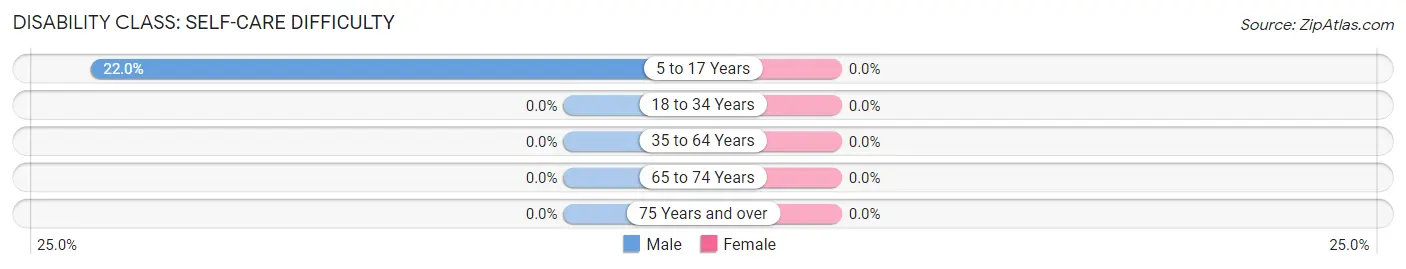
| Age Bracket | Male | Female |
| 5 to 17 Years | 9 (22.0%) | 0 (0.0%) |
| 18 to 34 Years | 0 (0.0%) | 0 (0.0%) |
| 35 to 64 Years | 0 (0.0%) | 0 (0.0%) |
| 65 to 74 Years | 0 (0.0%) | 0 (0.0%) |
| 75 Years and over | 0 (0.0%) | 0 (0.0%) |
Technology Access in Rockford
Computing Device Access in Rockford
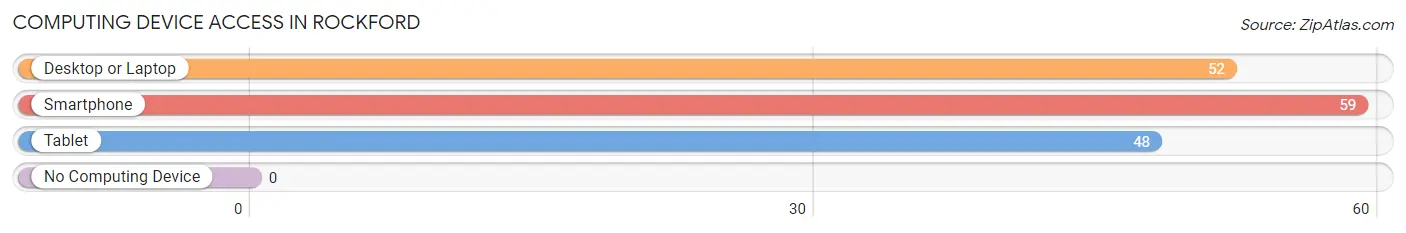
| Device Type | # Households | % Households |
| Desktop or Laptop | 52 | 88.1% |
| Smartphone | 59 | 100.0% |
| Tablet | 48 | 81.4% |
| No Computing Device | 0 | 0.0% |
| Total | 59 | 100.0% |
Internet Access in Rockford
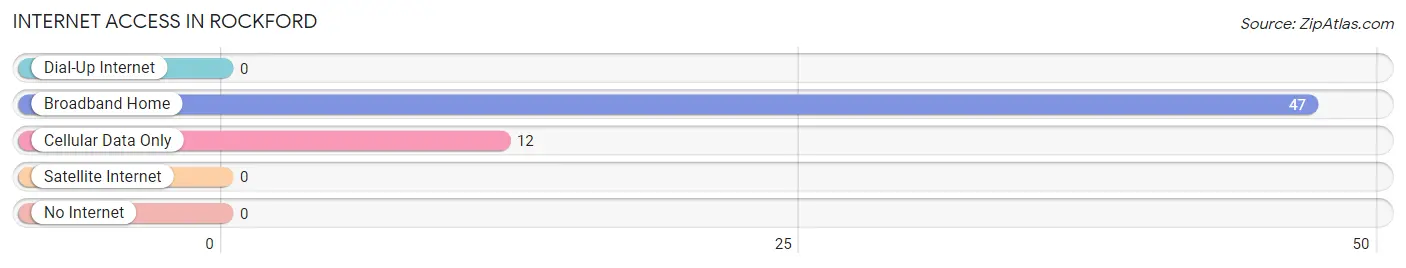
| Internet Type | # Households | % Households |
| Dial-Up Internet | 0 | 0.0% |
| Broadband Home | 47 | 79.7% |
| Cellular Data Only | 12 | 20.3% |
| Satellite Internet | 0 | 0.0% |
| No Internet | 0 | 0.0% |
| Total | 59 | 100.0% |
Rockford Summary
Rockford, Idaho is a small city located in the northern part of the state, in the county of Kootenai. It is situated on the banks of the Coeur d'Alene River, and is surrounded by the Coeur d'Alene National Forest. The city has a population of approximately 1,500 people, and is the county seat of Kootenai County.
History
Rockford was first settled in the late 1800s by a group of miners who were looking for gold in the area. The town was originally called "Rockford Gulch" and was located on the banks of the Coeur d'Alene River. The miners found gold in the area, and the town quickly grew in size. In 1891, the town was officially incorporated as Rockford.
In the early 1900s, the town was a bustling center of commerce and industry. The town was home to several sawmills, a flour mill, a brickyard, and a number of other businesses. The town also had a railroad station, which connected it to the rest of the state.
In the 1920s, the town began to decline as the mining industry in the area began to decline. The town was hit hard by the Great Depression, and many of the businesses in the town closed. The town was also hit hard by a series of floods in the 1940s and 1950s, which caused significant damage to the town.
In the late 1950s, the town began to experience a resurgence as the timber industry in the area began to grow. The town was also home to a number of logging camps, which provided employment for many of the town's residents.
Geography
Rockford is located in the northern part of Idaho, in the county of Kootenai. The city is situated on the banks of the Coeur d'Alene River, and is surrounded by the Coeur d'Alene National Forest. The city has a total area of 1.3 square miles, all of which is land.
The city has a humid continental climate, with cold winters and warm summers. The average annual temperature is 44 degrees Fahrenheit, and the average annual precipitation is 22 inches.
Economy
The economy of Rockford is largely based on the timber industry. The city is home to several sawmills, and the surrounding area is home to a number of logging camps. The city is also home to a number of small businesses, including restaurants, retail stores, and other services.
Demographics
As of the 2010 census, the population of Rockford was 1,500. The racial makeup of the city was 95.3% White, 0.7% Native American, 0.3% Asian, 0.2% African American, and 3.5% from other races. The median household income was $35,000, and the median family income was $41,000. The per capita income was $17,000.
Common Questions
What is Per Capita Income in Rockford?
Per Capita income in Rockford is $20,068.
What is the Median Family Income in Rockford?
Median Family Income in Rockford is $60,000.
What is the Median Household income in Rockford?
Median Household Income in Rockford is $56,250.
What is Inequality or Gini Index in Rockford?
Inequality or Gini Index in Rockford is 0.23.
What is the Total Population of Rockford?
Total Population of Rockford is 199.
What is the Total Male Population of Rockford?
Total Male Population of Rockford is 121.
What is the Total Female Population of Rockford?
Total Female Population of Rockford is 78.
What is the Ratio of Males per 100 Females in Rockford?
There are 155.13 Males per 100 Females in Rockford.
What is the Ratio of Females per 100 Males in Rockford?
There are 64.46 Females per 100 Males in Rockford.
What is the Median Population Age in Rockford?
Median Population Age in Rockford is 32.6 Years.
What is the Average Family Size in Rockford
Average Family Size in Rockford is 3.7 People.
What is the Average Household Size in Rockford
Average Household Size in Rockford is 3.4 People.
How Large is the Labor Force in Rockford?
There are 61 People in the Labor Forcein in Rockford.
What is the Percentage of People in the Labor Force in Rockford?
50.4% of People are in the Labor Force in Rockford.