Zip Codes with the Highest Percentage of Households Heated by Bottled Gas / Liquid Propane in Newark, DE
RELATED REPORTS & OPTIONS
Bottled Gas / LP Heating
Newark
Compare Zip Codes
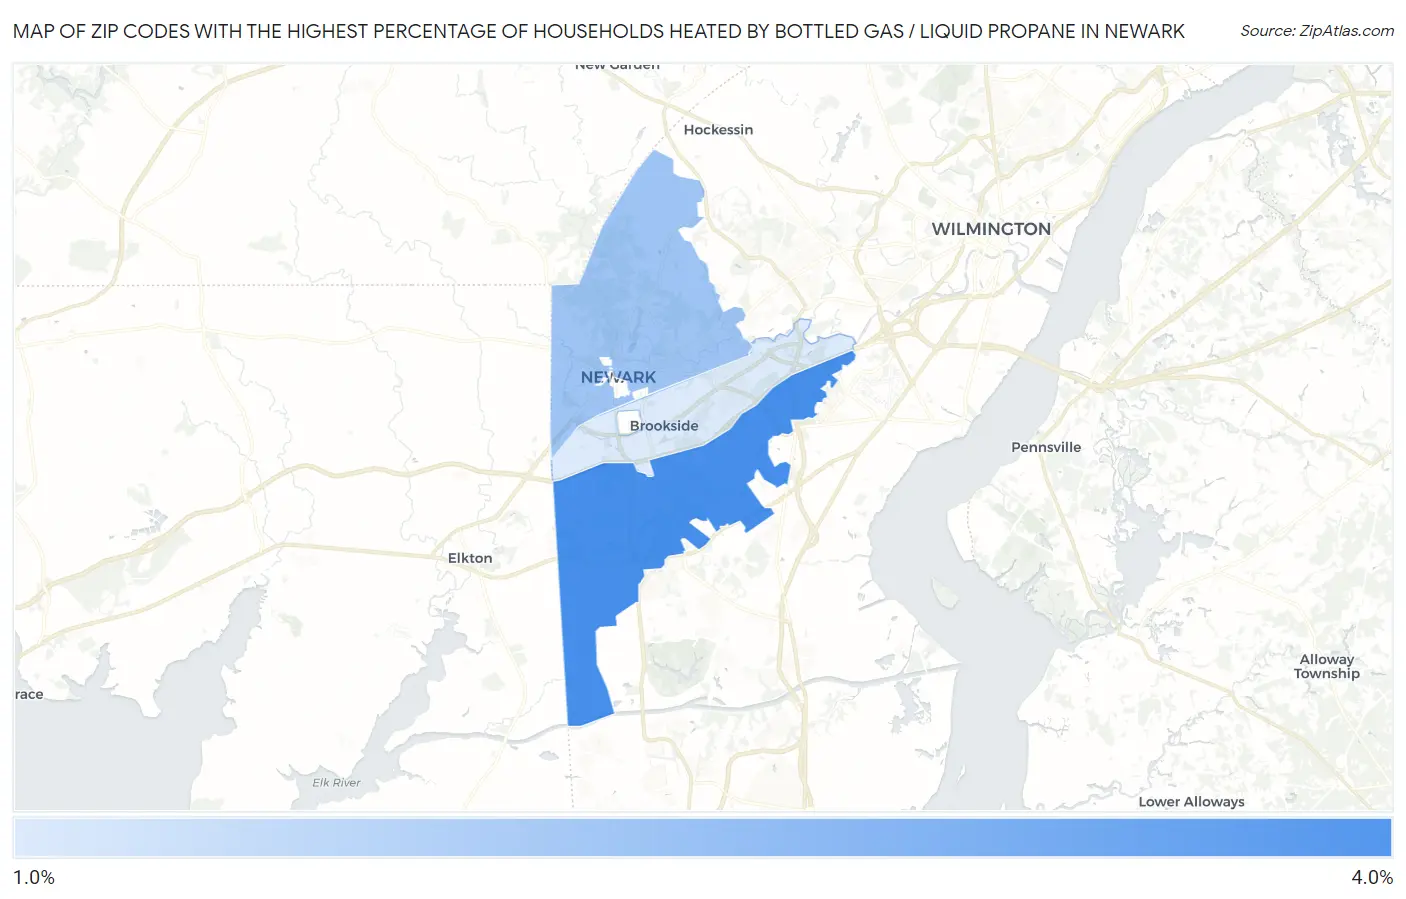
Map of Zip Codes with the Highest Percentage of Households Heated by Bottled Gas / Liquid Propane in Newark
1.9%
3.6%
Zip Codes with the Highest Percentage of Households Heated by Bottled Gas / Liquid Propane in Newark, DE
| Zip Code | Bottled Gas / LP Heating | vs State | vs National | |
| 1. | 19702 | 3.6% | 9.2%(-5.60)#45 | 4.9%(-1.30)#20,081 |
| 2. | 19711 | 2.6% | 9.2%(-6.60)#50 | 4.9%(-2.30)#21,693 |
| 3. | 19713 | 1.9% | 9.2%(-7.30)#54 | 4.9%(-3.00)#23,459 |
1
Common Questions
What are the Top Zip Codes with the Highest Percentage of Households Heated by Bottled Gas / Liquid Propane in Newark, DE?
Top Zip Codes with the Highest Percentage of Households Heated by Bottled Gas / Liquid Propane in Newark, DE are:
What zip code has the Highest Percentage of Households Heated by Bottled Gas / Liquid Propane in Newark, DE?
19702 has the Highest Percentage of Households Heated by Bottled Gas / Liquid Propane in Newark, DE with 3.6%.
What is the Percentage of Households Heated by Bottled Gas / Liquid Propane in Newark, DE?
Percentage of Households Heated by Bottled Gas / Liquid Propane in Newark is 2.1%.
What is the Percentage of Households Heated by Bottled Gas / Liquid Propane in Delaware?
Percentage of Households Heated by Bottled Gas / Liquid Propane in Delaware is 9.2%.
What is the Percentage of Households Heated by Bottled Gas / Liquid Propane in the United States?
Percentage of Households Heated by Bottled Gas / Liquid Propane in the United States is 4.9%.