Zip Codes with the Highest Percentage of Population Employed in Production in Littleton, CO
RELATED REPORTS & OPTIONS
Production
Littleton
Compare Zip Codes
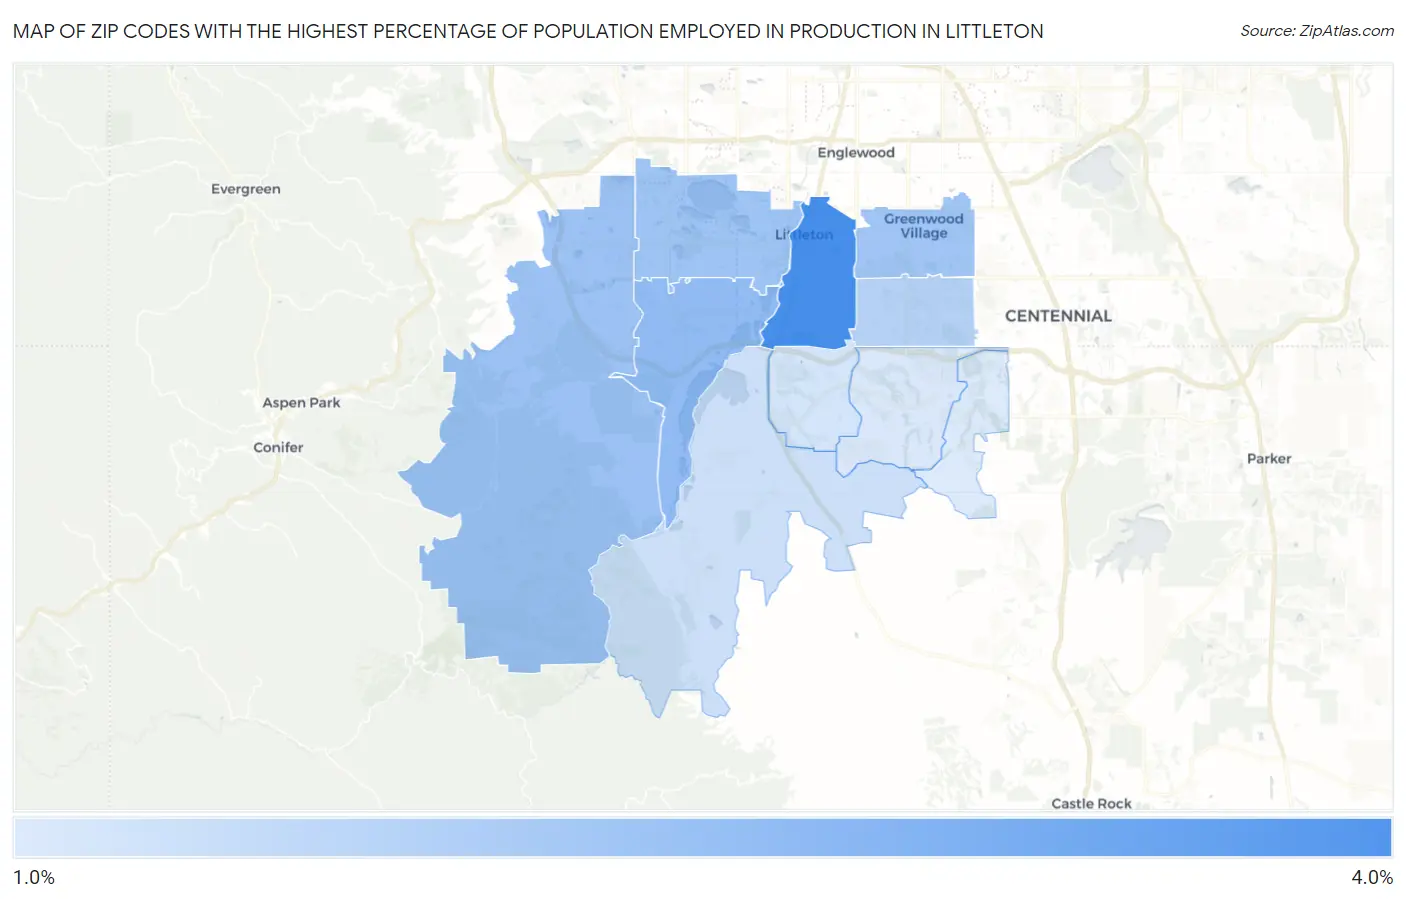
Map of Zip Codes with the Highest Percentage of Population Employed in Production in Littleton
1.8%
4.0%
Zip Codes with the Highest Percentage of Population Employed in Production in Littleton, CO
| Zip Code | % Employed | vs State | vs National | |
| 1. | 80120 | 4.0% | 3.6%(+0.390)#169 | 5.5%(-1.52)#20,486 |
| 2. | 80128 | 2.9% | 3.6%(-0.669)#236 | 5.5%(-2.57)#23,346 |
| 3. | 80127 | 2.7% | 3.6%(-0.823)#248 | 5.5%(-2.73)#23,768 |
| 4. | 80123 | 2.7% | 3.6%(-0.871)#251 | 5.5%(-2.78)#23,896 |
| 5. | 80121 | 2.7% | 3.6%(-0.907)#253 | 5.5%(-2.81)#23,989 |
| 6. | 80122 | 2.3% | 3.6%(-1.22)#281 | 5.5%(-3.13)#24,894 |
| 7. | 80125 | 2.0% | 3.6%(-1.53)#298 | 5.5%(-3.43)#25,686 |
| 8. | 80129 | 1.9% | 3.6%(-1.63)#308 | 5.5%(-3.54)#25,934 |
| 9. | 80126 | 1.8% | 3.6%(-1.74)#316 | 5.5%(-3.65)#26,207 |
| 10. | 80130 | 1.8% | 3.6%(-1.77)#322 | 5.5%(-3.68)#26,301 |
1
Common Questions
What are the Top 5 Zip Codes with the Highest Percentage of Population Employed in Production in Littleton, CO?
Top 5 Zip Codes with the Highest Percentage of Population Employed in Production in Littleton, CO are:
What zip code has the Highest Percentage of Population Employed in Production in Littleton, CO?
80120 has the Highest Percentage of Population Employed in Production in Littleton, CO with 4.0%.
What is the Percentage of Population Employed in Production in Littleton, CO?
Percentage of Population Employed in Production in Littleton is 3.6%.
What is the Percentage of Population Employed in Production in Colorado?
Percentage of Population Employed in Production in Colorado is 3.6%.
What is the Percentage of Population Employed in Production in the United States?
Percentage of Population Employed in Production in the United States is 5.5%.