Zip Codes with the Highest Percentage of Population Employed in Administrative & Support Services in Tucson, AZ
RELATED REPORTS & OPTIONS
Administrative & Support Services
Tucson
Compare Zip Codes
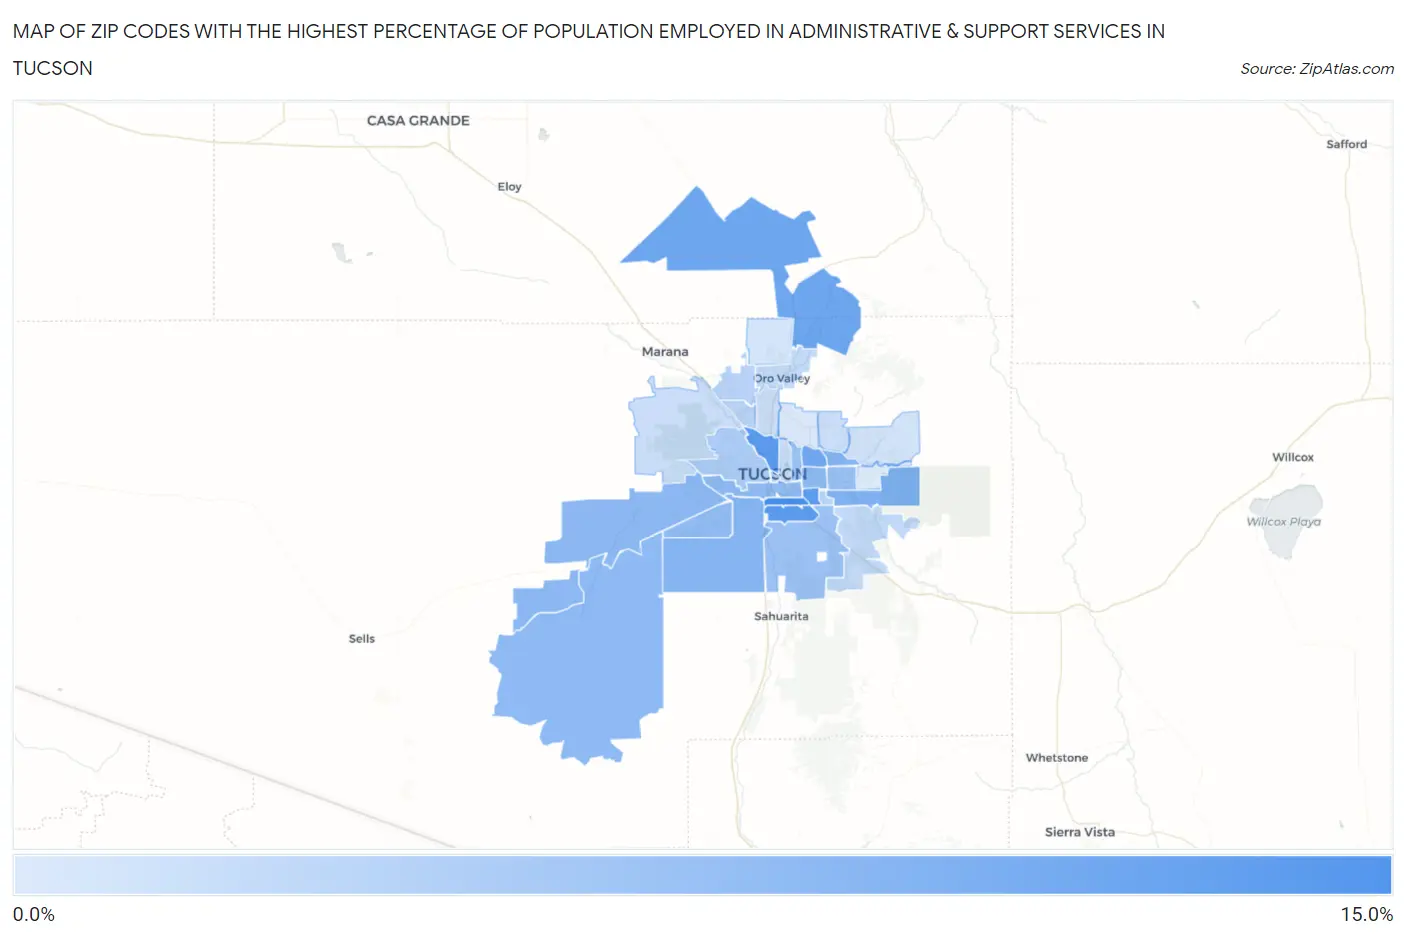
Map of Zip Codes with the Highest Percentage of Population Employed in Administrative & Support Services in Tucson
2.2%
10.9%
Zip Codes with the Highest Percentage of Population Employed in Administrative & Support Services in Tucson, AZ
| Zip Code | % Employed | vs State | vs National | |
| 1. | 85714 | 10.9% | 5.4%(+5.50)#15 | 4.1%(+6.70)#1,059 |
| 2. | 85707 | 9.8% | 5.4%(+4.40)#25 | 4.1%(+5.61)#1,372 |
| 3. | 85705 | 9.7% | 5.4%(+4.32)#29 | 4.1%(+5.52)#1,409 |
| 4. | 85706 | 9.7% | 5.4%(+4.31)#30 | 4.1%(+5.51)#1,411 |
| 5. | 85739 | 8.5% | 5.4%(+3.16)#45 | 4.1%(+4.37)#1,958 |
| 6. | 85712 | 8.4% | 5.4%(+3.04)#46 | 4.1%(+4.24)#2,032 |
| 7. | 85730 | 7.4% | 5.4%(+2.01)#62 | 4.1%(+3.21)#2,829 |
| 8. | 85715 | 7.3% | 5.4%(+1.99)#63 | 4.1%(+3.19)#2,846 |
| 9. | 85746 | 7.2% | 5.4%(+1.83)#69 | 4.1%(+3.04)#2,994 |
| 10. | 85735 | 6.7% | 5.4%(+1.38)#82 | 4.1%(+2.59)#3,564 |
| 11. | 85711 | 6.7% | 5.4%(+1.38)#83 | 4.1%(+2.59)#3,567 |
| 12. | 85736 | 6.7% | 5.4%(+1.33)#86 | 4.1%(+2.53)#3,649 |
| 13. | 85713 | 6.5% | 5.4%(+1.11)#89 | 4.1%(+2.31)#3,967 |
| 14. | 85757 | 6.4% | 5.4%(+1.09)#92 | 4.1%(+2.29)#4,003 |
| 15. | 85710 | 6.1% | 5.4%(+0.745)#105 | 4.1%(+1.95)#4,593 |
| 16. | 85756 | 6.0% | 5.4%(+0.621)#113 | 4.1%(+1.83)#4,834 |
| 17. | 85716 | 5.8% | 5.4%(+0.412)#120 | 4.1%(+1.62)#5,231 |
| 18. | 85745 | 4.8% | 5.4%(-0.514)#153 | 4.1%(+0.691)#7,596 |
| 19. | 85701 | 4.3% | 5.4%(-1.03)#182 | 4.1%(+0.178)#9,353 |
| 20. | 85741 | 4.3% | 5.4%(-1.09)#184 | 4.1%(+0.115)#9,575 |
| 21. | 85708 | 4.2% | 5.4%(-1.16)#188 | 4.1%(+0.041)#9,862 |
| 22. | 85742 | 4.2% | 5.4%(-1.17)#189 | 4.1%(+0.039)#9,870 |
| 23. | 85747 | 3.7% | 5.4%(-1.70)#224 | 4.1%(-0.492)#12,201 |
| 24. | 85737 | 3.6% | 5.4%(-1.72)#226 | 4.1%(-0.513)#12,289 |
| 25. | 85719 | 3.3% | 5.4%(-2.07)#242 | 4.1%(-0.861)#14,005 |
| 26. | 85704 | 3.2% | 5.4%(-2.14)#244 | 4.1%(-0.939)#14,411 |
| 27. | 85743 | 3.2% | 5.4%(-2.16)#245 | 4.1%(-0.956)#14,505 |
| 28. | 85750 | 3.2% | 5.4%(-2.20)#249 | 4.1%(-0.998)#14,734 |
| 29. | 85749 | 2.8% | 5.4%(-2.53)#262 | 4.1%(-1.32)#16,380 |
| 30. | 85755 | 2.7% | 5.4%(-2.69)#271 | 4.1%(-1.49)#17,287 |
| 31. | 85718 | 2.4% | 5.4%(-2.92)#280 | 4.1%(-1.71)#18,456 |
| 32. | 85748 | 2.2% | 5.4%(-3.18)#289 | 4.1%(-1.98)#19,800 |
1
Common Questions
What are the Top 10 Zip Codes with the Highest Percentage of Population Employed in Administrative & Support Services in Tucson, AZ?
Top 10 Zip Codes with the Highest Percentage of Population Employed in Administrative & Support Services in Tucson, AZ are:
What zip code has the Highest Percentage of Population Employed in Administrative & Support Services in Tucson, AZ?
85714 has the Highest Percentage of Population Employed in Administrative & Support Services in Tucson, AZ with 10.9%.
What is the Percentage of Population Employed in Administrative & Support Services in Tucson, AZ?
Percentage of Population Employed in Administrative & Support Services in Tucson is 6.3%.
What is the Percentage of Population Employed in Administrative & Support Services in Arizona?
Percentage of Population Employed in Administrative & Support Services in Arizona is 5.4%.
What is the Percentage of Population Employed in Administrative & Support Services in the United States?
Percentage of Population Employed in Administrative & Support Services in the United States is 4.1%.