Drexel Heights, AZ Map & Demographics
Drexel Heights Map
Drexel Heights Overview
$27,115
PER CAPITA INCOME
$75,725
AVG FAMILY INCOME
$72,567
AVG HOUSEHOLD INCOME
25.2%
WAGE / INCOME GAP [ % ]
74.8¢/ $1
WAGE / INCOME GAP [ $ ]
$15,279
FAMILY INCOME DEFICIT
0.39
INEQUALITY / GINI INDEX
30,254
TOTAL POPULATION
14,812
MALE POPULATION
15,442
FEMALE POPULATION
95.92
MALES / 100 FEMALES
104.25
FEMALES / 100 MALES
35.7
MEDIAN AGE
3.4
AVG FAMILY SIZE
3.1
AVG HOUSEHOLD SIZE
14,443
LABOR FORCE [ PEOPLE ]
61.2%
PERCENT IN LABOR FORCE
4.7%
UNEMPLOYMENT RATE
Income in Drexel Heights
Income Overview in Drexel Heights
Per Capita Income in Drexel Heights is $27,115, while median incomes of families and households are $75,725 and $72,567 respectively.
| Characteristic | Number | Measure |
| Per Capita Income | 30,254 | $27,115 |
| Median Family Income | 7,605 | $75,725 |
| Mean Family Income | 7,605 | $84,551 |
| Median Household Income | 9,796 | $72,567 |
| Mean Household Income | 9,796 | $81,600 |
| Income Deficit | 7,605 | $15,279 |
| Wage / Income Gap (%) | 30,254 | 25.24% |
| Wage / Income Gap ($) | 30,254 | 74.76¢ per $1 |
| Gini / Inequality Index | 30,254 | 0.39 |
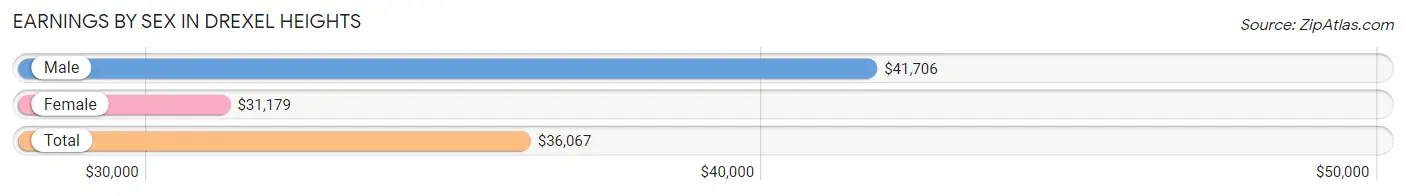
Earnings by Sex in Drexel Heights
Average Earnings in Drexel Heights are $36,067, $41,706 for men and $31,179 for women, a difference of 25.2%.
| Sex | Number | Average Earnings |
| Male | 8,338 (55.2%) | $41,706 |
| Female | 6,778 (44.8%) | $31,179 |
| Total | 15,116 (100.0%) | $36,067 |
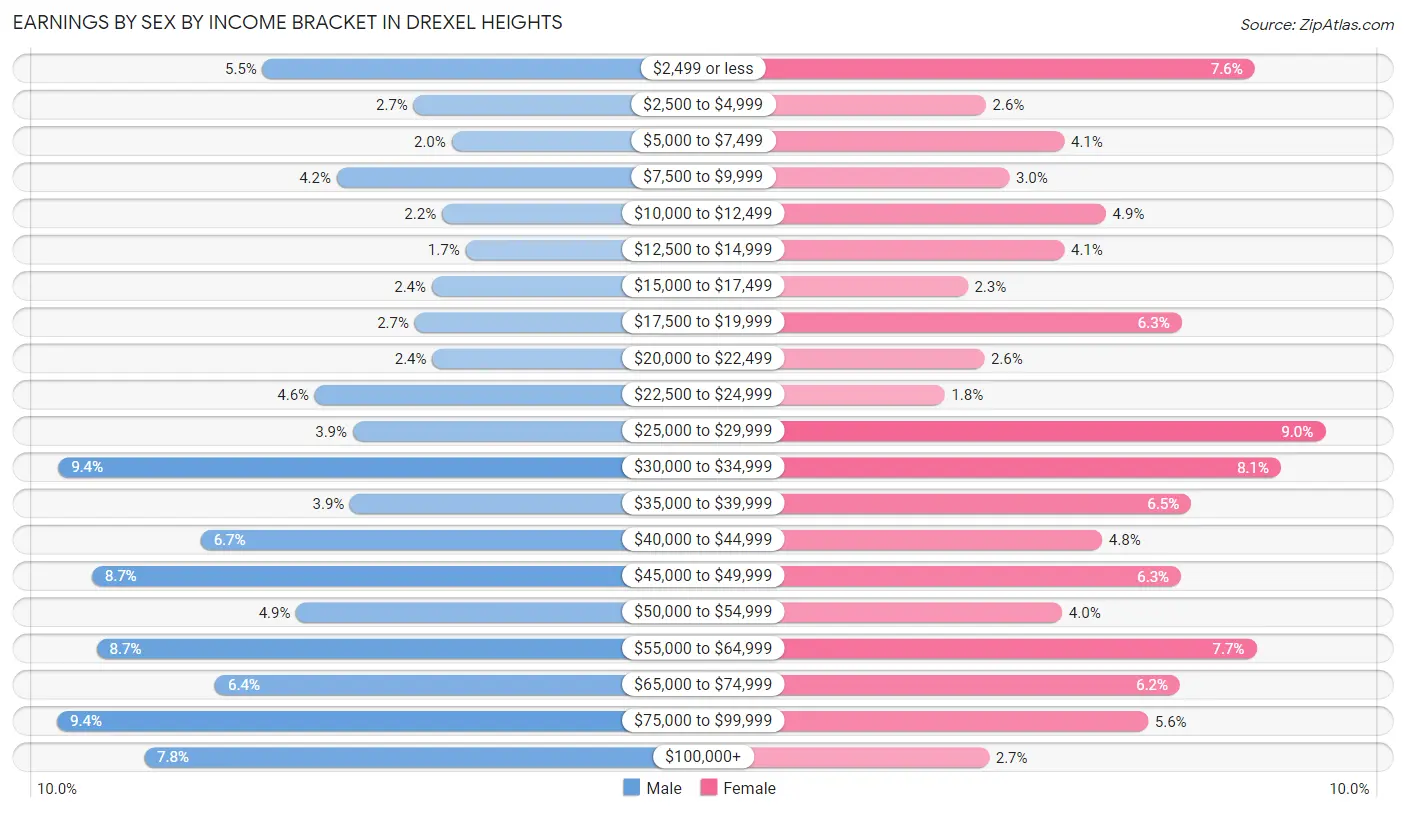
Earnings by Sex by Income Bracket in Drexel Heights
The most common earnings brackets in Drexel Heights are $75,000 to $99,999 for men (783 | 9.4%) and $25,000 to $29,999 for women (607 | 9.0%).
| Income | Male | Female |
| $2,499 or less | 462 (5.5%) | 518 (7.6%) |
| $2,500 to $4,999 | 226 (2.7%) | 176 (2.6%) |
| $5,000 to $7,499 | 167 (2.0%) | 276 (4.1%) |
| $7,500 to $9,999 | 346 (4.2%) | 206 (3.0%) |
| $10,000 to $12,499 | 182 (2.2%) | 329 (4.9%) |
| $12,500 to $14,999 | 145 (1.7%) | 276 (4.1%) |
| $15,000 to $17,499 | 198 (2.4%) | 153 (2.3%) |
| $17,500 to $19,999 | 224 (2.7%) | 425 (6.3%) |
| $20,000 to $22,499 | 197 (2.4%) | 174 (2.6%) |
| $22,500 to $24,999 | 380 (4.6%) | 124 (1.8%) |
| $25,000 to $29,999 | 321 (3.8%) | 607 (9.0%) |
| $30,000 to $34,999 | 781 (9.4%) | 551 (8.1%) |
| $35,000 to $39,999 | 325 (3.9%) | 437 (6.5%) |
| $40,000 to $44,999 | 559 (6.7%) | 324 (4.8%) |
| $45,000 to $49,999 | 729 (8.7%) | 424 (6.3%) |
| $50,000 to $54,999 | 409 (4.9%) | 273 (4.0%) |
| $55,000 to $64,999 | 721 (8.6%) | 520 (7.7%) |
| $65,000 to $74,999 | 536 (6.4%) | 423 (6.2%) |
| $75,000 to $99,999 | 783 (9.4%) | 382 (5.6%) |
| $100,000+ | 647 (7.8%) | 180 (2.7%) |
| Total | 8,338 (100.0%) | 6,778 (100.0%) |
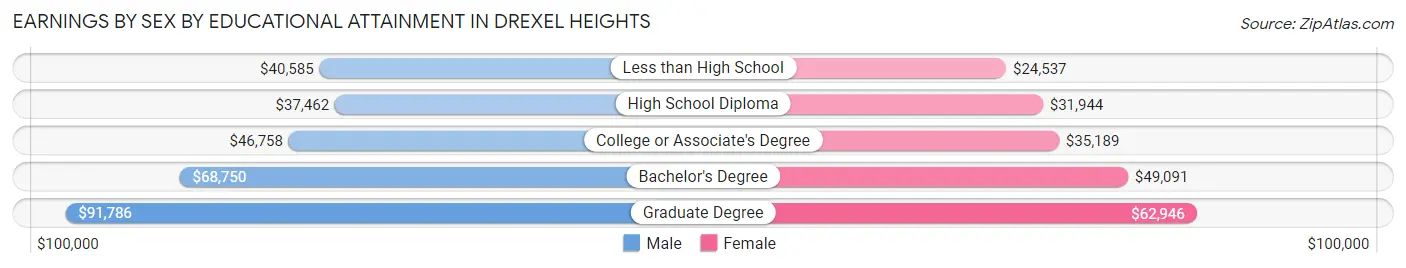
Earnings by Sex by Educational Attainment in Drexel Heights
Average earnings in Drexel Heights are $45,982 for men and $35,964 for women, a difference of 21.8%. Men with an educational attainment of graduate degree enjoy the highest average annual earnings of $91,786, while those with high school diploma education earn the least with $37,462. Women with an educational attainment of graduate degree earn the most with the average annual earnings of $62,946, while those with less than high school education have the smallest earnings of $24,537.
| Educational Attainment | Male Income | Female Income |
| Less than High School | $40,585 | $24,537 |
| High School Diploma | $37,462 | $31,944 |
| College or Associate's Degree | $46,758 | $35,189 |
| Bachelor's Degree | $68,750 | $49,091 |
| Graduate Degree | $91,786 | $62,946 |
| Total | $45,982 | $35,964 |
Family Income in Drexel Heights
Family Income Brackets in Drexel Heights
According to the Drexel Heights family income data, there are 1,627 families falling into the $100,000 to $149,999 income range, which is the most common income bracket and makes up 21.4% of all families. Conversely, the $10,000 to $14,999 income bracket is the least frequent group with only 198 families (2.6%) belonging to this category.
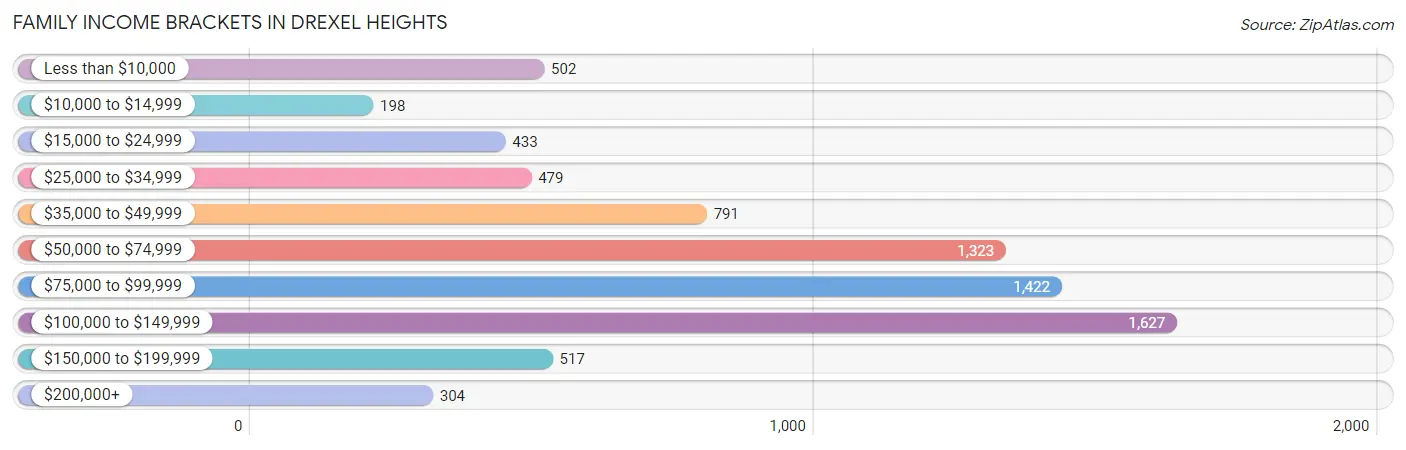
| Income Bracket | # Families | % Families |
| Less than $10,000 | 502 | 6.6% |
| $10,000 to $14,999 | 198 | 2.6% |
| $15,000 to $24,999 | 433 | 5.7% |
| $25,000 to $34,999 | 479 | 6.3% |
| $35,000 to $49,999 | 791 | 10.4% |
| $50,000 to $74,999 | 1,323 | 17.4% |
| $75,000 to $99,999 | 1,422 | 18.7% |
| $100,000 to $149,999 | 1,627 | 21.4% |
| $150,000 to $199,999 | 517 | 6.8% |
| $200,000+ | 304 | 4.0% |
Family Income by Famaliy Size in Drexel Heights
7+ person families (186 | 2.5%) account for the highest median family income in Drexel Heights with $121,140 per family, while 2-person families (2,629 | 34.6%) have the highest median income of $35,679 per family member.
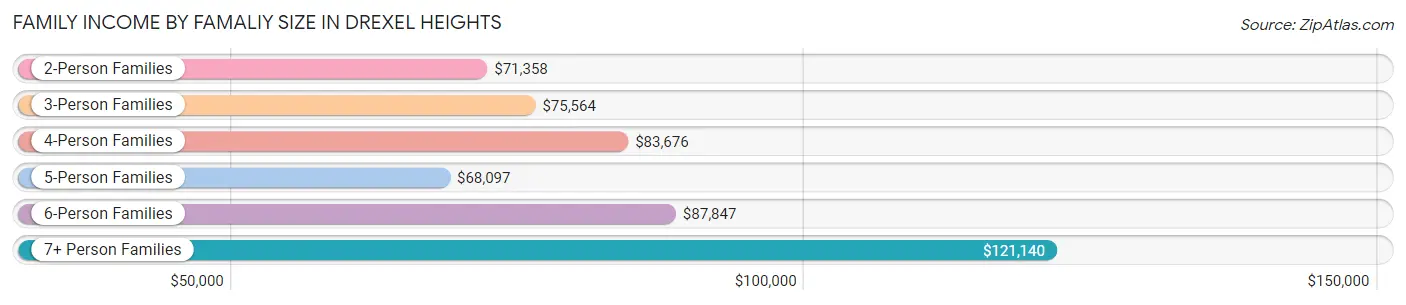
| Income Bracket | # Families | Median Income |
| 2-Person Families | 2,629 (34.6%) | $71,358 |
| 3-Person Families | 1,565 (20.6%) | $75,564 |
| 4-Person Families | 2,014 (26.5%) | $83,676 |
| 5-Person Families | 936 (12.3%) | $68,097 |
| 6-Person Families | 275 (3.6%) | $87,847 |
| 7+ Person Families | 186 (2.5%) | $121,140 |
| Total | 7,605 (100.0%) | $75,725 |
Family Income by Number of Earners in Drexel Heights
The median family income in Drexel Heights is $75,725, with families comprising 3+ earners (1,357) having the highest median family income of $117,422, while families with no earners (1,149) have the lowest median family income of $24,983, accounting for 17.8% and 15.1% of families, respectively.
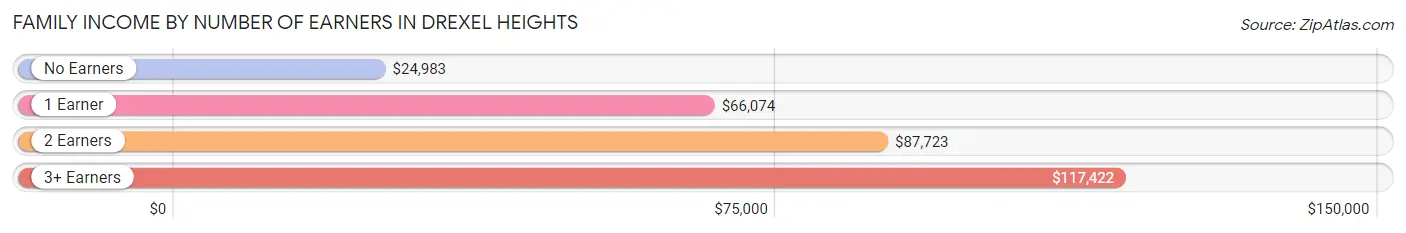
| Number of Earners | # Families | Median Income |
| No Earners | 1,149 (15.1%) | $24,983 |
| 1 Earner | 2,819 (37.1%) | $66,074 |
| 2 Earners | 2,280 (30.0%) | $87,723 |
| 3+ Earners | 1,357 (17.8%) | $117,422 |
| Total | 7,605 (100.0%) | $75,725 |
Household Income in Drexel Heights
Household Income Brackets in Drexel Heights
With 1,998 households falling in the category, the $100,000 to $149,999 income range is the most frequent in Drexel Heights, accounting for 20.4% of all households. In contrast, only 235 households (2.4%) fall into the $10,000 to $14,999 income bracket, making it the least populous group.
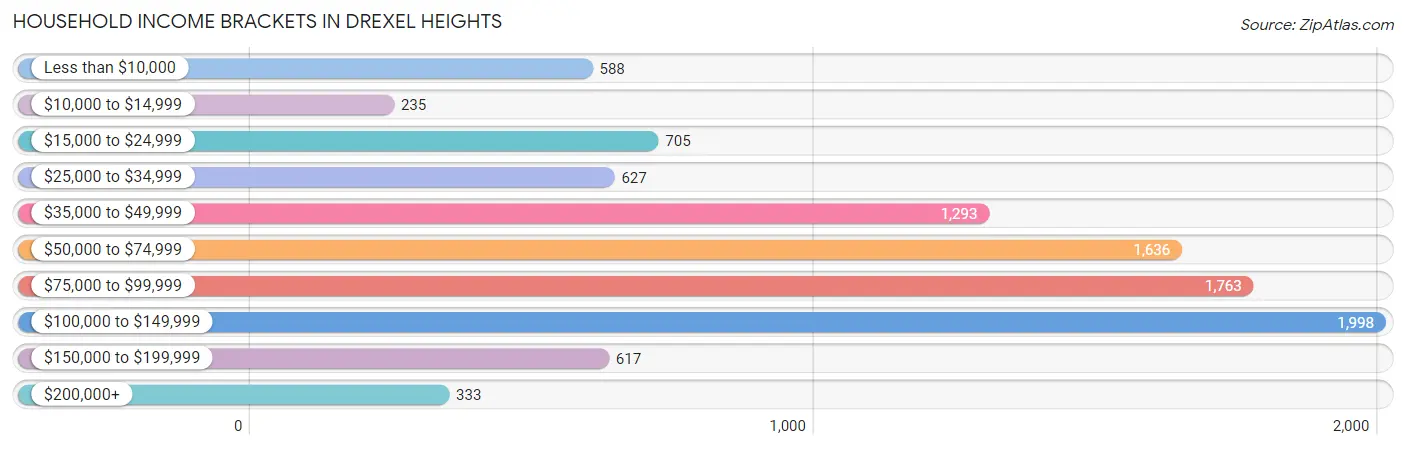
| Income Bracket | # Households | % Households |
| Less than $10,000 | 588 | 6.0% |
| $10,000 to $14,999 | 235 | 2.4% |
| $15,000 to $24,999 | 705 | 7.2% |
| $25,000 to $34,999 | 627 | 6.4% |
| $35,000 to $49,999 | 1,293 | 13.2% |
| $50,000 to $74,999 | 1,636 | 16.7% |
| $75,000 to $99,999 | 1,763 | 18.0% |
| $100,000 to $149,999 | 1,998 | 20.4% |
| $150,000 to $199,999 | 617 | 6.3% |
| $200,000+ | 333 | 3.4% |
Household Income by Householder Age in Drexel Heights
The median household income in Drexel Heights is $72,567, with the highest median household income of $82,364 found in the 45 to 64 years age bracket for the primary householder. A total of 3,711 households (37.9%) fall into this category. Meanwhile, the 15 to 24 years age bracket for the primary householder has the lowest median household income of $36,750, with 325 households (3.3%) in this group.
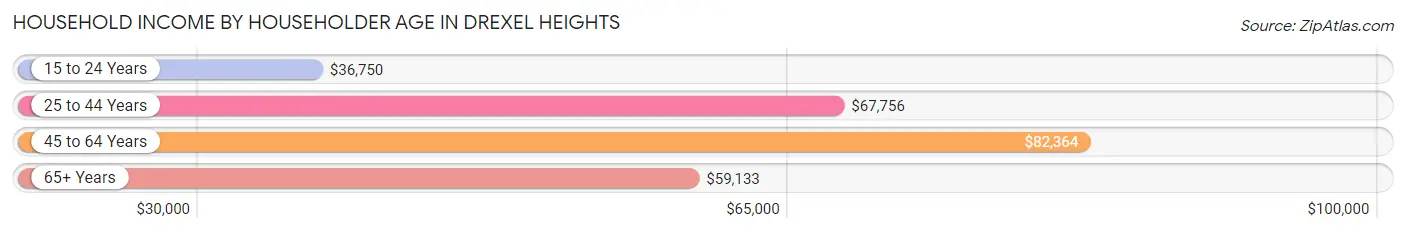
| Income Bracket | # Households | Median Income |
| 15 to 24 Years | 325 (3.3%) | $36,750 |
| 25 to 44 Years | 2,985 (30.5%) | $67,756 |
| 45 to 64 Years | 3,711 (37.9%) | $82,364 |
| 65+ Years | 2,775 (28.3%) | $59,133 |
| Total | 9,796 (100.0%) | $72,567 |
Poverty in Drexel Heights
Income Below Poverty by Sex and Age in Drexel Heights
With 14.1% poverty level for males and 17.6% for females among the residents of Drexel Heights, 5 year old males and under 5 year old females are the most vulnerable to poverty, with 74 males (58.7%) and 298 females (32.2%) in their respective age groups living below the poverty level.
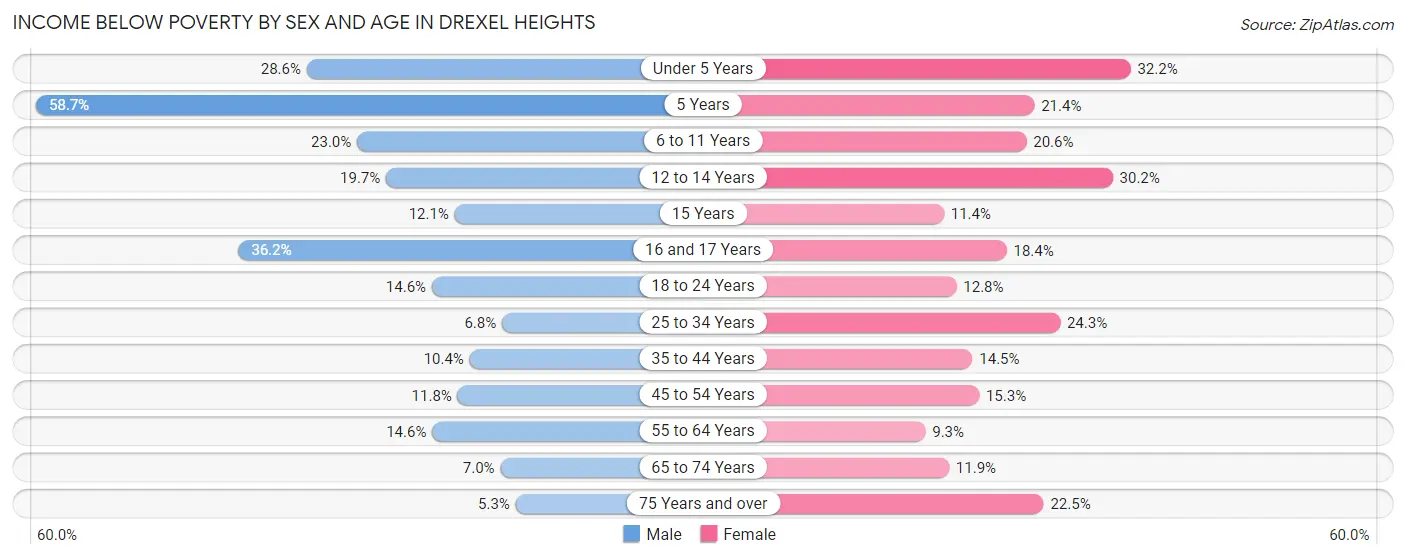
| Age Bracket | Male | Female |
| Under 5 Years | 268 (28.6%) | 298 (32.2%) |
| 5 Years | 74 (58.7%) | 36 (21.4%) |
| 6 to 11 Years | 229 (23.0%) | 313 (20.5%) |
| 12 to 14 Years | 108 (19.7%) | 203 (30.2%) |
| 15 Years | 34 (12.1%) | 20 (11.4%) |
| 16 and 17 Years | 160 (36.2%) | 156 (18.3%) |
| 18 to 24 Years | 237 (14.6%) | 211 (12.8%) |
| 25 to 34 Years | 125 (6.8%) | 424 (24.3%) |
| 35 to 44 Years | 187 (10.4%) | 249 (14.5%) |
| 45 to 54 Years | 239 (11.8%) | 280 (15.3%) |
| 55 to 64 Years | 253 (14.6%) | 161 (9.3%) |
| 65 to 74 Years | 113 (7.0%) | 201 (11.9%) |
| 75 Years and over | 35 (5.3%) | 139 (22.5%) |
| Total | 2,062 (14.1%) | 2,691 (17.6%) |
Income Above Poverty by Sex and Age in Drexel Heights
According to the poverty statistics in Drexel Heights, males aged 75 years and over and females aged 55 to 64 years are the age groups that are most secure financially, with 94.7% of males and 90.7% of females in these age groups living above the poverty line.
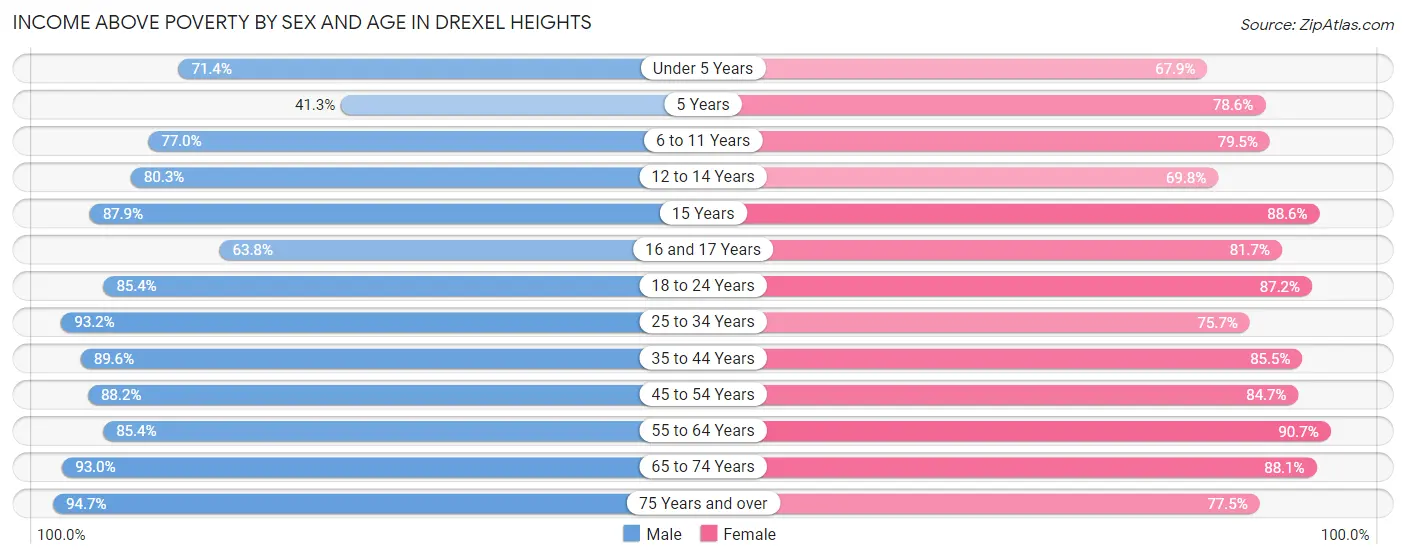
| Age Bracket | Male | Female |
| Under 5 Years | 670 (71.4%) | 629 (67.8%) |
| 5 Years | 52 (41.3%) | 132 (78.6%) |
| 6 to 11 Years | 768 (77.0%) | 1,210 (79.4%) |
| 12 to 14 Years | 439 (80.3%) | 470 (69.8%) |
| 15 Years | 247 (87.9%) | 156 (88.6%) |
| 16 and 17 Years | 282 (63.8%) | 694 (81.7%) |
| 18 to 24 Years | 1,382 (85.4%) | 1,443 (87.2%) |
| 25 to 34 Years | 1,706 (93.2%) | 1,321 (75.7%) |
| 35 to 44 Years | 1,606 (89.6%) | 1,463 (85.5%) |
| 45 to 54 Years | 1,792 (88.2%) | 1,552 (84.7%) |
| 55 to 64 Years | 1,480 (85.4%) | 1,571 (90.7%) |
| 65 to 74 Years | 1,498 (93.0%) | 1,484 (88.1%) |
| 75 Years and over | 624 (94.7%) | 480 (77.5%) |
| Total | 12,546 (85.9%) | 12,605 (82.4%) |
Income Below Poverty Among Married-Couple Families in Drexel Heights
The poverty statistics for married-couple families in Drexel Heights show that 8.3% or 398 of the total 4,814 families live below the poverty line. Families with 3 or 4 children have the highest poverty rate of 15.2%, comprising of 106 families. On the other hand, families with no children have the lowest poverty rate of 4.3%, which includes 119 families.
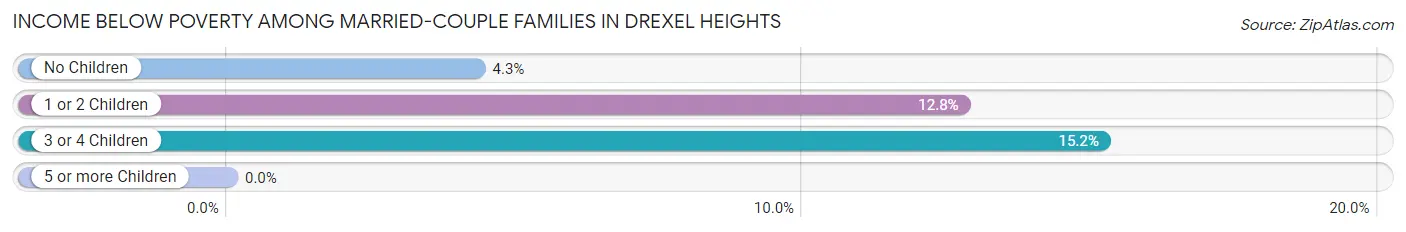
| Children | Above Poverty | Below Poverty |
| No Children | 2,640 (95.7%) | 119 (4.3%) |
| 1 or 2 Children | 1,184 (87.3%) | 173 (12.8%) |
| 3 or 4 Children | 592 (84.8%) | 106 (15.2%) |
| 5 or more Children | 0 (0.0%) | 0 (0.0%) |
| Total | 4,416 (91.7%) | 398 (8.3%) |
Income Below Poverty Among Single-Parent Households in Drexel Heights
According to the poverty data in Drexel Heights, 13.4% or 148 single-father households and 30.4% or 512 single-mother households are living below the poverty line. Among single-father households, those with 5 or more children have the highest poverty rate, with 18 households (45.0%) experiencing poverty. Likewise, among single-mother households, those with 5 or more children have the highest poverty rate, with 17 households (100.0%) falling below the poverty line.
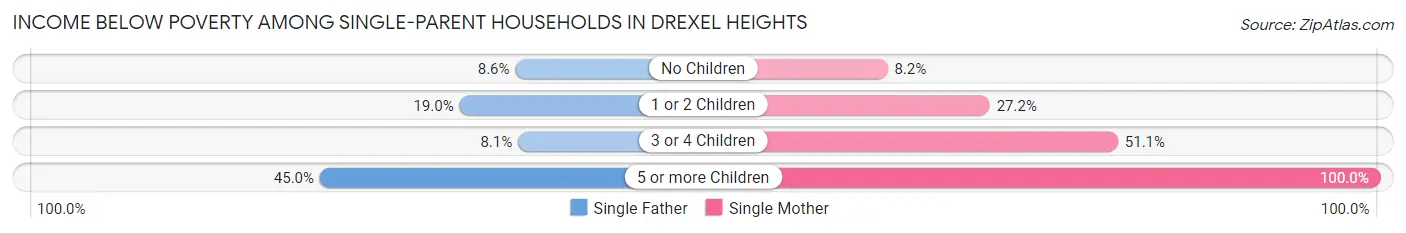
| Children | Single Father | Single Mother |
| No Children | 42 (8.6%) | 35 (8.2%) |
| 1 or 2 Children | 72 (19.0%) | 197 (27.2%) |
| 3 or 4 Children | 16 (8.1%) | 263 (51.1%) |
| 5 or more Children | 18 (45.0%) | 17 (100.0%) |
| Total | 148 (13.4%) | 512 (30.4%) |
Income Below Poverty Among Married-Couple vs Single-Parent Households in Drexel Heights
The poverty data for Drexel Heights shows that 398 of the married-couple family households (8.3%) and 660 of the single-parent households (23.6%) are living below the poverty level. Within the married-couple family households, those with 3 or 4 children have the highest poverty rate, with 106 households (15.2%) falling below the poverty line. Among the single-parent households, those with 5 or more children have the highest poverty rate, with 35 household (61.4%) living below poverty.
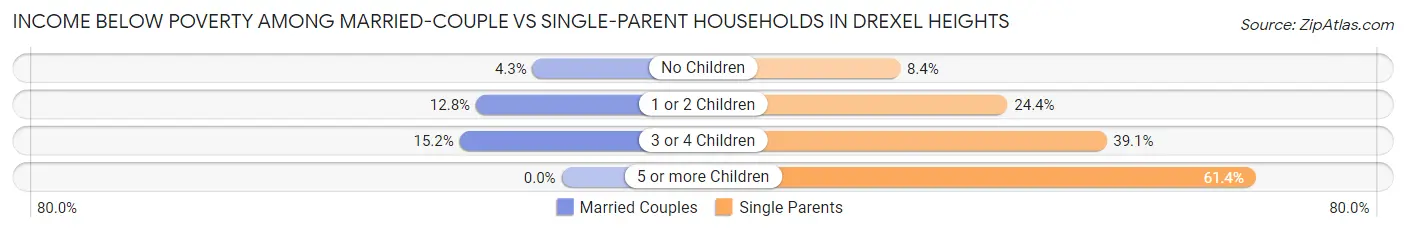
| Children | Married-Couple Families | Single-Parent Households |
| No Children | 119 (4.3%) | 77 (8.4%) |
| 1 or 2 Children | 173 (12.8%) | 269 (24.4%) |
| 3 or 4 Children | 106 (15.2%) | 279 (39.1%) |
| 5 or more Children | 0 (0.0%) | 35 (61.4%) |
| Total | 398 (8.3%) | 660 (23.6%) |
Race in Drexel Heights
The most populous races in Drexel Heights are Hispanic or Latino (24,346 | 80.5%), White / Caucasian (13,878 | 45.9%), and Some other Race (9,622 | 31.8%).
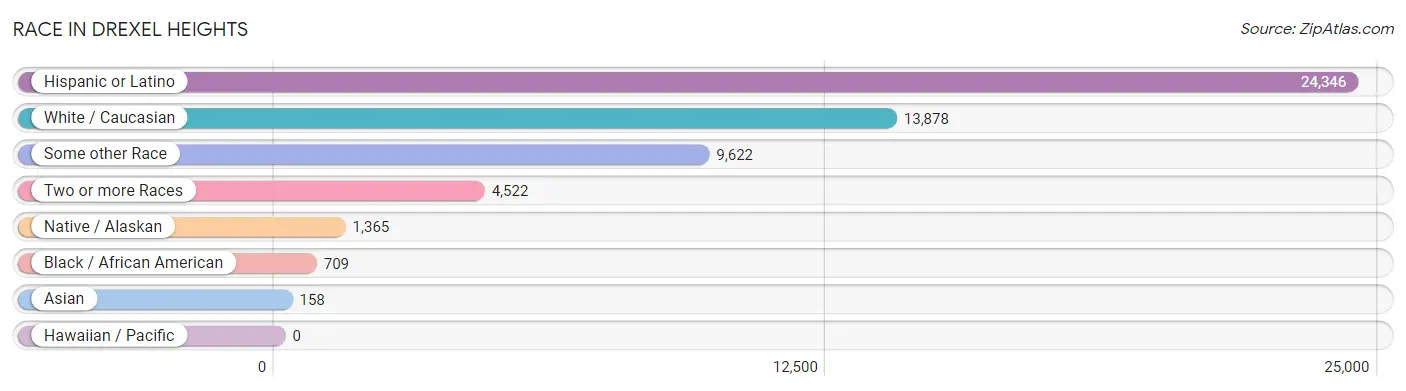
| Race | # Population | % Population |
| Asian | 158 | 0.5% |
| Black / African American | 709 | 2.3% |
| Hawaiian / Pacific | 0 | 0.0% |
| Hispanic or Latino | 24,346 | 80.5% |
| Native / Alaskan | 1,365 | 4.5% |
| White / Caucasian | 13,878 | 45.9% |
| Two or more Races | 4,522 | 14.9% |
| Some other Race | 9,622 | 31.8% |
| Total | 30,254 | 100.0% |
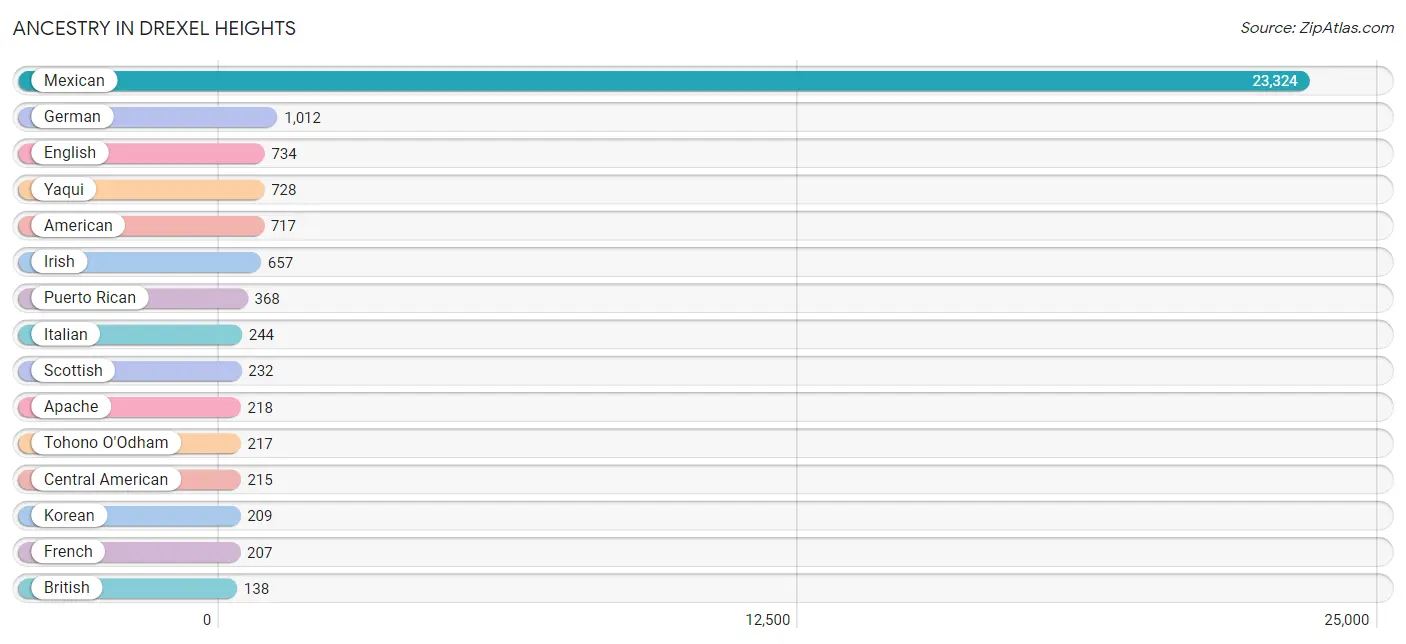
Ancestry in Drexel Heights
The most populous ancestries reported in Drexel Heights are Mexican (23,324 | 77.1%), German (1,012 | 3.4%), English (734 | 2.4%), Yaqui (728 | 2.4%), and American (717 | 2.4%), together accounting for 87.7% of all Drexel Heights residents.
| Ancestry | # Population | % Population |
| African | 46 | 0.2% |
| American | 717 | 2.4% |
| Apache | 218 | 0.7% |
| Arab | 27 | 0.1% |
| Australian | 91 | 0.3% |
| Bhutanese | 15 | 0.1% |
| Brazilian | 13 | 0.0% |
| British | 138 | 0.5% |
| British West Indian | 3 | 0.0% |
| Burmese | 11 | 0.0% |
| Canadian | 19 | 0.1% |
| Central American | 215 | 0.7% |
| Central American Indian | 66 | 0.2% |
| Chilean | 28 | 0.1% |
| Chippewa | 44 | 0.2% |
| Choctaw | 17 | 0.1% |
| Colombian | 9 | 0.0% |
| Croatian | 7 | 0.0% |
| Cuban | 50 | 0.2% |
| Czech | 46 | 0.2% |
| Czechoslovakian | 4 | 0.0% |
| Danish | 29 | 0.1% |
| Dutch | 87 | 0.3% |
| Ecuadorian | 11 | 0.0% |
| English | 734 | 2.4% |
| European | 67 | 0.2% |
| Finnish | 12 | 0.0% |
| French | 207 | 0.7% |
| French American Indian | 2 | 0.0% |
| French Canadian | 15 | 0.1% |
| German | 1,012 | 3.4% |
| Greek | 28 | 0.1% |
| Guatemalan | 21 | 0.1% |
| Honduran | 101 | 0.3% |
| Hungarian | 73 | 0.2% |
| Indian (Asian) | 57 | 0.2% |
| Iranian | 12 | 0.0% |
| Irish | 657 | 2.2% |
| Italian | 244 | 0.8% |
| Jordanian | 27 | 0.1% |
| Korean | 209 | 0.7% |
| Latvian | 8 | 0.0% |
| Malaysian | 5 | 0.0% |
| Mexican | 23,324 | 77.1% |
| Mexican American Indian | 34 | 0.1% |
| Navajo | 109 | 0.4% |
| Northern European | 62 | 0.2% |
| Norwegian | 30 | 0.1% |
| Pakistani | 24 | 0.1% |
| Polish | 103 | 0.3% |
| Portuguese | 14 | 0.1% |
| Puerto Rican | 368 | 1.2% |
| Salvadoran | 93 | 0.3% |
| Scandinavian | 26 | 0.1% |
| Scotch-Irish | 38 | 0.1% |
| Scottish | 232 | 0.8% |
| Sioux | 36 | 0.1% |
| South American | 48 | 0.2% |
| Spaniard | 54 | 0.2% |
| Spanish | 61 | 0.2% |
| Spanish American | 13 | 0.0% |
| Sri Lankan | 18 | 0.1% |
| Subsaharan African | 46 | 0.2% |
| Swedish | 65 | 0.2% |
| Swiss | 16 | 0.1% |
| Tohono O'Odham | 217 | 0.7% |
| Welsh | 94 | 0.3% |
| Yaqui | 728 | 2.4% |
| Yugoslavian | 5 | 0.0% | View All 69 Rows |
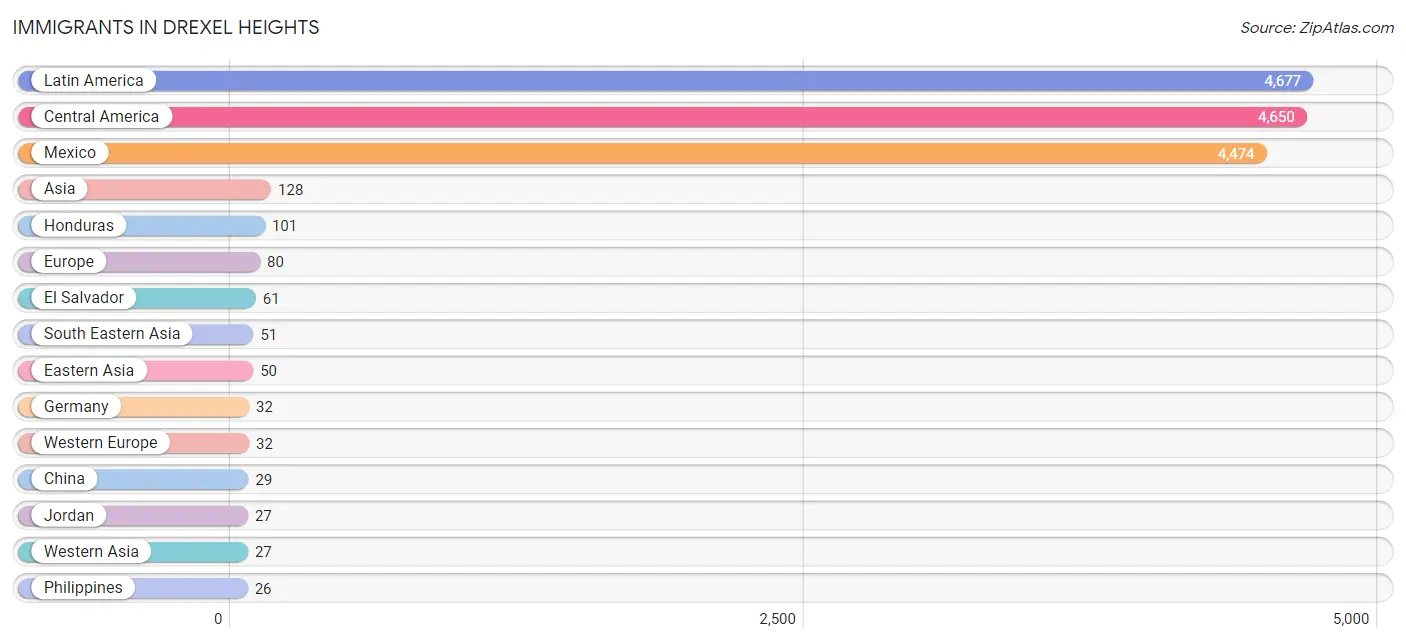
Immigrants in Drexel Heights
The most numerous immigrant groups reported in Drexel Heights came from Latin America (4,677 | 15.5%), Central America (4,650 | 15.4%), Mexico (4,474 | 14.8%), Asia (128 | 0.4%), and Honduras (101 | 0.3%), together accounting for 46.4% of all Drexel Heights residents.
| Immigration Origin | # Population | % Population |
| Africa | 23 | 0.1% |
| Asia | 128 | 0.4% |
| Canada | 8 | 0.0% |
| Caribbean | 9 | 0.0% |
| Central America | 4,650 | 15.4% |
| Chile | 9 | 0.0% |
| China | 29 | 0.1% |
| Colombia | 9 | 0.0% |
| Cuba | 9 | 0.0% |
| Czechoslovakia | 10 | 0.0% |
| Eastern Asia | 50 | 0.2% |
| Eastern Europe | 10 | 0.0% |
| El Salvador | 61 | 0.2% |
| England | 4 | 0.0% |
| Europe | 80 | 0.3% |
| Germany | 32 | 0.1% |
| Greece | 5 | 0.0% |
| Guatemala | 14 | 0.1% |
| Honduras | 101 | 0.3% |
| Hong Kong | 12 | 0.0% |
| Japan | 15 | 0.1% |
| Jordan | 27 | 0.1% |
| Korea | 6 | 0.0% |
| Latin America | 4,677 | 15.5% |
| Malaysia | 5 | 0.0% |
| Mexico | 4,474 | 14.8% |
| Northern Europe | 25 | 0.1% |
| Norway | 6 | 0.0% |
| Philippines | 26 | 0.1% |
| South America | 18 | 0.1% |
| South Eastern Asia | 51 | 0.2% |
| Southern Europe | 13 | 0.0% |
| Spain | 8 | 0.0% |
| Sweden | 15 | 0.1% |
| Thailand | 11 | 0.0% |
| Vietnam | 9 | 0.0% |
| Western Asia | 27 | 0.1% |
| Western Europe | 32 | 0.1% | View All 38 Rows |
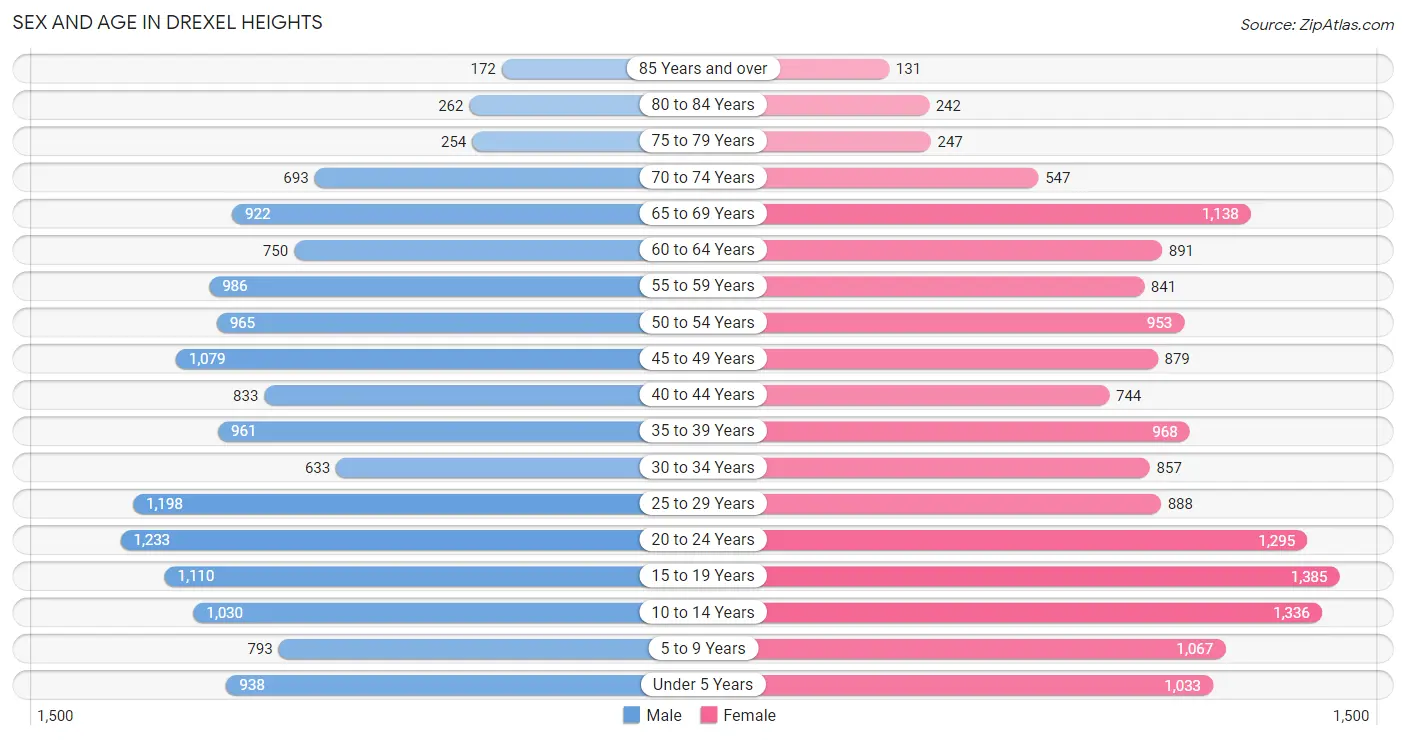
Sex and Age in Drexel Heights
Sex and Age in Drexel Heights
The most populous age groups in Drexel Heights are 20 to 24 Years (1,233 | 8.3%) for men and 15 to 19 Years (1,385 | 9.0%) for women.
| Age Bracket | Male | Female |
| Under 5 Years | 938 (6.3%) | 1,033 (6.7%) |
| 5 to 9 Years | 793 (5.3%) | 1,067 (6.9%) |
| 10 to 14 Years | 1,030 (7.0%) | 1,336 (8.6%) |
| 15 to 19 Years | 1,110 (7.5%) | 1,385 (9.0%) |
| 20 to 24 Years | 1,233 (8.3%) | 1,295 (8.4%) |
| 25 to 29 Years | 1,198 (8.1%) | 888 (5.8%) |
| 30 to 34 Years | 633 (4.3%) | 857 (5.6%) |
| 35 to 39 Years | 961 (6.5%) | 968 (6.3%) |
| 40 to 44 Years | 833 (5.6%) | 744 (4.8%) |
| 45 to 49 Years | 1,079 (7.3%) | 879 (5.7%) |
| 50 to 54 Years | 965 (6.5%) | 953 (6.2%) |
| 55 to 59 Years | 986 (6.7%) | 841 (5.4%) |
| 60 to 64 Years | 750 (5.1%) | 891 (5.8%) |
| 65 to 69 Years | 922 (6.2%) | 1,138 (7.4%) |
| 70 to 74 Years | 693 (4.7%) | 547 (3.5%) |
| 75 to 79 Years | 254 (1.7%) | 247 (1.6%) |
| 80 to 84 Years | 262 (1.8%) | 242 (1.6%) |
| 85 Years and over | 172 (1.2%) | 131 (0.9%) |
| Total | 14,812 (100.0%) | 15,442 (100.0%) |
Families and Households in Drexel Heights
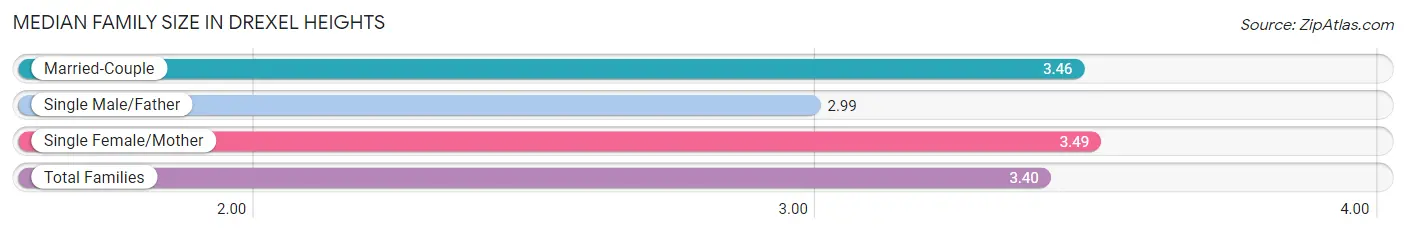
Median Family Size in Drexel Heights
The median family size in Drexel Heights is 3.40 persons per family, with single female/mother families (1,685 | 22.2%) accounting for the largest median family size of 3.49 persons per family. On the other hand, single male/father families (1,106 | 14.5%) represent the smallest median family size with 2.99 persons per family.
| Family Type | # Families | Family Size |
| Married-Couple | 4,814 (63.3%) | 3.46 |
| Single Male/Father | 1,106 (14.5%) | 2.99 |
| Single Female/Mother | 1,685 (22.2%) | 3.49 |
| Total Families | 7,605 (100.0%) | 3.40 |
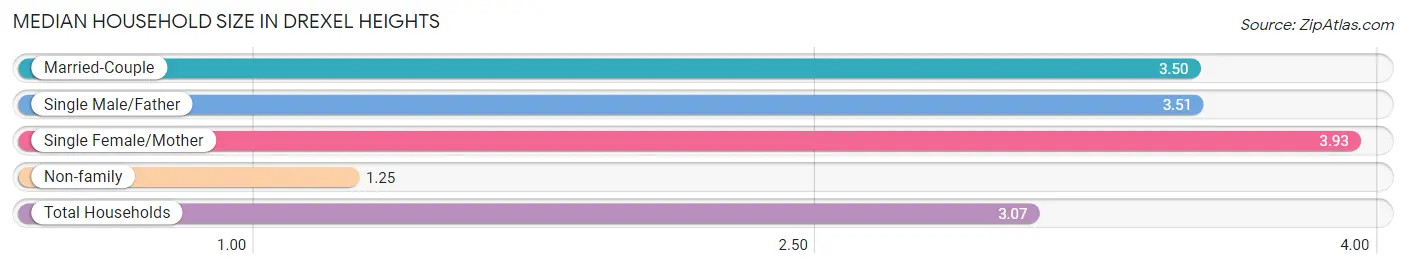
Median Household Size in Drexel Heights
The median household size in Drexel Heights is 3.07 persons per household, with single female/mother households (1,685 | 17.2%) accounting for the largest median household size of 3.93 persons per household. non-family households (2,191 | 22.4%) represent the smallest median household size with 1.25 persons per household.
| Household Type | # Households | Household Size |
| Married-Couple | 4,814 (49.1%) | 3.50 |
| Single Male/Father | 1,106 (11.3%) | 3.51 |
| Single Female/Mother | 1,685 (17.2%) | 3.93 |
| Non-family | 2,191 (22.4%) | 1.25 |
| Total Households | 9,796 (100.0%) | 3.07 |
Household Size by Marriage Status in Drexel Heights
Out of a total of 9,796 households in Drexel Heights, 7,605 (77.6%) are family households, while 2,191 (22.4%) are nonfamily households. The most numerous type of family households are 2-person households, comprising 2,332, and the most common type of nonfamily households are 1-person households, comprising 1,756.
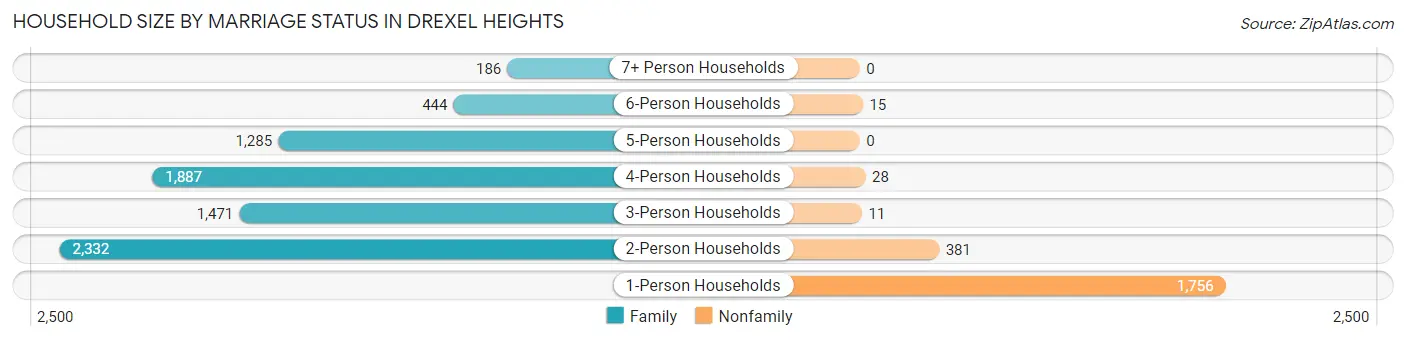
| Household Size | Family Households | Nonfamily Households |
| 1-Person Households | - | 1,756 (17.9%) |
| 2-Person Households | 2,332 (23.8%) | 381 (3.9%) |
| 3-Person Households | 1,471 (15.0%) | 11 (0.1%) |
| 4-Person Households | 1,887 (19.3%) | 28 (0.3%) |
| 5-Person Households | 1,285 (13.1%) | 0 (0.0%) |
| 6-Person Households | 444 (4.5%) | 15 (0.2%) |
| 7+ Person Households | 186 (1.9%) | 0 (0.0%) |
| Total | 7,605 (77.6%) | 2,191 (22.4%) |
Female Fertility in Drexel Heights
Fertility by Age in Drexel Heights
Average fertility rate in Drexel Heights is 50.0 births per 1,000 women. Women in the age bracket of 20 to 34 years have the highest fertility rate with 95.0 births per 1,000 women. Women in the age bracket of 20 to 34 years acount for 78.4% of all women with births.
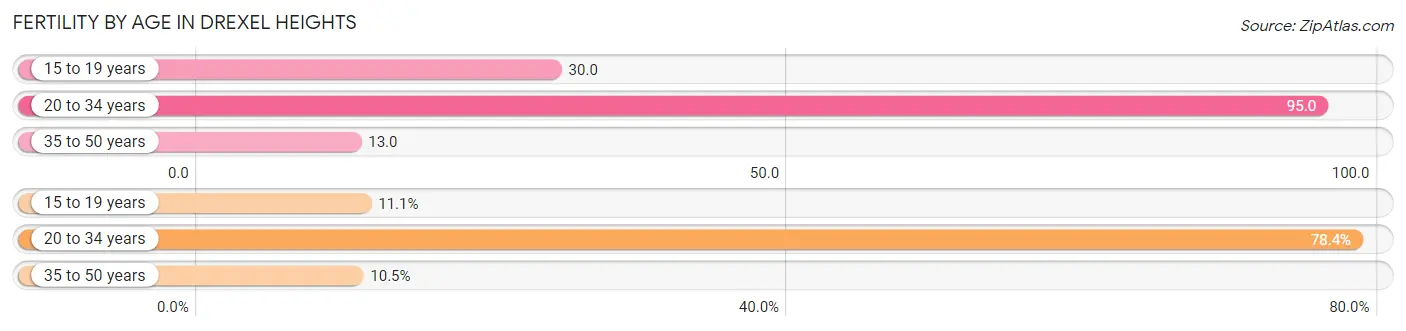
| Age Bracket | Women with Births | Births / 1,000 Women |
| 15 to 19 years | 41 (11.1%) | 30.0 |
| 20 to 34 years | 290 (78.4%) | 95.0 |
| 35 to 50 years | 39 (10.5%) | 13.0 |
| Total | 370 (100.0%) | 50.0 |
Fertility by Age by Marriage Status in Drexel Heights
27.8% of women with births (370) in Drexel Heights are married. The highest percentage of unmarried women with births falls into 15 to 19 years age bracket with 100.0% of them unmarried at the time of birth, while the lowest percentage of unmarried women with births belong to 35 to 50 years age bracket with 28.2% of them unmarried.
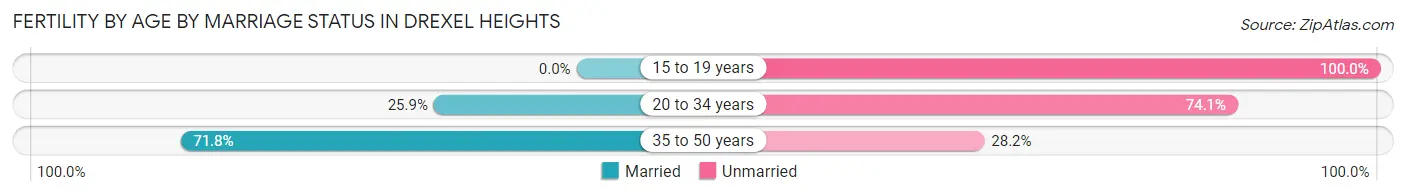
| Age Bracket | Married | Unmarried |
| 15 to 19 years | 0 (0.0%) | 41 (100.0%) |
| 20 to 34 years | 75 (25.9%) | 215 (74.1%) |
| 35 to 50 years | 28 (71.8%) | 11 (28.2%) |
| Total | 103 (27.8%) | 267 (72.2%) |
Fertility by Education in Drexel Heights
Average fertility rate in Drexel Heights is 50.0 births per 1,000 women. Women with the education attainment of graduate degree have the highest fertility rate of 89.0 births per 1,000 women, while women with the education attainment of less than high school have the lowest fertility at 30.0 births per 1,000 women. Women with the education attainment of college or associate's degree represent 36.2% of all women with births.
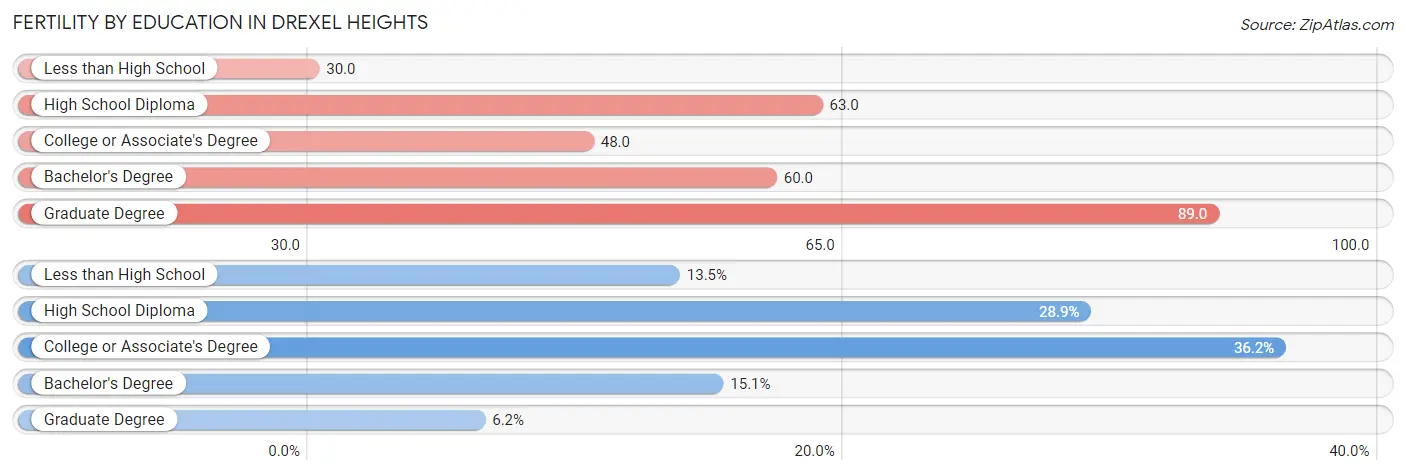
| Educational Attainment | Women with Births | Births / 1,000 Women |
| Less than High School | 50 (13.5%) | 30.0 |
| High School Diploma | 107 (28.9%) | 63.0 |
| College or Associate's Degree | 134 (36.2%) | 48.0 |
| Bachelor's Degree | 56 (15.1%) | 60.0 |
| Graduate Degree | 23 (6.2%) | 89.0 |
| Total | 370 (100.0%) | 50.0 |
Fertility by Education by Marriage Status in Drexel Heights
72.2% of women with births in Drexel Heights are unmarried. Women with the educational attainment of bachelor's degree are most likely to be married with 100.0% of them married at childbirth, while women with the educational attainment of less than high school are least likely to be married with 100.0% of them unmarried at childbirth.
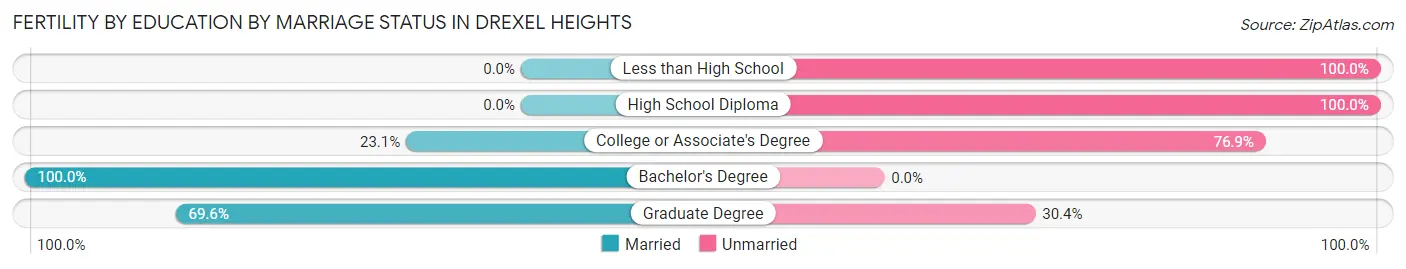
| Educational Attainment | Married | Unmarried |
| Less than High School | 0 (0.0%) | 50 (100.0%) |
| High School Diploma | 0 (0.0%) | 107 (100.0%) |
| College or Associate's Degree | 31 (23.1%) | 103 (76.9%) |
| Bachelor's Degree | 56 (100.0%) | 0 (0.0%) |
| Graduate Degree | 16 (69.6%) | 7 (30.4%) |
| Total | 103 (27.8%) | 267 (72.2%) |
Employment Characteristics in Drexel Heights
Employment by Class of Employer in Drexel Heights
Among the 13,621 employed individuals in Drexel Heights, private company employees (8,938 | 65.6%), local government employees (1,386 | 10.2%), and state government employees (895 | 6.6%) make up the most common classes of employment.
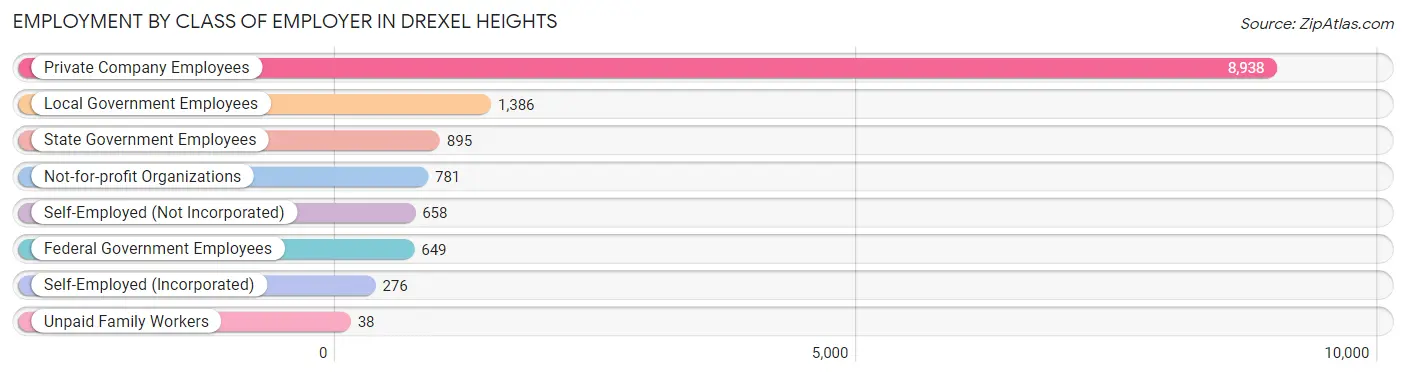
| Employer Class | # Employees | % Employees |
| Private Company Employees | 8,938 | 65.6% |
| Self-Employed (Incorporated) | 276 | 2.0% |
| Self-Employed (Not Incorporated) | 658 | 4.8% |
| Not-for-profit Organizations | 781 | 5.7% |
| Local Government Employees | 1,386 | 10.2% |
| State Government Employees | 895 | 6.6% |
| Federal Government Employees | 649 | 4.8% |
| Unpaid Family Workers | 38 | 0.3% |
| Total | 13,621 | 100.0% |
Employment Status by Age in Drexel Heights
According to the labor force statistics for Drexel Heights, out of the total population over 16 years of age (23,600), 61.2% or 14,443 individuals are in the labor force, with 4.7% or 679 of them unemployed. The age group with the highest labor force participation rate is 25 to 29 years, with 92.6% or 1,932 individuals in the labor force. Within the labor force, the 16 to 19 years age range has the highest percentage of unemployed individuals, with 14.5% or 81 of them being unemployed.
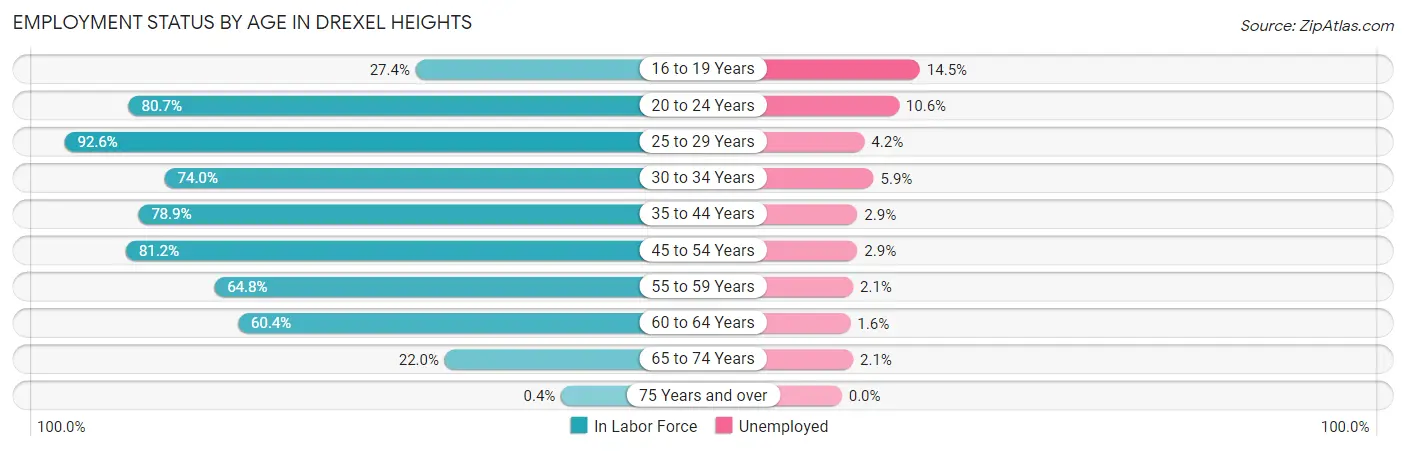
| Age Bracket | In Labor Force | Unemployed |
| 16 to 19 Years | 558 (27.4%) | 81 (14.5%) |
| 20 to 24 Years | 2,040 (80.7%) | 216 (10.6%) |
| 25 to 29 Years | 1,932 (92.6%) | 81 (4.2%) |
| 30 to 34 Years | 1,103 (74.0%) | 65 (5.9%) |
| 35 to 44 Years | 2,766 (78.9%) | 80 (2.9%) |
| 45 to 54 Years | 3,147 (81.2%) | 91 (2.9%) |
| 55 to 59 Years | 1,184 (64.8%) | 25 (2.1%) |
| 60 to 64 Years | 991 (60.4%) | 16 (1.6%) |
| 65 to 74 Years | 726 (22.0%) | 15 (2.1%) |
| 75 Years and over | 5 (0.4%) | 0 (0.0%) |
| Total | 14,443 (61.2%) | 679 (4.7%) |
Employment Status by Educational Attainment in Drexel Heights
According to labor force statistics for Drexel Heights, 77.1% of individuals (11,122) out of the total population between 25 and 64 years of age (14,426) are in the labor force, with 3.2% or 356 of them being unemployed. The group with the highest labor force participation rate are those with the educational attainment of bachelor's degree or higher, with 88.3% or 1,955 individuals in the labor force. Within the labor force, individuals with high school diploma education have the highest percentage of unemployment, with 7.0% or 237 of them being unemployed.
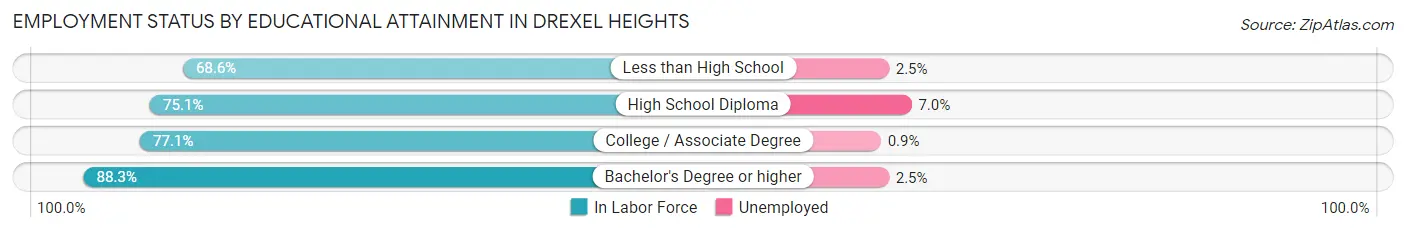
| Educational Attainment | In Labor Force | Unemployed |
| Less than High School | 1,300 (68.6%) | 47 (2.5%) |
| High School Diploma | 3,389 (75.1%) | 316 (7.0%) |
| College / Associate Degree | 4,475 (77.1%) | 52 (0.9%) |
| Bachelor's Degree or higher | 1,955 (88.3%) | 55 (2.5%) |
| Total | 11,122 (77.1%) | 462 (3.2%) |
Employment Occupations by Sex in Drexel Heights
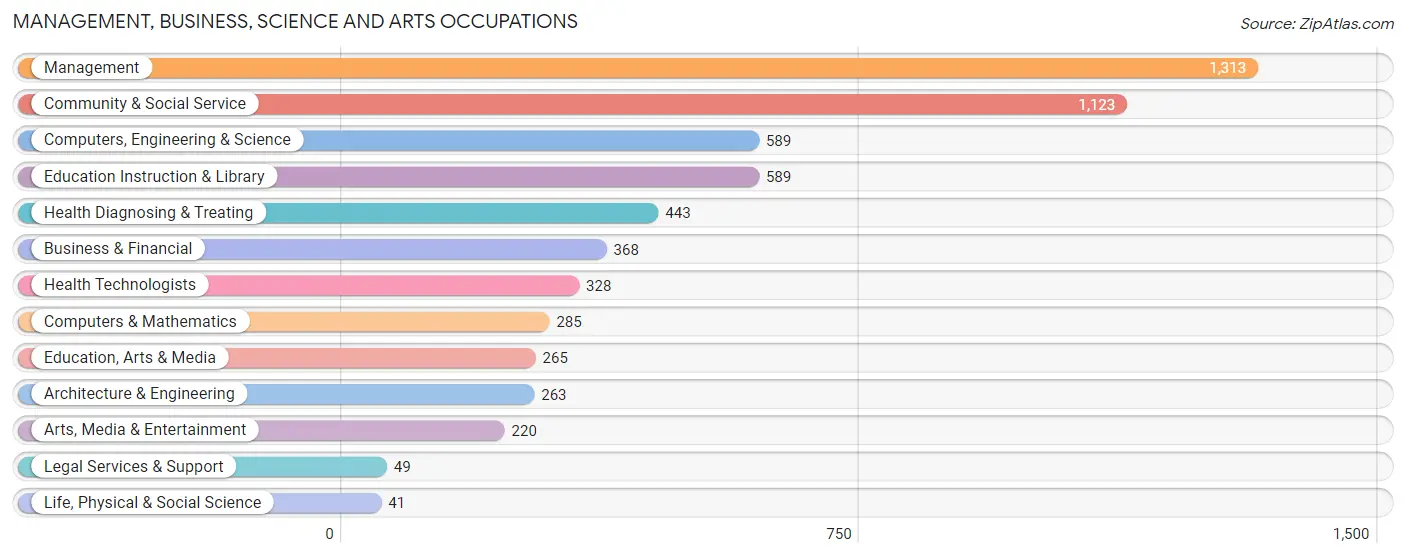
Management, Business, Science and Arts Occupations
The most common Management, Business, Science and Arts occupations in Drexel Heights are Management (1,313 | 9.6%), Community & Social Service (1,123 | 8.2%), Computers, Engineering & Science (589 | 4.3%), Education Instruction & Library (589 | 4.3%), and Health Diagnosing & Treating (443 | 3.2%).
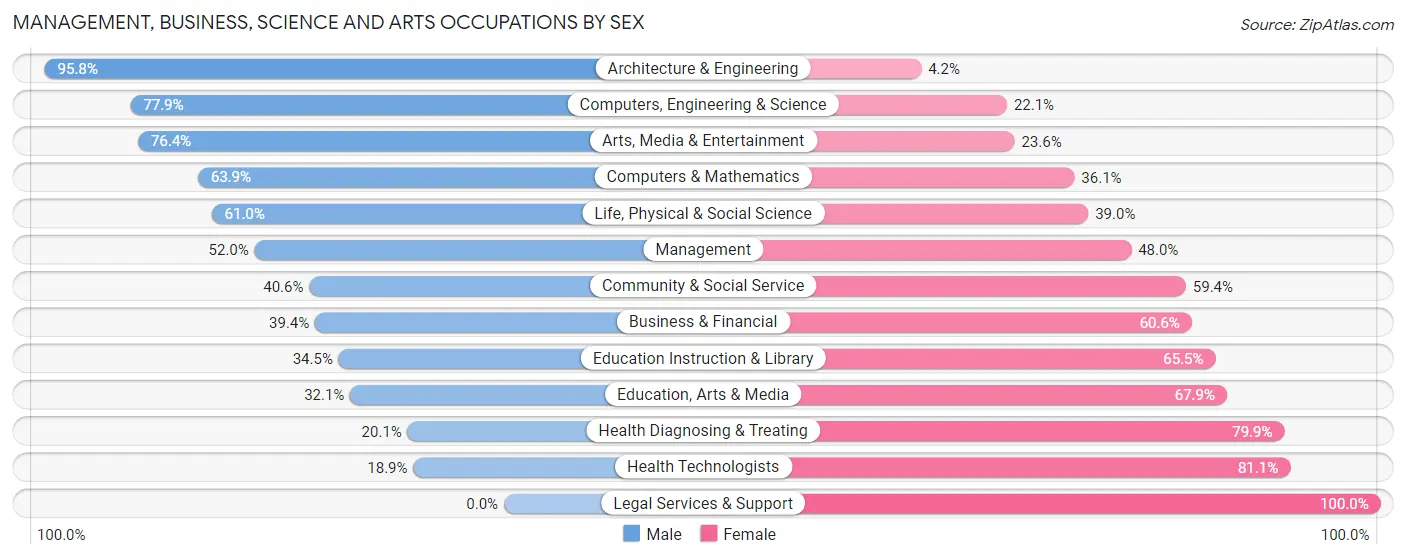
Management, Business, Science and Arts Occupations by Sex
Within the Management, Business, Science and Arts occupations in Drexel Heights, the most male-oriented occupations are Architecture & Engineering (95.8%), Computers, Engineering & Science (77.9%), and Arts, Media & Entertainment (76.4%), while the most female-oriented occupations are Legal Services & Support (100.0%), Health Technologists (81.1%), and Health Diagnosing & Treating (79.9%).
| Occupation | Male | Female |
| Management | 683 (52.0%) | 630 (48.0%) |
| Business & Financial | 145 (39.4%) | 223 (60.6%) |
| Computers, Engineering & Science | 459 (77.9%) | 130 (22.1%) |
| Computers & Mathematics | 182 (63.9%) | 103 (36.1%) |
| Architecture & Engineering | 252 (95.8%) | 11 (4.2%) |
| Life, Physical & Social Science | 25 (61.0%) | 16 (39.0%) |
| Community & Social Service | 456 (40.6%) | 667 (59.4%) |
| Education, Arts & Media | 85 (32.1%) | 180 (67.9%) |
| Legal Services & Support | 0 (0.0%) | 49 (100.0%) |
| Education Instruction & Library | 203 (34.5%) | 386 (65.5%) |
| Arts, Media & Entertainment | 168 (76.4%) | 52 (23.6%) |
| Health Diagnosing & Treating | 89 (20.1%) | 354 (79.9%) |
| Health Technologists | 62 (18.9%) | 266 (81.1%) |
| Total (Category) | 1,832 (47.8%) | 2,004 (52.2%) |
| Total (Overall) | 7,414 (54.0%) | 6,318 (46.0%) |
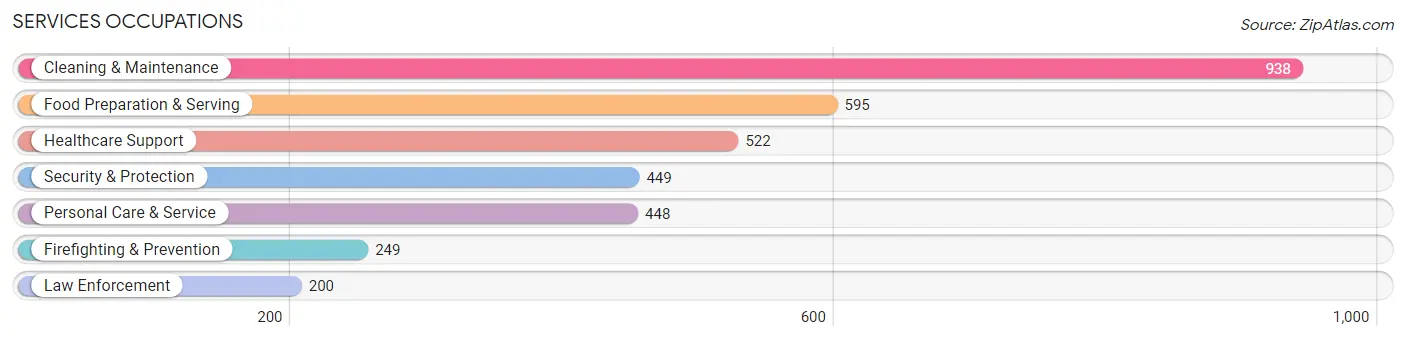
Services Occupations
The most common Services occupations in Drexel Heights are Cleaning & Maintenance (938 | 6.8%), Food Preparation & Serving (595 | 4.3%), Healthcare Support (522 | 3.8%), Security & Protection (449 | 3.3%), and Personal Care & Service (448 | 3.3%).
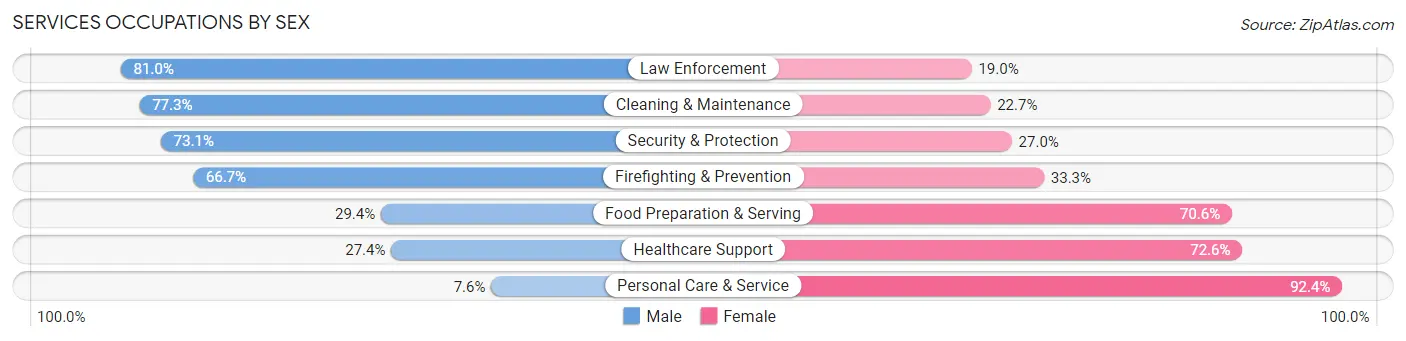
Services Occupations by Sex
Within the Services occupations in Drexel Heights, the most male-oriented occupations are Law Enforcement (81.0%), Cleaning & Maintenance (77.3%), and Security & Protection (73.1%), while the most female-oriented occupations are Personal Care & Service (92.4%), Healthcare Support (72.6%), and Food Preparation & Serving (70.6%).
| Occupation | Male | Female |
| Healthcare Support | 143 (27.4%) | 379 (72.6%) |
| Security & Protection | 328 (73.1%) | 121 (27.0%) |
| Firefighting & Prevention | 166 (66.7%) | 83 (33.3%) |
| Law Enforcement | 162 (81.0%) | 38 (19.0%) |
| Food Preparation & Serving | 175 (29.4%) | 420 (70.6%) |
| Cleaning & Maintenance | 725 (77.3%) | 213 (22.7%) |
| Personal Care & Service | 34 (7.6%) | 414 (92.4%) |
| Total (Category) | 1,405 (47.6%) | 1,547 (52.4%) |
| Total (Overall) | 7,414 (54.0%) | 6,318 (46.0%) |
Sales and Office Occupations
The most common Sales and Office occupations in Drexel Heights are Office & Administration (2,237 | 16.3%), and Sales & Related (1,307 | 9.5%).
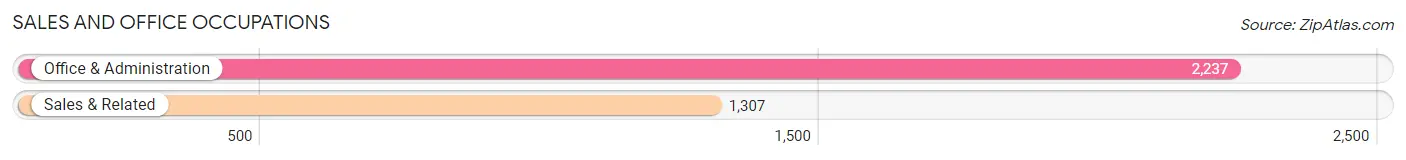
Sales and Office Occupations by Sex
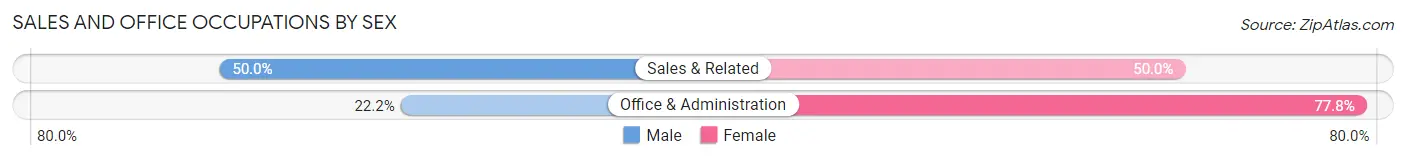
| Occupation | Male | Female |
| Sales & Related | 654 (50.0%) | 653 (50.0%) |
| Office & Administration | 496 (22.2%) | 1,741 (77.8%) |
| Total (Category) | 1,150 (32.5%) | 2,394 (67.5%) |
| Total (Overall) | 7,414 (54.0%) | 6,318 (46.0%) |
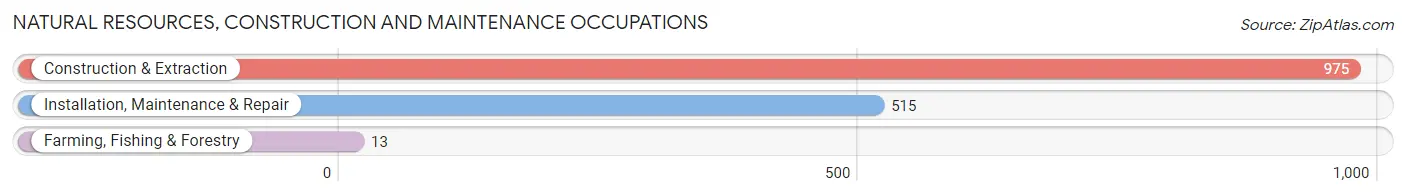
Natural Resources, Construction and Maintenance Occupations
The most common Natural Resources, Construction and Maintenance occupations in Drexel Heights are Construction & Extraction (975 | 7.1%), Installation, Maintenance & Repair (515 | 3.7%), and Farming, Fishing & Forestry (13 | 0.1%).
Natural Resources, Construction and Maintenance Occupations by Sex
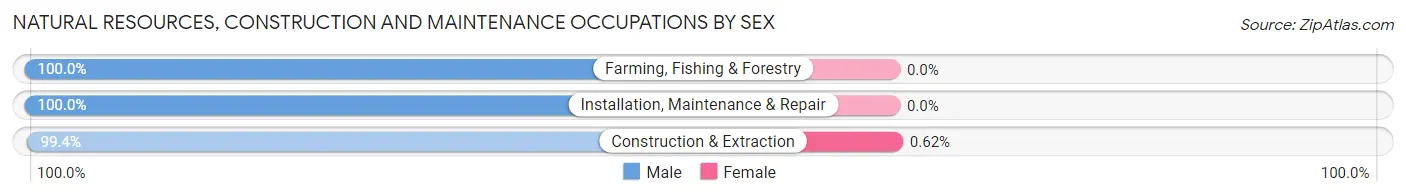
| Occupation | Male | Female |
| Farming, Fishing & Forestry | 13 (100.0%) | 0 (0.0%) |
| Construction & Extraction | 969 (99.4%) | 6 (0.6%) |
| Installation, Maintenance & Repair | 515 (100.0%) | 0 (0.0%) |
| Total (Category) | 1,497 (99.6%) | 6 (0.4%) |
| Total (Overall) | 7,414 (54.0%) | 6,318 (46.0%) |
Production, Transportation and Moving Occupations
The most common Production, Transportation and Moving occupations in Drexel Heights are Production (955 | 7.0%), Transportation (701 | 5.1%), and Material Moving (241 | 1.8%).
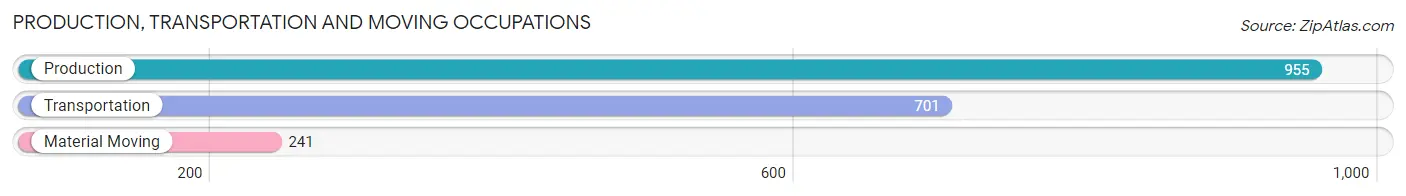
Production, Transportation and Moving Occupations by Sex
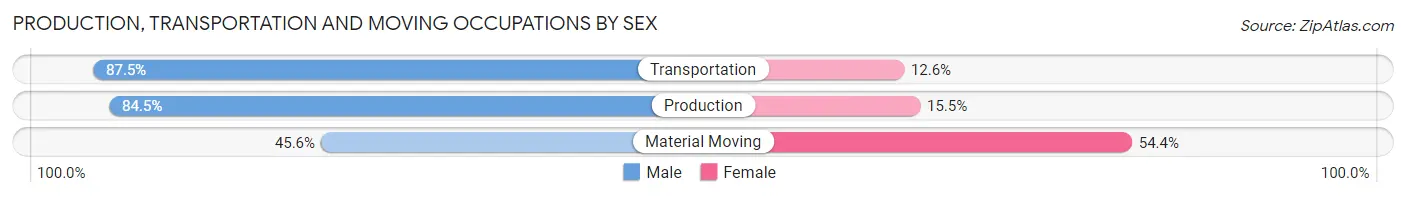
| Occupation | Male | Female |
| Production | 807 (84.5%) | 148 (15.5%) |
| Transportation | 613 (87.5%) | 88 (12.6%) |
| Material Moving | 110 (45.6%) | 131 (54.4%) |
| Total (Category) | 1,530 (80.6%) | 367 (19.4%) |
| Total (Overall) | 7,414 (54.0%) | 6,318 (46.0%) |
Employment Industries by Sex in Drexel Heights
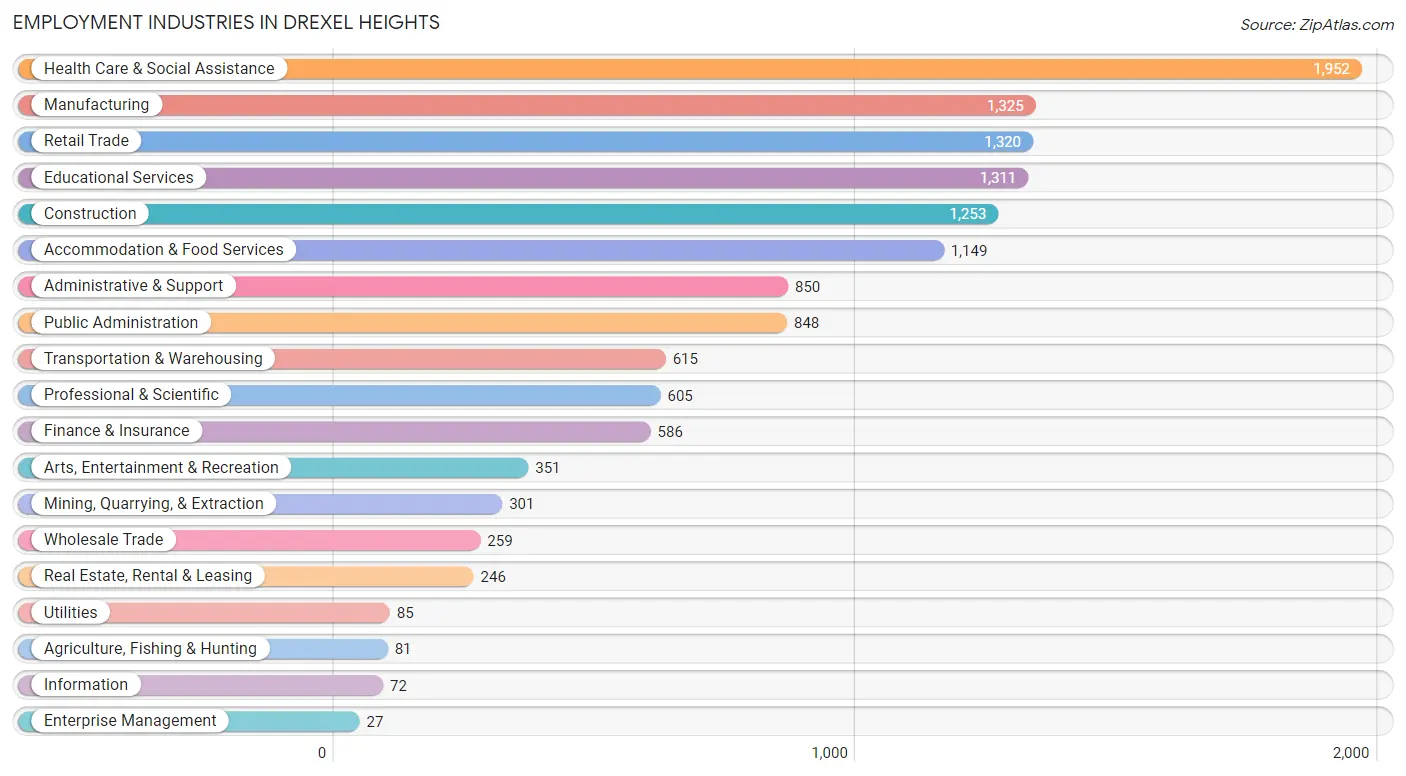
Employment Industries in Drexel Heights
The major employment industries in Drexel Heights include Health Care & Social Assistance (1,952 | 14.2%), Manufacturing (1,325 | 9.7%), Retail Trade (1,320 | 9.6%), Educational Services (1,311 | 9.6%), and Construction (1,253 | 9.1%).
Employment Industries by Sex in Drexel Heights
The Drexel Heights industries that see more men than women are Agriculture, Fishing & Hunting (100.0%), Utilities (100.0%), and Construction (97.2%), whereas the industries that tend to have a higher number of women are Enterprise Management (100.0%), Finance & Insurance (89.9%), and Health Care & Social Assistance (70.3%).
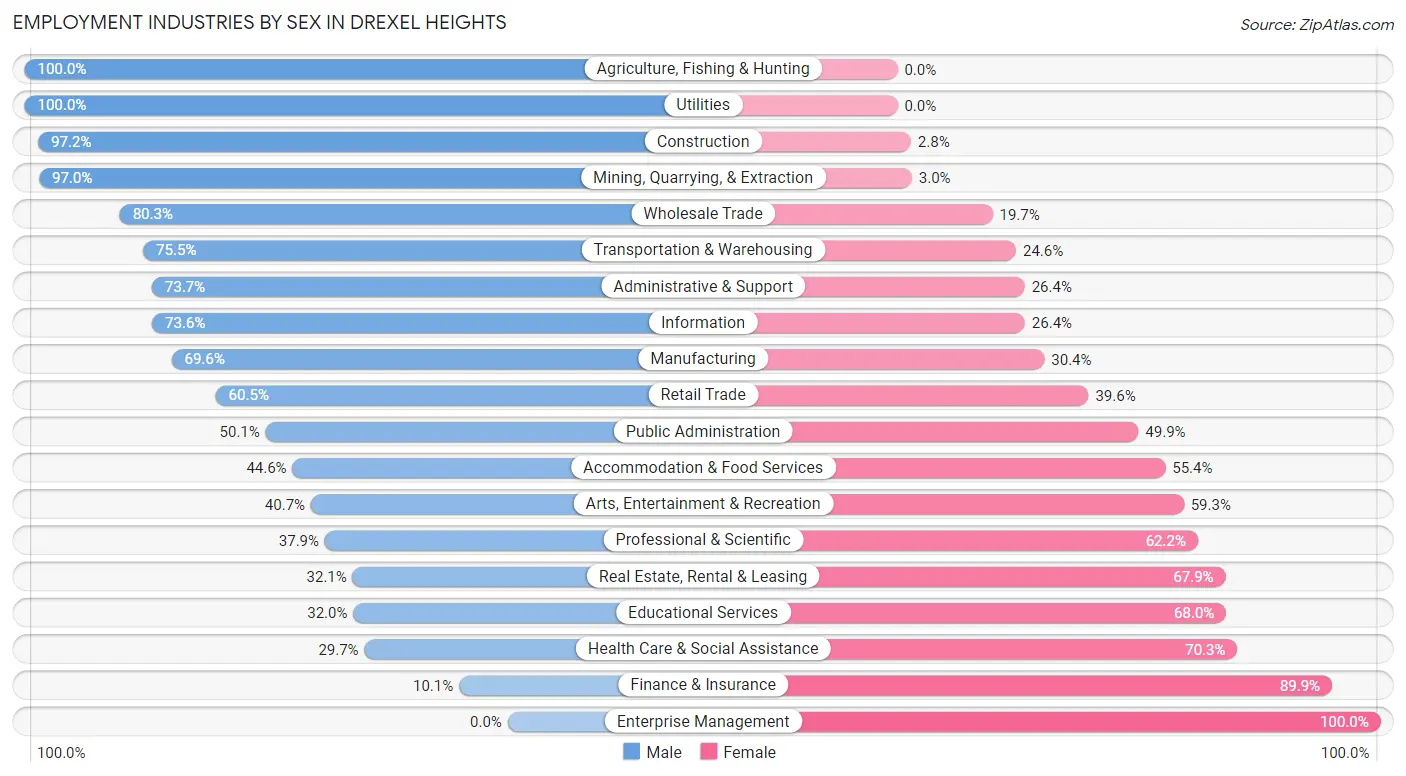
| Industry | Male | Female |
| Agriculture, Fishing & Hunting | 81 (100.0%) | 0 (0.0%) |
| Mining, Quarrying, & Extraction | 292 (97.0%) | 9 (3.0%) |
| Construction | 1,218 (97.2%) | 35 (2.8%) |
| Manufacturing | 922 (69.6%) | 403 (30.4%) |
| Wholesale Trade | 208 (80.3%) | 51 (19.7%) |
| Retail Trade | 798 (60.5%) | 522 (39.6%) |
| Transportation & Warehousing | 464 (75.4%) | 151 (24.5%) |
| Utilities | 85 (100.0%) | 0 (0.0%) |
| Information | 53 (73.6%) | 19 (26.4%) |
| Finance & Insurance | 59 (10.1%) | 527 (89.9%) |
| Real Estate, Rental & Leasing | 79 (32.1%) | 167 (67.9%) |
| Professional & Scientific | 229 (37.9%) | 376 (62.2%) |
| Enterprise Management | 0 (0.0%) | 27 (100.0%) |
| Administrative & Support | 626 (73.7%) | 224 (26.4%) |
| Educational Services | 419 (32.0%) | 892 (68.0%) |
| Health Care & Social Assistance | 579 (29.7%) | 1,373 (70.3%) |
| Arts, Entertainment & Recreation | 143 (40.7%) | 208 (59.3%) |
| Accommodation & Food Services | 512 (44.6%) | 637 (55.4%) |
| Public Administration | 425 (50.1%) | 423 (49.9%) |
| Total | 7,414 (54.0%) | 6,318 (46.0%) |
Education in Drexel Heights
School Enrollment in Drexel Heights
The most common levels of schooling among the 8,289 students in Drexel Heights are high school (2,028 | 24.5%), middle school (1,850 | 22.3%), and elementary school (1,729 | 20.9%).
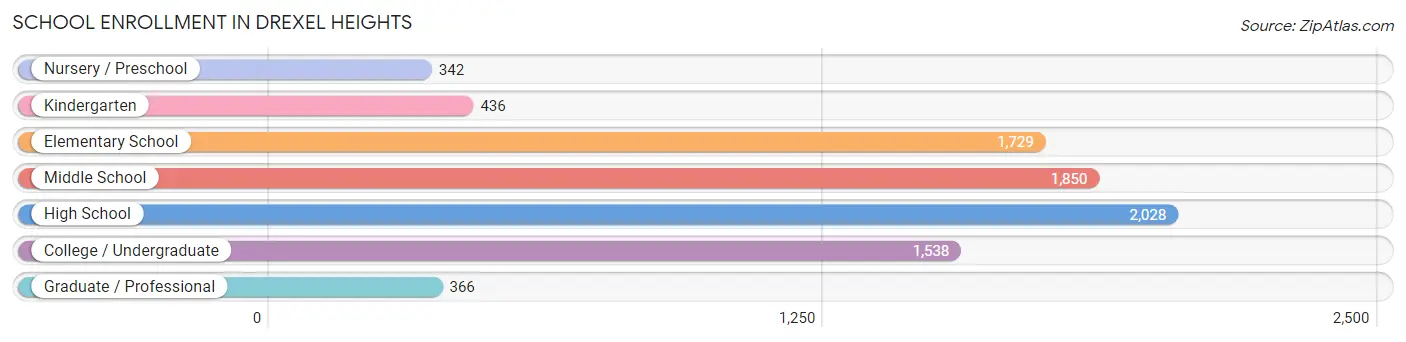
| School Level | # Students | % Students |
| Nursery / Preschool | 342 | 4.1% |
| Kindergarten | 436 | 5.3% |
| Elementary School | 1,729 | 20.9% |
| Middle School | 1,850 | 22.3% |
| High School | 2,028 | 24.5% |
| College / Undergraduate | 1,538 | 18.5% |
| Graduate / Professional | 366 | 4.4% |
| Total | 8,289 | 100.0% |
School Enrollment by Age by Funding Source in Drexel Heights
Out of a total of 8,289 students who are enrolled in schools in Drexel Heights, 904 (10.9%) attend a private institution, while the remaining 7,385 (89.1%) are enrolled in public schools. The age group of 35 years and over has the highest likelihood of being enrolled in private schools, with 341 (48.8% in the age bracket) enrolled. Conversely, the age group of 3 to 4 year olds has the lowest likelihood of being enrolled in a private school, with 330 (98.8% in the age bracket) attending a public institution.
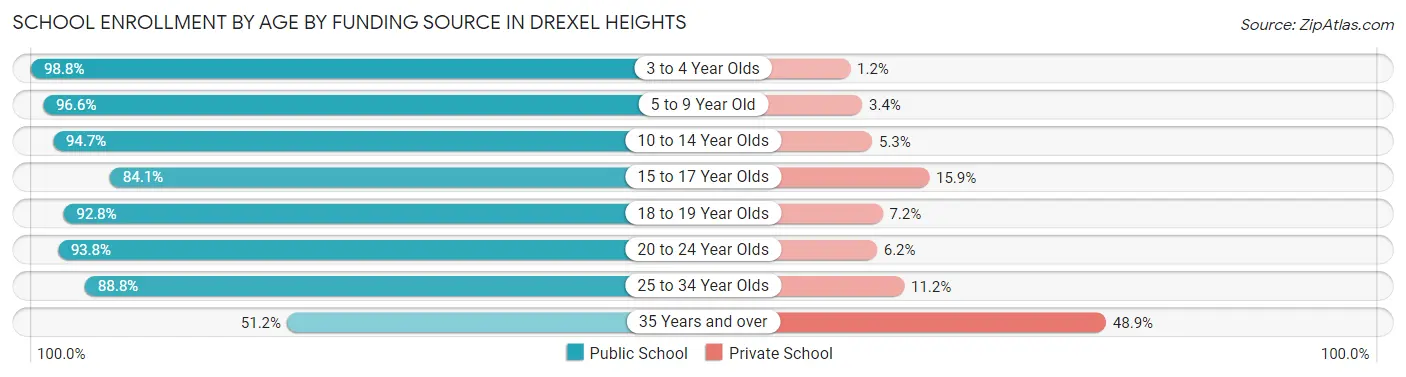
| Age Bracket | Public School | Private School |
| 3 to 4 Year Olds | 330 (98.8%) | 4 (1.2%) |
| 5 to 9 Year Old | 1,715 (96.6%) | 61 (3.4%) |
| 10 to 14 Year Olds | 2,241 (94.7%) | 125 (5.3%) |
| 15 to 17 Year Olds | 1,402 (84.1%) | 265 (15.9%) |
| 18 to 19 Year Olds | 577 (92.8%) | 45 (7.2%) |
| 20 to 24 Year Olds | 608 (93.8%) | 40 (6.2%) |
| 25 to 34 Year Olds | 158 (88.8%) | 20 (11.2%) |
| 35 Years and over | 357 (51.1%) | 341 (48.8%) |
| Total | 7,385 (89.1%) | 904 (10.9%) |
Educational Attainment by Field of Study in Drexel Heights
Business (510 | 16.6%), education (509 | 16.5%), science & technology (337 | 10.9%), engineering (327 | 10.6%), and social sciences (302 | 9.8%) are the most common fields of study among 3,080 individuals in Drexel Heights who have obtained a bachelor's degree or higher.
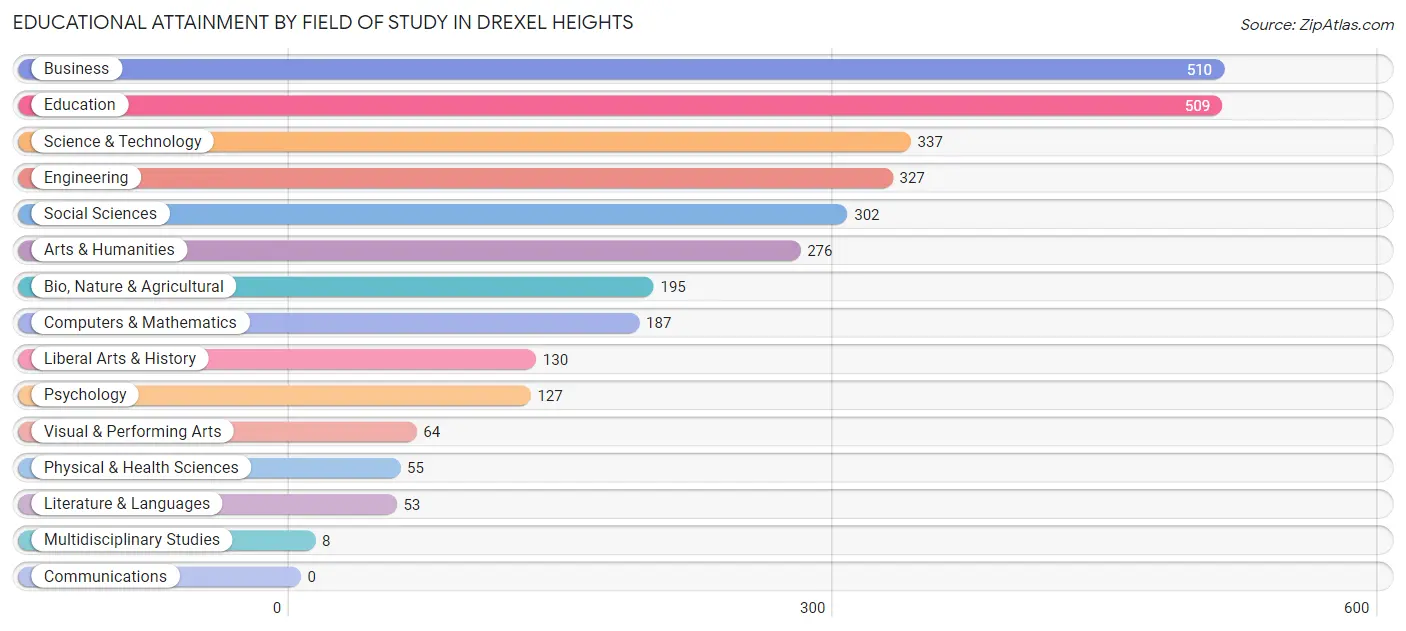
| Field of Study | # Graduates | % Graduates |
| Computers & Mathematics | 187 | 6.1% |
| Bio, Nature & Agricultural | 195 | 6.3% |
| Physical & Health Sciences | 55 | 1.8% |
| Psychology | 127 | 4.1% |
| Social Sciences | 302 | 9.8% |
| Engineering | 327 | 10.6% |
| Multidisciplinary Studies | 8 | 0.3% |
| Science & Technology | 337 | 10.9% |
| Business | 510 | 16.6% |
| Education | 509 | 16.5% |
| Literature & Languages | 53 | 1.7% |
| Liberal Arts & History | 130 | 4.2% |
| Visual & Performing Arts | 64 | 2.1% |
| Communications | 0 | 0.0% |
| Arts & Humanities | 276 | 9.0% |
| Total | 3,080 | 100.0% |
Transportation & Commute in Drexel Heights
Vehicle Availability by Sex in Drexel Heights
The most prevalent vehicle ownership categories in Drexel Heights are males with 2 vehicles (2,416, accounting for 32.6%) and females with 2 vehicles (2,047, making up 38.9%).
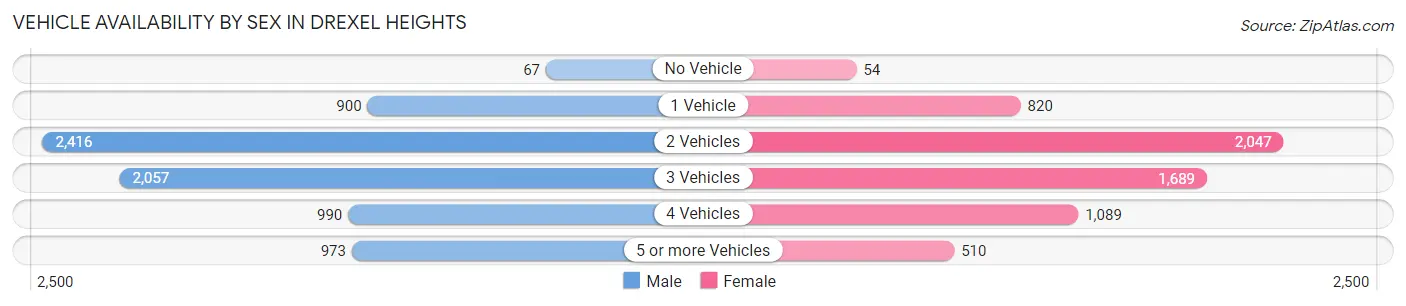
| Vehicles Available | Male | Female |
| No Vehicle | 67 (0.9%) | 54 (0.9%) |
| 1 Vehicle | 900 (12.2%) | 820 (13.2%) |
| 2 Vehicles | 2,416 (32.6%) | 2,047 (33.0%) |
| 3 Vehicles | 2,057 (27.8%) | 1,689 (27.2%) |
| 4 Vehicles | 990 (13.4%) | 1,089 (17.5%) |
| 5 or more Vehicles | 973 (13.1%) | 510 (8.2%) |
| Total | 7,403 (100.0%) | 6,209 (100.0%) |
Commute Time in Drexel Heights
The most frequently occuring commute durations in Drexel Heights are 30 to 34 minutes (2,791 commuters, 22.6%), 20 to 24 minutes (2,099 commuters, 17.0%), and 15 to 19 minutes (1,859 commuters, 15.0%).
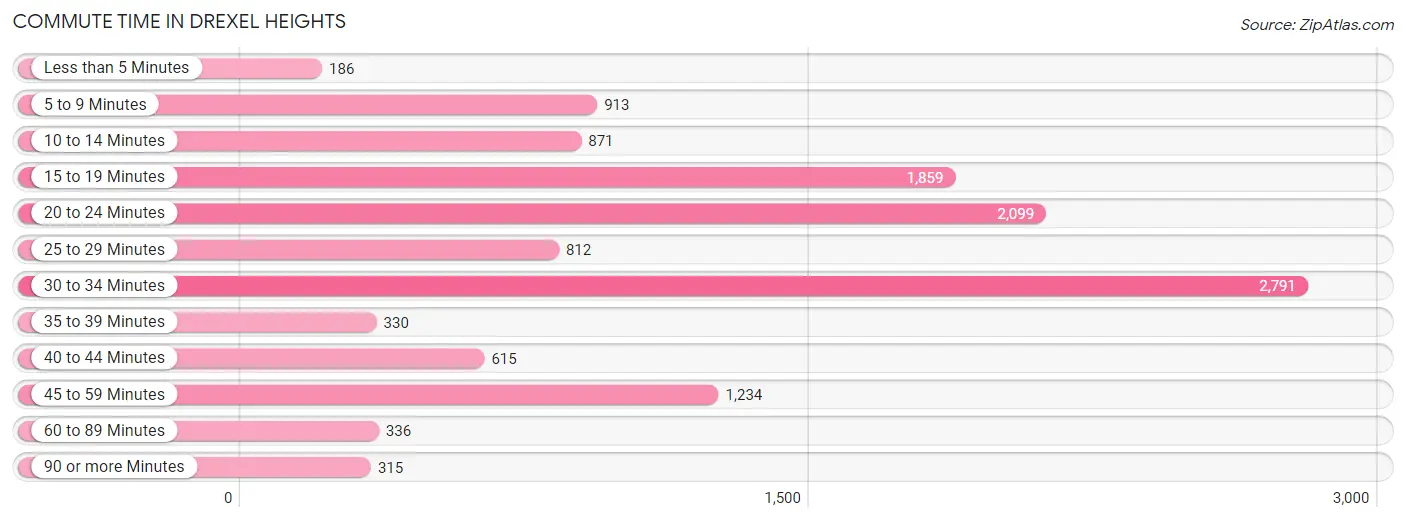
| Commute Time | # Commuters | % Commuters |
| Less than 5 Minutes | 186 | 1.5% |
| 5 to 9 Minutes | 913 | 7.4% |
| 10 to 14 Minutes | 871 | 7.0% |
| 15 to 19 Minutes | 1,859 | 15.0% |
| 20 to 24 Minutes | 2,099 | 17.0% |
| 25 to 29 Minutes | 812 | 6.6% |
| 30 to 34 Minutes | 2,791 | 22.6% |
| 35 to 39 Minutes | 330 | 2.7% |
| 40 to 44 Minutes | 615 | 5.0% |
| 45 to 59 Minutes | 1,234 | 10.0% |
| 60 to 89 Minutes | 336 | 2.7% |
| 90 or more Minutes | 315 | 2.5% |
Commute Time by Sex in Drexel Heights
The most common commute times in Drexel Heights are 30 to 34 minutes (1,444 commuters, 20.4%) for males and 30 to 34 minutes (1,347 commuters, 25.4%) for females.
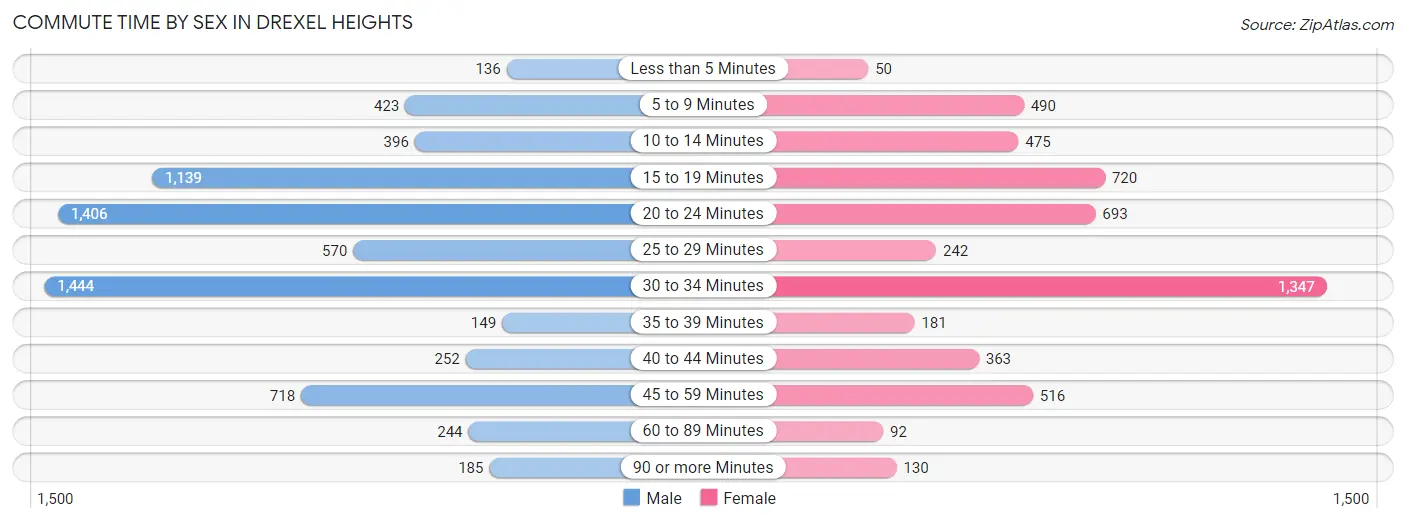
| Commute Time | Male | Female |
| Less than 5 Minutes | 136 (1.9%) | 50 (0.9%) |
| 5 to 9 Minutes | 423 (6.0%) | 490 (9.2%) |
| 10 to 14 Minutes | 396 (5.6%) | 475 (9.0%) |
| 15 to 19 Minutes | 1,139 (16.1%) | 720 (13.6%) |
| 20 to 24 Minutes | 1,406 (19.9%) | 693 (13.1%) |
| 25 to 29 Minutes | 570 (8.1%) | 242 (4.6%) |
| 30 to 34 Minutes | 1,444 (20.4%) | 1,347 (25.4%) |
| 35 to 39 Minutes | 149 (2.1%) | 181 (3.4%) |
| 40 to 44 Minutes | 252 (3.6%) | 363 (6.9%) |
| 45 to 59 Minutes | 718 (10.2%) | 516 (9.7%) |
| 60 to 89 Minutes | 244 (3.5%) | 92 (1.7%) |
| 90 or more Minutes | 185 (2.6%) | 130 (2.5%) |
Time of Departure to Work by Sex in Drexel Heights
The most frequent times of departure to work in Drexel Heights are 6:00 AM to 6:29 AM (1,093, 15.5%) for males and 7:00 AM to 7:29 AM (921, 17.4%) for females.
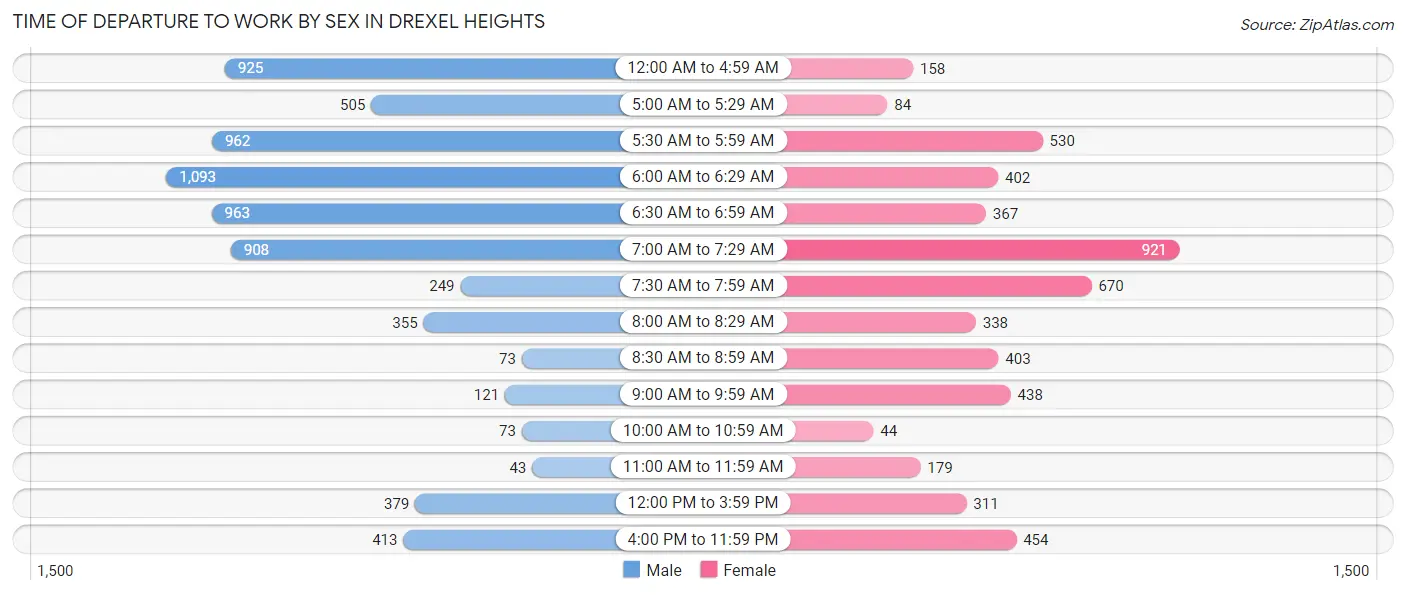
| Time of Departure | Male | Female |
| 12:00 AM to 4:59 AM | 925 (13.1%) | 158 (3.0%) |
| 5:00 AM to 5:29 AM | 505 (7.1%) | 84 (1.6%) |
| 5:30 AM to 5:59 AM | 962 (13.6%) | 530 (10.0%) |
| 6:00 AM to 6:29 AM | 1,093 (15.5%) | 402 (7.6%) |
| 6:30 AM to 6:59 AM | 963 (13.6%) | 367 (6.9%) |
| 7:00 AM to 7:29 AM | 908 (12.9%) | 921 (17.4%) |
| 7:30 AM to 7:59 AM | 249 (3.5%) | 670 (12.6%) |
| 8:00 AM to 8:29 AM | 355 (5.0%) | 338 (6.4%) |
| 8:30 AM to 8:59 AM | 73 (1.0%) | 403 (7.6%) |
| 9:00 AM to 9:59 AM | 121 (1.7%) | 438 (8.3%) |
| 10:00 AM to 10:59 AM | 73 (1.0%) | 44 (0.8%) |
| 11:00 AM to 11:59 AM | 43 (0.6%) | 179 (3.4%) |
| 12:00 PM to 3:59 PM | 379 (5.4%) | 311 (5.9%) |
| 4:00 PM to 11:59 PM | 413 (5.9%) | 454 (8.6%) |
| Total | 7,062 (100.0%) | 5,299 (100.0%) |
Housing Occupancy in Drexel Heights
Occupancy by Ownership in Drexel Heights
Of the total 9,796 dwellings in Drexel Heights, owner-occupied units account for 7,661 (78.2%), while renter-occupied units make up 2,135 (21.8%).
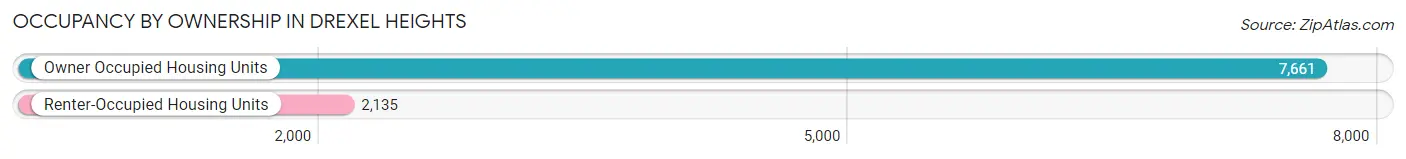
| Occupancy | # Housing Units | % Housing Units |
| Owner Occupied Housing Units | 7,661 | 78.2% |
| Renter-Occupied Housing Units | 2,135 | 21.8% |
| Total Occupied Housing Units | 9,796 | 100.0% |
Occupancy by Household Size in Drexel Heights
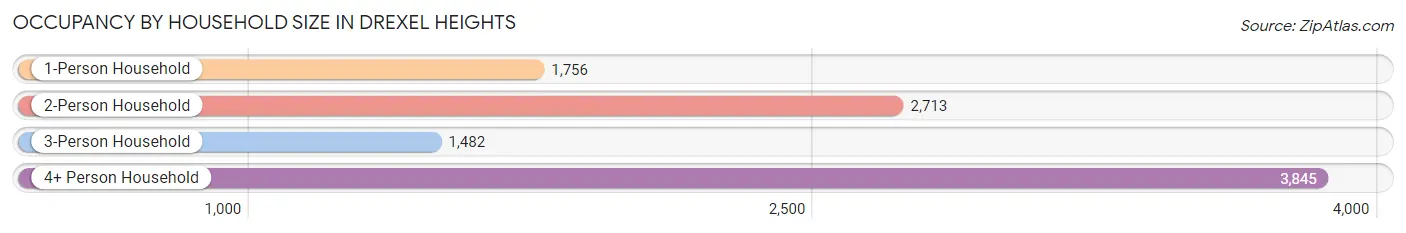
| Household Size | # Housing Units | % Housing Units |
| 1-Person Household | 1,756 | 17.9% |
| 2-Person Household | 2,713 | 27.7% |
| 3-Person Household | 1,482 | 15.1% |
| 4+ Person Household | 3,845 | 39.3% |
| Total Housing Units | 9,796 | 100.0% |
Occupancy by Ownership by Household Size in Drexel Heights
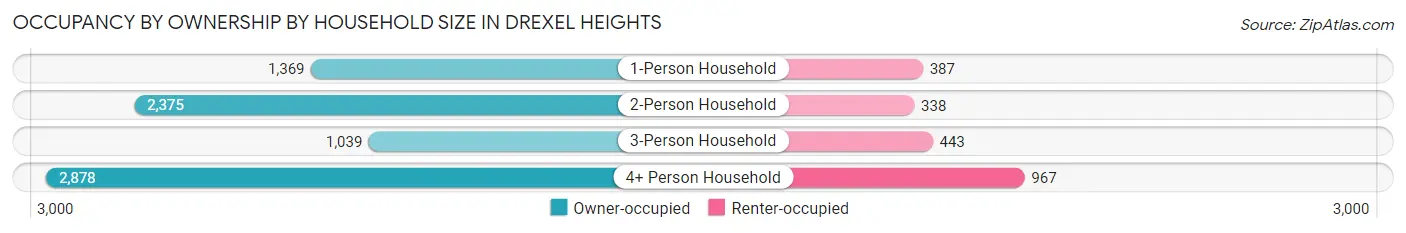
| Household Size | Owner-occupied | Renter-occupied |
| 1-Person Household | 1,369 (78.0%) | 387 (22.0%) |
| 2-Person Household | 2,375 (87.5%) | 338 (12.5%) |
| 3-Person Household | 1,039 (70.1%) | 443 (29.9%) |
| 4+ Person Household | 2,878 (74.9%) | 967 (25.2%) |
| Total Housing Units | 7,661 (78.2%) | 2,135 (21.8%) |
Occupancy by Educational Attainment in Drexel Heights
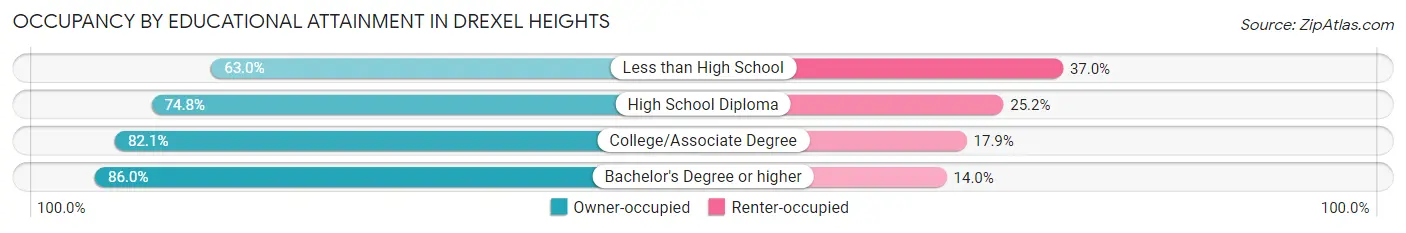
| Household Size | Owner-occupied | Renter-occupied |
| Less than High School | 811 (63.0%) | 477 (37.0%) |
| High School Diploma | 1,989 (74.8%) | 670 (25.2%) |
| College/Associate Degree | 3,543 (82.1%) | 774 (17.9%) |
| Bachelor's Degree or higher | 1,318 (86.0%) | 214 (14.0%) |
Occupancy by Age of Householder in Drexel Heights
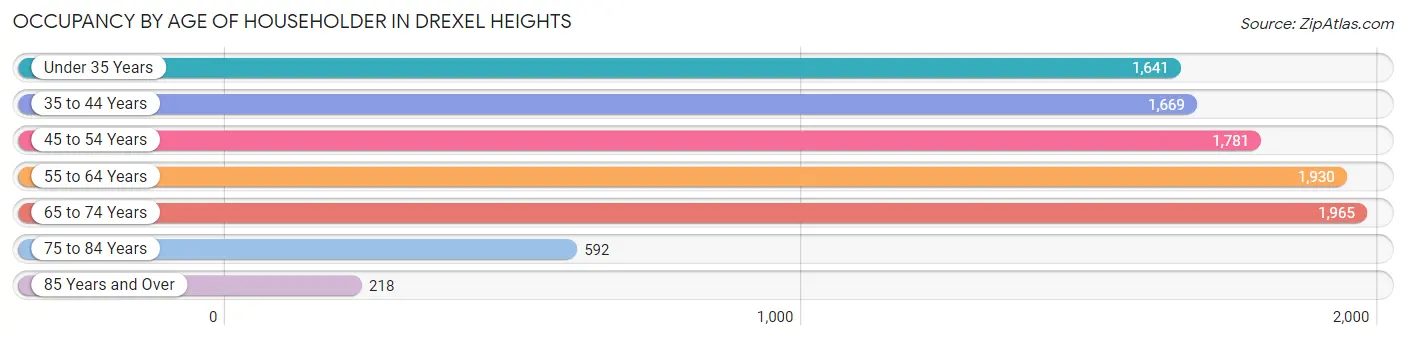
| Age Bracket | # Households | % Households |
| Under 35 Years | 1,641 | 16.8% |
| 35 to 44 Years | 1,669 | 17.0% |
| 45 to 54 Years | 1,781 | 18.2% |
| 55 to 64 Years | 1,930 | 19.7% |
| 65 to 74 Years | 1,965 | 20.1% |
| 75 to 84 Years | 592 | 6.0% |
| 85 Years and Over | 218 | 2.2% |
| Total | 9,796 | 100.0% |
Housing Finances in Drexel Heights
Median Income by Occupancy in Drexel Heights
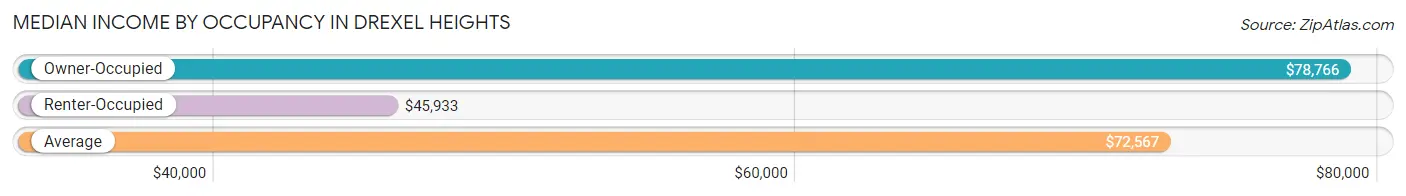
| Occupancy Type | # Households | Median Income |
| Owner-Occupied | 7,661 (78.2%) | $78,766 |
| Renter-Occupied | 2,135 (21.8%) | $45,933 |
| Average | 9,796 (100.0%) | $72,567 |
Occupancy by Householder Income Bracket in Drexel Heights
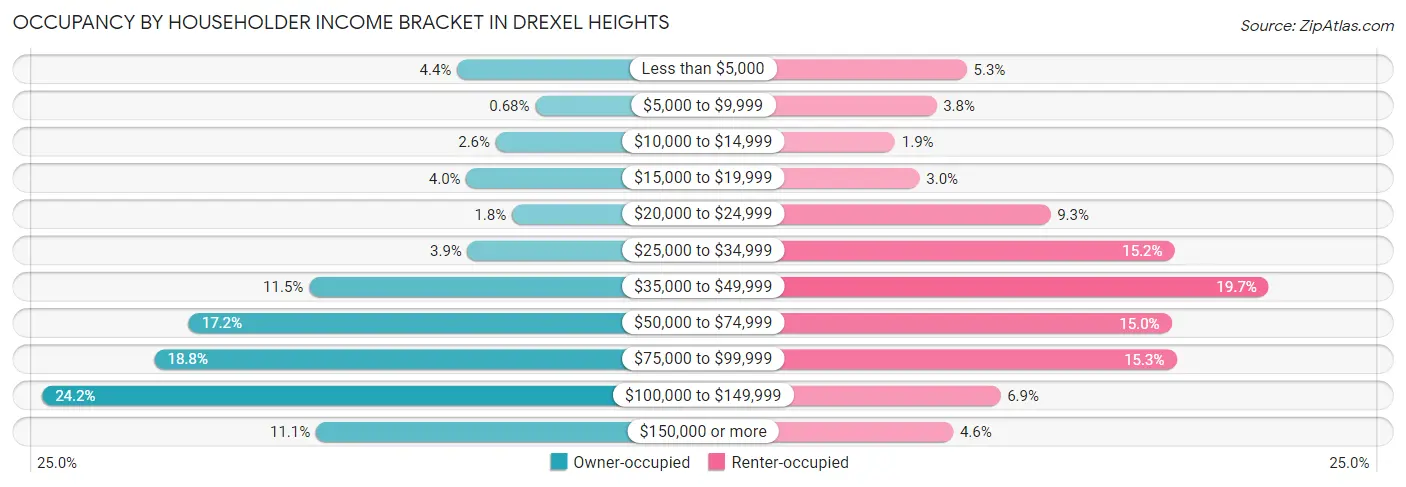
| Income Bracket | Owner-occupied | Renter-occupied |
| Less than $5,000 | 337 (4.4%) | 113 (5.3%) |
| $5,000 to $9,999 | 52 (0.7%) | 82 (3.8%) |
| $10,000 to $14,999 | 196 (2.6%) | 40 (1.9%) |
| $15,000 to $19,999 | 303 (4.0%) | 65 (3.0%) |
| $20,000 to $24,999 | 137 (1.8%) | 198 (9.3%) |
| $25,000 to $34,999 | 299 (3.9%) | 324 (15.2%) |
| $35,000 to $49,999 | 877 (11.5%) | 420 (19.7%) |
| $50,000 to $74,999 | 1,316 (17.2%) | 321 (15.0%) |
| $75,000 to $99,999 | 1,441 (18.8%) | 326 (15.3%) |
| $100,000 to $149,999 | 1,851 (24.2%) | 147 (6.9%) |
| $150,000 or more | 852 (11.1%) | 99 (4.6%) |
| Total | 7,661 (100.0%) | 2,135 (100.0%) |
Monthly Housing Cost Tiers in Drexel Heights
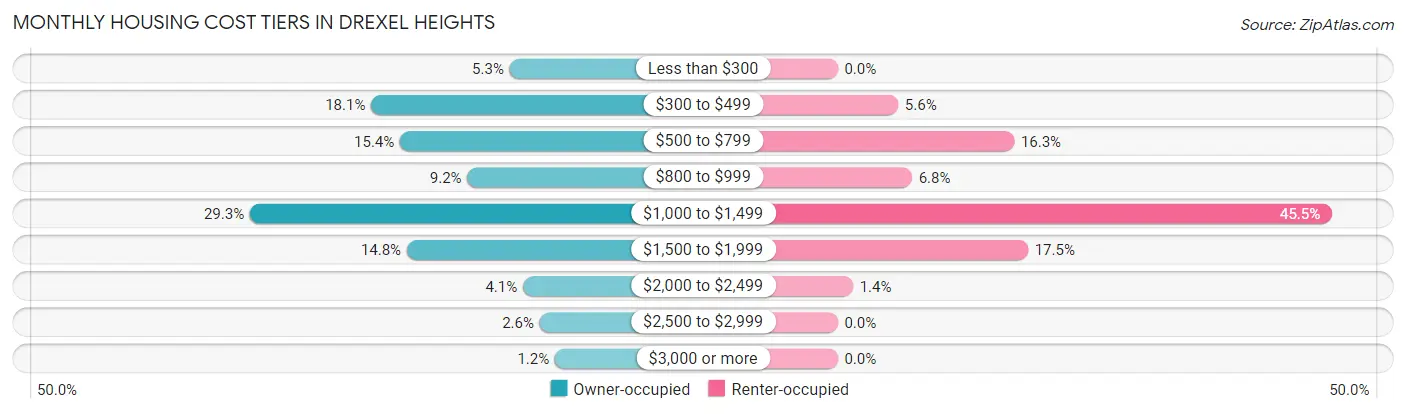
| Monthly Cost | Owner-occupied | Renter-occupied |
| Less than $300 | 409 (5.3%) | 0 (0.0%) |
| $300 to $499 | 1,386 (18.1%) | 119 (5.6%) |
| $500 to $799 | 1,182 (15.4%) | 347 (16.3%) |
| $800 to $999 | 707 (9.2%) | 146 (6.8%) |
| $1,000 to $1,499 | 2,241 (29.2%) | 972 (45.5%) |
| $1,500 to $1,999 | 1,134 (14.8%) | 374 (17.5%) |
| $2,000 to $2,499 | 315 (4.1%) | 30 (1.4%) |
| $2,500 to $2,999 | 197 (2.6%) | 0 (0.0%) |
| $3,000 or more | 90 (1.2%) | 0 (0.0%) |
| Total | 7,661 (100.0%) | 2,135 (100.0%) |
Physical Housing Characteristics in Drexel Heights
Housing Structures in Drexel Heights
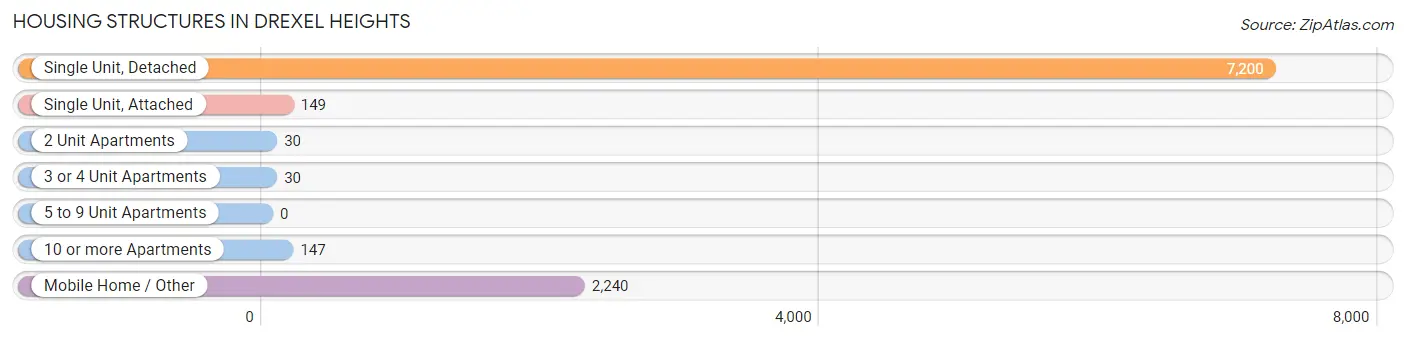
| Structure Type | # Housing Units | % Housing Units |
| Single Unit, Detached | 7,200 | 73.5% |
| Single Unit, Attached | 149 | 1.5% |
| 2 Unit Apartments | 30 | 0.3% |
| 3 or 4 Unit Apartments | 30 | 0.3% |
| 5 to 9 Unit Apartments | 0 | 0.0% |
| 10 or more Apartments | 147 | 1.5% |
| Mobile Home / Other | 2,240 | 22.9% |
| Total | 9,796 | 100.0% |
Housing Structures by Occupancy in Drexel Heights
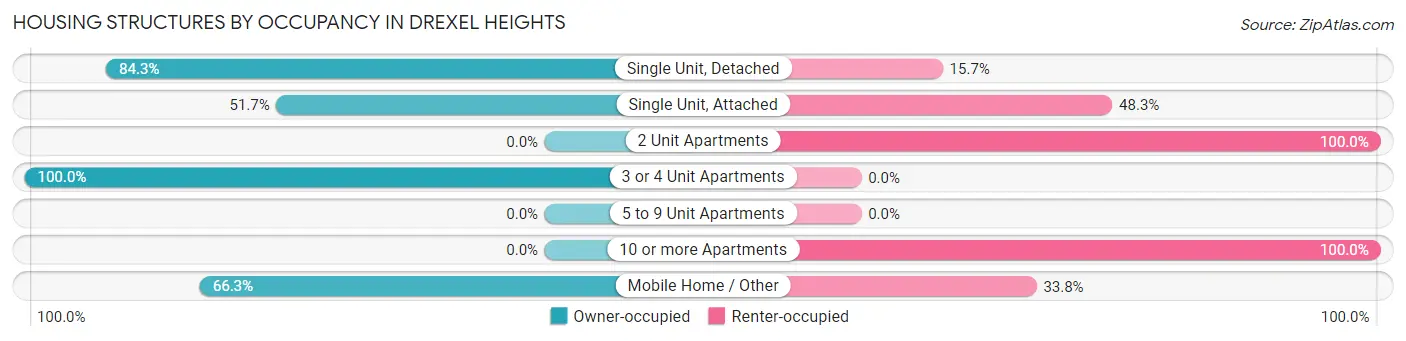
| Structure Type | Owner-occupied | Renter-occupied |
| Single Unit, Detached | 6,070 (84.3%) | 1,130 (15.7%) |
| Single Unit, Attached | 77 (51.7%) | 72 (48.3%) |
| 2 Unit Apartments | 0 (0.0%) | 30 (100.0%) |
| 3 or 4 Unit Apartments | 30 (100.0%) | 0 (0.0%) |
| 5 to 9 Unit Apartments | 0 (0.0%) | 0 (0.0%) |
| 10 or more Apartments | 0 (0.0%) | 147 (100.0%) |
| Mobile Home / Other | 1,484 (66.2%) | 756 (33.8%) |
| Total | 7,661 (78.2%) | 2,135 (21.8%) |
Housing Structures by Number of Rooms in Drexel Heights
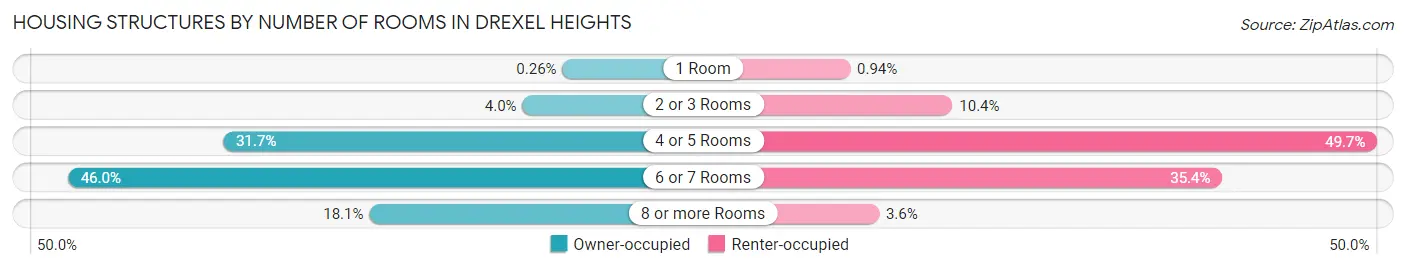
| Number of Rooms | Owner-occupied | Renter-occupied |
| 1 Room | 20 (0.3%) | 20 (0.9%) |
| 2 or 3 Rooms | 303 (4.0%) | 222 (10.4%) |
| 4 or 5 Rooms | 2,425 (31.7%) | 1,061 (49.7%) |
| 6 or 7 Rooms | 3,525 (46.0%) | 755 (35.4%) |
| 8 or more Rooms | 1,388 (18.1%) | 77 (3.6%) |
| Total | 7,661 (100.0%) | 2,135 (100.0%) |
Housing Structure by Heating Type in Drexel Heights
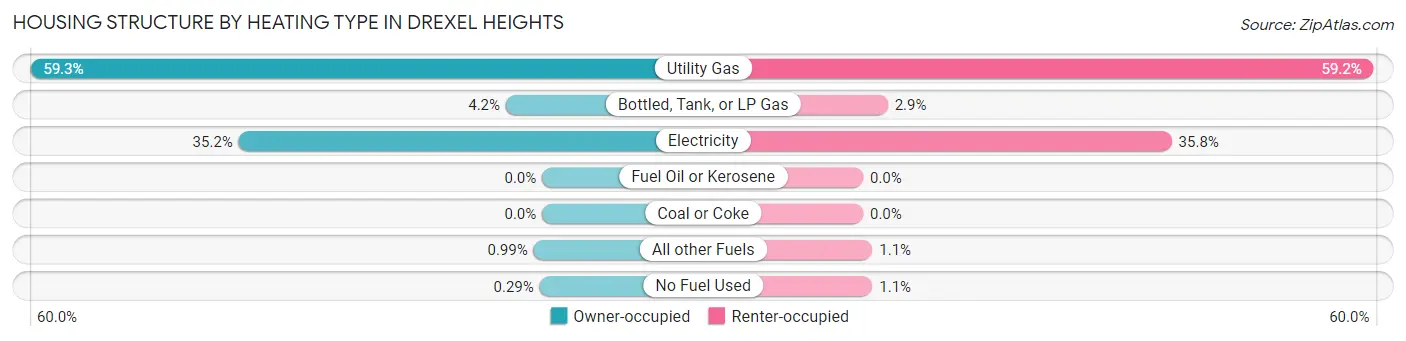
| Heating Type | Owner-occupied | Renter-occupied |
| Utility Gas | 4,546 (59.3%) | 1,264 (59.2%) |
| Bottled, Tank, or LP Gas | 322 (4.2%) | 61 (2.9%) |
| Electricity | 2,695 (35.2%) | 764 (35.8%) |
| Fuel Oil or Kerosene | 0 (0.0%) | 0 (0.0%) |
| Coal or Coke | 0 (0.0%) | 0 (0.0%) |
| All other Fuels | 76 (1.0%) | 23 (1.1%) |
| No Fuel Used | 22 (0.3%) | 23 (1.1%) |
| Total | 7,661 (100.0%) | 2,135 (100.0%) |
Household Vehicle Usage in Drexel Heights
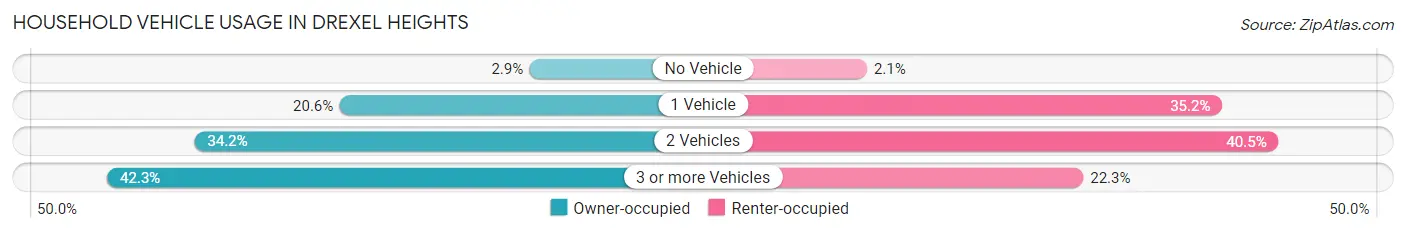
| Vehicles per Household | Owner-occupied | Renter-occupied |
| No Vehicle | 223 (2.9%) | 44 (2.1%) |
| 1 Vehicle | 1,581 (20.6%) | 752 (35.2%) |
| 2 Vehicles | 2,616 (34.2%) | 864 (40.5%) |
| 3 or more Vehicles | 3,241 (42.3%) | 475 (22.3%) |
| Total | 7,661 (100.0%) | 2,135 (100.0%) |
Real Estate & Mortgages in Drexel Heights
Real Estate and Mortgage Overview in Drexel Heights
| Characteristic | Without Mortgage | With Mortgage |
| Housing Units | 2,865 | 4,796 |
| Median Property Value | $173,800 | $213,200 |
| Median Household Income | $66,181 | $527 |
| Monthly Housing Costs | $456 | $79 |
| Real Estate Taxes | $1,639 | $236 |
Property Value by Mortgage Status in Drexel Heights
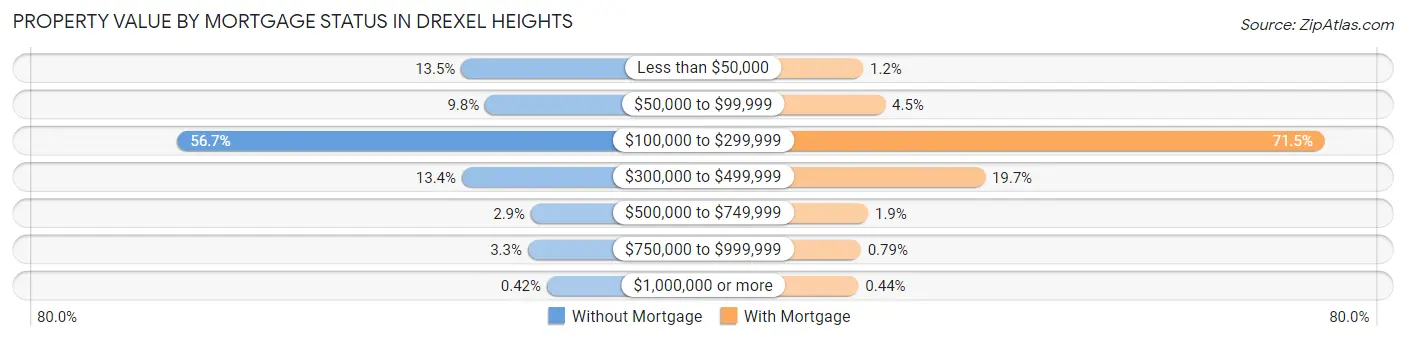
| Property Value | Without Mortgage | With Mortgage |
| Less than $50,000 | 386 (13.5%) | 55 (1.1%) |
| $50,000 to $99,999 | 282 (9.8%) | 216 (4.5%) |
| $100,000 to $299,999 | 1,625 (56.7%) | 3,429 (71.5%) |
| $300,000 to $499,999 | 383 (13.4%) | 946 (19.7%) |
| $500,000 to $749,999 | 82 (2.9%) | 91 (1.9%) |
| $750,000 to $999,999 | 95 (3.3%) | 38 (0.8%) |
| $1,000,000 or more | 12 (0.4%) | 21 (0.4%) |
| Total | 2,865 (100.0%) | 4,796 (100.0%) |
Household Income by Mortgage Status in Drexel Heights
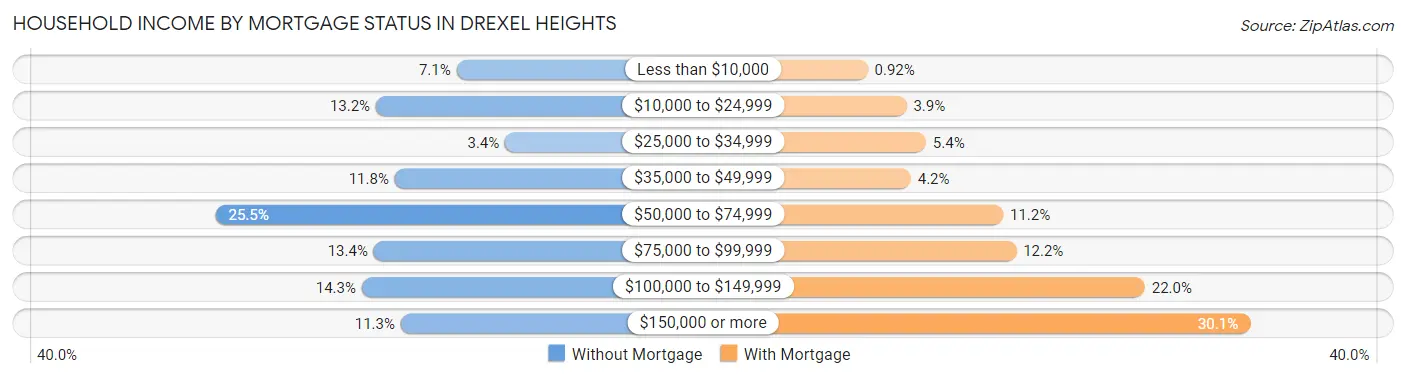
| Household Income | Without Mortgage | With Mortgage |
| Less than $10,000 | 203 (7.1%) | 44 (0.9%) |
| $10,000 to $24,999 | 379 (13.2%) | 186 (3.9%) |
| $25,000 to $34,999 | 97 (3.4%) | 257 (5.4%) |
| $35,000 to $49,999 | 338 (11.8%) | 202 (4.2%) |
| $50,000 to $74,999 | 729 (25.5%) | 539 (11.2%) |
| $75,000 to $99,999 | 384 (13.4%) | 587 (12.2%) |
| $100,000 to $149,999 | 410 (14.3%) | 1,057 (22.0%) |
| $150,000 or more | 325 (11.3%) | 1,441 (30.0%) |
| Total | 2,865 (100.0%) | 4,796 (100.0%) |
Property Value to Household Income Ratio in Drexel Heights
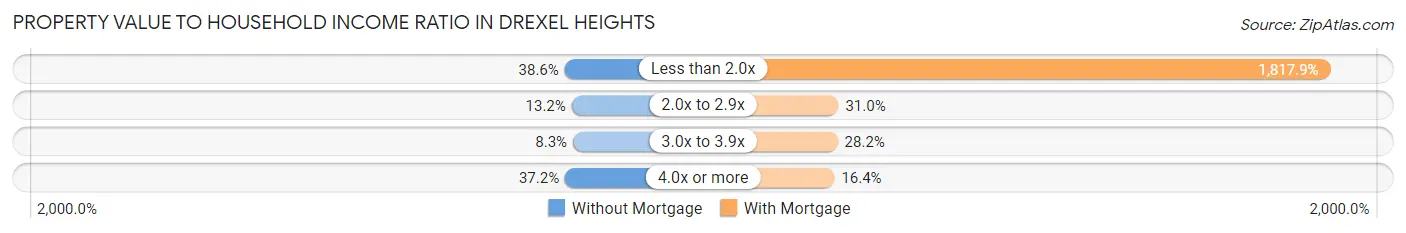
| Value-to-Income Ratio | Without Mortgage | With Mortgage |
| Less than 2.0x | 1,106 (38.6%) | 87,184 (1,817.8%) |
| 2.0x to 2.9x | 377 (13.2%) | 1,487 (31.0%) |
| 3.0x to 3.9x | 238 (8.3%) | 1,350 (28.1%) |
| 4.0x or more | 1,066 (37.2%) | 788 (16.4%) |
| Total | 2,865 (100.0%) | 4,796 (100.0%) |
Real Estate Taxes by Mortgage Status in Drexel Heights
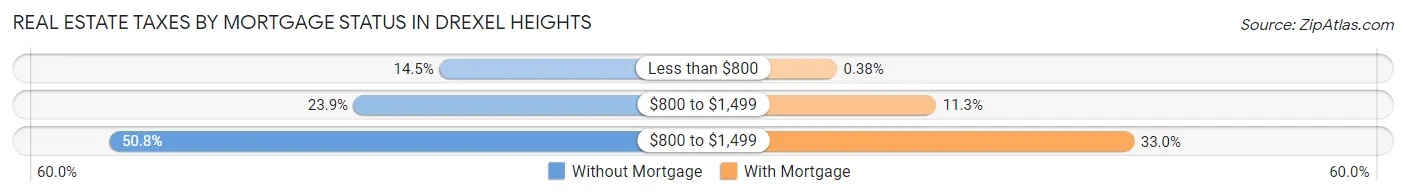
| Property Taxes | Without Mortgage | With Mortgage |
| Less than $800 | 416 (14.5%) | 18 (0.4%) |
| $800 to $1,499 | 685 (23.9%) | 540 (11.3%) |
| $800 to $1,499 | 1,454 (50.7%) | 1,581 (33.0%) |
| Total | 2,865 (100.0%) | 4,796 (100.0%) |
Health & Disability in Drexel Heights
Health Insurance Coverage by Age in Drexel Heights
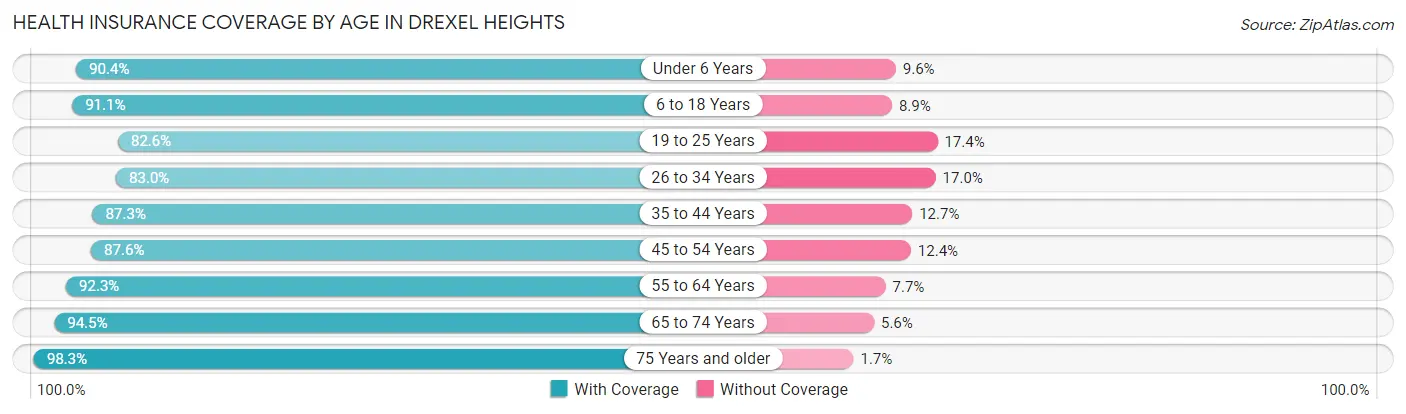
| Age Bracket | With Coverage | Without Coverage |
| Under 6 Years | 2,060 (90.4%) | 219 (9.6%) |
| 6 to 18 Years | 5,421 (91.1%) | 529 (8.9%) |
| 19 to 25 Years | 2,871 (82.6%) | 604 (17.4%) |
| 26 to 34 Years | 2,556 (83.0%) | 525 (17.0%) |
| 35 to 44 Years | 3,053 (87.3%) | 443 (12.7%) |
| 45 to 54 Years | 3,358 (87.6%) | 476 (12.4%) |
| 55 to 64 Years | 3,198 (92.3%) | 267 (7.7%) |
| 65 to 74 Years | 3,113 (94.5%) | 183 (5.6%) |
| 75 Years and older | 1,256 (98.3%) | 22 (1.7%) |
| Total | 26,886 (89.2%) | 3,268 (10.8%) |
Health Insurance Coverage by Citizenship Status in Drexel Heights
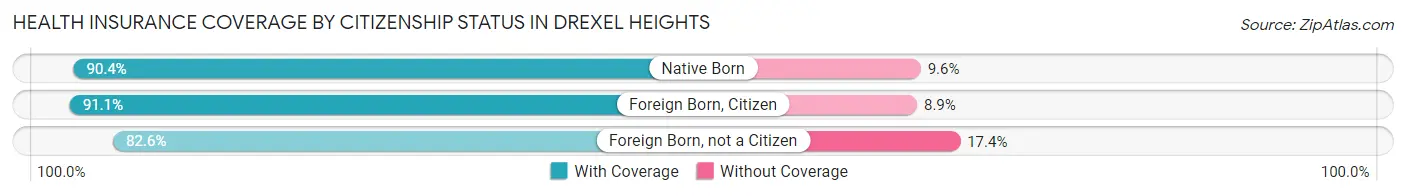
| Citizenship Status | With Coverage | Without Coverage |
| Native Born | 2,060 (90.4%) | 219 (9.6%) |
| Foreign Born, Citizen | 5,421 (91.1%) | 529 (8.9%) |
| Foreign Born, not a Citizen | 2,871 (82.6%) | 604 (17.4%) |
Health Insurance Coverage by Household Income in Drexel Heights
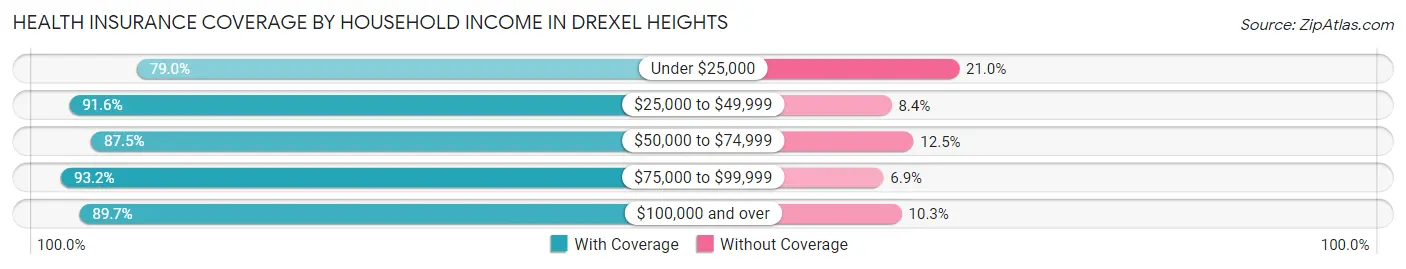
| Household Income | With Coverage | Without Coverage |
| Under $25,000 | 2,689 (79.0%) | 716 (21.0%) |
| $25,000 to $49,999 | 4,453 (91.6%) | 407 (8.4%) |
| $50,000 to $74,999 | 3,971 (87.5%) | 566 (12.5%) |
| $75,000 to $99,999 | 5,457 (93.1%) | 401 (6.9%) |
| $100,000 and over | 10,226 (89.7%) | 1,171 (10.3%) |
Public vs Private Health Insurance Coverage by Age in Drexel Heights
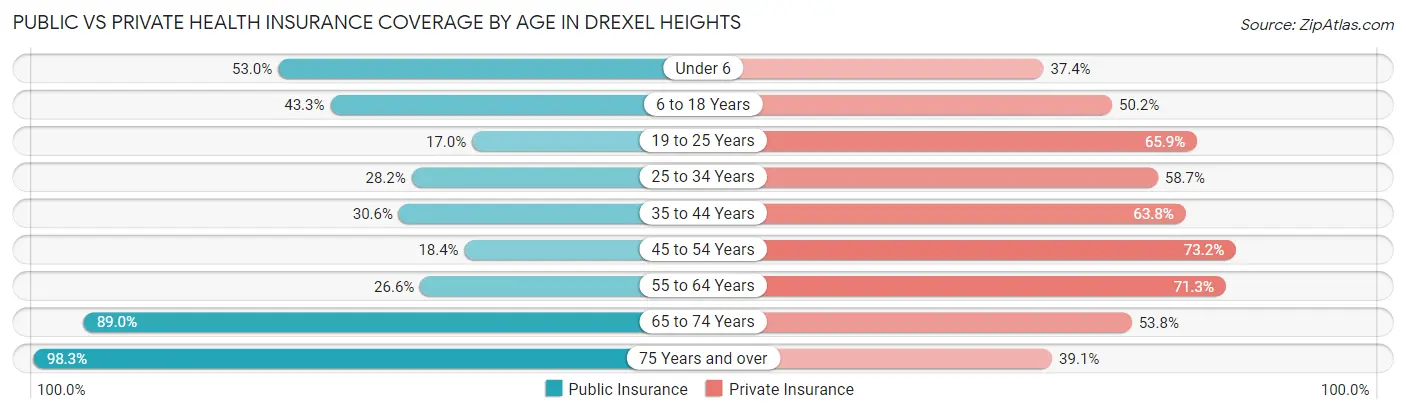
| Age Bracket | Public Insurance | Private Insurance |
| Under 6 | 1,207 (53.0%) | 853 (37.4%) |
| 6 to 18 Years | 2,574 (43.3%) | 2,985 (50.2%) |
| 19 to 25 Years | 589 (17.0%) | 2,291 (65.9%) |
| 25 to 34 Years | 868 (28.2%) | 1,807 (58.7%) |
| 35 to 44 Years | 1,068 (30.5%) | 2,231 (63.8%) |
| 45 to 54 Years | 704 (18.4%) | 2,805 (73.2%) |
| 55 to 64 Years | 921 (26.6%) | 2,469 (71.3%) |
| 65 to 74 Years | 2,934 (89.0%) | 1,774 (53.8%) |
| 75 Years and over | 1,256 (98.3%) | 499 (39.1%) |
| Total | 12,121 (40.2%) | 17,714 (58.8%) |
Disability Status by Sex by Age in Drexel Heights
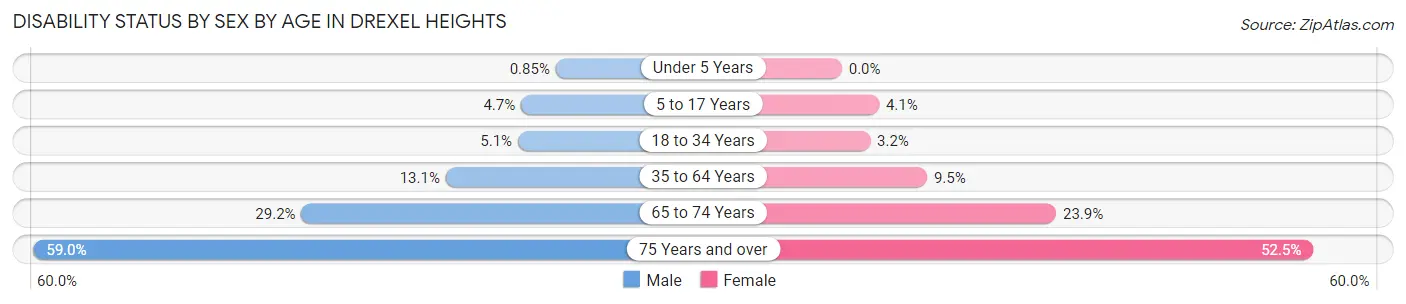
| Age Bracket | Male | Female |
| Under 5 Years | 8 (0.9%) | 0 (0.0%) |
| 5 to 17 Years | 120 (4.7%) | 142 (4.1%) |
| 18 to 34 Years | 174 (5.1%) | 107 (3.2%) |
| 35 to 64 Years | 724 (13.1%) | 500 (9.5%) |
| 65 to 74 Years | 470 (29.2%) | 402 (23.9%) |
| 75 Years and over | 389 (59.0%) | 325 (52.5%) |
Disability Class by Sex by Age in Drexel Heights
Disability Class: Hearing Difficulty
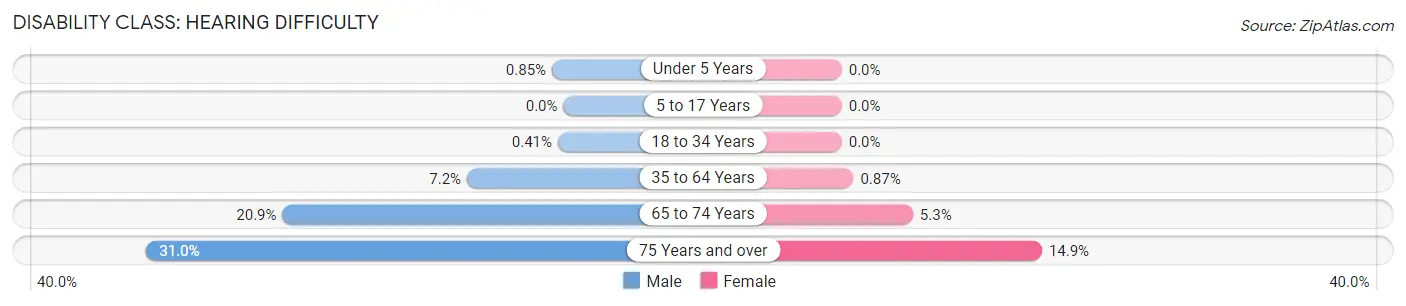
| Age Bracket | Male | Female |
| Under 5 Years | 8 (0.9%) | 0 (0.0%) |
| 5 to 17 Years | 0 (0.0%) | 0 (0.0%) |
| 18 to 34 Years | 14 (0.4%) | 0 (0.0%) |
| 35 to 64 Years | 396 (7.2%) | 46 (0.9%) |
| 65 to 74 Years | 336 (20.9%) | 89 (5.3%) |
| 75 Years and over | 204 (31.0%) | 92 (14.9%) |
Disability Class: Vision Difficulty
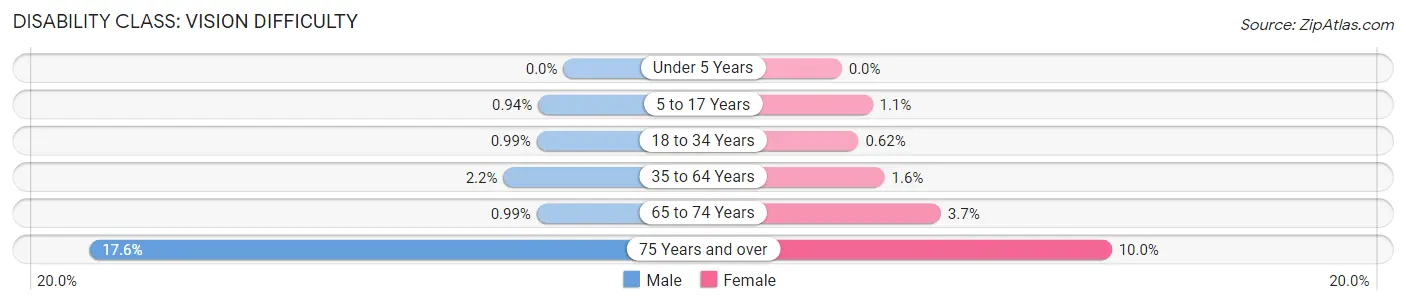
| Age Bracket | Male | Female |
| Under 5 Years | 0 (0.0%) | 0 (0.0%) |
| 5 to 17 Years | 24 (0.9%) | 39 (1.1%) |
| 18 to 34 Years | 34 (1.0%) | 21 (0.6%) |
| 35 to 64 Years | 123 (2.2%) | 84 (1.6%) |
| 65 to 74 Years | 16 (1.0%) | 62 (3.7%) |
| 75 Years and over | 116 (17.6%) | 62 (10.0%) |
Disability Class: Cognitive Difficulty
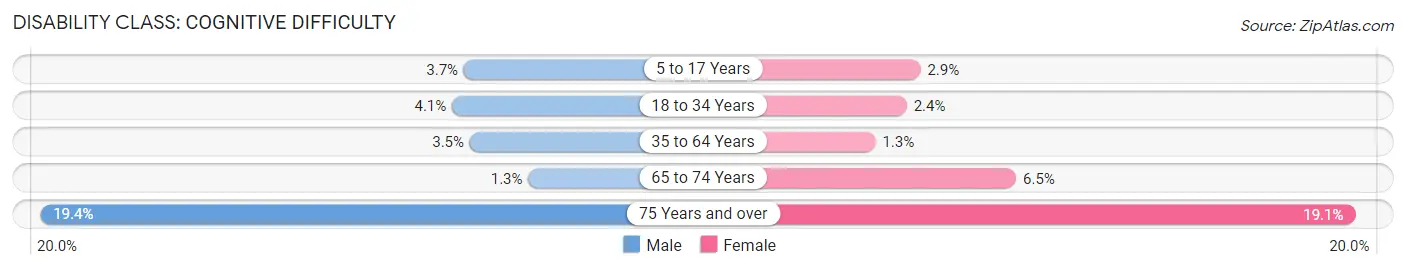
| Age Bracket | Male | Female |
| 5 to 17 Years | 94 (3.7%) | 100 (2.9%) |
| 18 to 34 Years | 142 (4.1%) | 82 (2.4%) |
| 35 to 64 Years | 192 (3.5%) | 66 (1.3%) |
| 65 to 74 Years | 21 (1.3%) | 109 (6.5%) |
| 75 Years and over | 128 (19.4%) | 118 (19.1%) |
Disability Class: Ambulatory Difficulty
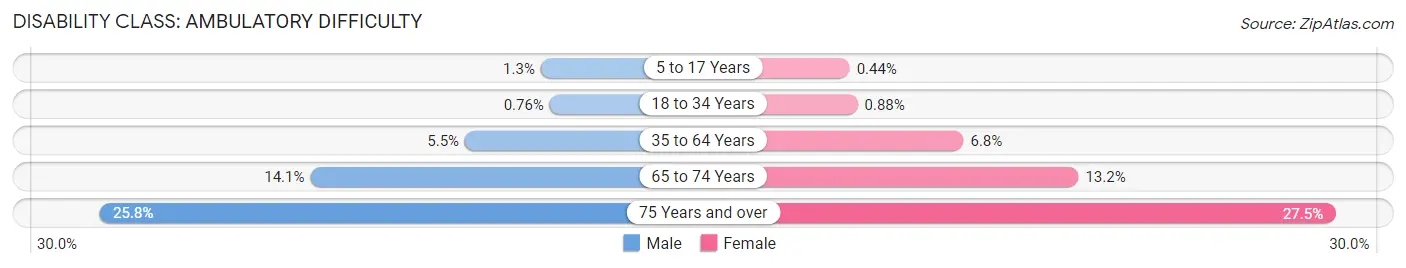
| Age Bracket | Male | Female |
| 5 to 17 Years | 32 (1.3%) | 15 (0.4%) |
| 18 to 34 Years | 26 (0.8%) | 30 (0.9%) |
| 35 to 64 Years | 303 (5.5%) | 357 (6.8%) |
| 65 to 74 Years | 227 (14.1%) | 222 (13.2%) |
| 75 Years and over | 170 (25.8%) | 170 (27.5%) |
Disability Class: Self-Care Difficulty
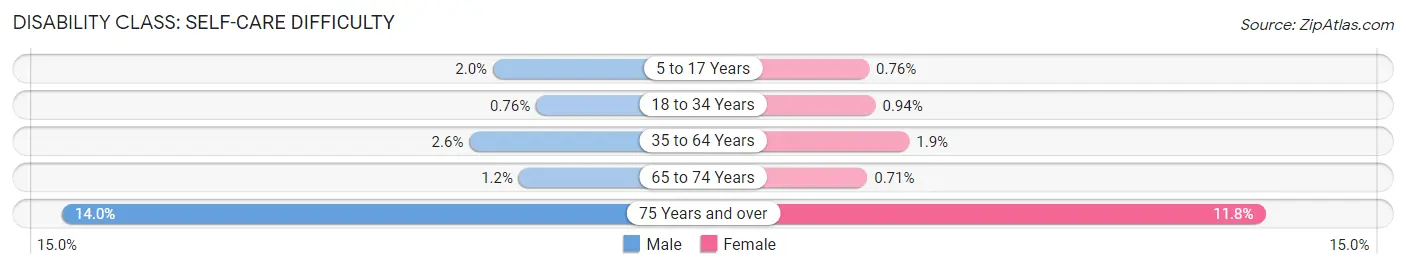
| Age Bracket | Male | Female |
| 5 to 17 Years | 50 (2.0%) | 26 (0.8%) |
| 18 to 34 Years | 26 (0.8%) | 32 (0.9%) |
| 35 to 64 Years | 145 (2.6%) | 99 (1.9%) |
| 65 to 74 Years | 20 (1.2%) | 12 (0.7%) |
| 75 Years and over | 92 (14.0%) | 73 (11.8%) |
Technology Access in Drexel Heights
Computing Device Access in Drexel Heights
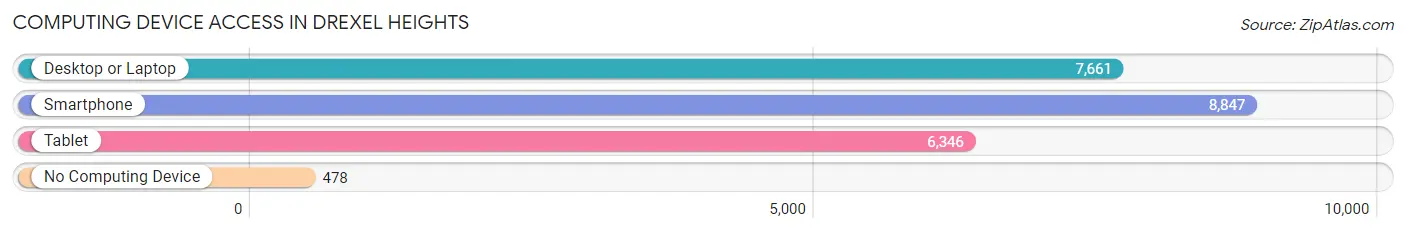
| Device Type | # Households | % Households |
| Desktop or Laptop | 7,661 | 78.2% |
| Smartphone | 8,847 | 90.3% |
| Tablet | 6,346 | 64.8% |
| No Computing Device | 478 | 4.9% |
| Total | 9,796 | 100.0% |
Internet Access in Drexel Heights
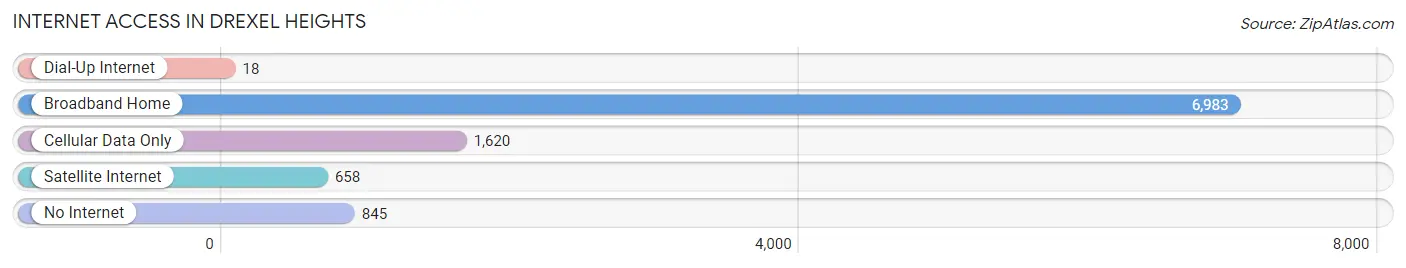
| Internet Type | # Households | % Households |
| Dial-Up Internet | 18 | 0.2% |
| Broadband Home | 6,983 | 71.3% |
| Cellular Data Only | 1,620 | 16.5% |
| Satellite Internet | 658 | 6.7% |
| No Internet | 845 | 8.6% |
| Total | 9,796 | 100.0% |
Drexel Heights Summary
Drexel Heights is an unincorporated community located in Pima County, Arizona. It is located in the Tucson metropolitan area and is part of the Tucson-Nogales Combined Statistical Area. The population of Drexel Heights was estimated to be 24,837 in 2019.
History
Drexel Heights was originally part of the San Xavier Indian Reservation, which was established in 1874. The reservation was dissolved in 1891 and the land was opened up for homesteading. The area was named after the Drexel family, who were among the first settlers in the area.
The area was largely rural until the 1950s, when the Tucson Air Force Base was established nearby. This brought an influx of military personnel and their families to the area, and the population of Drexel Heights began to grow rapidly.
In the 1960s, the area was annexed by the City of Tucson and the population continued to grow. In the 1970s, the area was incorporated as the Town of Drexel Heights. The town was dissolved in the 1980s, but the area still retains its name.
Geography
Drexel Heights is located in the Sonoran Desert, at an elevation of 2,400 feet. The area is bordered by the Santa Cruz River to the north, the Tucson Mountains to the east, and the Tucson Air Force Base to the south.
The climate in Drexel Heights is hot and dry, with temperatures ranging from the mid-90s in the summer to the mid-50s in the winter. The area receives an average of 11 inches of rain per year.
Economy
The economy of Drexel Heights is largely based on the military presence at the Tucson Air Force Base. The base provides jobs for many of the area’s residents, as well as a large number of contractors and suppliers.
In addition, the area is home to a number of small businesses, including restaurants, retail stores, and service providers. The area also has a number of light industrial and manufacturing businesses.
Demographics
As of 2019, the population of Drexel Heights was estimated to be 24,837. The population is largely Hispanic, with a median age of 33. The median household income is $45,000, and the median home value is $150,000.
The area is served by the Tucson Unified School District, which includes several elementary schools, a middle school, and a high school. The area is also home to a number of private schools, including a Catholic school and a Montessori school.
Conclusion
Drexel Heights is an unincorporated community located in Pima County, Arizona. It is part of the Tucson metropolitan area and is home to a population of 24,837. The area is largely Hispanic, with a median age of 33 and a median household income of $45,000. The economy of Drexel Heights is largely based on the military presence at the Tucson Air Force Base, as well as a number of small businesses and light industrial and manufacturing businesses. The area is served by the Tucson Unified School District, as well as a number of private schools.
Common Questions
What is Per Capita Income in Drexel Heights?
Per Capita income in Drexel Heights is $27,115.
What is the Median Family Income in Drexel Heights?
Median Family Income in Drexel Heights is $75,725.
What is the Median Household income in Drexel Heights?
Median Household Income in Drexel Heights is $72,567.
What is Income or Wage Gap in Drexel Heights?
Income or Wage Gap in Drexel Heights is 25.2%.
Women in Drexel Heights earn 74.8 cents for every dollar earned by a man.
What is Family Income Deficit in Drexel Heights?
Family Income Deficit in Drexel Heights is $15,279.
Families that are below poverty line in Drexel Heights earn $15,279 less on average than the poverty threshold level.
What is Inequality or Gini Index in Drexel Heights?
Inequality or Gini Index in Drexel Heights is 0.39.
What is the Total Population of Drexel Heights?
Total Population of Drexel Heights is 30,254.
What is the Total Male Population of Drexel Heights?
Total Male Population of Drexel Heights is 14,812.
What is the Total Female Population of Drexel Heights?
Total Female Population of Drexel Heights is 15,442.
What is the Ratio of Males per 100 Females in Drexel Heights?
There are 95.92 Males per 100 Females in Drexel Heights.
What is the Ratio of Females per 100 Males in Drexel Heights?
There are 104.25 Females per 100 Males in Drexel Heights.
What is the Median Population Age in Drexel Heights?
Median Population Age in Drexel Heights is 35.7 Years.
What is the Average Family Size in Drexel Heights
Average Family Size in Drexel Heights is 3.4 People.
What is the Average Household Size in Drexel Heights
Average Household Size in Drexel Heights is 3.1 People.
How Large is the Labor Force in Drexel Heights?
There are 14,443 People in the Labor Forcein in Drexel Heights.
What is the Percentage of People in the Labor Force in Drexel Heights?
61.2% of People are in the Labor Force in Drexel Heights.
What is the Unemployment Rate in Drexel Heights?
Unemployment Rate in Drexel Heights is 4.7%.