Reeltown, AL Map & Demographics
Reeltown Map

Reeltown Overview
$23,091
PER CAPITA INCOME
$55,417
AVG FAMILY INCOME
$36,250
AVG HOUSEHOLD INCOME
0.46
INEQUALITY / GINI INDEX
462
TOTAL POPULATION
206
MALE POPULATION
256
FEMALE POPULATION
80.47
MALES / 100 FEMALES
124.27
FEMALES / 100 MALES
34.7
MEDIAN AGE
2.6
AVG FAMILY SIZE
2.6
AVG HOUSEHOLD SIZE
256
LABOR FORCE [ PEOPLE ]
72.5%
PERCENT IN LABOR FORCE
13.3%
UNEMPLOYMENT RATE
Income in Reeltown
Income Overview in Reeltown
Per Capita Income in Reeltown is $23,091, while median incomes of families and households are $55,417 and $36,250 respectively.
| Characteristic | Number | Measure |
| Per Capita Income | 462 | $23,091 |
| Median Family Income | 145 | $55,417 |
| Mean Family Income | 145 | $59,473 |
| Median Household Income | 176 | $36,250 |
| Mean Household Income | 176 | $58,097 |
| Income Deficit | 145 | $0 |
| Wage / Income Gap (%) | 462 | 0.00% |
| Wage / Income Gap ($) | 462 | 100.00¢ per $1 |
| Gini / Inequality Index | 462 | 0.46 |
Earnings by Sex in Reeltown
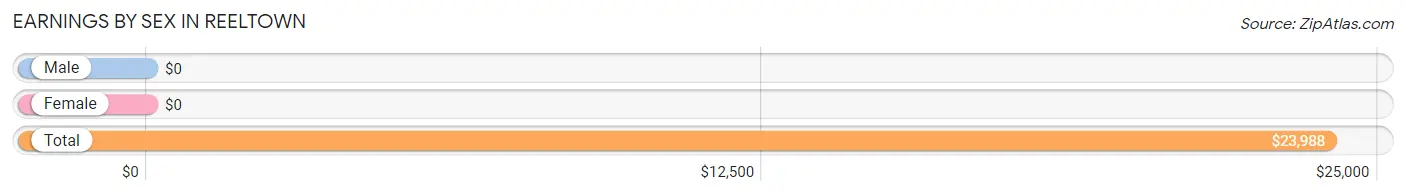
| Sex | Number | Average Earnings |
| Male | 103 (40.2%) | $0 |
| Female | 153 (59.8%) | $0 |
| Total | 256 (100.0%) | $23,988 |
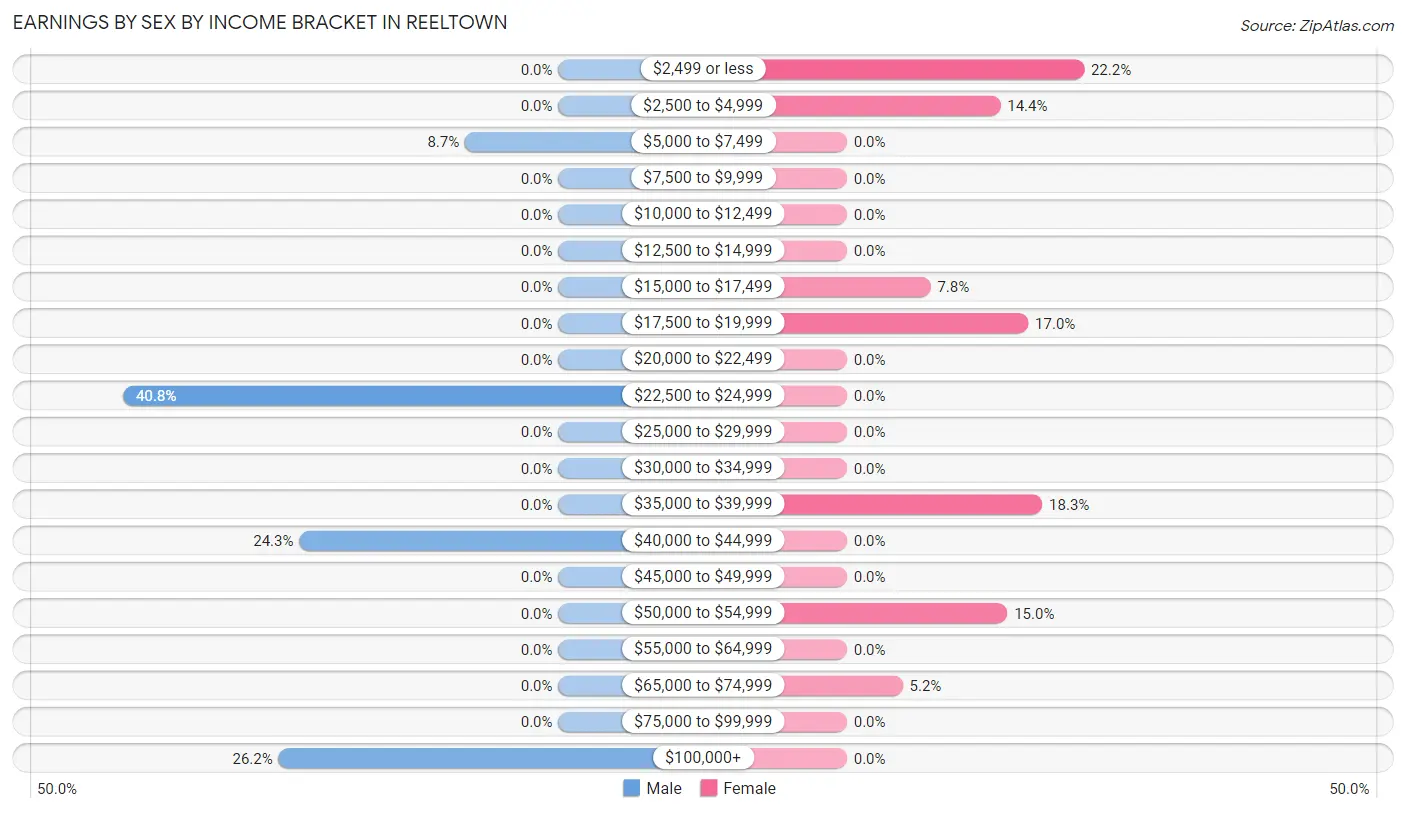
Earnings by Sex by Income Bracket in Reeltown
The most common earnings brackets in Reeltown are $22,500 to $24,999 for men (42 | 40.8%) and $2,499 or less for women (34 | 22.2%).
| Income | Male | Female |
| $2,499 or less | 0 (0.0%) | 34 (22.2%) |
| $2,500 to $4,999 | 0 (0.0%) | 22 (14.4%) |
| $5,000 to $7,499 | 9 (8.7%) | 0 (0.0%) |
| $7,500 to $9,999 | 0 (0.0%) | 0 (0.0%) |
| $10,000 to $12,499 | 0 (0.0%) | 0 (0.0%) |
| $12,500 to $14,999 | 0 (0.0%) | 0 (0.0%) |
| $15,000 to $17,499 | 0 (0.0%) | 12 (7.8%) |
| $17,500 to $19,999 | 0 (0.0%) | 26 (17.0%) |
| $20,000 to $22,499 | 0 (0.0%) | 0 (0.0%) |
| $22,500 to $24,999 | 42 (40.8%) | 0 (0.0%) |
| $25,000 to $29,999 | 0 (0.0%) | 0 (0.0%) |
| $30,000 to $34,999 | 0 (0.0%) | 0 (0.0%) |
| $35,000 to $39,999 | 0 (0.0%) | 28 (18.3%) |
| $40,000 to $44,999 | 25 (24.3%) | 0 (0.0%) |
| $45,000 to $49,999 | 0 (0.0%) | 0 (0.0%) |
| $50,000 to $54,999 | 0 (0.0%) | 23 (15.0%) |
| $55,000 to $64,999 | 0 (0.0%) | 0 (0.0%) |
| $65,000 to $74,999 | 0 (0.0%) | 8 (5.2%) |
| $75,000 to $99,999 | 0 (0.0%) | 0 (0.0%) |
| $100,000+ | 27 (26.2%) | 0 (0.0%) |
| Total | 103 (100.0%) | 153 (100.0%) |
Earnings by Sex by Educational Attainment in Reeltown
| Educational Attainment | Male Income | Female Income |
| Less than High School | - | - |
| High School Diploma | - | - |
| College or Associate's Degree | - | - |
| Bachelor's Degree | - | - |
| Graduate Degree | - | - |
| Total | - | - |
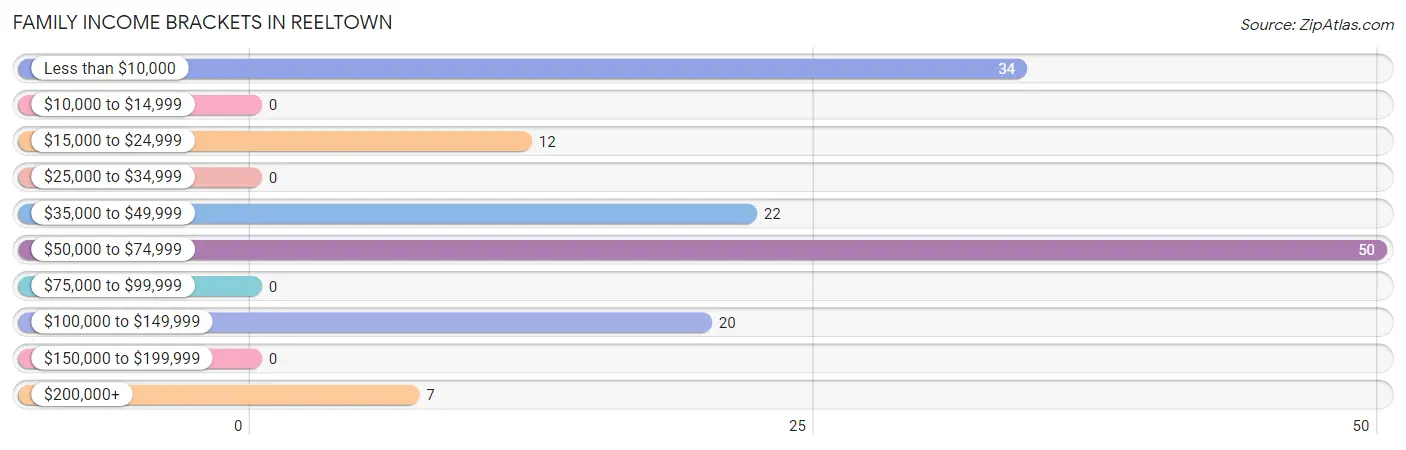
Family Income in Reeltown
Family Income Brackets in Reeltown
According to the Reeltown family income data, there are 50 families falling into the $50,000 to $74,999 income range, which is the most common income bracket and makes up 34.5% of all families.
| Income Bracket | # Families | % Families |
| Less than $10,000 | 34 | 23.4% |
| $10,000 to $14,999 | 0 | 0.0% |
| $15,000 to $24,999 | 12 | 8.3% |
| $25,000 to $34,999 | 0 | 0.0% |
| $35,000 to $49,999 | 22 | 15.2% |
| $50,000 to $74,999 | 50 | 34.5% |
| $75,000 to $99,999 | 0 | 0.0% |
| $100,000 to $149,999 | 20 | 13.8% |
| $150,000 to $199,999 | 0 | 0.0% |
| $200,000+ | 7 | 4.8% |
Family Income by Famaliy Size in Reeltown
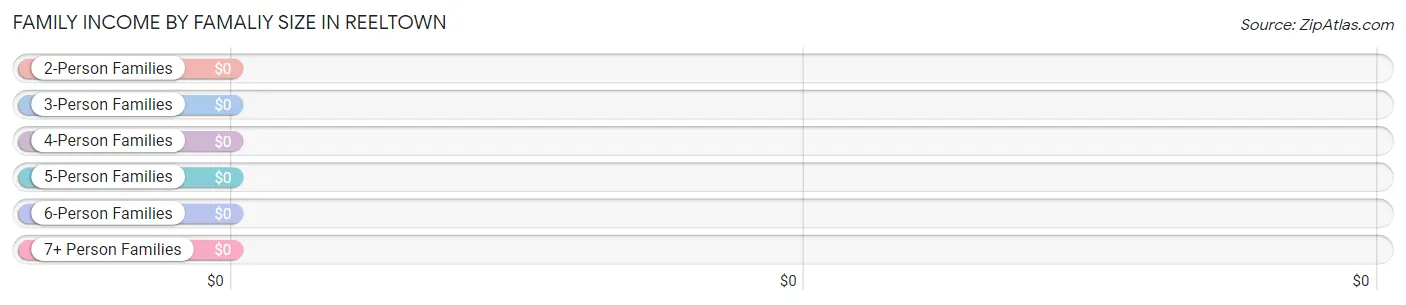
| Income Bracket | # Families | Median Income |
| 2-Person Families | 99 (68.3%) | $0 |
| 3-Person Families | 27 (18.6%) | $0 |
| 4-Person Families | 19 (13.1%) | $0 |
| 5-Person Families | 0 (0.0%) | $0 |
| 6-Person Families | 0 (0.0%) | $0 |
| 7+ Person Families | 0 (0.0%) | $0 |
| Total | 145 (100.0%) | $55,417 |
Family Income by Number of Earners in Reeltown
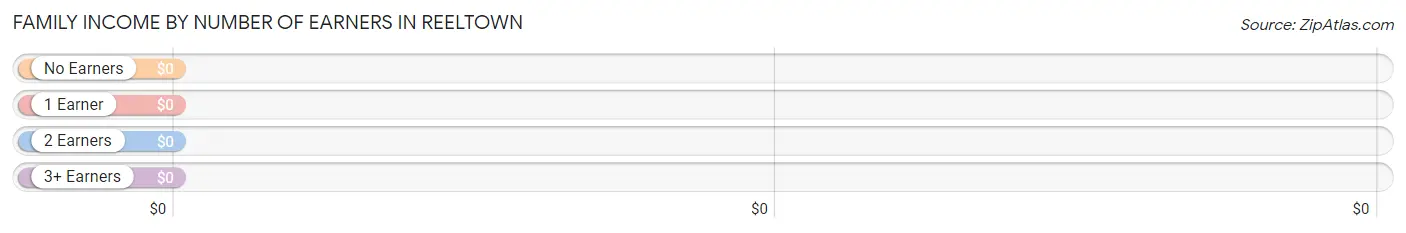
| Number of Earners | # Families | Median Income |
| No Earners | 0 (0.0%) | $0 |
| 1 Earner | 96 (66.2%) | $0 |
| 2 Earners | 42 (29.0%) | $0 |
| 3+ Earners | 7 (4.8%) | $0 |
| Total | 145 (100.0%) | $55,417 |
Household Income in Reeltown
Household Income Brackets in Reeltown
With 34 households falling in the category, the less than $10,000 income range is the most frequent in Reeltown, accounting for 19.3% of all households.
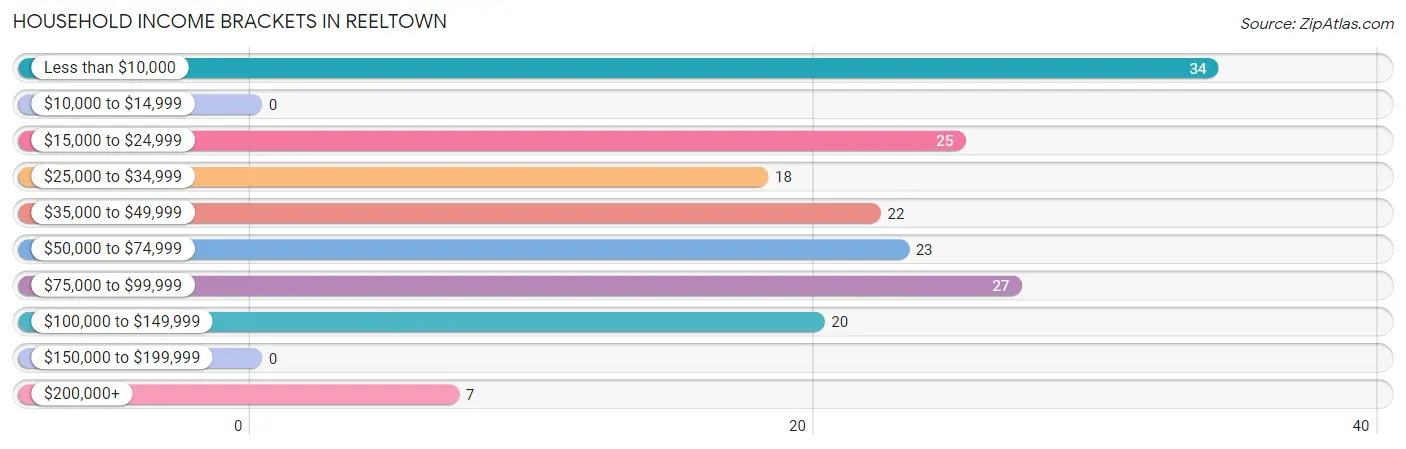
| Income Bracket | # Households | % Households |
| Less than $10,000 | 34 | 19.3% |
| $10,000 to $14,999 | 0 | 0.0% |
| $15,000 to $24,999 | 25 | 14.2% |
| $25,000 to $34,999 | 18 | 10.2% |
| $35,000 to $49,999 | 22 | 12.5% |
| $50,000 to $74,999 | 23 | 13.1% |
| $75,000 to $99,999 | 27 | 15.3% |
| $100,000 to $149,999 | 20 | 11.4% |
| $150,000 to $199,999 | 0 | 0.0% |
| $200,000+ | 7 | 4.0% |
Household Income by Householder Age in Reeltown
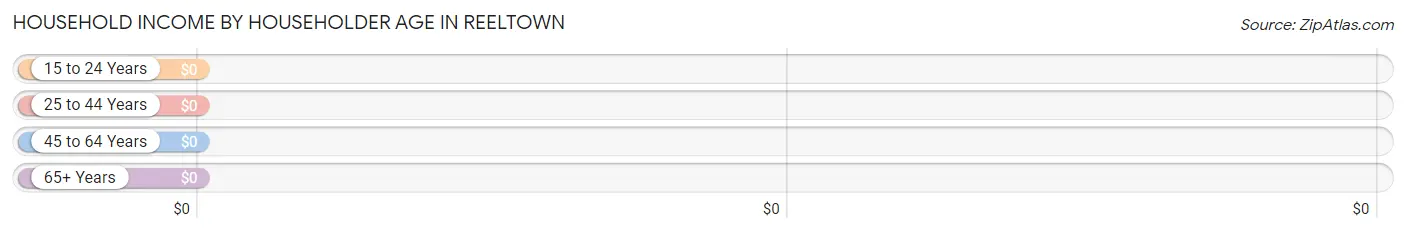
| Income Bracket | # Households | Median Income |
| 15 to 24 Years | 0 (0.0%) | $0 |
| 25 to 44 Years | 95 (54.0%) | $0 |
| 45 to 64 Years | 20 (11.4%) | $0 |
| 65+ Years | 61 (34.7%) | $0 |
| Total | 176 (100.0%) | $36,250 |
Poverty in Reeltown
Income Below Poverty by Sex and Age in Reeltown
With 25.2% poverty level for males and 31.6% for females among the residents of Reeltown, 6 to 11 year old males and 6 to 11 year old females are the most vulnerable to poverty, with 43 males (100.0%) and 20 females (66.7%) in their respective age groups living below the poverty level.
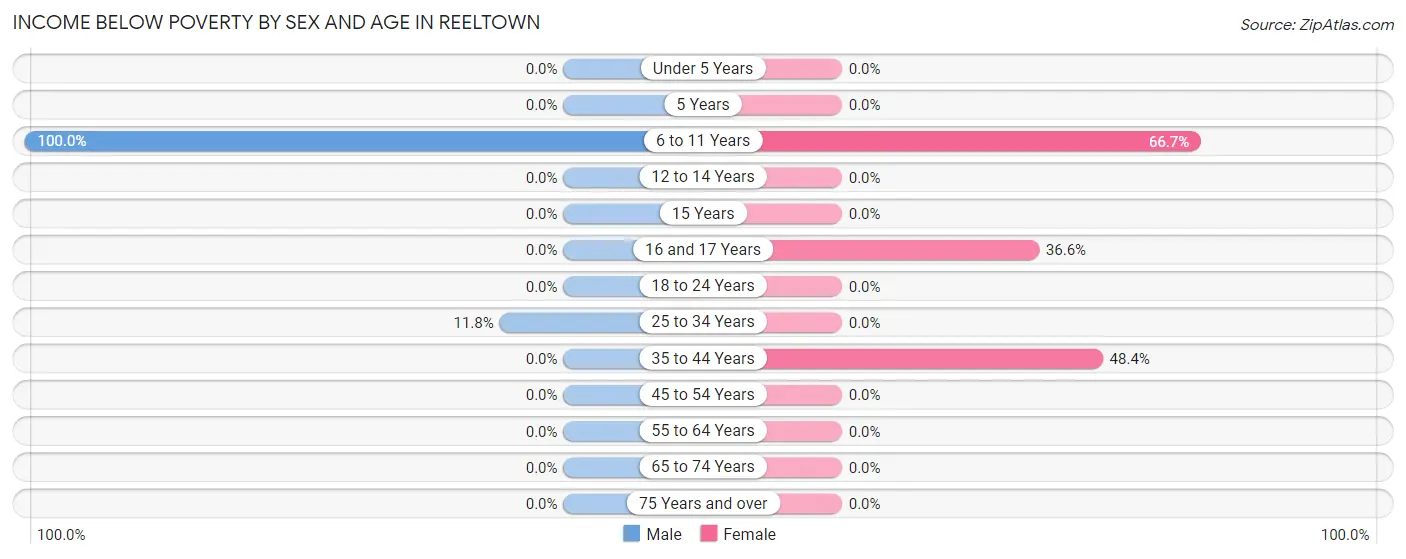
| Age Bracket | Male | Female |
| Under 5 Years | 0 (0.0%) | 0 (0.0%) |
| 5 Years | 0 (0.0%) | 0 (0.0%) |
| 6 to 11 Years | 43 (100.0%) | 20 (66.7%) |
| 12 to 14 Years | 0 (0.0%) | 0 (0.0%) |
| 15 Years | 0 (0.0%) | 0 (0.0%) |
| 16 and 17 Years | 0 (0.0%) | 15 (36.6%) |
| 18 to 24 Years | 0 (0.0%) | 0 (0.0%) |
| 25 to 34 Years | 9 (11.8%) | 0 (0.0%) |
| 35 to 44 Years | 0 (0.0%) | 46 (48.4%) |
| 45 to 54 Years | 0 (0.0%) | 0 (0.0%) |
| 55 to 64 Years | 0 (0.0%) | 0 (0.0%) |
| 65 to 74 Years | 0 (0.0%) | 0 (0.0%) |
| 75 Years and over | 0 (0.0%) | 0 (0.0%) |
| Total | 52 (25.2%) | 81 (31.6%) |
Income Above Poverty by Sex and Age in Reeltown
According to the poverty statistics in Reeltown, males aged 12 to 14 years and females aged 25 to 34 years are the age groups that are most secure financially, with 100.0% of males and 100.0% of females in these age groups living above the poverty line.
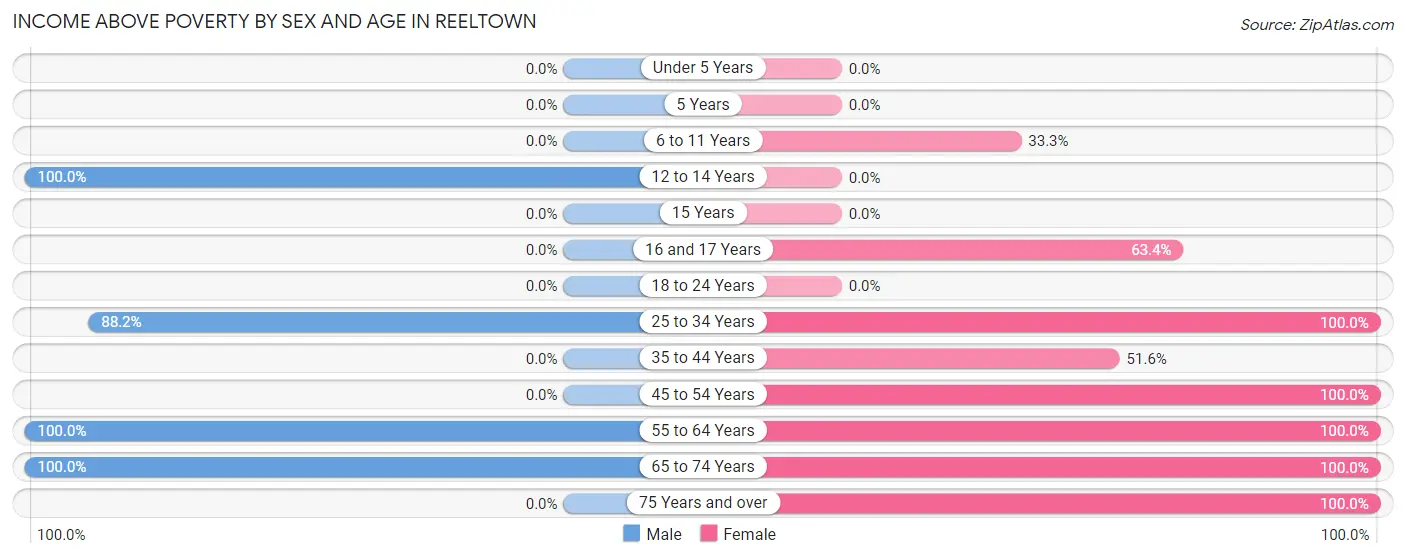
| Age Bracket | Male | Female |
| Under 5 Years | 0 (0.0%) | 0 (0.0%) |
| 5 Years | 0 (0.0%) | 0 (0.0%) |
| 6 to 11 Years | 0 (0.0%) | 10 (33.3%) |
| 12 to 14 Years | 36 (100.0%) | 0 (0.0%) |
| 15 Years | 0 (0.0%) | 0 (0.0%) |
| 16 and 17 Years | 0 (0.0%) | 26 (63.4%) |
| 18 to 24 Years | 0 (0.0%) | 0 (0.0%) |
| 25 to 34 Years | 67 (88.2%) | 12 (100.0%) |
| 35 to 44 Years | 0 (0.0%) | 49 (51.6%) |
| 45 to 54 Years | 0 (0.0%) | 16 (100.0%) |
| 55 to 64 Years | 44 (100.0%) | 8 (100.0%) |
| 65 to 74 Years | 7 (100.0%) | 23 (100.0%) |
| 75 Years and over | 0 (0.0%) | 31 (100.0%) |
| Total | 154 (74.8%) | 175 (68.4%) |
Income Below Poverty Among Married-Couple Families in Reeltown
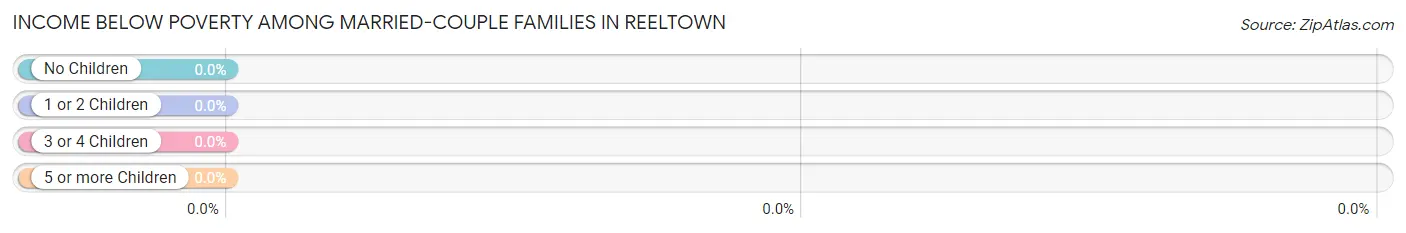
| Children | Above Poverty | Below Poverty |
| No Children | 43 (100.0%) | 0 (0.0%) |
| 1 or 2 Children | 34 (100.0%) | 0 (0.0%) |
| 3 or 4 Children | 0 (0.0%) | 0 (0.0%) |
| 5 or more Children | 0 (0.0%) | 0 (0.0%) |
| Total | 77 (100.0%) | 0 (0.0%) |
Income Below Poverty Among Single-Parent Households in Reeltown
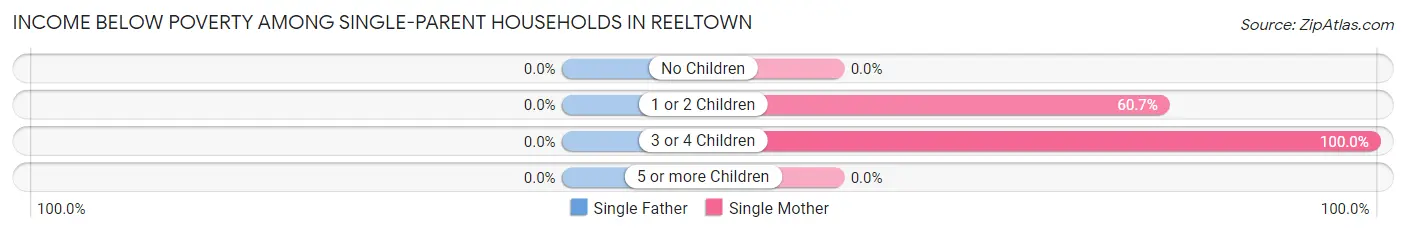
| Children | Single Father | Single Mother |
| No Children | 0 (0.0%) | 0 (0.0%) |
| 1 or 2 Children | 0 (0.0%) | 34 (60.7%) |
| 3 or 4 Children | 0 (0.0%) | 12 (100.0%) |
| 5 or more Children | 0 (0.0%) | 0 (0.0%) |
| Total | 0 (0.0%) | 46 (67.6%) |
Income Below Poverty Among Married-Couple vs Single-Parent Households in Reeltown
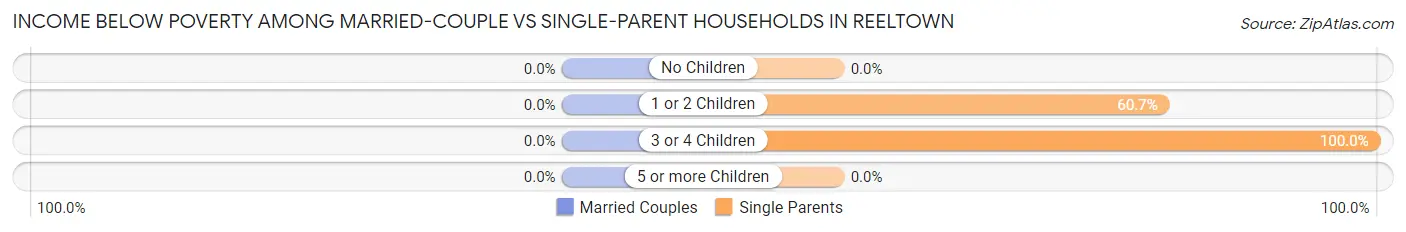
| Children | Married-Couple Families | Single-Parent Households |
| No Children | 0 (0.0%) | 0 (0.0%) |
| 1 or 2 Children | 0 (0.0%) | 34 (60.7%) |
| 3 or 4 Children | 0 (0.0%) | 12 (100.0%) |
| 5 or more Children | 0 (0.0%) | 0 (0.0%) |
| Total | 0 (0.0%) | 46 (67.6%) |
Race in Reeltown
The most populous races in Reeltown are Black / African American (228 | 49.3%), White / Caucasian (218 | 47.2%), and Asian (16 | 3.5%).
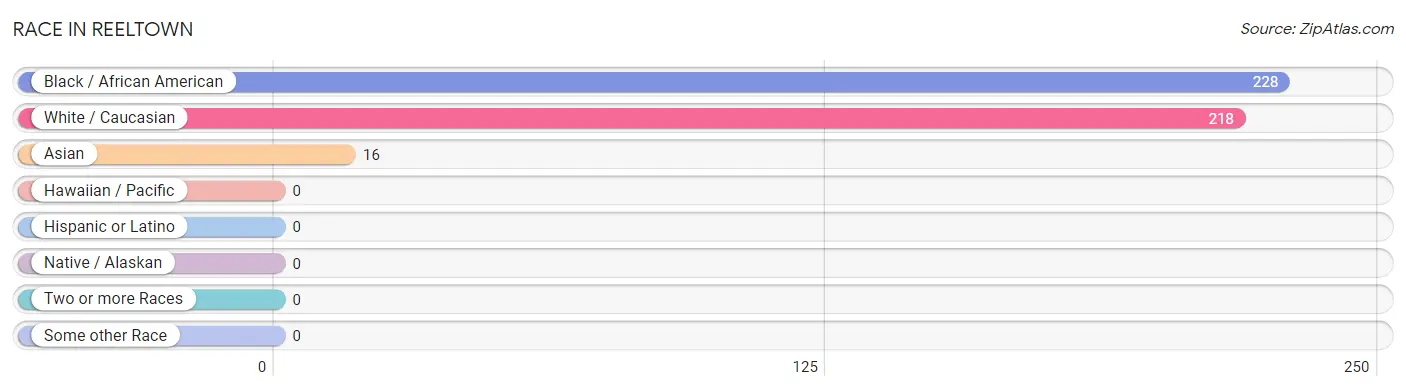
| Race | # Population | % Population |
| Asian | 16 | 3.5% |
| Black / African American | 228 | 49.3% |
| Hawaiian / Pacific | 0 | 0.0% |
| Hispanic or Latino | 0 | 0.0% |
| Native / Alaskan | 0 | 0.0% |
| White / Caucasian | 218 | 47.2% |
| Two or more Races | 0 | 0.0% |
| Some other Race | 0 | 0.0% |
| Total | 462 | 100.0% |
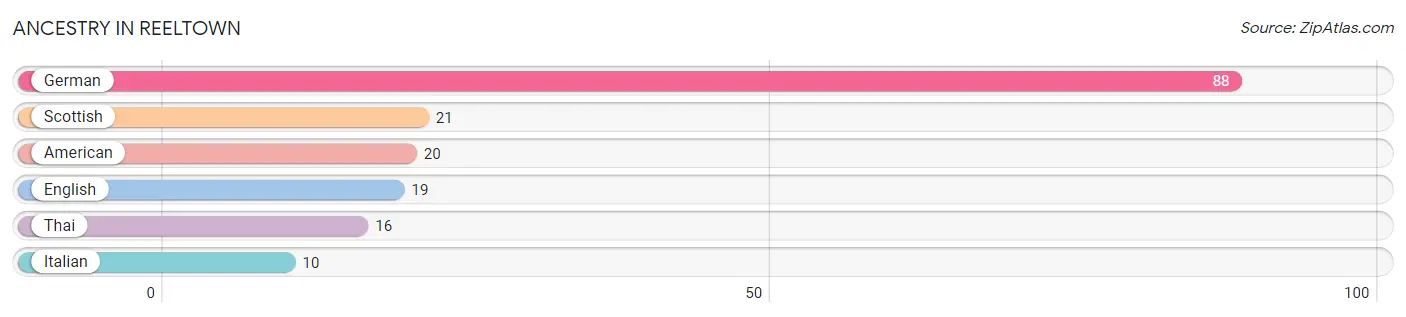
Ancestry in Reeltown
The most populous ancestries reported in Reeltown are German (88 | 19.1%), Scottish (21 | 4.5%), American (20 | 4.3%), English (19 | 4.1%), and Thai (16 | 3.5%), together accounting for 35.5% of all Reeltown residents.
| Ancestry | # Population | % Population |
| American | 20 | 4.3% |
| English | 19 | 4.1% |
| German | 88 | 19.1% |
| Italian | 10 | 2.2% |
| Scottish | 21 | 4.5% |
| Thai | 16 | 3.5% | View All 6 Rows |
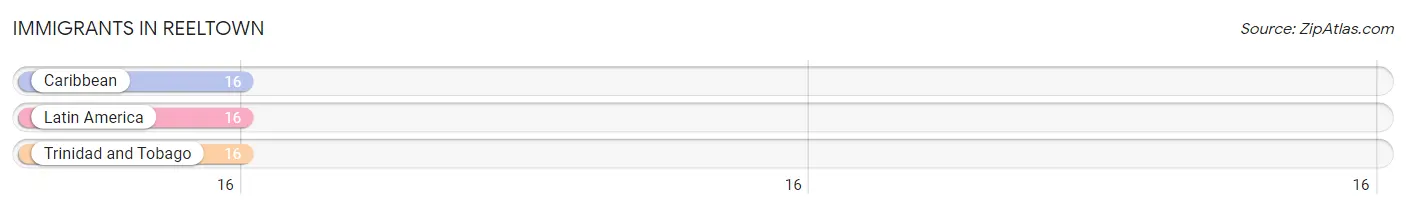
Immigrants in Reeltown
The most numerous immigrant groups reported in Reeltown came from Caribbean (16 | 3.5%), Latin America (16 | 3.5%), and Trinidad and Tobago (16 | 3.5%), together accounting for 10.4% of all Reeltown residents.
| Immigration Origin | # Population | % Population |
| Caribbean | 16 | 3.5% |
| Latin America | 16 | 3.5% |
| Trinidad and Tobago | 16 | 3.5% | View All 3 Rows |
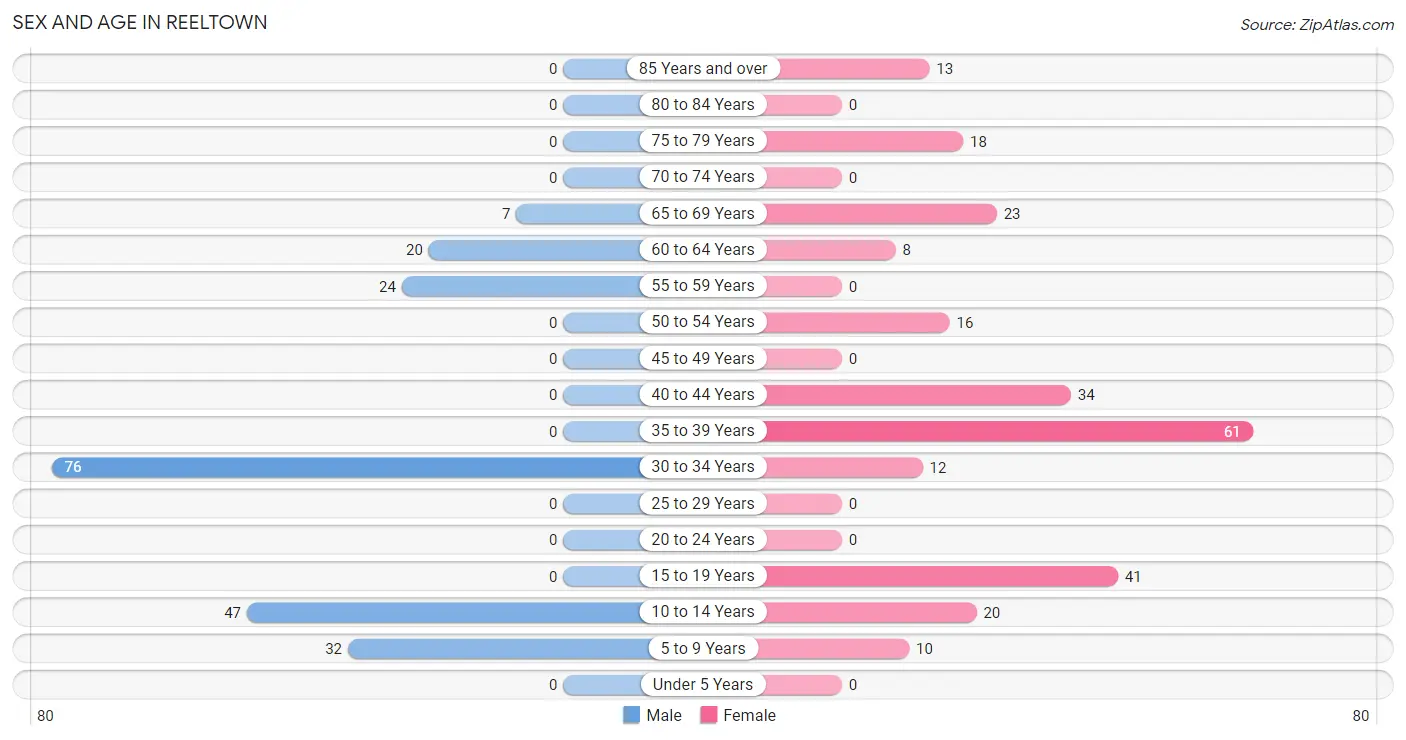
Sex and Age in Reeltown
Sex and Age in Reeltown
The most populous age groups in Reeltown are 30 to 34 Years (76 | 36.9%) for men and 35 to 39 Years (61 | 23.8%) for women.
| Age Bracket | Male | Female |
| Under 5 Years | 0 (0.0%) | 0 (0.0%) |
| 5 to 9 Years | 32 (15.5%) | 10 (3.9%) |
| 10 to 14 Years | 47 (22.8%) | 20 (7.8%) |
| 15 to 19 Years | 0 (0.0%) | 41 (16.0%) |
| 20 to 24 Years | 0 (0.0%) | 0 (0.0%) |
| 25 to 29 Years | 0 (0.0%) | 0 (0.0%) |
| 30 to 34 Years | 76 (36.9%) | 12 (4.7%) |
| 35 to 39 Years | 0 (0.0%) | 61 (23.8%) |
| 40 to 44 Years | 0 (0.0%) | 34 (13.3%) |
| 45 to 49 Years | 0 (0.0%) | 0 (0.0%) |
| 50 to 54 Years | 0 (0.0%) | 16 (6.2%) |
| 55 to 59 Years | 24 (11.7%) | 0 (0.0%) |
| 60 to 64 Years | 20 (9.7%) | 8 (3.1%) |
| 65 to 69 Years | 7 (3.4%) | 23 (9.0%) |
| 70 to 74 Years | 0 (0.0%) | 0 (0.0%) |
| 75 to 79 Years | 0 (0.0%) | 18 (7.0%) |
| 80 to 84 Years | 0 (0.0%) | 0 (0.0%) |
| 85 Years and over | 0 (0.0%) | 13 (5.1%) |
| Total | 206 (100.0%) | 256 (100.0%) |
Families and Households in Reeltown
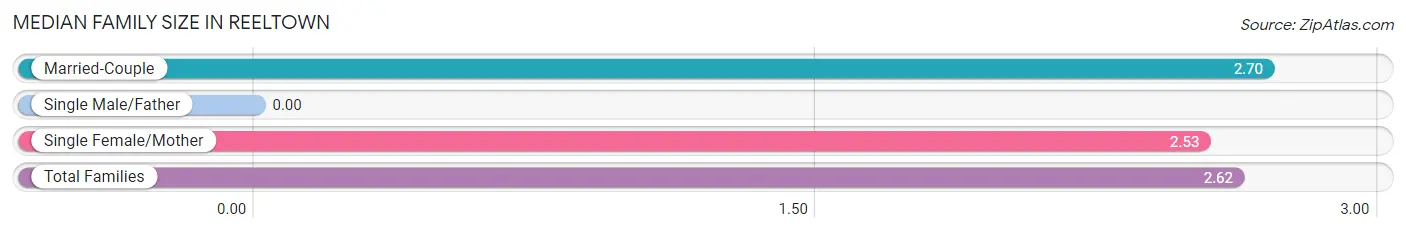
Median Family Size in Reeltown
| Family Type | # Families | Family Size |
| Married-Couple | 77 (53.1%) | 2.70 |
| Single Male/Father | 0 (0.0%) | - |
| Single Female/Mother | 68 (46.9%) | 2.53 |
| Total Families | 145 (100.0%) | 2.62 |
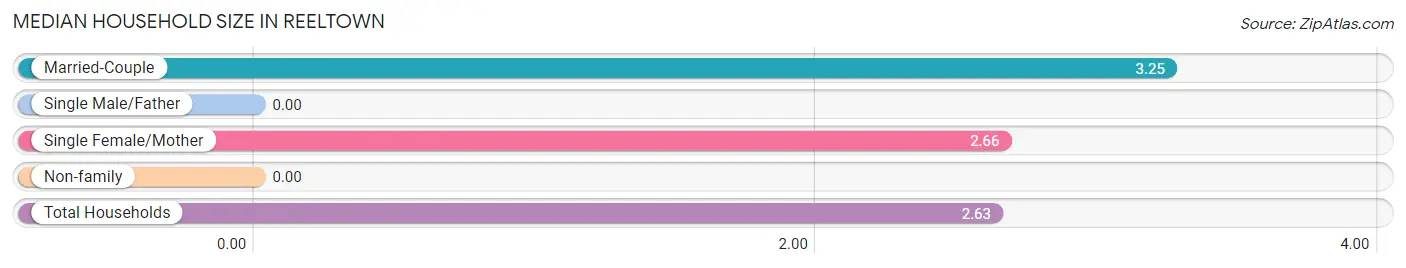
Median Household Size in Reeltown
| Household Type | # Households | Household Size |
| Married-Couple | 77 (43.8%) | 3.25 |
| Single Male/Father | 0 (0.0%) | - |
| Single Female/Mother | 68 (38.6%) | 2.66 |
| Non-family | 31 (17.6%) | - |
| Total Households | 176 (100.0%) | 2.63 |
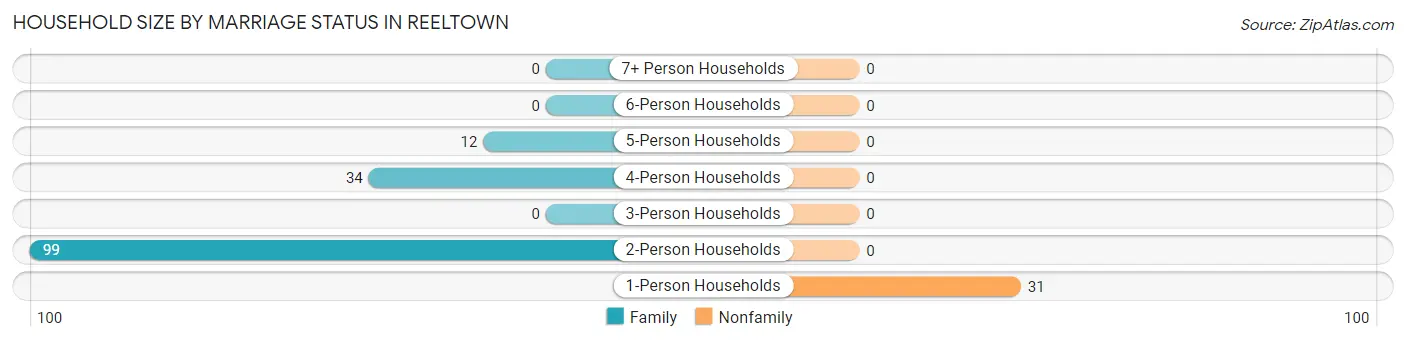
Household Size by Marriage Status in Reeltown
Out of a total of 176 households in Reeltown, 145 (82.4%) are family households, while 31 (17.6%) are nonfamily households. The most numerous type of family households are 2-person households, comprising 99, and the most common type of nonfamily households are 1-person households, comprising 31.
| Household Size | Family Households | Nonfamily Households |
| 1-Person Households | - | 31 (17.6%) |
| 2-Person Households | 99 (56.2%) | 0 (0.0%) |
| 3-Person Households | 0 (0.0%) | 0 (0.0%) |
| 4-Person Households | 34 (19.3%) | 0 (0.0%) |
| 5-Person Households | 12 (6.8%) | 0 (0.0%) |
| 6-Person Households | 0 (0.0%) | 0 (0.0%) |
| 7+ Person Households | 0 (0.0%) | 0 (0.0%) |
| Total | 145 (82.4%) | 31 (17.6%) |
Female Fertility in Reeltown
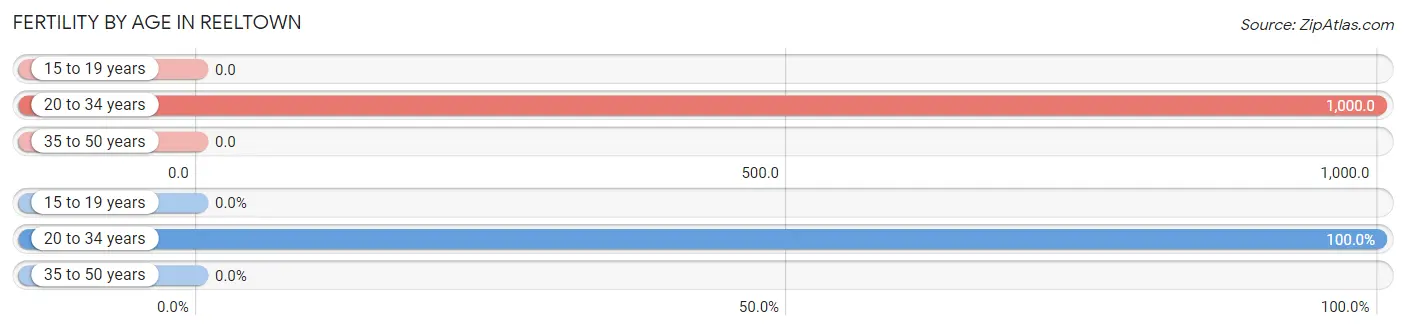
Fertility by Age in Reeltown
Average fertility rate in Reeltown is 73.0 births per 1,000 women. Women in the age bracket of 20 to 34 years have the highest fertility rate with 1,000.0 births per 1,000 women. Women in the age bracket of 20 to 34 years acount for 100.0% of all women with births.
| Age Bracket | Women with Births | Births / 1,000 Women |
| 15 to 19 years | 0 (0.0%) | 0.0 |
| 20 to 34 years | 12 (100.0%) | 1,000.0 |
| 35 to 50 years | 0 (0.0%) | 0.0 |
| Total | 12 (100.0%) | 73.0 |
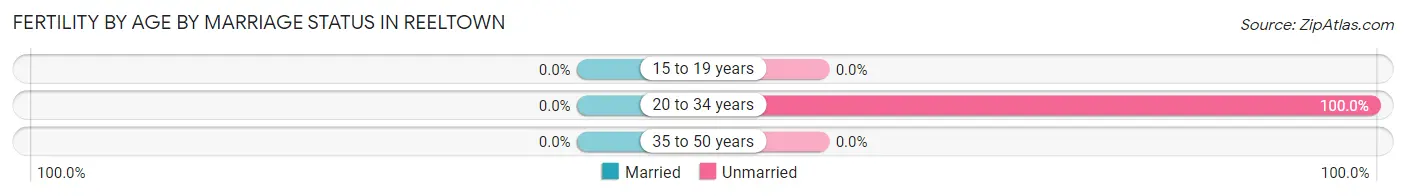
Fertility by Age by Marriage Status in Reeltown
| Age Bracket | Married | Unmarried |
| 15 to 19 years | 0 (0.0%) | 0 (0.0%) |
| 20 to 34 years | 0 (0.0%) | 12 (100.0%) |
| 35 to 50 years | 0 (0.0%) | 0 (0.0%) |
| Total | 0 (0.0%) | 12 (100.0%) |
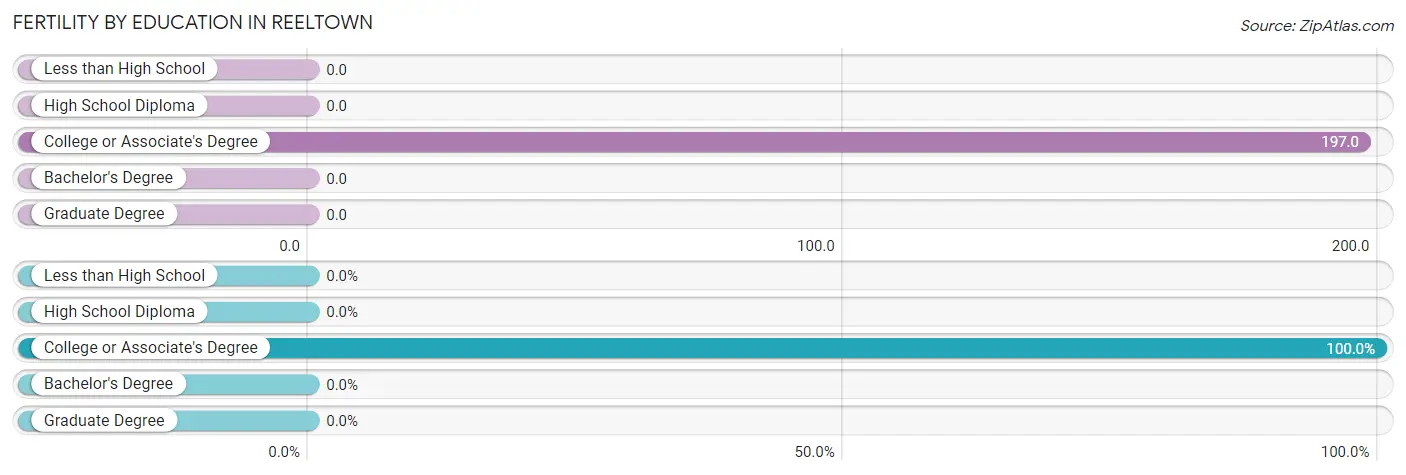
Fertility by Education in Reeltown
| Educational Attainment | Women with Births | Births / 1,000 Women |
| Less than High School | 0 (0.0%) | 0.0 |
| High School Diploma | 0 (0.0%) | 0.0 |
| College or Associate's Degree | 12 (100.0%) | 197.0 |
| Bachelor's Degree | 0 (0.0%) | 0.0 |
| Graduate Degree | 0 (0.0%) | 0.0 |
| Total | 12 (100.0%) | 73.0 |
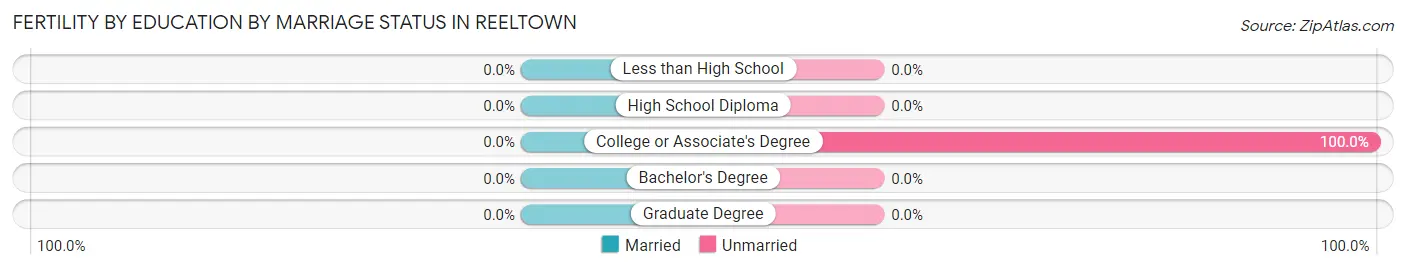
Fertility by Education by Marriage Status in Reeltown
| Educational Attainment | Married | Unmarried |
| Less than High School | 0 (0.0%) | 0 (0.0%) |
| High School Diploma | 0 (0.0%) | 0 (0.0%) |
| College or Associate's Degree | 0 (0.0%) | 12 (100.0%) |
| Bachelor's Degree | 0 (0.0%) | 0 (0.0%) |
| Graduate Degree | 0 (0.0%) | 0 (0.0%) |
| Total | 0 (0.0%) | 12 (100.0%) |
Employment Characteristics in Reeltown
Employment by Class of Employer in Reeltown
Among the 222 employed individuals in Reeltown, private company employees (192 | 86.5%), and not-for-profit organizations (30 | 13.5%) make up the most common classes of employment.
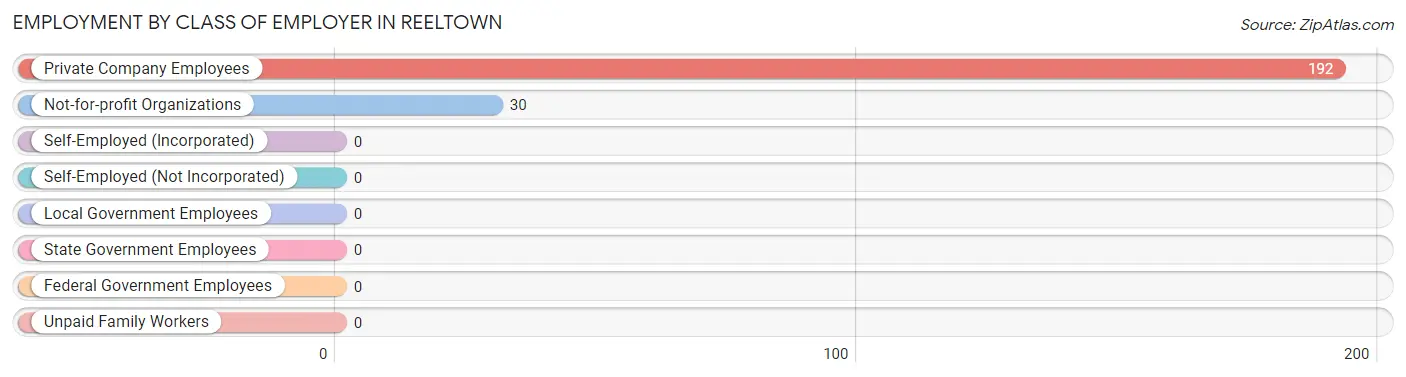
| Employer Class | # Employees | % Employees |
| Private Company Employees | 192 | 86.5% |
| Self-Employed (Incorporated) | 0 | 0.0% |
| Self-Employed (Not Incorporated) | 0 | 0.0% |
| Not-for-profit Organizations | 30 | 13.5% |
| Local Government Employees | 0 | 0.0% |
| State Government Employees | 0 | 0.0% |
| Federal Government Employees | 0 | 0.0% |
| Unpaid Family Workers | 0 | 0.0% |
| Total | 222 | 100.0% |
Employment Status by Age in Reeltown
According to the labor force statistics for Reeltown, out of the total population over 16 years of age (353), 72.5% or 256 individuals are in the labor force, with 13.3% or 34 of them unemployed. The age group with the highest labor force participation rate is 30 to 34 years, with 100.0% or 88 individuals in the labor force. Within the labor force, the 35 to 44 years age range has the highest percentage of unemployed individuals, with 50.0% or 34 of them being unemployed.
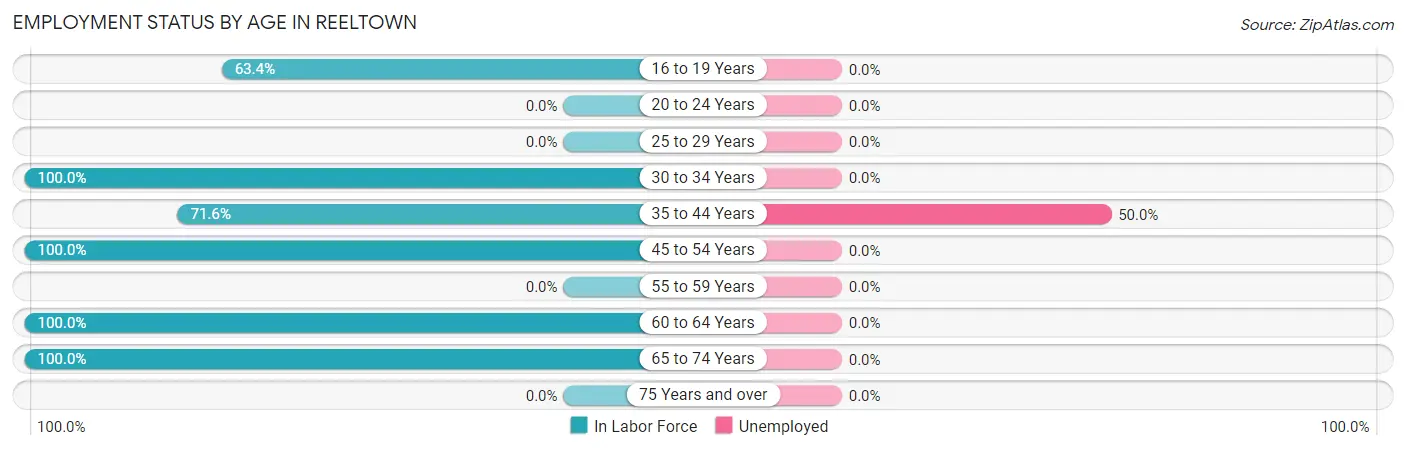
| Age Bracket | In Labor Force | Unemployed |
| 16 to 19 Years | 26 (63.4%) | 0 (0.0%) |
| 20 to 24 Years | 0 (0.0%) | 0 (0.0%) |
| 25 to 29 Years | 0 (0.0%) | 0 (0.0%) |
| 30 to 34 Years | 88 (100.0%) | 0 (0.0%) |
| 35 to 44 Years | 68 (71.6%) | 34 (50.0%) |
| 45 to 54 Years | 16 (100.0%) | 0 (0.0%) |
| 55 to 59 Years | 0 (0.0%) | 0 (0.0%) |
| 60 to 64 Years | 28 (100.0%) | 0 (0.0%) |
| 65 to 74 Years | 30 (100.0%) | 0 (0.0%) |
| 75 Years and over | 0 (0.0%) | 0 (0.0%) |
| Total | 256 (72.5%) | 34 (13.3%) |
Employment Status by Educational Attainment in Reeltown
According to labor force statistics for Reeltown, 79.7% of individuals (200) out of the total population between 25 and 64 years of age (251) are in the labor force, with 17.0% or 34 of them being unemployed. The group with the highest labor force participation rate are those with the educational attainment of high school diploma, with 100.0% or 100 individuals in the labor force. Within the labor force, individuals with high school diploma education have the highest percentage of unemployment, with 34.0% or 34 of them being unemployed.
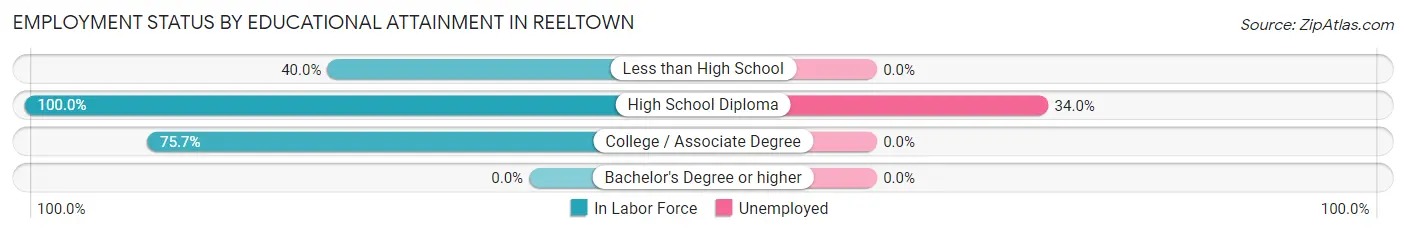
| Educational Attainment | In Labor Force | Unemployed |
| Less than High School | 16 (40.0%) | 0 (0.0%) |
| High School Diploma | 100 (100.0%) | 34 (34.0%) |
| College / Associate Degree | 84 (75.7%) | 0 (0.0%) |
| Bachelor's Degree or higher | 0 (0.0%) | 0 (0.0%) |
| Total | 200 (79.7%) | 43 (17.0%) |
Employment Occupations by Sex in Reeltown
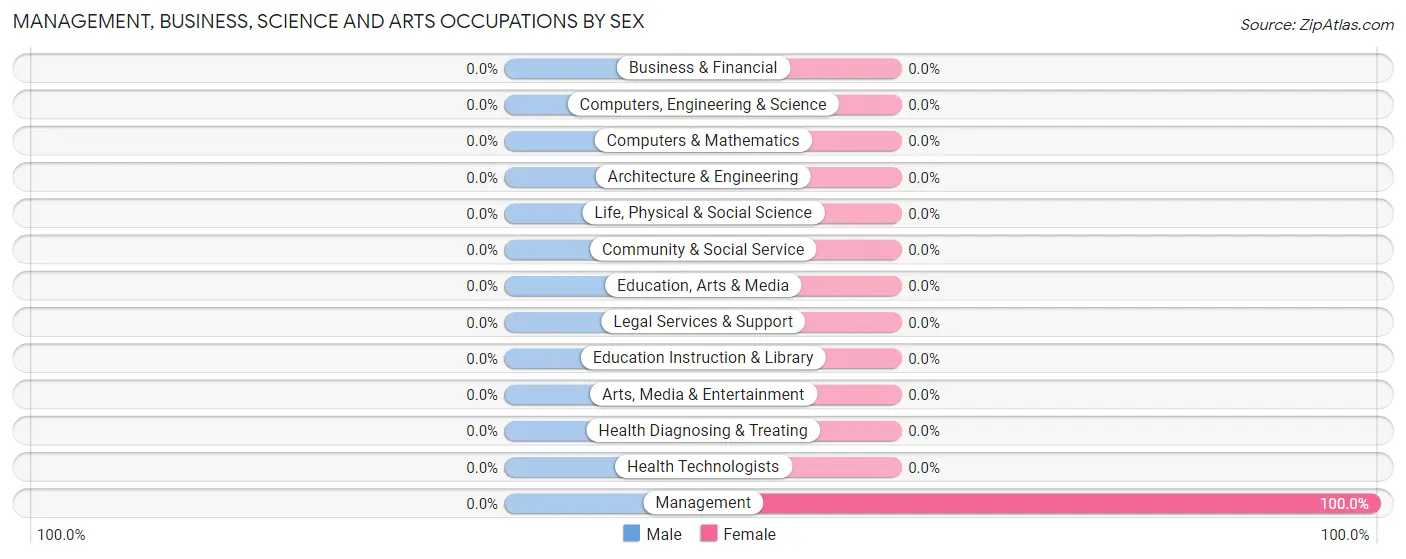
Management, Business, Science and Arts Occupations
The most common Management, Business, Science and Arts occupations in Reeltown are , and Management (8 | 3.6%).
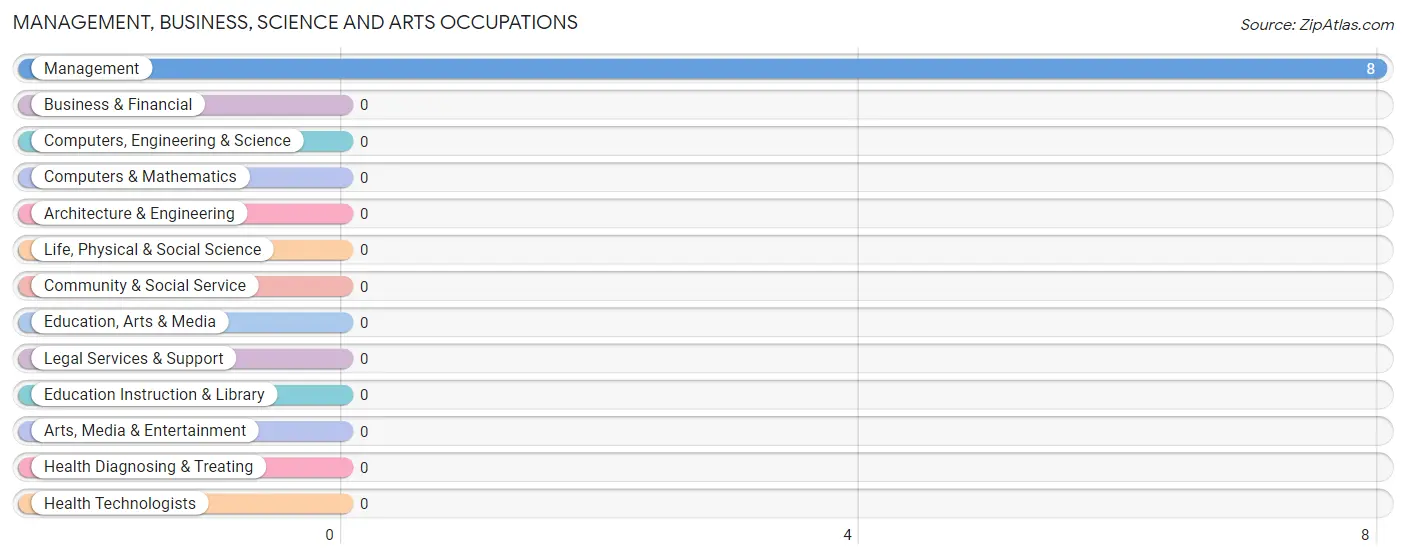
Management, Business, Science and Arts Occupations by Sex
| Occupation | Male | Female |
| Management | 0 (0.0%) | 8 (100.0%) |
| Business & Financial | 0 (0.0%) | 0 (0.0%) |
| Computers, Engineering & Science | 0 (0.0%) | 0 (0.0%) |
| Computers & Mathematics | 0 (0.0%) | 0 (0.0%) |
| Architecture & Engineering | 0 (0.0%) | 0 (0.0%) |
| Life, Physical & Social Science | 0 (0.0%) | 0 (0.0%) |
| Community & Social Service | 0 (0.0%) | 0 (0.0%) |
| Education, Arts & Media | 0 (0.0%) | 0 (0.0%) |
| Legal Services & Support | 0 (0.0%) | 0 (0.0%) |
| Education Instruction & Library | 0 (0.0%) | 0 (0.0%) |
| Arts, Media & Entertainment | 0 (0.0%) | 0 (0.0%) |
| Health Diagnosing & Treating | 0 (0.0%) | 0 (0.0%) |
| Health Technologists | 0 (0.0%) | 0 (0.0%) |
| Total (Category) | 0 (0.0%) | 8 (100.0%) |
| Total (Overall) | 103 (46.4%) | 119 (53.6%) |
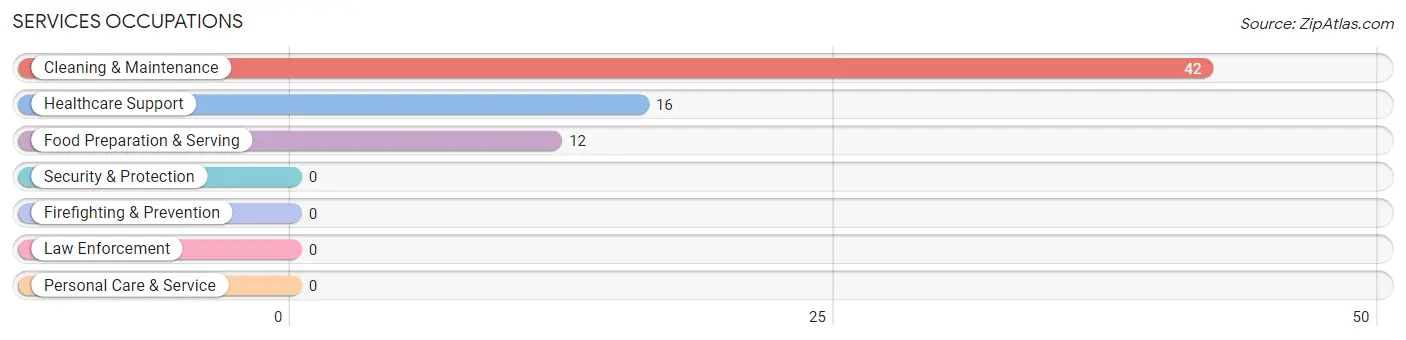
Services Occupations
The most common Services occupations in Reeltown are Cleaning & Maintenance (42 | 18.9%), Healthcare Support (16 | 7.2%), and Food Preparation & Serving (12 | 5.4%).
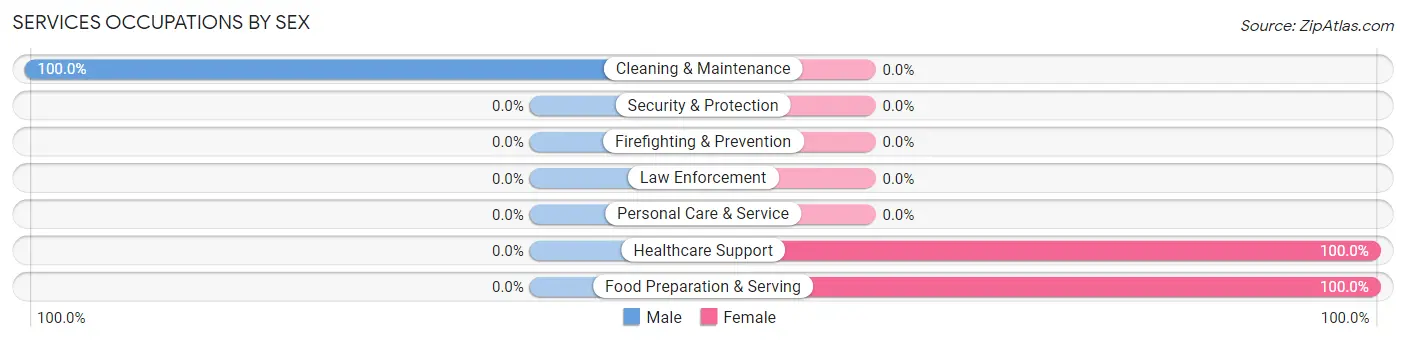
Services Occupations by Sex
| Occupation | Male | Female |
| Healthcare Support | 0 (0.0%) | 16 (100.0%) |
| Security & Protection | 0 (0.0%) | 0 (0.0%) |
| Firefighting & Prevention | 0 (0.0%) | 0 (0.0%) |
| Law Enforcement | 0 (0.0%) | 0 (0.0%) |
| Food Preparation & Serving | 0 (0.0%) | 12 (100.0%) |
| Cleaning & Maintenance | 42 (100.0%) | 0 (0.0%) |
| Personal Care & Service | 0 (0.0%) | 0 (0.0%) |
| Total (Category) | 42 (60.0%) | 28 (40.0%) |
| Total (Overall) | 103 (46.4%) | 119 (53.6%) |
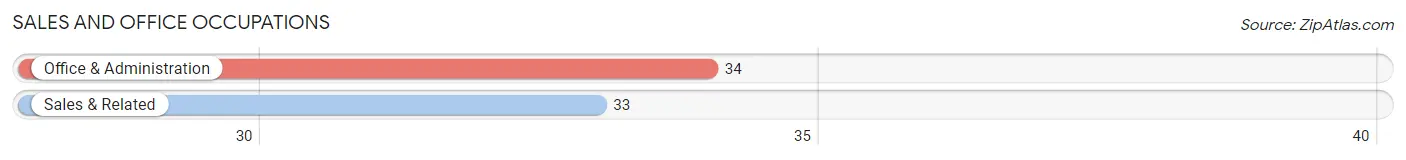
Sales and Office Occupations
The most common Sales and Office occupations in Reeltown are Office & Administration (34 | 15.3%), and Sales & Related (33 | 14.9%).
Sales and Office Occupations by Sex
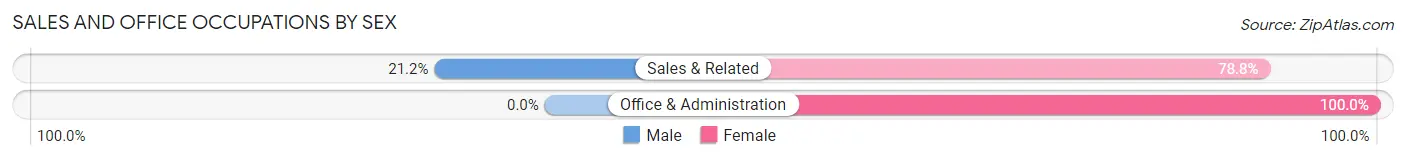
| Occupation | Male | Female |
| Sales & Related | 7 (21.2%) | 26 (78.8%) |
| Office & Administration | 0 (0.0%) | 34 (100.0%) |
| Total (Category) | 7 (10.4%) | 60 (89.5%) |
| Total (Overall) | 103 (46.4%) | 119 (53.6%) |
Natural Resources, Construction and Maintenance Occupations
The most common Natural Resources, Construction and Maintenance occupations in Reeltown are , and Construction & Extraction (25 | 11.3%).
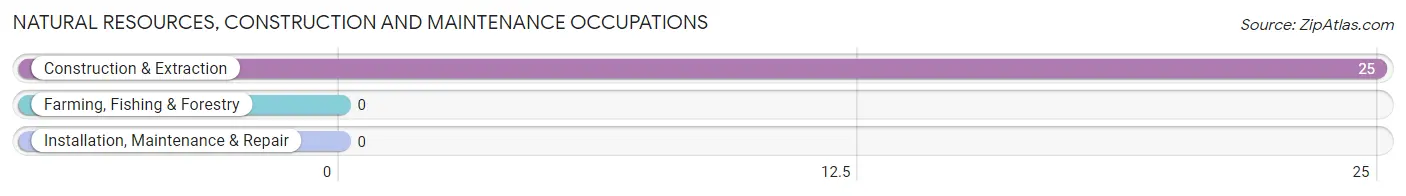
Natural Resources, Construction and Maintenance Occupations by Sex
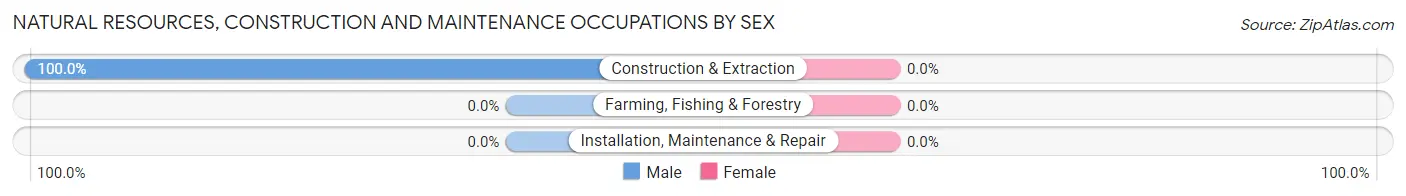
| Occupation | Male | Female |
| Farming, Fishing & Forestry | 0 (0.0%) | 0 (0.0%) |
| Construction & Extraction | 25 (100.0%) | 0 (0.0%) |
| Installation, Maintenance & Repair | 0 (0.0%) | 0 (0.0%) |
| Total (Category) | 25 (100.0%) | 0 (0.0%) |
| Total (Overall) | 103 (46.4%) | 119 (53.6%) |
Production, Transportation and Moving Occupations
The most common Production, Transportation and Moving occupations in Reeltown are Production (43 | 19.4%), and Material Moving (9 | 4.1%).
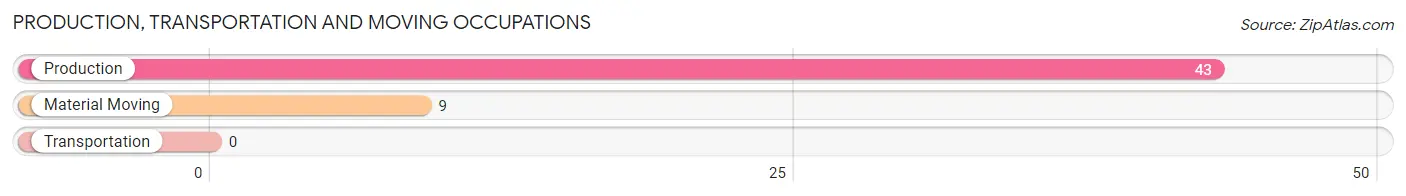
Production, Transportation and Moving Occupations by Sex
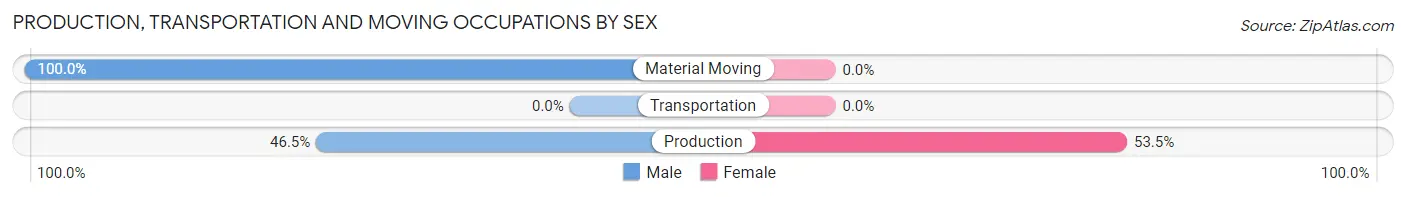
| Occupation | Male | Female |
| Production | 20 (46.5%) | 23 (53.5%) |
| Transportation | 0 (0.0%) | 0 (0.0%) |
| Material Moving | 9 (100.0%) | 0 (0.0%) |
| Total (Category) | 29 (55.8%) | 23 (44.2%) |
| Total (Overall) | 103 (46.4%) | 119 (53.6%) |
Employment Industries by Sex in Reeltown
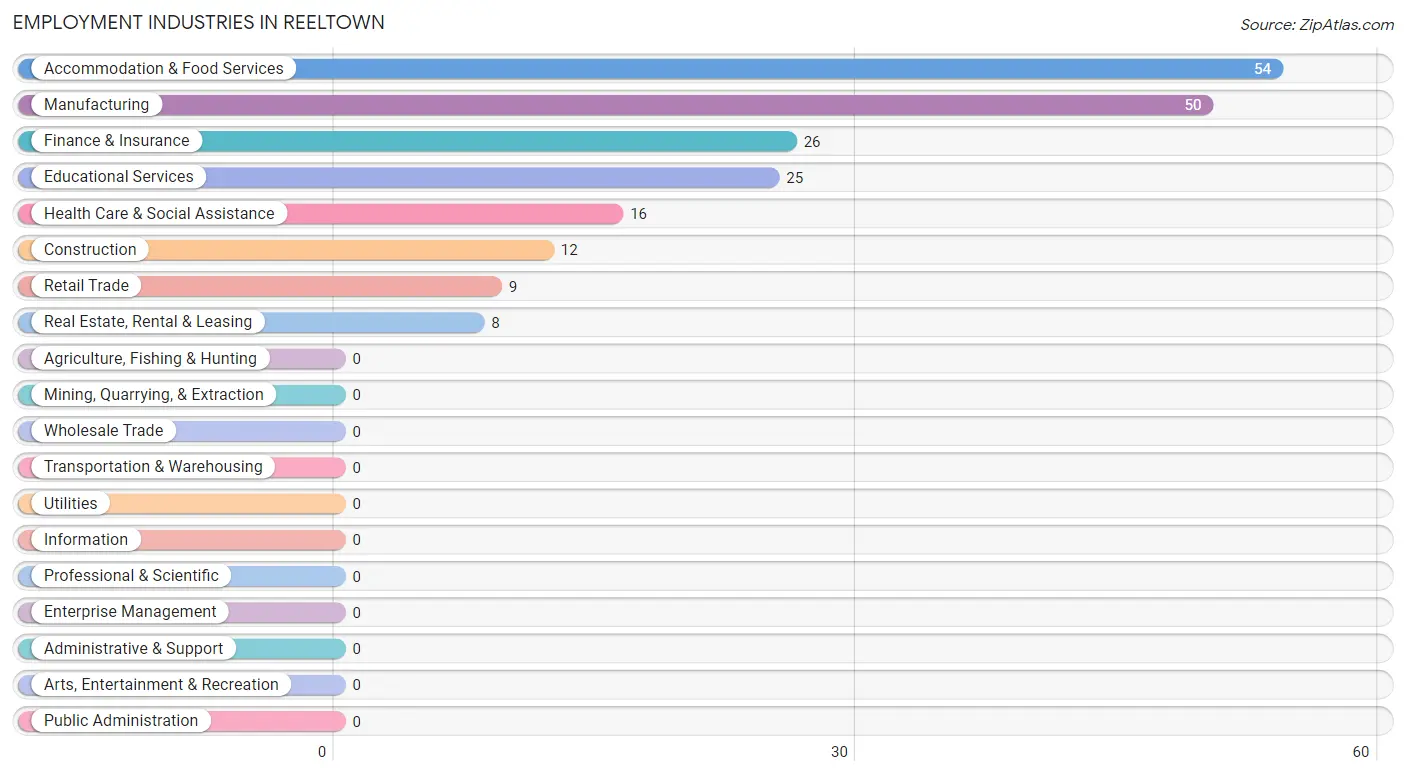
Employment Industries in Reeltown
The major employment industries in Reeltown include Accommodation & Food Services (54 | 24.3%), Manufacturing (50 | 22.5%), Finance & Insurance (26 | 11.7%), Educational Services (25 | 11.3%), and Health Care & Social Assistance (16 | 7.2%).
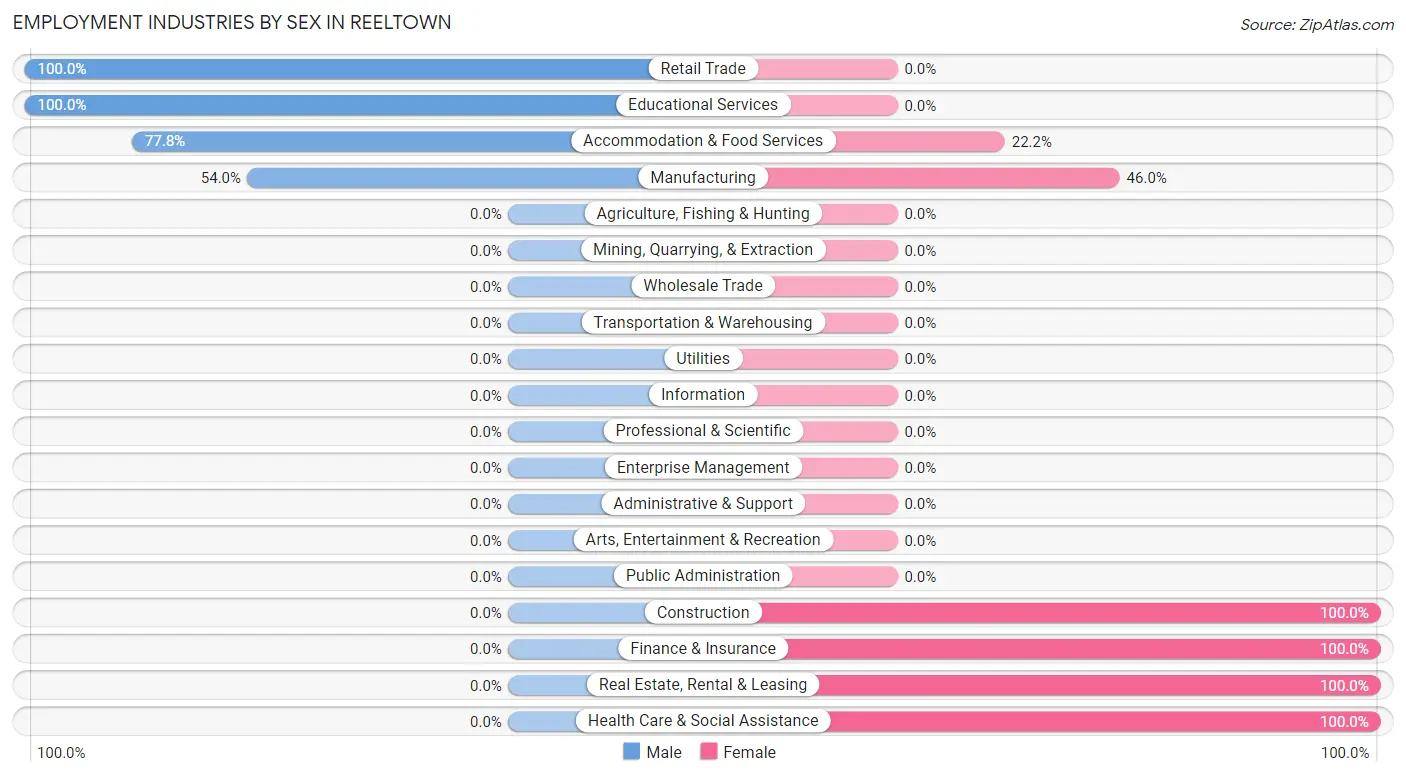
Employment Industries by Sex in Reeltown
The Reeltown industries that see more men than women are Retail Trade (100.0%), Educational Services (100.0%), and Accommodation & Food Services (77.8%), whereas the industries that tend to have a higher number of women are Construction (100.0%), Finance & Insurance (100.0%), and Real Estate, Rental & Leasing (100.0%).
| Industry | Male | Female |
| Agriculture, Fishing & Hunting | 0 (0.0%) | 0 (0.0%) |
| Mining, Quarrying, & Extraction | 0 (0.0%) | 0 (0.0%) |
| Construction | 0 (0.0%) | 12 (100.0%) |
| Manufacturing | 27 (54.0%) | 23 (46.0%) |
| Wholesale Trade | 0 (0.0%) | 0 (0.0%) |
| Retail Trade | 9 (100.0%) | 0 (0.0%) |
| Transportation & Warehousing | 0 (0.0%) | 0 (0.0%) |
| Utilities | 0 (0.0%) | 0 (0.0%) |
| Information | 0 (0.0%) | 0 (0.0%) |
| Finance & Insurance | 0 (0.0%) | 26 (100.0%) |
| Real Estate, Rental & Leasing | 0 (0.0%) | 8 (100.0%) |
| Professional & Scientific | 0 (0.0%) | 0 (0.0%) |
| Enterprise Management | 0 (0.0%) | 0 (0.0%) |
| Administrative & Support | 0 (0.0%) | 0 (0.0%) |
| Educational Services | 25 (100.0%) | 0 (0.0%) |
| Health Care & Social Assistance | 0 (0.0%) | 16 (100.0%) |
| Arts, Entertainment & Recreation | 0 (0.0%) | 0 (0.0%) |
| Accommodation & Food Services | 42 (77.8%) | 12 (22.2%) |
| Public Administration | 0 (0.0%) | 0 (0.0%) |
| Total | 103 (46.4%) | 119 (53.6%) |
Education in Reeltown
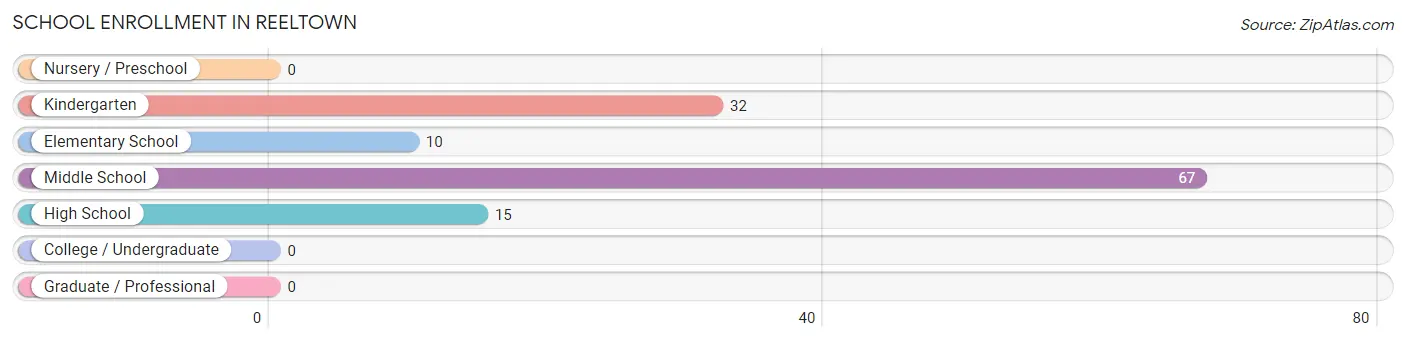
School Enrollment in Reeltown
The most common levels of schooling among the 124 students in Reeltown are middle school (67 | 54.0%), kindergarten (32 | 25.8%), and high school (15 | 12.1%).
| School Level | # Students | % Students |
| Nursery / Preschool | 0 | 0.0% |
| Kindergarten | 32 | 25.8% |
| Elementary School | 10 | 8.1% |
| Middle School | 67 | 54.0% |
| High School | 15 | 12.1% |
| College / Undergraduate | 0 | 0.0% |
| Graduate / Professional | 0 | 0.0% |
| Total | 124 | 100.0% |
School Enrollment by Age by Funding Source in Reeltown
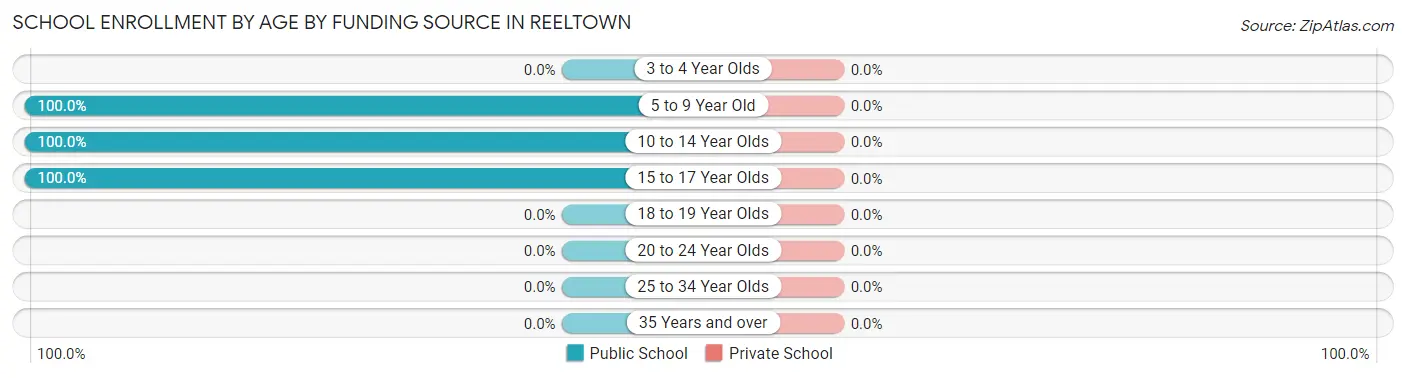
| Age Bracket | Public School | Private School |
| 3 to 4 Year Olds | 0 (0.0%) | 0 (0.0%) |
| 5 to 9 Year Old | 42 (100.0%) | 0 (0.0%) |
| 10 to 14 Year Olds | 67 (100.0%) | 0 (0.0%) |
| 15 to 17 Year Olds | 15 (100.0%) | 0 (0.0%) |
| 18 to 19 Year Olds | 0 (0.0%) | 0 (0.0%) |
| 20 to 24 Year Olds | 0 (0.0%) | 0 (0.0%) |
| 25 to 34 Year Olds | 0 (0.0%) | 0 (0.0%) |
| 35 Years and over | 0 (0.0%) | 0 (0.0%) |
| Total | 124 (100.0%) | 0 (0.0%) |
Educational Attainment by Field of Study in Reeltown
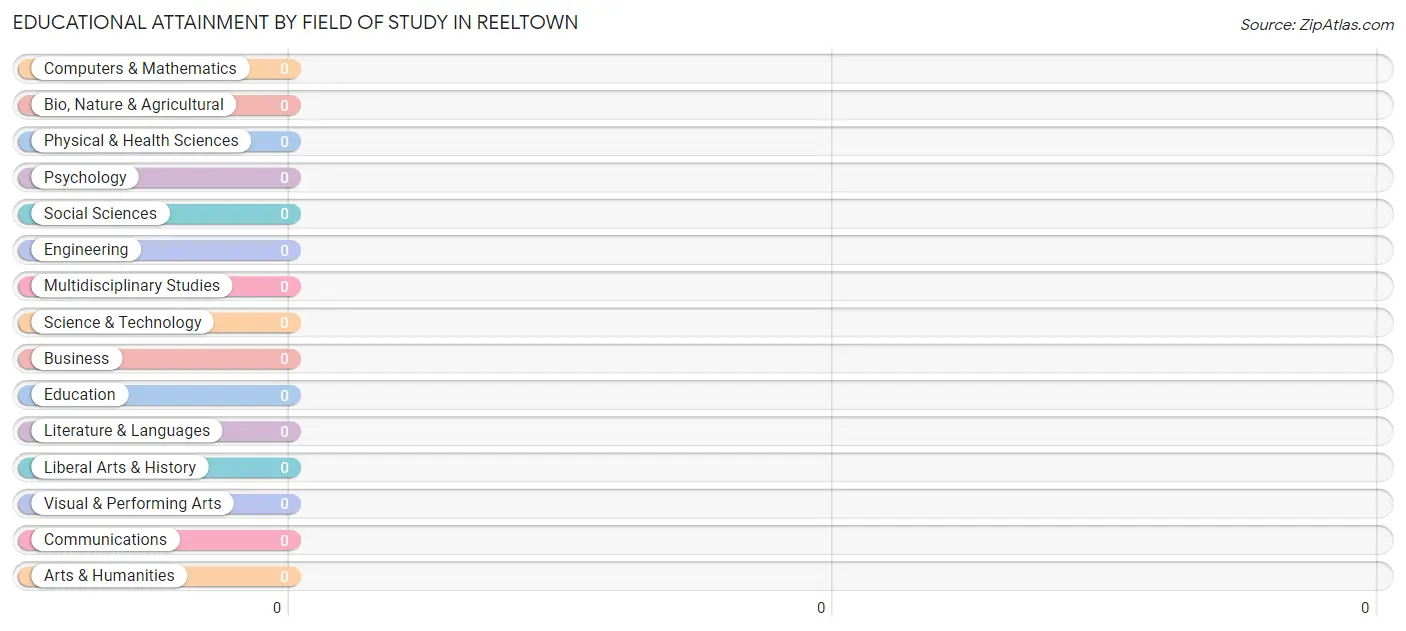
| Field of Study | # Graduates | % Graduates |
| Computers & Mathematics | 0 | 0.0% |
| Bio, Nature & Agricultural | 0 | 0.0% |
| Physical & Health Sciences | 0 | 0.0% |
| Psychology | 0 | 0.0% |
| Social Sciences | 0 | 0.0% |
| Engineering | 0 | 0.0% |
| Multidisciplinary Studies | 0 | 0.0% |
| Science & Technology | 0 | 0.0% |
| Business | 0 | 0.0% |
| Education | 0 | 0.0% |
| Literature & Languages | 0 | 0.0% |
| Liberal Arts & History | 0 | 0.0% |
| Visual & Performing Arts | 0 | 0.0% |
| Communications | 0 | 0.0% |
| Arts & Humanities | 0 | 0.0% |
| Total | 0 | 0.0% |
Transportation & Commute in Reeltown
Vehicle Availability by Sex in Reeltown
The most prevalent vehicle ownership categories in Reeltown are males with 3 vehicles (87, accounting for 84.5%) and females with 3 vehicles (16, making up 73.1%).
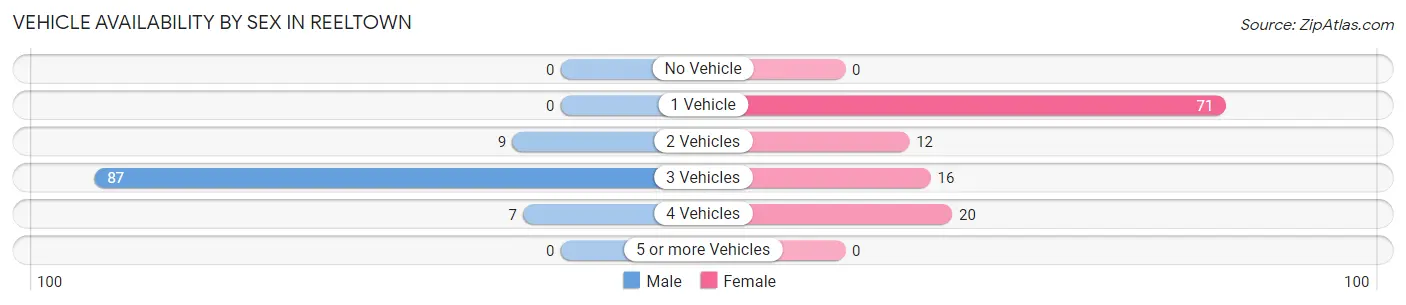
| Vehicles Available | Male | Female |
| No Vehicle | 0 (0.0%) | 0 (0.0%) |
| 1 Vehicle | 0 (0.0%) | 71 (59.7%) |
| 2 Vehicles | 9 (8.7%) | 12 (10.1%) |
| 3 Vehicles | 87 (84.5%) | 16 (13.5%) |
| 4 Vehicles | 7 (6.8%) | 20 (16.8%) |
| 5 or more Vehicles | 0 (0.0%) | 0 (0.0%) |
| Total | 103 (100.0%) | 119 (100.0%) |
Commute Time in Reeltown
The most frequently occuring commute durations in Reeltown are 40 to 44 minutes (64 commuters, 28.8%), 35 to 39 minutes (58 commuters, 26.1%), and 45 to 59 minutes (40 commuters, 18.0%).
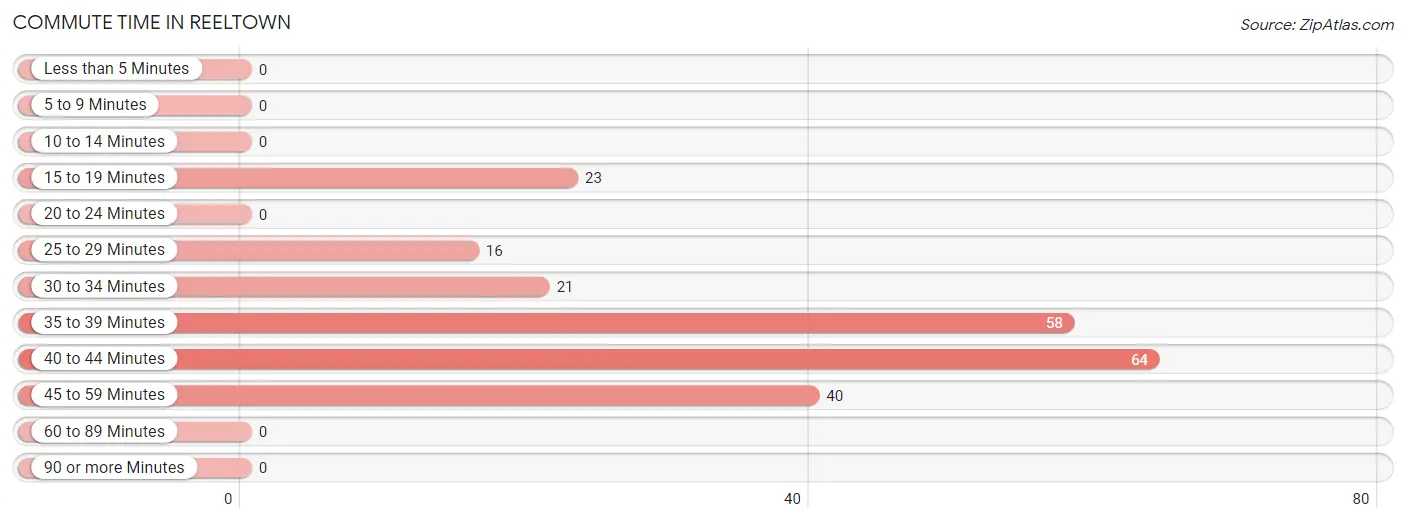
| Commute Time | # Commuters | % Commuters |
| Less than 5 Minutes | 0 | 0.0% |
| 5 to 9 Minutes | 0 | 0.0% |
| 10 to 14 Minutes | 0 | 0.0% |
| 15 to 19 Minutes | 23 | 10.4% |
| 20 to 24 Minutes | 0 | 0.0% |
| 25 to 29 Minutes | 16 | 7.2% |
| 30 to 34 Minutes | 21 | 9.5% |
| 35 to 39 Minutes | 58 | 26.1% |
| 40 to 44 Minutes | 64 | 28.8% |
| 45 to 59 Minutes | 40 | 18.0% |
| 60 to 89 Minutes | 0 | 0.0% |
| 90 or more Minutes | 0 | 0.0% |
Commute Time by Sex in Reeltown
The most common commute times in Reeltown are 40 to 44 minutes (42 commuters, 40.8%) for males and 35 to 39 minutes (26 commuters, 21.8%) for females.
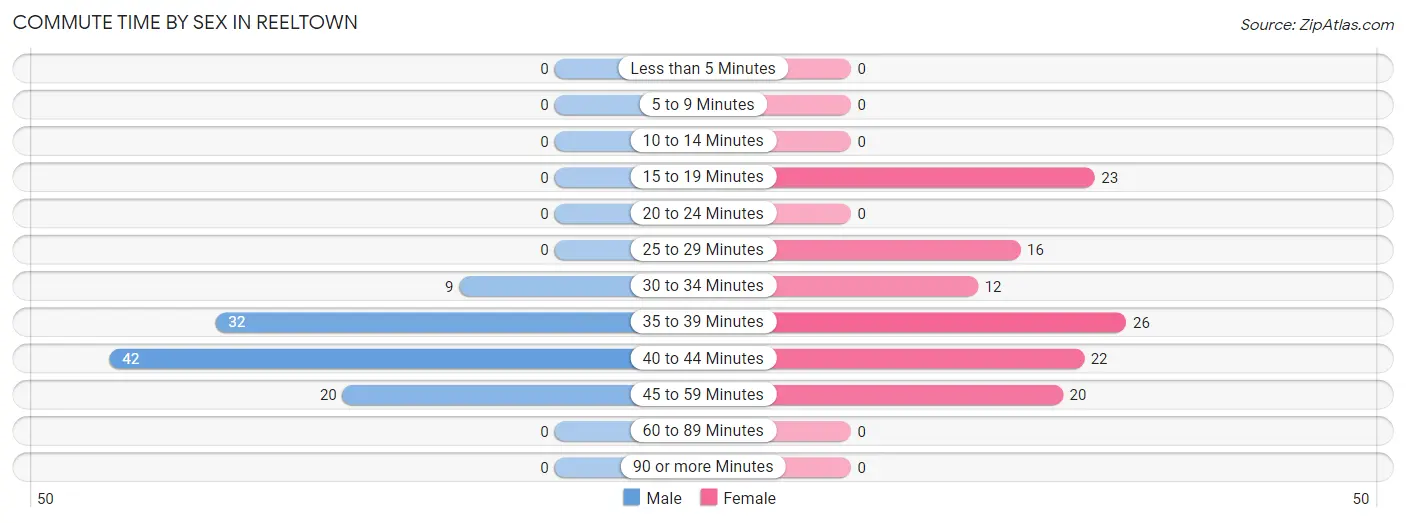
| Commute Time | Male | Female |
| Less than 5 Minutes | 0 (0.0%) | 0 (0.0%) |
| 5 to 9 Minutes | 0 (0.0%) | 0 (0.0%) |
| 10 to 14 Minutes | 0 (0.0%) | 0 (0.0%) |
| 15 to 19 Minutes | 0 (0.0%) | 23 (19.3%) |
| 20 to 24 Minutes | 0 (0.0%) | 0 (0.0%) |
| 25 to 29 Minutes | 0 (0.0%) | 16 (13.5%) |
| 30 to 34 Minutes | 9 (8.7%) | 12 (10.1%) |
| 35 to 39 Minutes | 32 (31.1%) | 26 (21.8%) |
| 40 to 44 Minutes | 42 (40.8%) | 22 (18.5%) |
| 45 to 59 Minutes | 20 (19.4%) | 20 (16.8%) |
| 60 to 89 Minutes | 0 (0.0%) | 0 (0.0%) |
| 90 or more Minutes | 0 (0.0%) | 0 (0.0%) |
Time of Departure to Work by Sex in Reeltown
The most frequent times of departure to work in Reeltown are 6:00 AM to 6:29 AM (74, 71.8%) for males and 12:00 PM to 3:59 PM (38, 31.9%) for females.
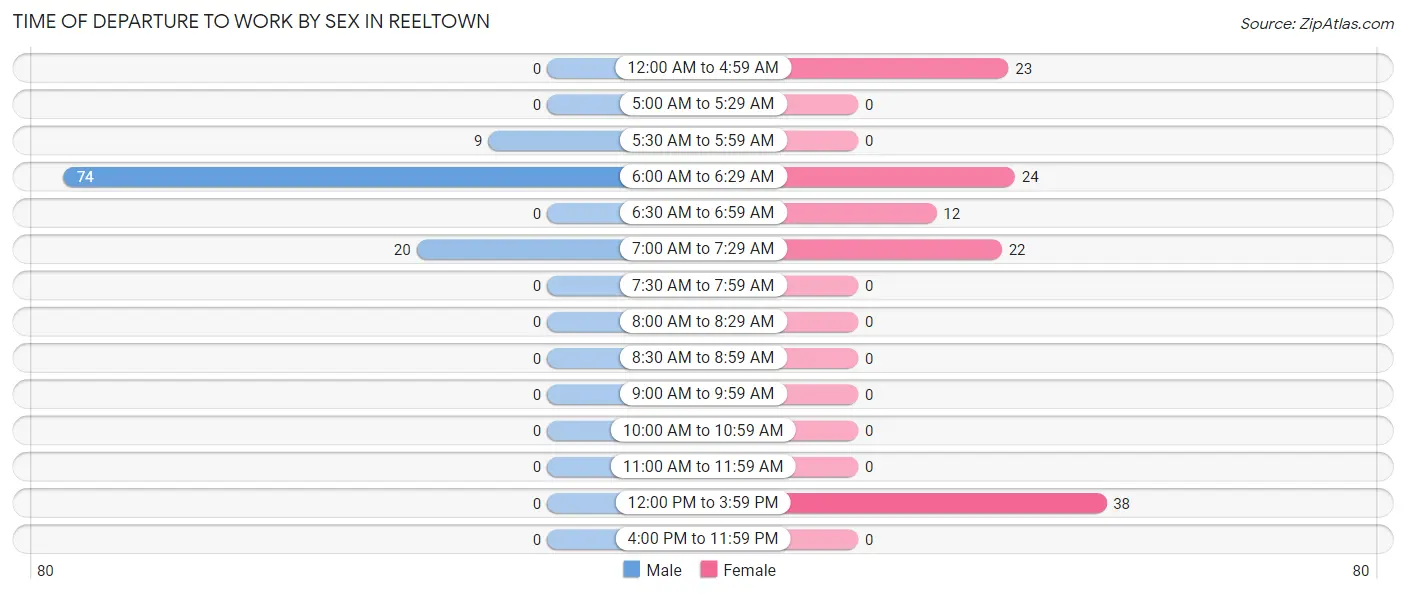
| Time of Departure | Male | Female |
| 12:00 AM to 4:59 AM | 0 (0.0%) | 23 (19.3%) |
| 5:00 AM to 5:29 AM | 0 (0.0%) | 0 (0.0%) |
| 5:30 AM to 5:59 AM | 9 (8.7%) | 0 (0.0%) |
| 6:00 AM to 6:29 AM | 74 (71.8%) | 24 (20.2%) |
| 6:30 AM to 6:59 AM | 0 (0.0%) | 12 (10.1%) |
| 7:00 AM to 7:29 AM | 20 (19.4%) | 22 (18.5%) |
| 7:30 AM to 7:59 AM | 0 (0.0%) | 0 (0.0%) |
| 8:00 AM to 8:29 AM | 0 (0.0%) | 0 (0.0%) |
| 8:30 AM to 8:59 AM | 0 (0.0%) | 0 (0.0%) |
| 9:00 AM to 9:59 AM | 0 (0.0%) | 0 (0.0%) |
| 10:00 AM to 10:59 AM | 0 (0.0%) | 0 (0.0%) |
| 11:00 AM to 11:59 AM | 0 (0.0%) | 0 (0.0%) |
| 12:00 PM to 3:59 PM | 0 (0.0%) | 38 (31.9%) |
| 4:00 PM to 11:59 PM | 0 (0.0%) | 0 (0.0%) |
| Total | 103 (100.0%) | 119 (100.0%) |
Housing Occupancy in Reeltown
Occupancy by Ownership in Reeltown
Of the total 176 dwellings in Reeltown, owner-occupied units account for 145 (82.4%), while renter-occupied units make up 31 (17.6%).
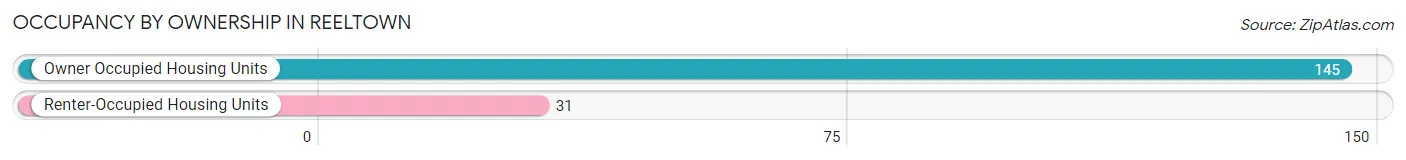
| Occupancy | # Housing Units | % Housing Units |
| Owner Occupied Housing Units | 145 | 82.4% |
| Renter-Occupied Housing Units | 31 | 17.6% |
| Total Occupied Housing Units | 176 | 100.0% |
Occupancy by Household Size in Reeltown
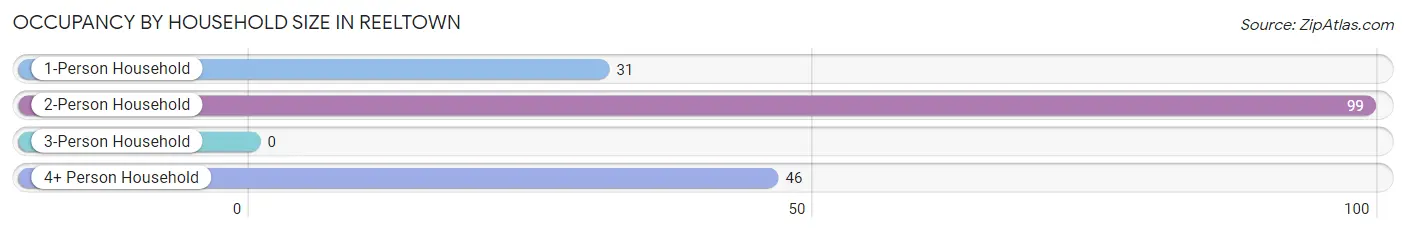
| Household Size | # Housing Units | % Housing Units |
| 1-Person Household | 31 | 17.6% |
| 2-Person Household | 99 | 56.2% |
| 3-Person Household | 0 | 0.0% |
| 4+ Person Household | 46 | 26.1% |
| Total Housing Units | 176 | 100.0% |
Occupancy by Ownership by Household Size in Reeltown
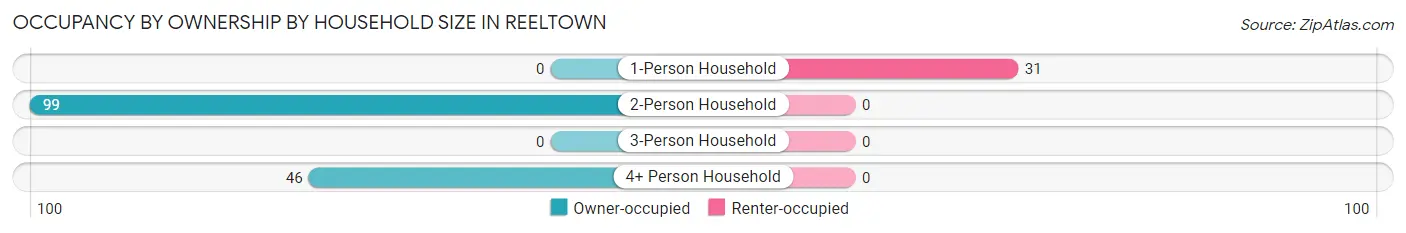
| Household Size | Owner-occupied | Renter-occupied |
| 1-Person Household | 0 (0.0%) | 31 (100.0%) |
| 2-Person Household | 99 (100.0%) | 0 (0.0%) |
| 3-Person Household | 0 (0.0%) | 0 (0.0%) |
| 4+ Person Household | 46 (100.0%) | 0 (0.0%) |
| Total Housing Units | 145 (82.4%) | 31 (17.6%) |
Occupancy by Educational Attainment in Reeltown
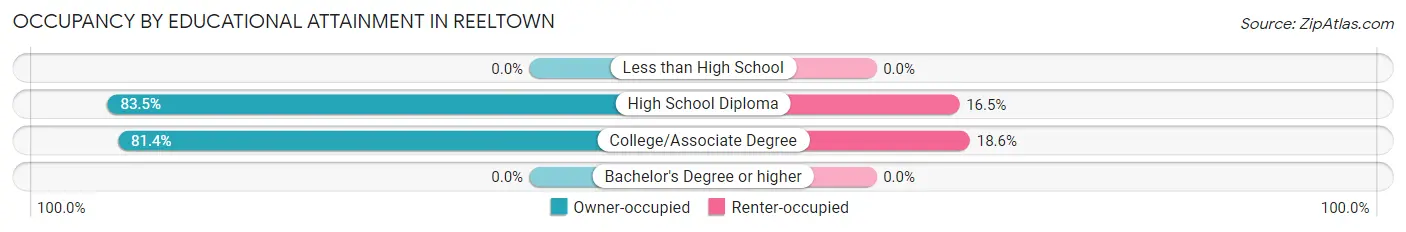
| Household Size | Owner-occupied | Renter-occupied |
| Less than High School | 0 (0.0%) | 0 (0.0%) |
| High School Diploma | 66 (83.5%) | 13 (16.5%) |
| College/Associate Degree | 79 (81.4%) | 18 (18.6%) |
| Bachelor's Degree or higher | 0 (0.0%) | 0 (0.0%) |
Occupancy by Age of Householder in Reeltown
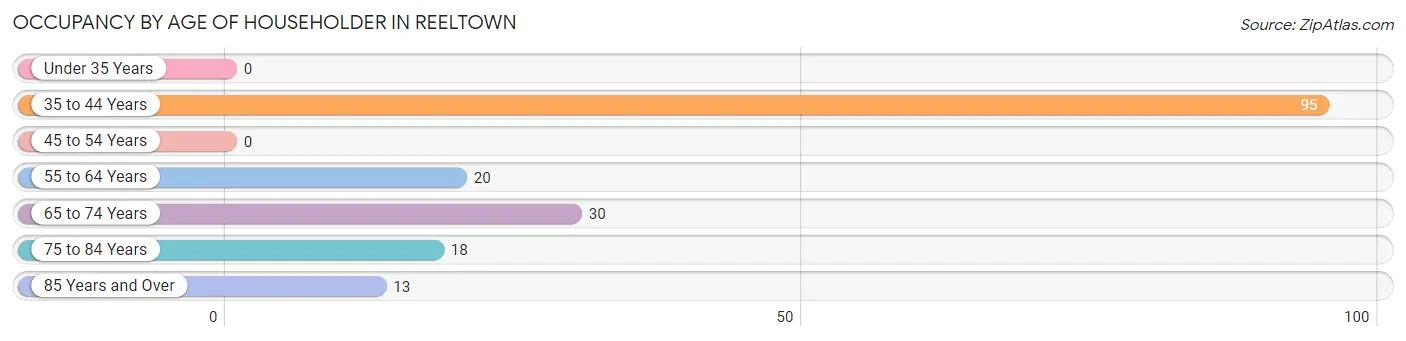
| Age Bracket | # Households | % Households |
| Under 35 Years | 0 | 0.0% |
| 35 to 44 Years | 95 | 54.0% |
| 45 to 54 Years | 0 | 0.0% |
| 55 to 64 Years | 20 | 11.4% |
| 65 to 74 Years | 30 | 17.1% |
| 75 to 84 Years | 18 | 10.2% |
| 85 Years and Over | 13 | 7.4% |
| Total | 176 | 100.0% |
Housing Finances in Reeltown
Median Income by Occupancy in Reeltown
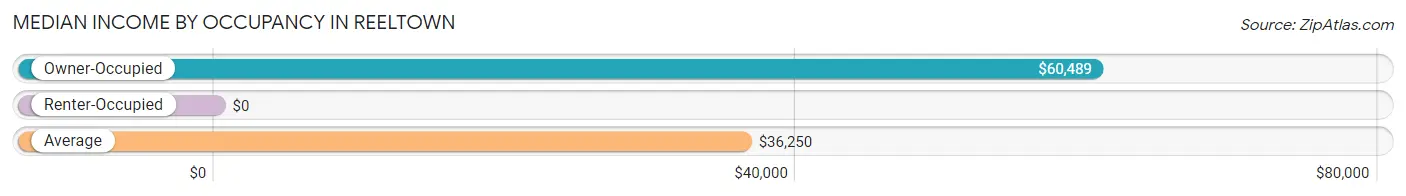
| Occupancy Type | # Households | Median Income |
| Owner-Occupied | 145 (82.4%) | $60,489 |
| Renter-Occupied | 31 (17.6%) | $0 |
| Average | 176 (100.0%) | $36,250 |
Occupancy by Householder Income Bracket in Reeltown
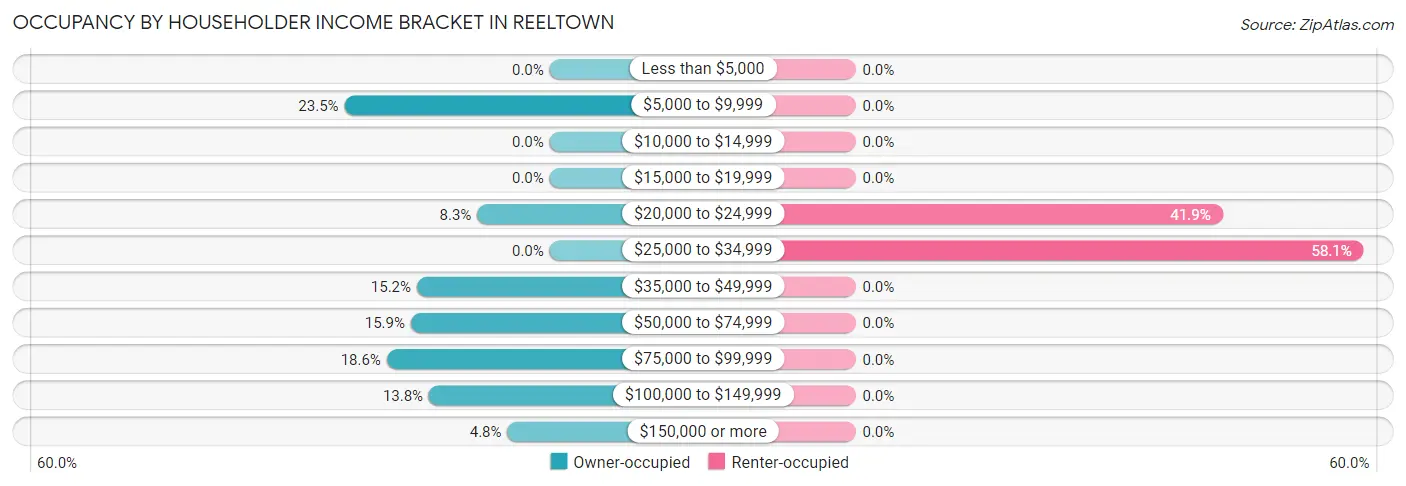
| Income Bracket | Owner-occupied | Renter-occupied |
| Less than $5,000 | 0 (0.0%) | 0 (0.0%) |
| $5,000 to $9,999 | 34 (23.4%) | 0 (0.0%) |
| $10,000 to $14,999 | 0 (0.0%) | 0 (0.0%) |
| $15,000 to $19,999 | 0 (0.0%) | 0 (0.0%) |
| $20,000 to $24,999 | 12 (8.3%) | 13 (41.9%) |
| $25,000 to $34,999 | 0 (0.0%) | 18 (58.1%) |
| $35,000 to $49,999 | 22 (15.2%) | 0 (0.0%) |
| $50,000 to $74,999 | 23 (15.9%) | 0 (0.0%) |
| $75,000 to $99,999 | 27 (18.6%) | 0 (0.0%) |
| $100,000 to $149,999 | 20 (13.8%) | 0 (0.0%) |
| $150,000 or more | 7 (4.8%) | 0 (0.0%) |
| Total | 145 (100.0%) | 31 (100.0%) |
Monthly Housing Cost Tiers in Reeltown
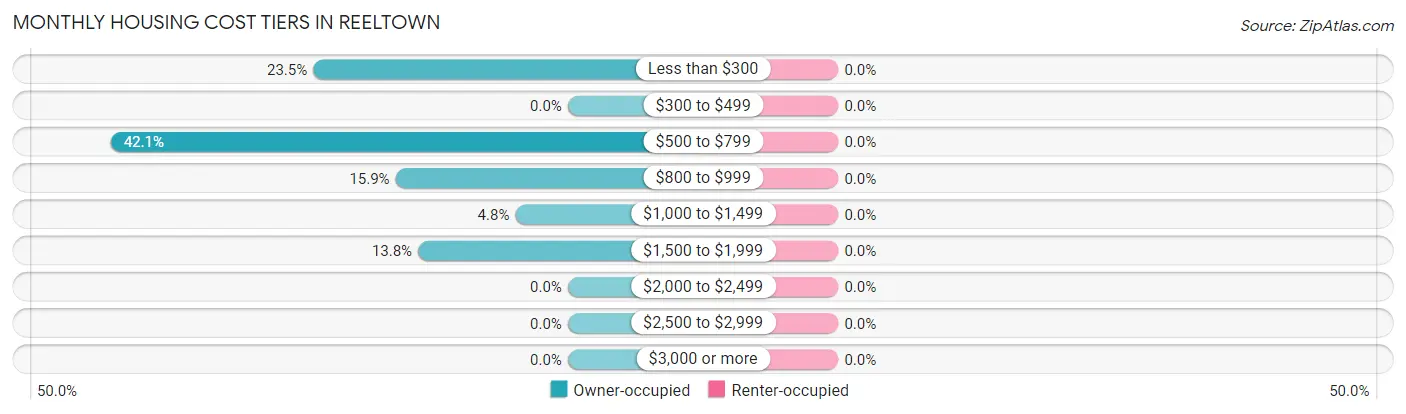
| Monthly Cost | Owner-occupied | Renter-occupied |
| Less than $300 | 34 (23.4%) | 0 (0.0%) |
| $300 to $499 | 0 (0.0%) | 0 (0.0%) |
| $500 to $799 | 61 (42.1%) | 0 (0.0%) |
| $800 to $999 | 23 (15.9%) | 0 (0.0%) |
| $1,000 to $1,499 | 7 (4.8%) | 0 (0.0%) |
| $1,500 to $1,999 | 20 (13.8%) | 0 (0.0%) |
| $2,000 to $2,499 | 0 (0.0%) | 0 (0.0%) |
| $2,500 to $2,999 | 0 (0.0%) | 0 (0.0%) |
| $3,000 or more | 0 (0.0%) | 0 (0.0%) |
| Total | 145 (100.0%) | 31 (100.0%) |
Physical Housing Characteristics in Reeltown
Housing Structures in Reeltown
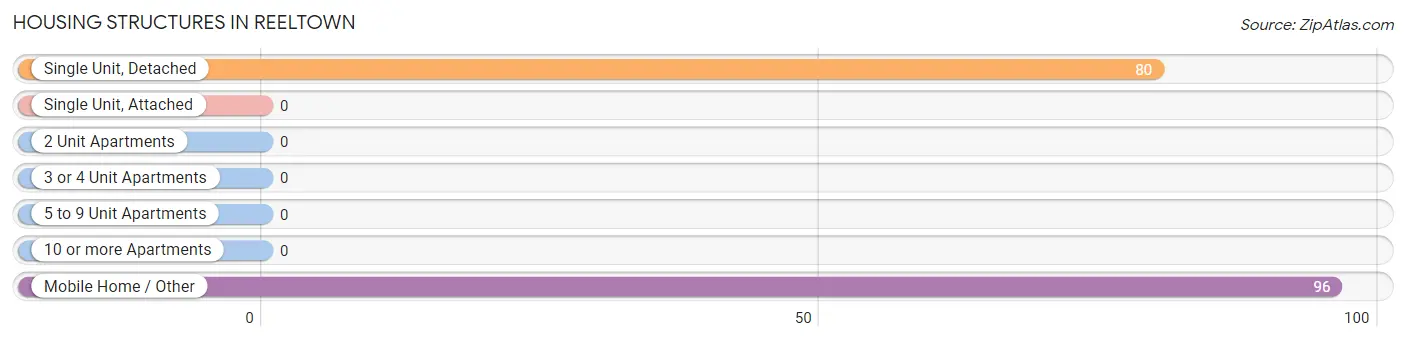
| Structure Type | # Housing Units | % Housing Units |
| Single Unit, Detached | 80 | 45.5% |
| Single Unit, Attached | 0 | 0.0% |
| 2 Unit Apartments | 0 | 0.0% |
| 3 or 4 Unit Apartments | 0 | 0.0% |
| 5 to 9 Unit Apartments | 0 | 0.0% |
| 10 or more Apartments | 0 | 0.0% |
| Mobile Home / Other | 96 | 54.5% |
| Total | 176 | 100.0% |
Housing Structures by Occupancy in Reeltown
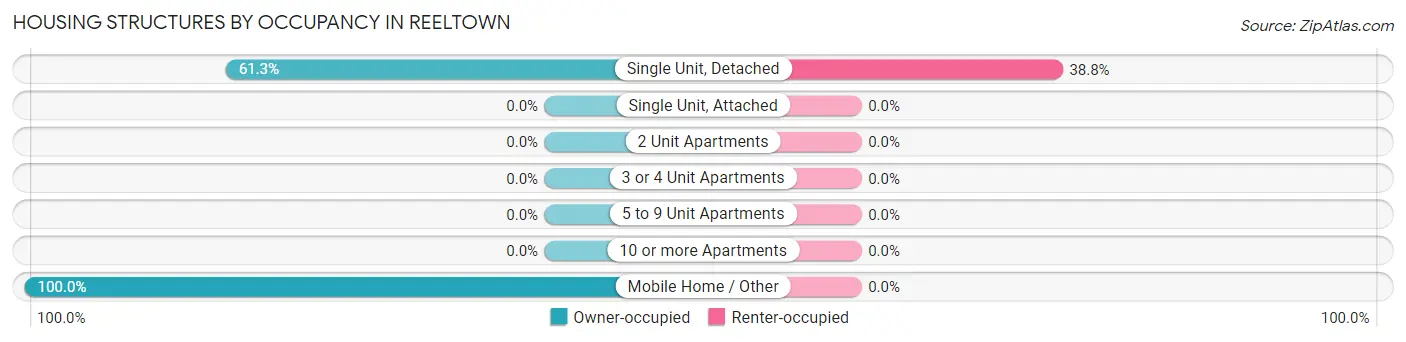
| Structure Type | Owner-occupied | Renter-occupied |
| Single Unit, Detached | 49 (61.3%) | 31 (38.8%) |
| Single Unit, Attached | 0 (0.0%) | 0 (0.0%) |
| 2 Unit Apartments | 0 (0.0%) | 0 (0.0%) |
| 3 or 4 Unit Apartments | 0 (0.0%) | 0 (0.0%) |
| 5 to 9 Unit Apartments | 0 (0.0%) | 0 (0.0%) |
| 10 or more Apartments | 0 (0.0%) | 0 (0.0%) |
| Mobile Home / Other | 96 (100.0%) | 0 (0.0%) |
| Total | 145 (82.4%) | 31 (17.6%) |
Housing Structures by Number of Rooms in Reeltown
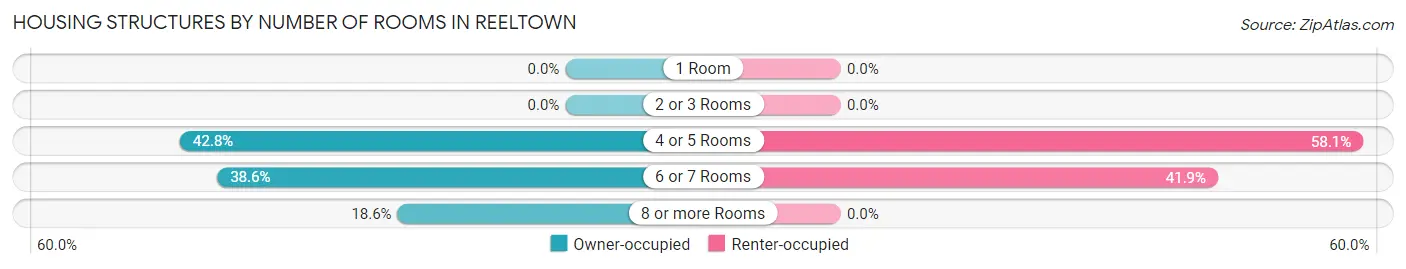
| Number of Rooms | Owner-occupied | Renter-occupied |
| 1 Room | 0 (0.0%) | 0 (0.0%) |
| 2 or 3 Rooms | 0 (0.0%) | 0 (0.0%) |
| 4 or 5 Rooms | 62 (42.8%) | 18 (58.1%) |
| 6 or 7 Rooms | 56 (38.6%) | 13 (41.9%) |
| 8 or more Rooms | 27 (18.6%) | 0 (0.0%) |
| Total | 145 (100.0%) | 31 (100.0%) |
Housing Structure by Heating Type in Reeltown
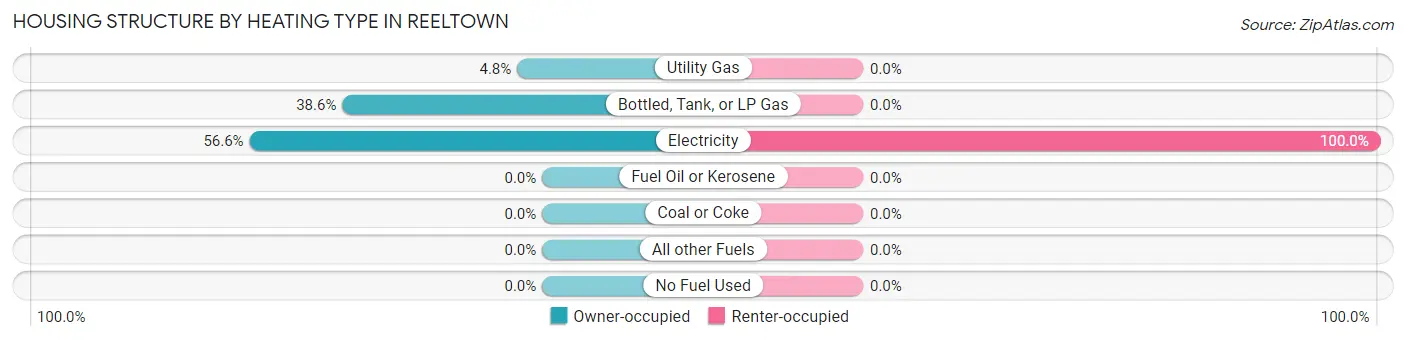
| Heating Type | Owner-occupied | Renter-occupied |
| Utility Gas | 7 (4.8%) | 0 (0.0%) |
| Bottled, Tank, or LP Gas | 56 (38.6%) | 0 (0.0%) |
| Electricity | 82 (56.6%) | 31 (100.0%) |
| Fuel Oil or Kerosene | 0 (0.0%) | 0 (0.0%) |
| Coal or Coke | 0 (0.0%) | 0 (0.0%) |
| All other Fuels | 0 (0.0%) | 0 (0.0%) |
| No Fuel Used | 0 (0.0%) | 0 (0.0%) |
| Total | 145 (100.0%) | 31 (100.0%) |
Household Vehicle Usage in Reeltown
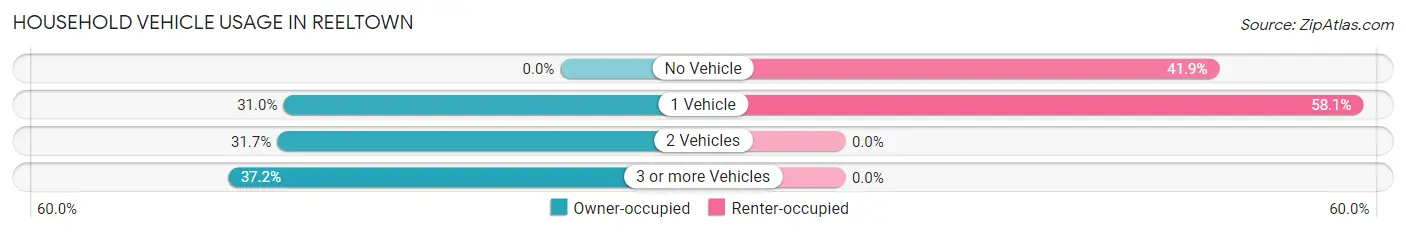
| Vehicles per Household | Owner-occupied | Renter-occupied |
| No Vehicle | 0 (0.0%) | 13 (41.9%) |
| 1 Vehicle | 45 (31.0%) | 18 (58.1%) |
| 2 Vehicles | 46 (31.7%) | 0 (0.0%) |
| 3 or more Vehicles | 54 (37.2%) | 0 (0.0%) |
| Total | 145 (100.0%) | 31 (100.0%) |
Real Estate & Mortgages in Reeltown
Real Estate and Mortgage Overview in Reeltown
| Characteristic | Without Mortgage | With Mortgage |
| Housing Units | 83 | 62 |
| Median Property Value | - | - |
| Median Household Income | - | - |
| Monthly Housing Costs | $572 | $0 |
| Real Estate Taxes | - | - |
Property Value by Mortgage Status in Reeltown
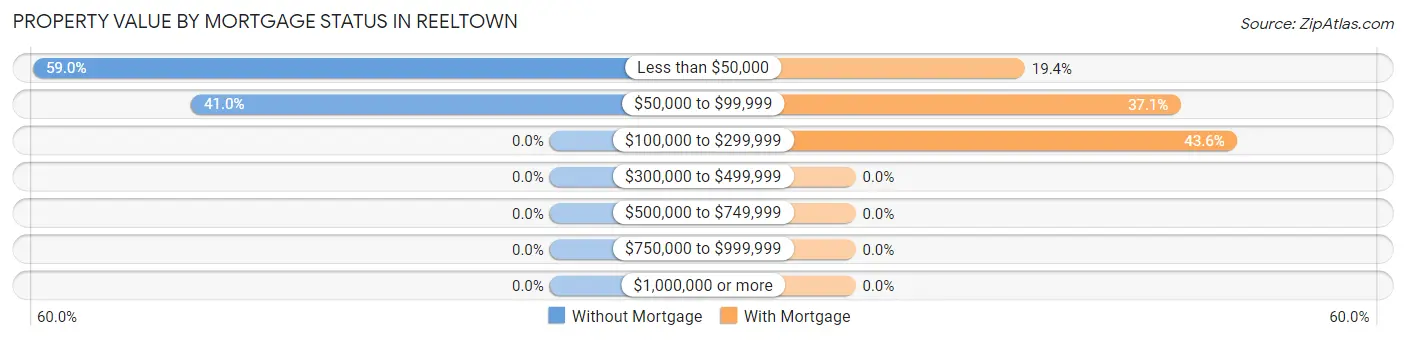
| Property Value | Without Mortgage | With Mortgage |
| Less than $50,000 | 49 (59.0%) | 12 (19.4%) |
| $50,000 to $99,999 | 34 (41.0%) | 23 (37.1%) |
| $100,000 to $299,999 | 0 (0.0%) | 27 (43.5%) |
| $300,000 to $499,999 | 0 (0.0%) | 0 (0.0%) |
| $500,000 to $749,999 | 0 (0.0%) | 0 (0.0%) |
| $750,000 to $999,999 | 0 (0.0%) | 0 (0.0%) |
| $1,000,000 or more | 0 (0.0%) | 0 (0.0%) |
| Total | 83 (100.0%) | 62 (100.0%) |
Household Income by Mortgage Status in Reeltown
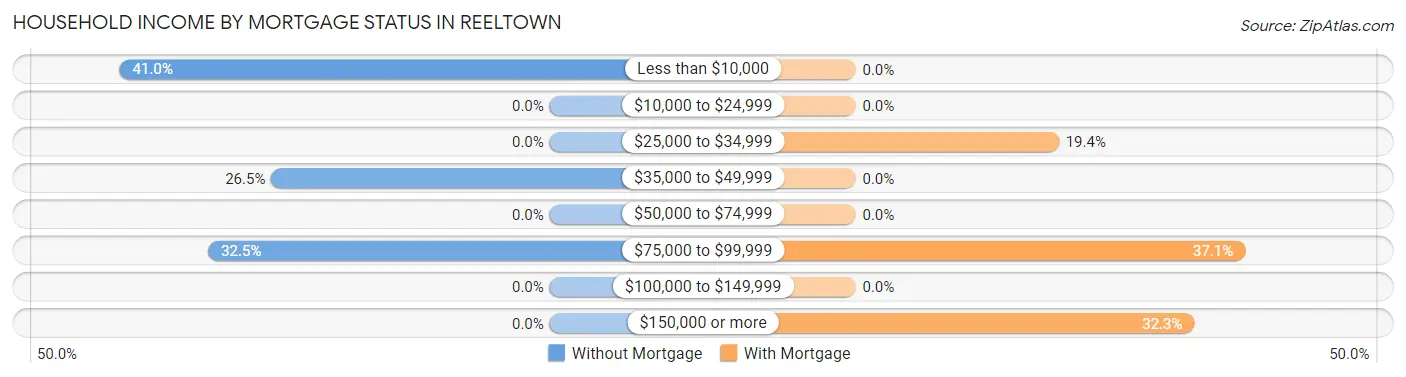
| Household Income | Without Mortgage | With Mortgage |
| Less than $10,000 | 34 (41.0%) | 0 (0.0%) |
| $10,000 to $24,999 | 0 (0.0%) | 0 (0.0%) |
| $25,000 to $34,999 | 0 (0.0%) | 12 (19.4%) |
| $35,000 to $49,999 | 22 (26.5%) | 0 (0.0%) |
| $50,000 to $74,999 | 0 (0.0%) | 0 (0.0%) |
| $75,000 to $99,999 | 27 (32.5%) | 23 (37.1%) |
| $100,000 to $149,999 | 0 (0.0%) | 0 (0.0%) |
| $150,000 or more | 0 (0.0%) | 20 (32.3%) |
| Total | 83 (100.0%) | 62 (100.0%) |
Property Value to Household Income Ratio in Reeltown
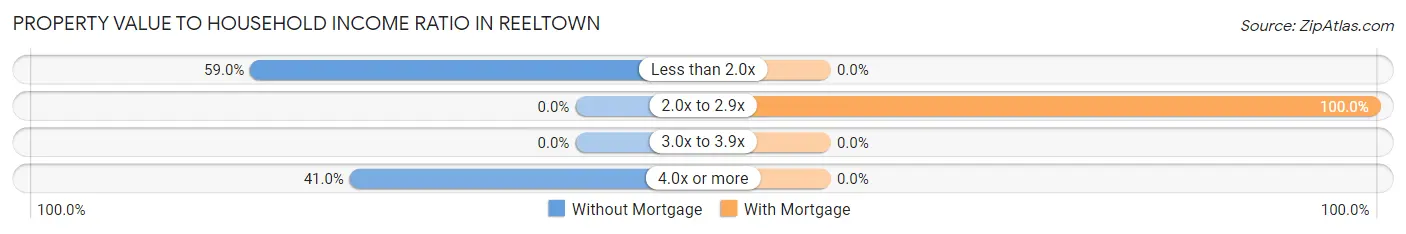
| Value-to-Income Ratio | Without Mortgage | With Mortgage |
| Less than 2.0x | 49 (59.0%) | 0 (0.0%) |
| 2.0x to 2.9x | 0 (0.0%) | 62 (100.0%) |
| 3.0x to 3.9x | 0 (0.0%) | 0 (0.0%) |
| 4.0x or more | 34 (41.0%) | 0 (0.0%) |
| Total | 83 (100.0%) | 62 (100.0%) |
Real Estate Taxes by Mortgage Status in Reeltown
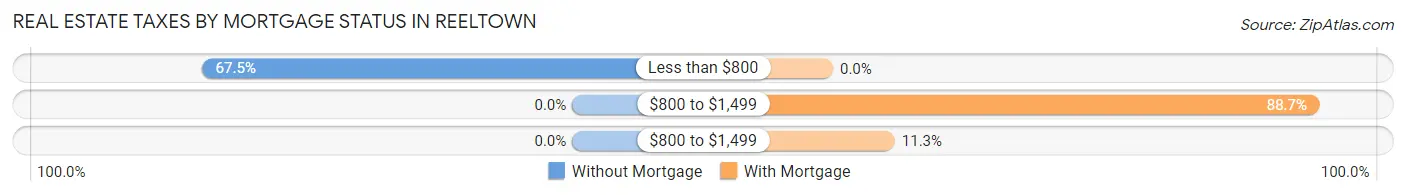
| Property Taxes | Without Mortgage | With Mortgage |
| Less than $800 | 56 (67.5%) | 0 (0.0%) |
| $800 to $1,499 | 0 (0.0%) | 55 (88.7%) |
| $800 to $1,499 | 0 (0.0%) | 7 (11.3%) |
| Total | 83 (100.0%) | 62 (100.0%) |
Health & Disability in Reeltown
Health Insurance Coverage by Age in Reeltown
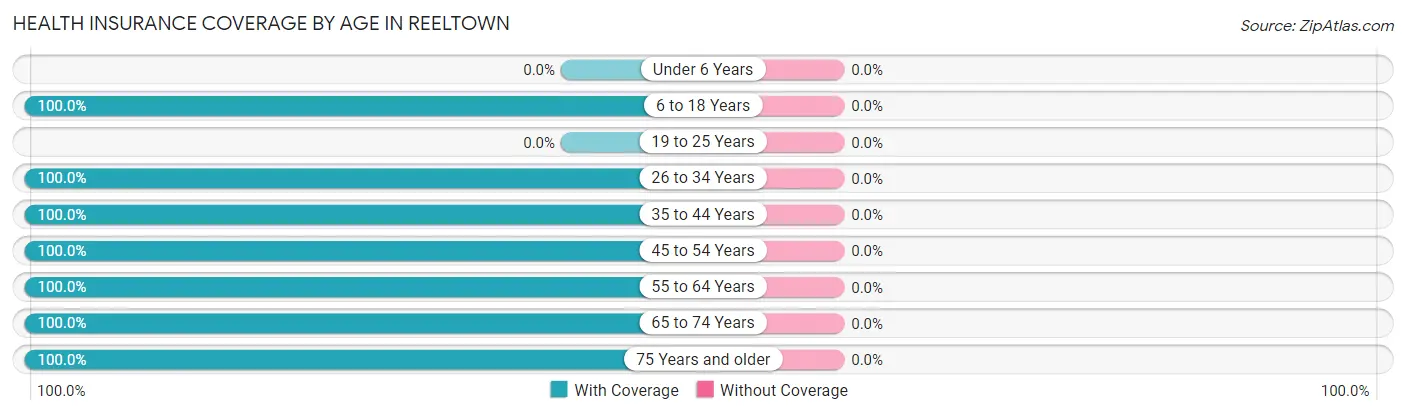
| Age Bracket | With Coverage | Without Coverage |
| Under 6 Years | 0 (0.0%) | 0 (0.0%) |
| 6 to 18 Years | 150 (100.0%) | 0 (0.0%) |
| 19 to 25 Years | 0 (0.0%) | 0 (0.0%) |
| 26 to 34 Years | 88 (100.0%) | 0 (0.0%) |
| 35 to 44 Years | 95 (100.0%) | 0 (0.0%) |
| 45 to 54 Years | 16 (100.0%) | 0 (0.0%) |
| 55 to 64 Years | 52 (100.0%) | 0 (0.0%) |
| 65 to 74 Years | 30 (100.0%) | 0 (0.0%) |
| 75 Years and older | 31 (100.0%) | 0 (0.0%) |
| Total | 462 (100.0%) | 0 (0.0%) |
Health Insurance Coverage by Citizenship Status in Reeltown
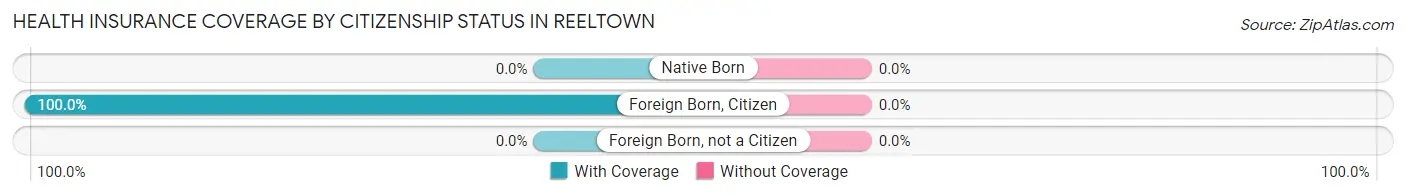
| Citizenship Status | With Coverage | Without Coverage |
| Native Born | 0 (0.0%) | 0 (0.0%) |
| Foreign Born, Citizen | 150 (100.0%) | 0 (0.0%) |
| Foreign Born, not a Citizen | 0 (0.0%) | 0 (0.0%) |
Health Insurance Coverage by Household Income in Reeltown
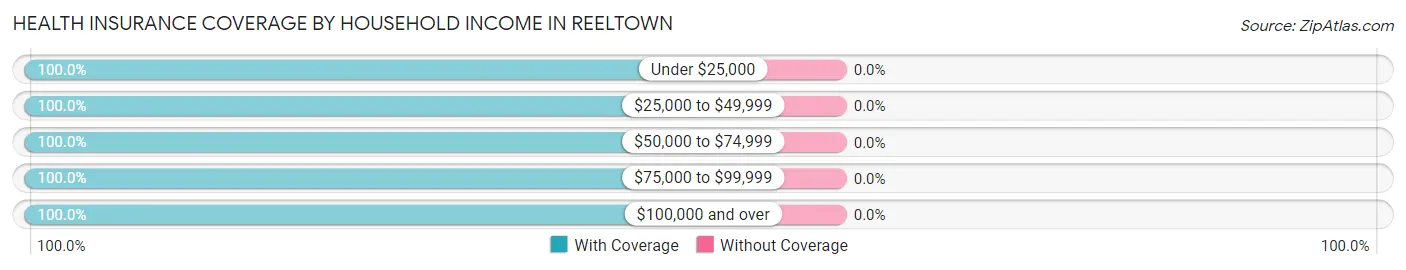
| Household Income | With Coverage | Without Coverage |
| Under $25,000 | 146 (100.0%) | 0 (0.0%) |
| $25,000 to $49,999 | 66 (100.0%) | 0 (0.0%) |
| $50,000 to $74,999 | 47 (100.0%) | 0 (0.0%) |
| $75,000 to $99,999 | 130 (100.0%) | 0 (0.0%) |
| $100,000 and over | 73 (100.0%) | 0 (0.0%) |
Public vs Private Health Insurance Coverage by Age in Reeltown
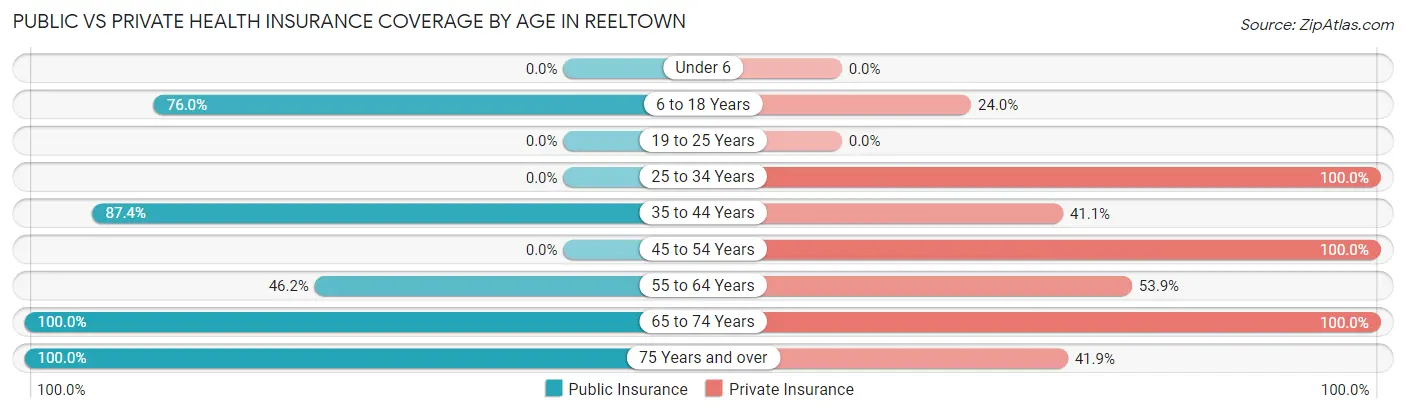
| Age Bracket | Public Insurance | Private Insurance |
| Under 6 | 0 (0.0%) | 0 (0.0%) |
| 6 to 18 Years | 114 (76.0%) | 36 (24.0%) |
| 19 to 25 Years | 0 (0.0%) | 0 (0.0%) |
| 25 to 34 Years | 0 (0.0%) | 88 (100.0%) |
| 35 to 44 Years | 83 (87.4%) | 39 (41.0%) |
| 45 to 54 Years | 0 (0.0%) | 16 (100.0%) |
| 55 to 64 Years | 24 (46.2%) | 28 (53.8%) |
| 65 to 74 Years | 30 (100.0%) | 30 (100.0%) |
| 75 Years and over | 31 (100.0%) | 13 (41.9%) |
| Total | 282 (61.0%) | 250 (54.1%) |
Disability Status by Sex by Age in Reeltown
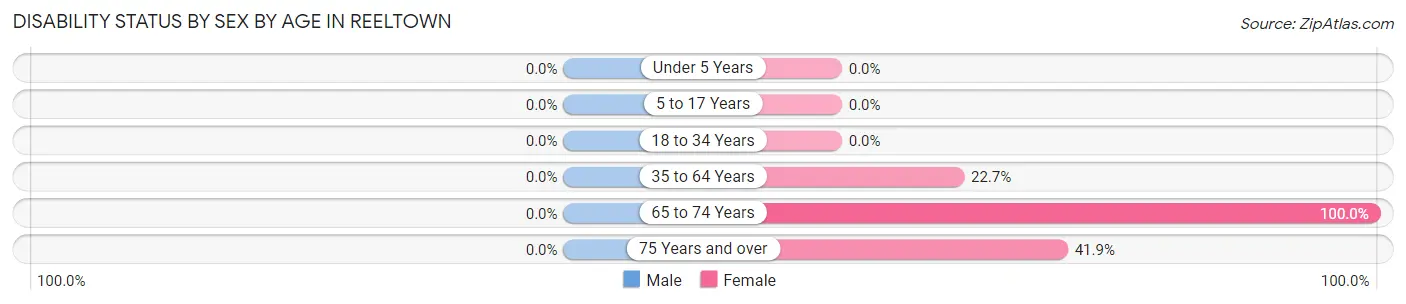
| Age Bracket | Male | Female |
| Under 5 Years | 0 (0.0%) | 0 (0.0%) |
| 5 to 17 Years | 0 (0.0%) | 0 (0.0%) |
| 18 to 34 Years | 0 (0.0%) | 0 (0.0%) |
| 35 to 64 Years | 0 (0.0%) | 27 (22.7%) |
| 65 to 74 Years | 0 (0.0%) | 23 (100.0%) |
| 75 Years and over | 0 (0.0%) | 13 (41.9%) |
Disability Class by Sex by Age in Reeltown
Disability Class: Hearing Difficulty
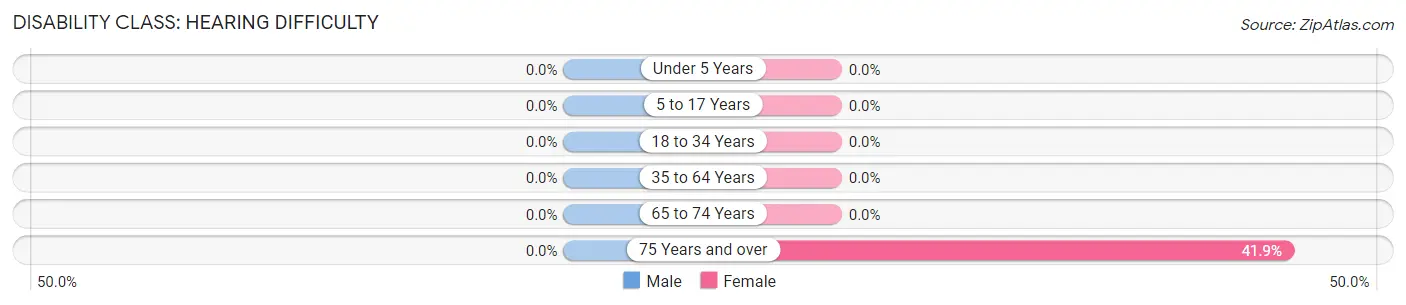
| Age Bracket | Male | Female |
| Under 5 Years | 0 (0.0%) | 0 (0.0%) |
| 5 to 17 Years | 0 (0.0%) | 0 (0.0%) |
| 18 to 34 Years | 0 (0.0%) | 0 (0.0%) |
| 35 to 64 Years | 0 (0.0%) | 0 (0.0%) |
| 65 to 74 Years | 0 (0.0%) | 0 (0.0%) |
| 75 Years and over | 0 (0.0%) | 13 (41.9%) |
Disability Class: Vision Difficulty
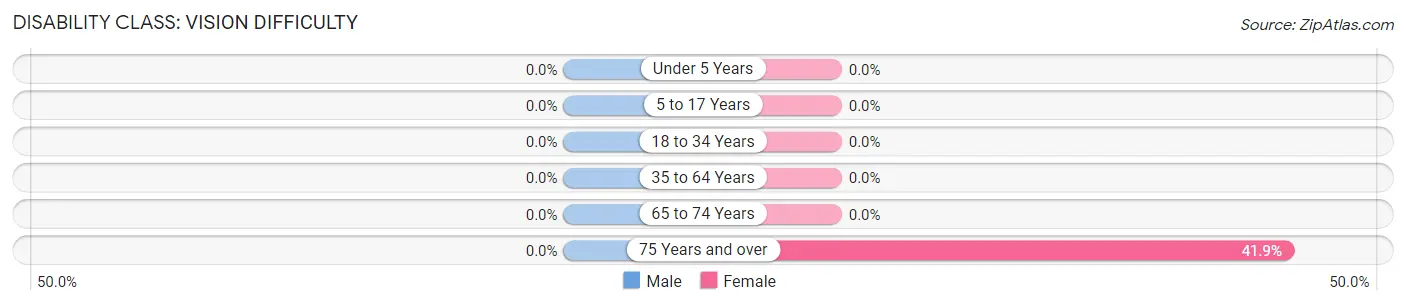
| Age Bracket | Male | Female |
| Under 5 Years | 0 (0.0%) | 0 (0.0%) |
| 5 to 17 Years | 0 (0.0%) | 0 (0.0%) |
| 18 to 34 Years | 0 (0.0%) | 0 (0.0%) |
| 35 to 64 Years | 0 (0.0%) | 0 (0.0%) |
| 65 to 74 Years | 0 (0.0%) | 0 (0.0%) |
| 75 Years and over | 0 (0.0%) | 13 (41.9%) |
Disability Class: Cognitive Difficulty
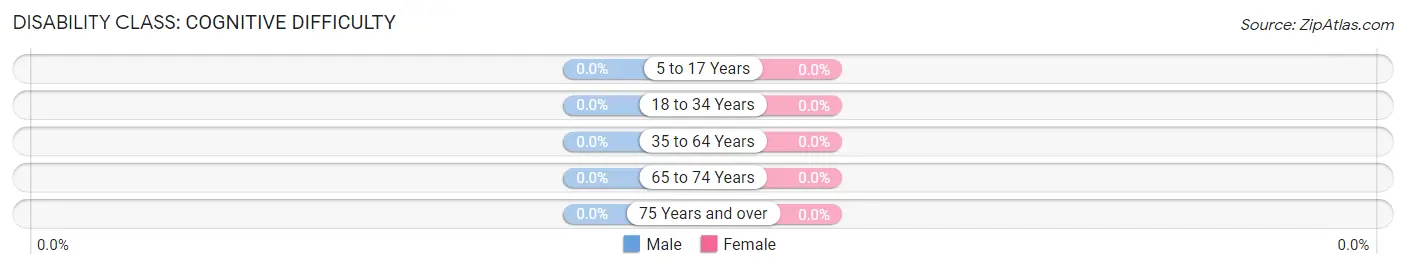
| Age Bracket | Male | Female |
| 5 to 17 Years | 0 (0.0%) | 0 (0.0%) |
| 18 to 34 Years | 0 (0.0%) | 0 (0.0%) |
| 35 to 64 Years | 0 (0.0%) | 0 (0.0%) |
| 65 to 74 Years | 0 (0.0%) | 0 (0.0%) |
| 75 Years and over | 0 (0.0%) | 0 (0.0%) |
Disability Class: Ambulatory Difficulty
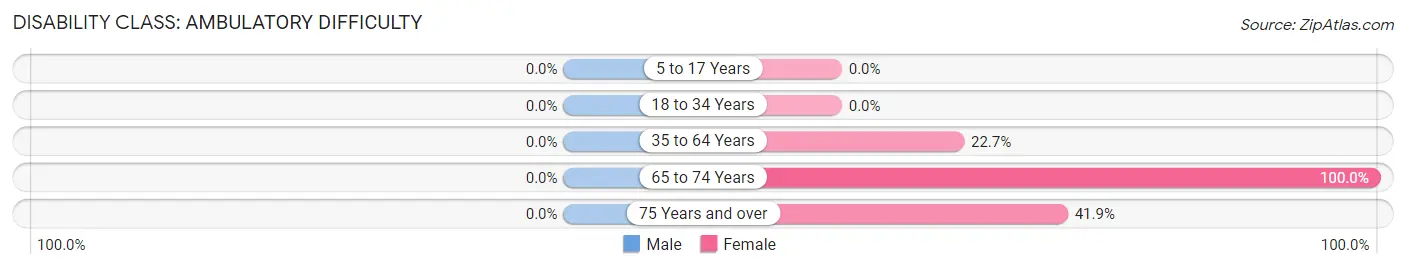
| Age Bracket | Male | Female |
| 5 to 17 Years | 0 (0.0%) | 0 (0.0%) |
| 18 to 34 Years | 0 (0.0%) | 0 (0.0%) |
| 35 to 64 Years | 0 (0.0%) | 27 (22.7%) |
| 65 to 74 Years | 0 (0.0%) | 23 (100.0%) |
| 75 Years and over | 0 (0.0%) | 13 (41.9%) |
Disability Class: Self-Care Difficulty
| Age Bracket | Male | Female |
| 5 to 17 Years | 0 (0.0%) | 0 (0.0%) |
| 18 to 34 Years | 0 (0.0%) | 0 (0.0%) |
| 35 to 64 Years | 0 (0.0%) | 0 (0.0%) |
| 65 to 74 Years | 0 (0.0%) | 0 (0.0%) |
| 75 Years and over | 0 (0.0%) | 0 (0.0%) |
Technology Access in Reeltown
Computing Device Access in Reeltown
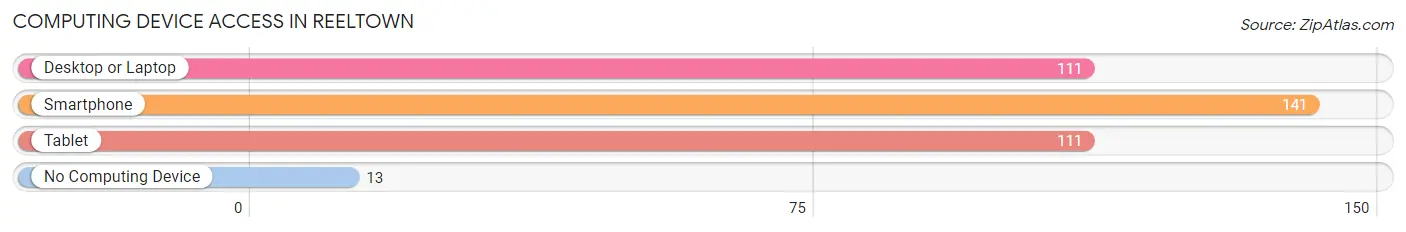
| Device Type | # Households | % Households |
| Desktop or Laptop | 111 | 63.1% |
| Smartphone | 141 | 80.1% |
| Tablet | 111 | 63.1% |
| No Computing Device | 13 | 7.4% |
| Total | 176 | 100.0% |
Internet Access in Reeltown
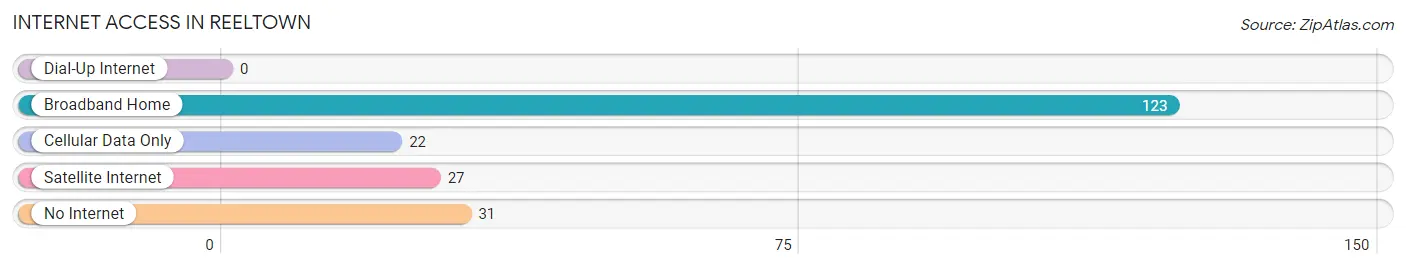
| Internet Type | # Households | % Households |
| Dial-Up Internet | 0 | 0.0% |
| Broadband Home | 123 | 69.9% |
| Cellular Data Only | 22 | 12.5% |
| Satellite Internet | 27 | 15.3% |
| No Internet | 31 | 17.6% |
| Total | 176 | 100.0% |
Reeltown Summary
Reeltown is a town located in Tallapoosa County, Alabama. It is situated on the banks of the Tallapoosa River, about 10 miles south of Alexander City. The town was founded in 1883 and incorporated in 1887. As of the 2010 census, the population of Reeltown was 1,193.
Geography
Reeltown is located at 32°59'25" North, 85°51'45" West (32.990278, -85.862444). It has an elevation of 545 feet above sea level. The town is located in the foothills of the Appalachian Mountains and is surrounded by rolling hills and forests. The town is situated on the banks of the Tallapoosa River, which is a major tributary of the Alabama River.
Climate
Reeltown has a humid subtropical climate, with hot, humid summers and mild winters. The average annual temperature is 64°F, with an average high of 87°F in July and an average low of 41°F in January. The average annual precipitation is 52 inches, with the wettest month being June, when an average of 6.5 inches of rain falls.
Demographics
As of the 2010 census, there were 1,193 people, 463 households, and 327 families residing in Reeltown. The population density was 517.3 people per square mile. The racial makeup of the town was 79.2% White, 18.2% African American, 0.3% Native American, 0.2% Asian, 0.1% Pacific Islander, 0.7% from other races, and 1.5% from two or more races. Hispanic or Latino of any race were 1.7% of the population.
The median age in Reeltown was 41.2 years. 22.2% of residents were under the age of 18; 8.2% were between the ages of 18 and 24; 24.2% were from 25 to 44; 28.2% were from 45 to 64; and 17.2% were 65 years of age or older. The gender makeup of the town was 48.2% male and 51.8% female.
Economy
Reeltown's economy is largely based on agriculture and forestry. The town is home to several farms, as well as a sawmill and a lumber mill. The town also has a few small businesses, including a grocery store, a hardware store, and a few restaurants.
Education
Reeltown is served by the Reeltown School District, which consists of one elementary school, one middle school, and one high school. The district also operates a vocational-technical center. The town is also home to a branch of the Central Alabama Community College.
Conclusion
Reeltown is a small town located in Tallapoosa County, Alabama. It is situated on the banks of the Tallapoosa River, about 10 miles south of Alexander City. The town was founded in 1883 and incorporated in 1887. As of the 2010 census, the population of Reeltown was 1,193. The town has a humid subtropical climate, with hot, humid summers and mild winters. The town's economy is largely based on agriculture and forestry, and it is served by the Reeltown School District. Reeltown is a quiet, rural town with a rich history and a strong sense of community.
Common Questions
What is Per Capita Income in Reeltown?
Per Capita income in Reeltown is $23,091.
What is the Median Family Income in Reeltown?
Median Family Income in Reeltown is $55,417.
What is the Median Household income in Reeltown?
Median Household Income in Reeltown is $36,250.
What is Inequality or Gini Index in Reeltown?
Inequality or Gini Index in Reeltown is 0.46.
What is the Total Population of Reeltown?
Total Population of Reeltown is 462.
What is the Total Male Population of Reeltown?
Total Male Population of Reeltown is 206.
What is the Total Female Population of Reeltown?
Total Female Population of Reeltown is 256.
What is the Ratio of Males per 100 Females in Reeltown?
There are 80.47 Males per 100 Females in Reeltown.
What is the Ratio of Females per 100 Males in Reeltown?
There are 124.27 Females per 100 Males in Reeltown.
What is the Median Population Age in Reeltown?
Median Population Age in Reeltown is 34.7 Years.
What is the Average Family Size in Reeltown
Average Family Size in Reeltown is 2.6 People.
What is the Average Household Size in Reeltown
Average Household Size in Reeltown is 2.6 People.
How Large is the Labor Force in Reeltown?
There are 256 People in the Labor Forcein in Reeltown.
What is the Percentage of People in the Labor Force in Reeltown?
72.5% of People are in the Labor Force in Reeltown.
What is the Unemployment Rate in Reeltown?
Unemployment Rate in Reeltown is 13.3%.