Yugoslavian vs Native Hawaiian 3 or more Vehicles in Household

COMPARE

Yugoslavian
Race
Ancestry
AfghanAfricanAlaska NativeAlaskan AthabascanAlbanianAleutAlsatianAmericanApacheArabArapahoArgentineanArmenianAssyrian/Chaldean/SyriacAustralianAustrianBahamianBangladeshiBarbadianBasqueBelgianBelizeanBermudanBhutaneseBlackfeetBolivianBrazilianBritishBritish West IndianBulgarianBurmeseCajunCambodianCanadianCape VerdeanCarpatho RusynCelticCentral AmericanCentral American IndianCherokeeCheyenneChickasawChileanChineseChippewaChoctawColombianColvilleComancheCosta RicanCreeCreekCroatianCrowCubanCypriotCzechCzechoslovakianDanishDelawareDominicanDutchDutch West IndianEastern EuropeanEcuadorianEgyptianEnglishEstonianEthiopianEuropeanFijianFilipinoFinnishFrenchFrench American IndianFrench CanadianGermanGerman RussianGhanaianGreekGuamanian/ChamorroGuatemalanGuyaneseHaitianHmongHonduranHopiHoumaHungarianIcelanderIndian (Asian)IndonesianInupiatIranianIraqiIrishIroquoisIsraeliItalianJamaicanJapaneseJordanianKenyanKiowaKoreanLaotianLatvianLebaneseLiberianLithuanianLumbeeLuxembourgerMacedonianMalaysianMalteseMarshalleseMenomineeMexicanMexican American IndianMongolianMoroccanNavajoNepaleseNew ZealanderNicaraguanNigerianNorthern EuropeanNorwegianOkinawanOsageOttawaPaiutePakistaniPalestinianPanamanianParaguayanPennsylvania GermanPeruvianPimaPolishPortuguesePotawatomiPuebloPuerto RicanPuget Sound SalishRomanianRussianSalvadoranSamoanScandinavianScotch-IrishScottishSeminoleSenegaleseSerbianShoshoneSierra LeoneanSiouxSlavicSlovakSloveneSomaliSouth AfricanSouth AmericanSouth American IndianSoviet UnionSpaniardSpanishSpanish AmericanSpanish American IndianSri LankanSubsaharan AfricanSudaneseSwedishSwissSyrianTaiwaneseThaiTlingit-HaidaTohono O'OdhamTonganTrinidadian and TobagonianTsimshianTurkishU.S. Virgin IslanderUgandanUkrainianUruguayanUteVenezuelanVietnameseWelshWest IndianYakamaYaquiYugoslavianYumanYup'ikZimbabwean
Immigration
NonimmigrantsImmigrantsAfghanistanAfricaAlbaniaArgentinaArmeniaAsiaAustraliaAustriaBahamasBangladeshBarbadosBelarusBelgiumBelizeBoliviaBosnia and HerzegovinaBrazilBulgariaBurma/MyanmarCabo VerdeCambodiaCameroonCanadaCaribbeanCentral AmericaChileChinaColombiaCongoCosta RicaCroatiaCubaCzechoslovakiaDenmarkDominicaDominican RepublicEastern AfricaEastern AsiaEastern EuropeEcuadorEgyptEl SalvadorEnglandEritreaEthiopiaEuropeFijiFranceGermanyGhanaGreeceGrenadaGuatemalaGuyanaHaitiHondurasHong KongHungaryIndiaIndonesiaIranIraqIrelandIsraelItalyJamaicaJapanJordanKazakhstanKenyaKoreaKuwaitLaosLatin AmericaLatviaLebanonLiberiaLithuaniaMalaysiaMexicoMicronesiaMiddle AfricaMoldovaMoroccoNepalNetherlandsNicaraguaNigeriaNorth AmericaNorth MacedoniaNorthern AfricaNorthern EuropeNorwayOceaniaPakistanPanamaPeruPhilippinesPolandPortugalRomaniaRussiaSaudi ArabiaScotlandSenegalSerbiaSierra LeoneSingaporeSomaliaSouth AfricaSouth AmericaSouth Central AsiaSouth Eastern AsiaSouthern EuropeSpainSri LankaSt. Vincent and the GrenadinesSudanSwedenSwitzerlandSyriaTaiwanThailandTrinidad and TobagoTurkeyUgandaUkraineUruguayUzbekistanVenezuelaVietnamWest IndiesWestern AfricaWestern AsiaWestern EuropeYemenZaireZimbabweAzores
Native Hawaiian
Race
Ancestry
AfghanAfricanAlaska NativeAlaskan AthabascanAlbanianAleutAlsatianAmericanApacheArabArapahoArgentineanArmenianAssyrian/Chaldean/SyriacAustralianAustrianBahamianBangladeshiBarbadianBasqueBelgianBelizeanBermudanBhutaneseBlackfeetBolivianBrazilianBritishBritish West IndianBulgarianBurmeseCajunCambodianCanadianCape VerdeanCarpatho RusynCelticCentral AmericanCentral American IndianCherokeeCheyenneChickasawChileanChineseChippewaChoctawColombianColvilleComancheCosta RicanCreeCreekCroatianCrowCubanCypriotCzechCzechoslovakianDanishDelawareDominicanDutchDutch West IndianEastern EuropeanEcuadorianEgyptianEnglishEstonianEthiopianEuropeanFijianFilipinoFinnishFrenchFrench American IndianFrench CanadianGermanGerman RussianGhanaianGreekGuamanian/ChamorroGuatemalanGuyaneseHaitianHmongHonduranHopiHoumaHungarianIcelanderIndian (Asian)IndonesianInupiatIranianIraqiIrishIroquoisIsraeliItalianJamaicanJapaneseJordanianKenyanKiowaKoreanLaotianLatvianLebaneseLiberianLithuanianLumbeeLuxembourgerMacedonianMalaysianMalteseMarshalleseMenomineeMexicanMexican American IndianMongolianMoroccanNative HawaiianNavajoNepaleseNew ZealanderNicaraguanNigerianNorthern EuropeanNorwegianOkinawanOsageOttawaPaiutePakistaniPalestinianPanamanianParaguayanPennsylvania GermanPeruvianPimaPolishPortuguesePotawatomiPuebloPuerto RicanPuget Sound SalishRomanianRussianSalvadoranSamoanScandinavianScotch-IrishScottishSeminoleSenegaleseSerbianShoshoneSierra LeoneanSiouxSlavicSlovakSloveneSomaliSouth AfricanSouth AmericanSouth American IndianSoviet UnionSpaniardSpanishSpanish AmericanSpanish American IndianSri LankanSubsaharan AfricanSudaneseSwedishSwissSyrianTaiwaneseThaiTlingit-HaidaTohono O'OdhamTonganTrinidadian and TobagonianTsimshianTurkishU.S. Virgin IslanderUgandanUkrainianUruguayanUteVenezuelanVietnameseWelshWest IndianYakamaYaquiYumanYup'ikZimbabwean
Immigration
NonimmigrantsImmigrantsAfghanistanAfricaAlbaniaArgentinaArmeniaAsiaAustraliaAustriaBahamasBangladeshBarbadosBelarusBelgiumBelizeBoliviaBosnia and HerzegovinaBrazilBulgariaBurma/MyanmarCabo VerdeCambodiaCameroonCanadaCaribbeanCentral AmericaChileChinaColombiaCongoCosta RicaCroatiaCubaCzechoslovakiaDenmarkDominicaDominican RepublicEastern AfricaEastern AsiaEastern EuropeEcuadorEgyptEl SalvadorEnglandEritreaEthiopiaEuropeFijiFranceGermanyGhanaGreeceGrenadaGuatemalaGuyanaHaitiHondurasHong KongHungaryIndiaIndonesiaIranIraqIrelandIsraelItalyJamaicaJapanJordanKazakhstanKenyaKoreaKuwaitLaosLatin AmericaLatviaLebanonLiberiaLithuaniaMalaysiaMexicoMicronesiaMiddle AfricaMoldovaMoroccoNepalNetherlandsNicaraguaNigeriaNorth AmericaNorth MacedoniaNorthern AfricaNorthern EuropeNorwayOceaniaPakistanPanamaPeruPhilippinesPolandPortugalRomaniaRussiaSaudi ArabiaScotlandSenegalSerbiaSierra LeoneSingaporeSomaliaSouth AfricaSouth AmericaSouth Central AsiaSouth Eastern AsiaSouthern EuropeSpainSri LankaSt. Vincent and the GrenadinesSudanSwedenSwitzerlandSyriaTaiwanThailandTrinidad and TobagoTurkeyUgandaUkraineUruguayUzbekistanVenezuelaVietnamWest IndiesWestern AfricaWestern AsiaWestern EuropeYemenZaireZimbabweAzores
3 or more Vehicles in Household
Income
Poverty
Unemployment
Labor Participation
Family Structure
Vehicle Availability
Education Level
Disability

3 or more Vehicles in Household Comparison

Yugoslavians

Native Hawaiians

Good
Exceptional
19.7%
3 OR MORE VEHICLES IN HOUSEHOLD
62.9/ 100
METRIC RATING
164th/ 347
METRIC RANK
24.9%
3 OR MORE VEHICLES IN HOUSEHOLD
100.0/ 100
METRIC RATING
9th/ 347
METRIC RANK

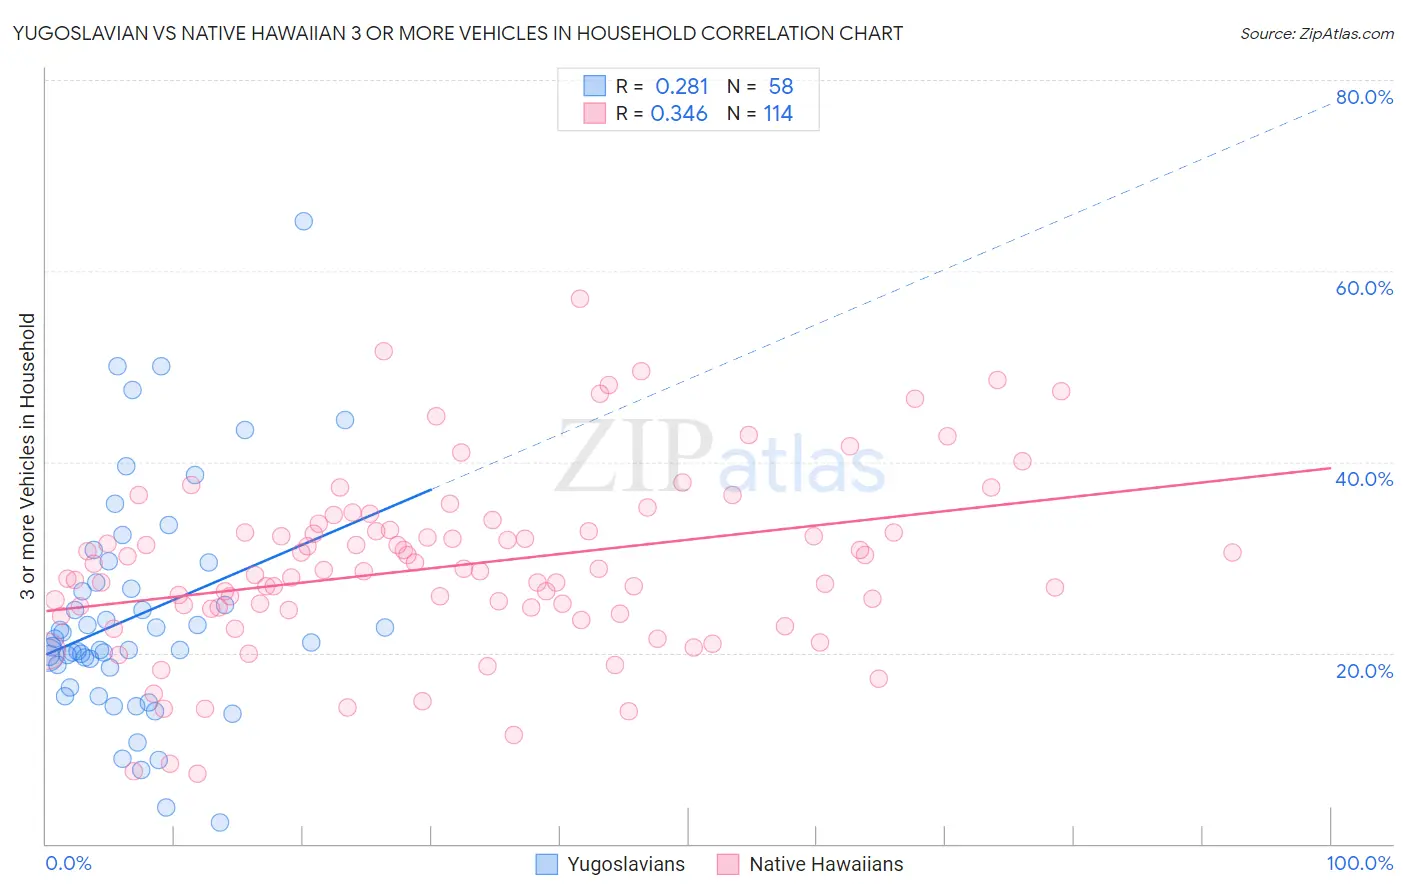
Yugoslavian vs Native Hawaiian 3 or more Vehicles in Household Correlation Chart

The statistical analysis conducted on geographies consisting of 285,615,615 people shows a weak positive correlation between the proportion of Yugoslavians and percentage of households with 3 or more vehicles available in the United States with a correlation coefficient (R) of 0.281 and weighted average of 19.7%. Similarly, the statistical analysis conducted on geographies consisting of 331,830,986 people shows a mild positive correlation between the proportion of Native Hawaiians and percentage of households with 3 or more vehicles available in the United States with a correlation coefficient (R) of 0.346 and weighted average of 24.9%, a difference of 26.6%.
Yugoslavian vs Native Hawaiian 3 or more Vehicles in Household

3 or more Vehicles in Household Correlation Summary

MeasurementYugoslavianNative Hawaiian
Minimum2.3%7.3%
Maximum65.2%57.1%
Range62.9%49.8%
Mean23.9%29.1%
Median20.9%28.7%
Interquartile 25% (IQ1)18.4%24.6%
Interquartile 75% (IQ3)27.3%32.8%
Interquartile Range (IQR)8.9%8.2%
Standard Deviation (Sample)11.9%9.2%
Standard Deviation (Population)11.8%9.2%

Similar Demographics by 3 or more Vehicles in Household

Demographics Similar to Yugoslavians by 3 or more Vehicles in Household

In terms of 3 or more vehicles in household, the demographic groups most similar to Yugoslavians are Chilean (19.7%, a difference of 0.010%), Estonian (19.7%, a difference of 0.030%), Immigrants from Costa Rica (19.7%, a difference of 0.080%), Immigrants from Cameroon (19.7%, a difference of 0.16%), and Immigrants from Guatemala (19.7%, a difference of 0.22%).
DemographicsRating | Rank3 or more Vehicles in Household
Hungarians
70.5
/100
|
#157
Good
19.8%
Armenians
68.8
/100
|
#158
Good
19.8%
Immigrants | Pakistan
68.2
/100
|
#159
Good
19.8%
Immigrants | Lebanon
67.6
/100
|
#160
Good
19.8%
Immigrants | Guatemala
65.6
/100
|
#161
Good
19.7%
Estonians
63.2
/100
|
#162
Good
19.7%
Chileans
63.0
/100
|
#163
Good
19.7%
Yugoslavians
62.9
/100
|
#164
Good
19.7%
Immigrants | Costa Rica
61.9
/100
|
#165
Good
19.7%
Immigrants | Cameroon
60.9
/100
|
#166
Good
19.7%
Ukrainians
58.9
/100
|
#167
Average
19.6%
Peruvians
58.8
/100
|
#168
Average
19.6%
Immigrants | Denmark
57.6
/100
|
#169
Average
19.6%
Iraqis
56.0
/100
|
#170
Average
19.6%
Immigrants | Western Europe
53.2
/100
|
#171
Average
19.5%

Demographics Similar to Native Hawaiians by 3 or more Vehicles in Household

In terms of 3 or more vehicles in household, the demographic groups most similar to Native Hawaiians are Nepalese (24.9%, a difference of 0.090%), Samoan (25.0%, a difference of 0.10%), Shoshone (24.9%, a difference of 0.19%), Danish (24.7%, a difference of 0.88%), and Mexican (24.7%, a difference of 0.96%).
DemographicsRating | Rank3 or more Vehicles in Household
Spanish American Indians
100.0
/100
|
#2
Exceptional
26.9%
Tongans
100.0
/100
|
#3
Exceptional
26.5%
Arapaho
100.0
/100
|
#4
Exceptional
26.4%
Puget Sound Salish
100.0
/100
|
#5
Exceptional
26.4%
Immigrants | Fiji
100.0
/100
|
#6
Exceptional
26.1%
Colville
100.0
/100
|
#7
Exceptional
25.8%
Samoans
100.0
/100
|
#8
Exceptional
25.0%
Native Hawaiians
100.0
/100
|
#9
Exceptional
24.9%
Nepalese
100.0
/100
|
#10
Exceptional
24.9%
Shoshone
100.0
/100
|
#11
Exceptional
24.9%
Danes
100.0
/100
|
#12
Exceptional
24.7%
Mexicans
100.0
/100
|
#13
Exceptional
24.7%
Immigrants | Mexico
100.0
/100
|
#14
Exceptional
24.6%
Hawaiians
100.0
/100
|
#15
Exceptional
24.3%
Basques
100.0
/100
|
#16
Exceptional
24.3%