Yugoslavian 4 or more Vehicles in Household
COMPARE
Yugoslavian
Select to Compare
4 or more Vehicles in Household
Yugoslavian 4 or more Vehicles in Household
6.3%
4+ VEHICLES AVAILABLE
41.1/ 100
METRIC RATING
181st/ 347
METRIC RANK
Yugoslavian 4 or more Vehicles in Household Correlation Chart
The statistical analysis conducted on geographies consisting of 285,036,674 people shows a poor positive correlation between the proportion of Yugoslavians and percentage of households with 4 or more vehicles available in the United States with a correlation coefficient (R) of 0.109 and weighted average of 6.3%. On average, for every 1% (one percent) increase in Yugoslavians within a typical geography, there is an increase of 0.13% in percentage of households with 4 or more vehicles available.
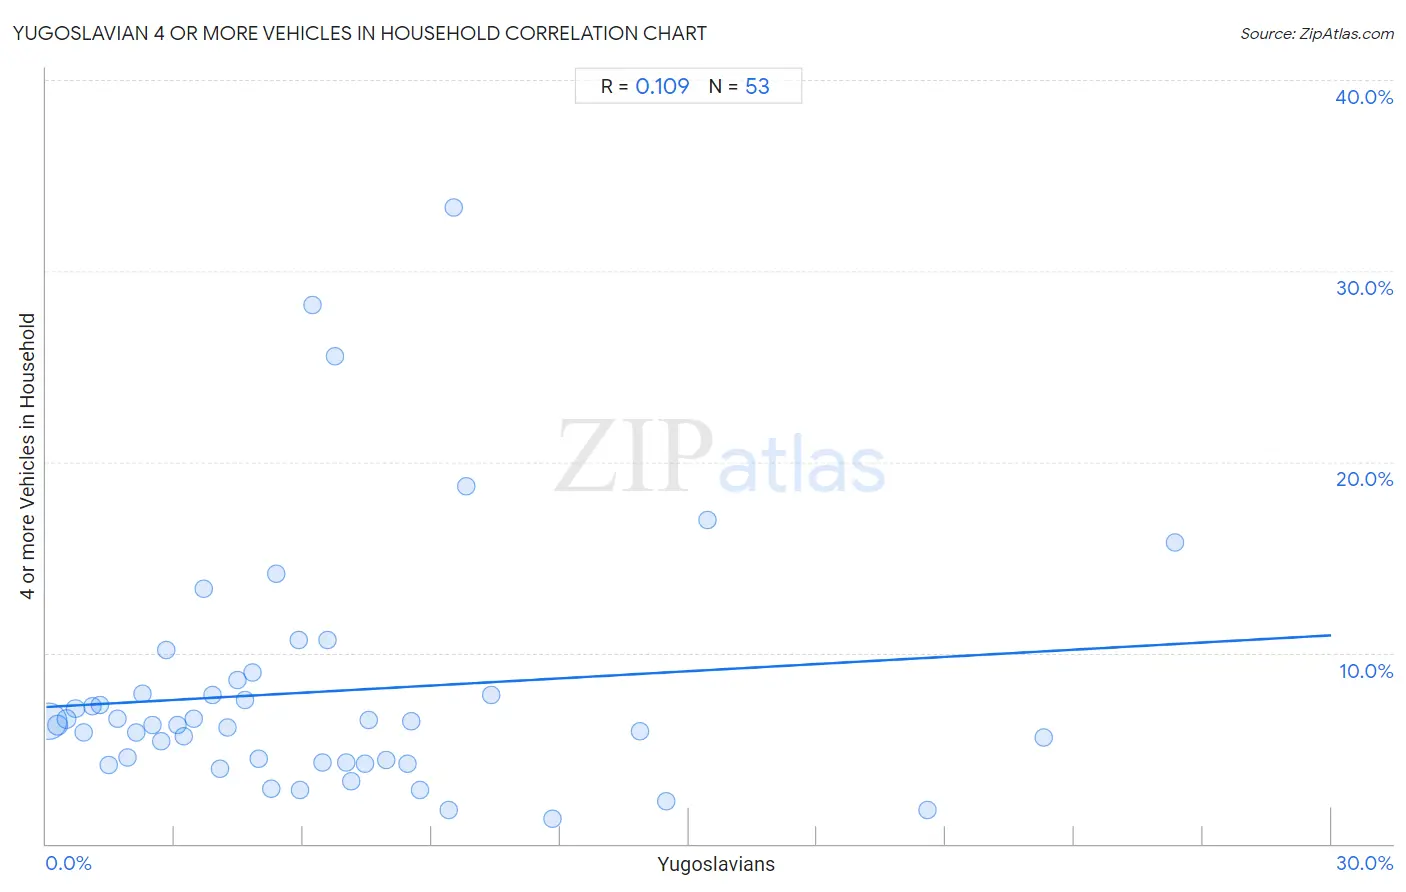
It is essential to understand that the correlation between the percentage of Yugoslavians and percentage of households with 4 or more vehicles available does not imply a direct cause-and-effect relationship. It remains uncertain whether the presence of Yugoslavians influences an upward or downward trend in the level of percentage of households with 4 or more vehicles available within an area, or if Yugoslavians simply ended up residing in those areas with higher or lower levels of percentage of households with 4 or more vehicles available due to other factors.
Demographics Similar to Yugoslavians by 4 or more Vehicles in Household
In terms of 4 or more vehicles in household, the demographic groups most similar to Yugoslavians are South American Indian (6.3%, a difference of 0.050%), Syrian (6.3%, a difference of 0.090%), Immigrants from Japan (6.3%, a difference of 0.20%), Belizean (6.3%, a difference of 0.35%), and Immigrants from Burma/Myanmar (6.2%, a difference of 0.39%).
| Demographics | Rating | Rank | 4 or more Vehicles in Household |
| Lithuanians | 50.0 /100 | #174 | Average 6.3% |
| Immigrants from Western Europe | 48.8 /100 | #175 | Average 6.3% |
| Ukrainians | 47.6 /100 | #176 | Average 6.3% |
| Slovaks | 46.9 /100 | #177 | Average 6.3% |
| Belizeans | 44.5 /100 | #178 | Average 6.3% |
| Immigrants from Japan | 43.1 /100 | #179 | Average 6.3% |
| Syrians | 42.0 /100 | #180 | Average 6.3% |
| Yugoslavians | 41.1 /100 | #181 | Average 6.3% |
| South American Indians | 40.7 /100 | #182 | Average 6.3% |
| Immigrants from Burma/Myanmar | 37.5 /100 | #183 | Fair 6.2% |
| Iraqis | 37.3 /100 | #184 | Fair 6.2% |
| Thais | 36.9 /100 | #185 | Fair 6.2% |
| Immigrants from Northern Europe | 36.8 /100 | #186 | Fair 6.2% |
| Immigrants from South Africa | 35.4 /100 | #187 | Fair 6.2% |
| Kiowa | 34.7 /100 | #188 | Fair 6.2% |
Yugoslavian 4 or more Vehicles in Household Correlation Summary
| Measurement | Yugoslavian Data | 4 or more Vehicles in Household Data |
| Minimum | 0.060% | 1.3% |
| Maximum | 26.3% | 33.3% |
| Range | 26.3% | 32.1% |
| Mean | 6.5% | 8.0% |
| Median | 5.3% | 6.2% |
| Interquartile 25% (IQ1) | 2.6% | 4.3% |
| Interquartile 75% (IQ3) | 8.5% | 8.2% |
| Interquartile Range (IQR) | 5.9% | 3.9% |
| Standard Deviation (Sample) | 5.6% | 6.4% |
| Standard Deviation (Population) | 5.5% | 6.4% |
Correlation Details
| Yugoslavian Percentile | Sample Size | 4 or more Vehicles in Household |
[ 0.0% - 0.5% ] 0.060% | 238,541,951 | 6.4% |
[ 0.0% - 0.5% ] 0.28% | 27,797,086 | 6.2% |
[ 0.0% - 0.5% ] 0.48% | 8,606,620 | 6.5% |
[ 0.5% - 1.0% ] 0.69% | 3,566,583 | 7.1% |
[ 0.5% - 1.0% ] 0.87% | 2,177,581 | 5.8% |
[ 1.0% - 1.5% ] 1.08% | 1,083,852 | 7.2% |
[ 1.0% - 1.5% ] 1.26% | 749,269 | 7.3% |
[ 1.0% - 1.5% ] 1.47% | 389,588 | 4.1% |
[ 1.5% - 2.0% ] 1.66% | 389,348 | 6.5% |
[ 1.5% - 2.0% ] 1.89% | 373,172 | 4.5% |
[ 2.0% - 2.5% ] 2.09% | 263,689 | 5.8% |
[ 2.0% - 2.5% ] 2.24% | 195,092 | 7.9% |
[ 2.0% - 2.5% ] 2.47% | 115,538 | 6.2% |
[ 2.5% - 3.0% ] 2.68% | 164,119 | 5.4% |
[ 2.5% - 3.0% ] 2.79% | 44,297 | 10.2% |
[ 3.0% - 3.5% ] 3.06% | 28,373 | 6.2% |
[ 3.0% - 3.5% ] 3.22% | 51,003 | 5.6% |
[ 3.0% - 3.5% ] 3.45% | 83,864 | 6.5% |
[ 3.5% - 4.0% ] 3.67% | 5,070 | 13.4% |
[ 3.5% - 4.0% ] 3.88% | 7,714 | 7.8% |
[ 4.0% - 4.5% ] 4.05% | 11,563 | 3.9% |
[ 4.0% - 4.5% ] 4.22% | 32,592 | 6.1% |
[ 4.0% - 4.5% ] 4.47% | 12,147 | 8.6% |
[ 4.5% - 5.0% ] 4.63% | 6,609 | 7.5% |
[ 4.5% - 5.0% ] 4.83% | 10,943 | 9.0% |
[ 4.5% - 5.0% ] 4.97% | 71,165 | 4.4% |
[ 5.0% - 5.5% ] 5.26% | 22,286 | 2.9% |
[ 5.0% - 5.5% ] 5.37% | 1,508 | 14.1% |
[ 5.5% - 6.0% ] 5.89% | 950 | 10.6% |
[ 5.5% - 6.0% ] 5.92% | 64,728 | 2.8% |
[ 6.0% - 6.5% ] 6.23% | 835 | 28.2% |
[ 6.0% - 6.5% ] 6.46% | 19,969 | 4.2% |
[ 6.5% - 7.0% ] 6.58% | 3,665 | 10.7% |
[ 6.5% - 7.0% ] 6.75% | 1,022 | 25.6% |
[ 7.0% - 7.5% ] 7.01% | 16,211 | 4.3% |
[ 7.0% - 7.5% ] 7.12% | 4,947 | 3.3% |
[ 7.0% - 7.5% ] 7.43% | 4,873 | 4.2% |
[ 7.5% - 8.0% ] 7.53% | 332 | 6.5% |
[ 7.5% - 8.0% ] 7.93% | 29,089 | 4.4% |
[ 8.0% - 8.5% ] 8.43% | 36,359 | 4.2% |
[ 8.5% - 9.0% ] 8.52% | 622 | 6.4% |
[ 8.5% - 9.0% ] 8.74% | 40,152 | 2.8% |
[ 9.0% - 9.5% ] 9.39% | 2,280 | 1.8% |
[ 9.5% - 10.0% ] 9.52% | 105 | 33.3% |
[ 9.5% - 10.0% ] 9.80% | 51 | 18.8% |
[ 10.0% - 10.5% ] 10.40% | 846 | 7.8% |
[ 11.5% - 12.0% ] 11.80% | 881 | 1.3% |
[ 13.5% - 14.0% ] 13.87% | 137 | 5.9% |
[ 14.0% - 14.5% ] 14.48% | 3,812 | 2.2% |
[ 15.0% - 15.5% ] 15.44% | 136 | 17.0% |
[ 20.5% - 21.0% ] 20.59% | 102 | 1.8% |
[ 23.0% - 23.5% ] 23.29% | 73 | 5.6% |
[ 26.0% - 26.5% ] 26.35% | 1,875 | 15.8% |