Yugoslavian vs Norwegian 3 or more Vehicles in Household
COMPARE
Yugoslavian
Norwegian
3 or more Vehicles in Household
3 or more Vehicles in Household Comparison
Yugoslavians
Norwegians
19.7%
3 OR MORE VEHICLES IN HOUSEHOLD
62.9/ 100
METRIC RATING
164th/ 347
METRIC RANK
23.9%
3 OR MORE VEHICLES IN HOUSEHOLD
100.0/ 100
METRIC RATING
18th/ 347
METRIC RANK
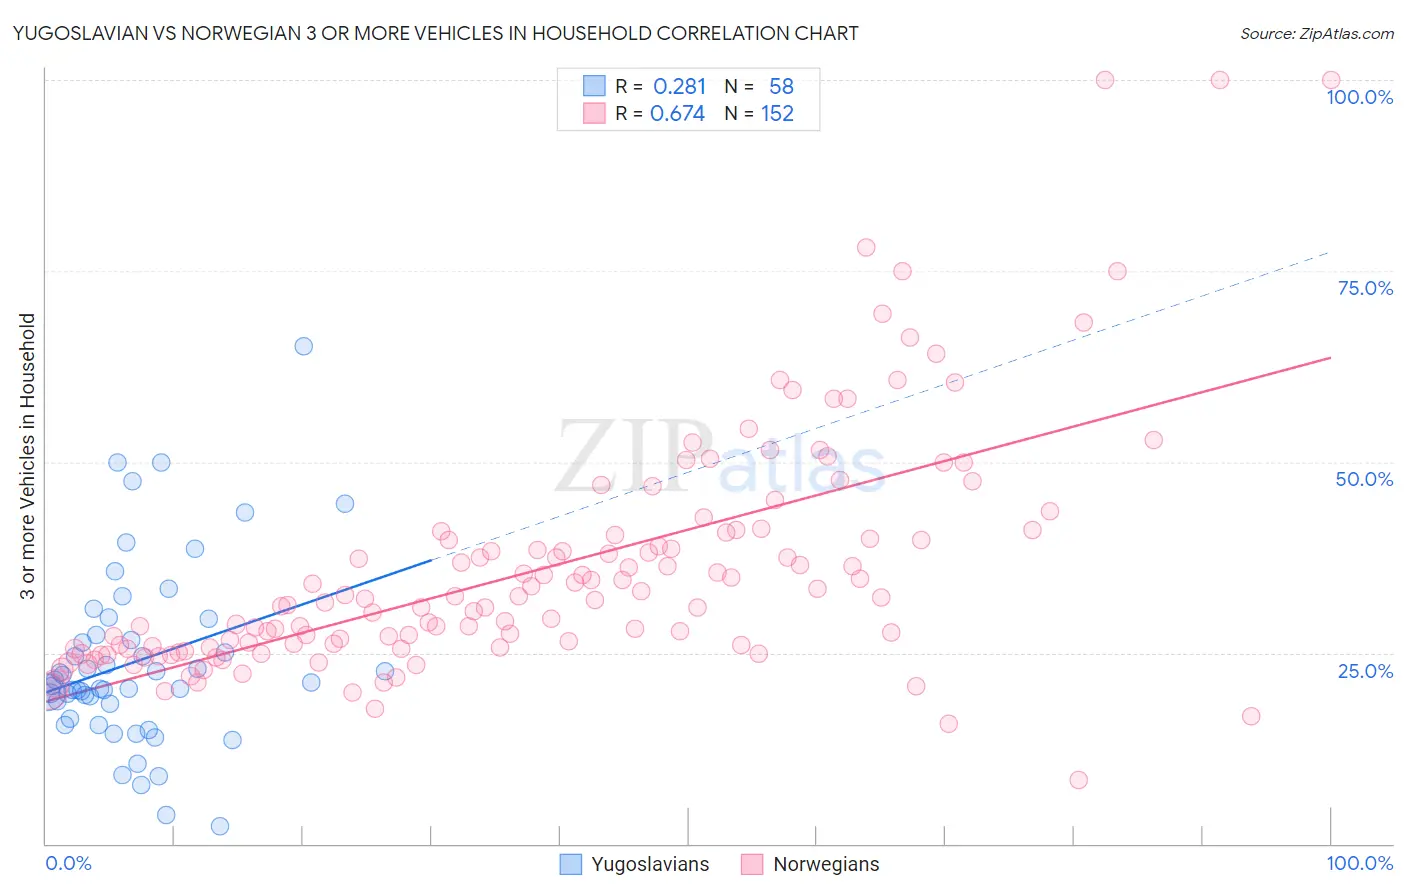
Yugoslavian vs Norwegian 3 or more Vehicles in Household Correlation Chart
The statistical analysis conducted on geographies consisting of 285,615,615 people shows a weak positive correlation between the proportion of Yugoslavians and percentage of households with 3 or more vehicles available in the United States with a correlation coefficient (R) of 0.281 and weighted average of 19.7%. Similarly, the statistical analysis conducted on geographies consisting of 532,701,273 people shows a significant positive correlation between the proportion of Norwegians and percentage of households with 3 or more vehicles available in the United States with a correlation coefficient (R) of 0.674 and weighted average of 23.9%, a difference of 21.2%.
3 or more Vehicles in Household Correlation Summary
| Measurement | Yugoslavian | Norwegian |
| Minimum | 2.3% | 8.3% |
| Maximum | 65.2% | 100.0% |
| Range | 62.9% | 91.7% |
| Mean | 23.9% | 36.1% |
| Median | 20.9% | 32.0% |
| Interquartile 25% (IQ1) | 18.4% | 25.7% |
| Interquartile 75% (IQ3) | 27.3% | 40.6% |
| Interquartile Range (IQR) | 8.9% | 14.8% |
| Standard Deviation (Sample) | 11.9% | 15.8% |
| Standard Deviation (Population) | 11.8% | 15.7% |
Similar Demographics by 3 or more Vehicles in Household
Demographics Similar to Yugoslavians by 3 or more Vehicles in Household
In terms of 3 or more vehicles in household, the demographic groups most similar to Yugoslavians are Chilean (19.7%, a difference of 0.010%), Estonian (19.7%, a difference of 0.030%), Immigrants from Costa Rica (19.7%, a difference of 0.080%), Immigrants from Cameroon (19.7%, a difference of 0.16%), and Immigrants from Guatemala (19.7%, a difference of 0.22%).
| Demographics | Rating | Rank | 3 or more Vehicles in Household |
| Hungarians | 70.5 /100 | #157 | Good 19.8% |
| Armenians | 68.8 /100 | #158 | Good 19.8% |
| Immigrants | Pakistan | 68.2 /100 | #159 | Good 19.8% |
| Immigrants | Lebanon | 67.6 /100 | #160 | Good 19.8% |
| Immigrants | Guatemala | 65.6 /100 | #161 | Good 19.7% |
| Estonians | 63.2 /100 | #162 | Good 19.7% |
| Chileans | 63.0 /100 | #163 | Good 19.7% |
| Yugoslavians | 62.9 /100 | #164 | Good 19.7% |
| Immigrants | Costa Rica | 61.9 /100 | #165 | Good 19.7% |
| Immigrants | Cameroon | 60.9 /100 | #166 | Good 19.7% |
| Ukrainians | 58.9 /100 | #167 | Average 19.6% |
| Peruvians | 58.8 /100 | #168 | Average 19.6% |
| Immigrants | Denmark | 57.6 /100 | #169 | Average 19.6% |
| Iraqis | 56.0 /100 | #170 | Average 19.6% |
| Immigrants | Western Europe | 53.2 /100 | #171 | Average 19.5% |
Demographics Similar to Norwegians by 3 or more Vehicles in Household
In terms of 3 or more vehicles in household, the demographic groups most similar to Norwegians are Chinese (23.9%, a difference of 0.030%), Paiute (23.8%, a difference of 0.33%), Immigrants from Vietnam (23.8%, a difference of 0.45%), Immigrants from Philippines (23.8%, a difference of 0.51%), and Korean (24.1%, a difference of 0.79%).
| Demographics | Rating | Rank | 3 or more Vehicles in Household |
| Shoshone | 100.0 /100 | #11 | Exceptional 24.9% |
| Danes | 100.0 /100 | #12 | Exceptional 24.7% |
| Mexicans | 100.0 /100 | #13 | Exceptional 24.7% |
| Immigrants | Mexico | 100.0 /100 | #14 | Exceptional 24.6% |
| Hawaiians | 100.0 /100 | #15 | Exceptional 24.3% |
| Basques | 100.0 /100 | #16 | Exceptional 24.3% |
| Koreans | 100.0 /100 | #17 | Exceptional 24.1% |
| Norwegians | 100.0 /100 | #18 | Exceptional 23.9% |
| Chinese | 100.0 /100 | #19 | Exceptional 23.9% |
| Paiute | 100.0 /100 | #20 | Exceptional 23.8% |
| Immigrants | Vietnam | 100.0 /100 | #21 | Exceptional 23.8% |
| Immigrants | Philippines | 100.0 /100 | #22 | Exceptional 23.8% |
| Scandinavians | 100.0 /100 | #23 | Exceptional 23.6% |
| Sri Lankans | 100.0 /100 | #24 | Exceptional 23.6% |
| Immigrants | Central America | 100.0 /100 | #25 | Exceptional 23.4% |