Tohono O'odham vs Cajun 3 or more Vehicles in Household
COMPARE
Tohono O'odham
Cajun
3 or more Vehicles in Household
3 or more Vehicles in Household Comparison
Tohono O'odham
Cajuns
18.9%
3 OR MORE VEHICLES IN HOUSEHOLD
14.8/ 100
METRIC RATING
203rd/ 347
METRIC RANK
19.3%
3 OR MORE VEHICLES IN HOUSEHOLD
36.0/ 100
METRIC RATING
183rd/ 347
METRIC RANK
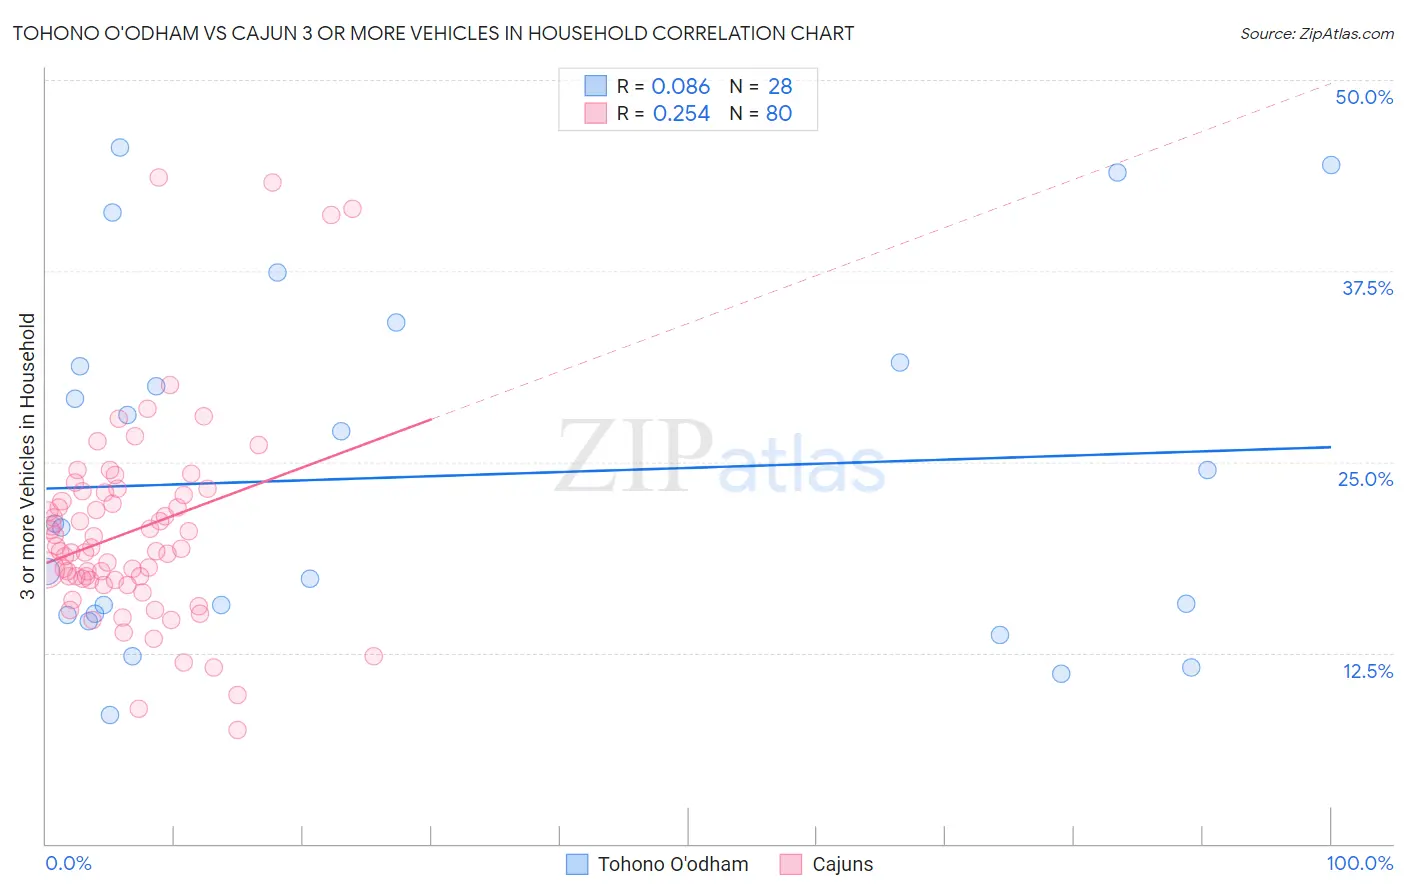
Tohono O'odham vs Cajun 3 or more Vehicles in Household Correlation Chart
The statistical analysis conducted on geographies consisting of 58,717,373 people shows a slight positive correlation between the proportion of Tohono O'odham and percentage of households with 3 or more vehicles available in the United States with a correlation coefficient (R) of 0.086 and weighted average of 18.9%. Similarly, the statistical analysis conducted on geographies consisting of 149,681,438 people shows a weak positive correlation between the proportion of Cajuns and percentage of households with 3 or more vehicles available in the United States with a correlation coefficient (R) of 0.254 and weighted average of 19.3%, a difference of 2.3%.
3 or more Vehicles in Household Correlation Summary
| Measurement | Tohono O'odham | Cajun |
| Minimum | 8.4% | 7.4% |
| Maximum | 45.6% | 43.7% |
| Range | 37.1% | 36.2% |
| Mean | 24.1% | 20.5% |
| Median | 20.8% | 19.2% |
| Interquartile 25% (IQ1) | 15.0% | 17.2% |
| Interquartile 75% (IQ3) | 31.4% | 22.9% |
| Interquartile Range (IQR) | 16.4% | 5.7% |
| Standard Deviation (Sample) | 11.3% | 6.7% |
| Standard Deviation (Population) | 11.1% | 6.7% |
Demographics Similar to Tohono O'odham and Cajuns by 3 or more Vehicles in Household
In terms of 3 or more vehicles in household, the demographic groups most similar to Tohono O'odham are Immigrants from Austria (18.9%, a difference of 0.090%), Arab (18.9%, a difference of 0.42%), Argentinean (18.9%, a difference of 0.48%), Immigrants from Norway (19.0%, a difference of 0.58%), and Egyptian (19.0%, a difference of 0.65%). Similarly, the demographic groups most similar to Cajuns are Latvian (19.3%, a difference of 0.020%), Immigrants from Sri Lanka (19.2%, a difference of 0.46%), Immigrants from Sweden (19.2%, a difference of 0.61%), Immigrants from Hong Kong (19.2%, a difference of 0.68%), and Immigrants from Kuwait (19.1%, a difference of 0.90%).
| Demographics | Rating | Rank | 3 or more Vehicles in Household |
| Cajuns | 36.0 /100 | #183 | Fair 19.3% |
| Latvians | 35.7 /100 | #184 | Fair 19.3% |
| Immigrants | Sri Lanka | 30.7 /100 | #185 | Fair 19.2% |
| Immigrants | Sweden | 29.0 /100 | #186 | Fair 19.2% |
| Immigrants | Hong Kong | 28.3 /100 | #187 | Fair 19.2% |
| Immigrants | Kuwait | 26.1 /100 | #188 | Fair 19.1% |
| Indians (Asian) | 26.0 /100 | #189 | Fair 19.1% |
| Immigrants | Zimbabwe | 25.5 /100 | #190 | Fair 19.1% |
| South American Indians | 25.4 /100 | #191 | Fair 19.1% |
| Kenyans | 24.7 /100 | #192 | Fair 19.1% |
| Tsimshian | 24.4 /100 | #193 | Fair 19.1% |
| Serbians | 24.0 /100 | #194 | Fair 19.1% |
| Immigrants | Moldova | 23.6 /100 | #195 | Fair 19.1% |
| Central American Indians | 22.2 /100 | #196 | Fair 19.0% |
| Immigrants | Japan | 22.0 /100 | #197 | Fair 19.0% |
| Egyptians | 19.5 /100 | #198 | Poor 19.0% |
| Immigrants | Norway | 19.0 /100 | #199 | Poor 19.0% |
| Argentineans | 18.2 /100 | #200 | Poor 18.9% |
| Arabs | 17.7 /100 | #201 | Poor 18.9% |
| Immigrants | Austria | 15.4 /100 | #202 | Poor 18.9% |
| Tohono O'odham | 14.8 /100 | #203 | Poor 18.9% |