Tohono O'odham vs Immigrants from Morocco 3 or more Vehicles in Household
COMPARE
Tohono O'odham
Immigrants from Morocco
3 or more Vehicles in Household
3 or more Vehicles in Household Comparison
Tohono O'odham
Immigrants from Morocco
18.9%
3 OR MORE VEHICLES IN HOUSEHOLD
14.8/ 100
METRIC RATING
203rd/ 347
METRIC RANK
16.3%
3 OR MORE VEHICLES IN HOUSEHOLD
0.0/ 100
METRIC RATING
305th/ 347
METRIC RANK
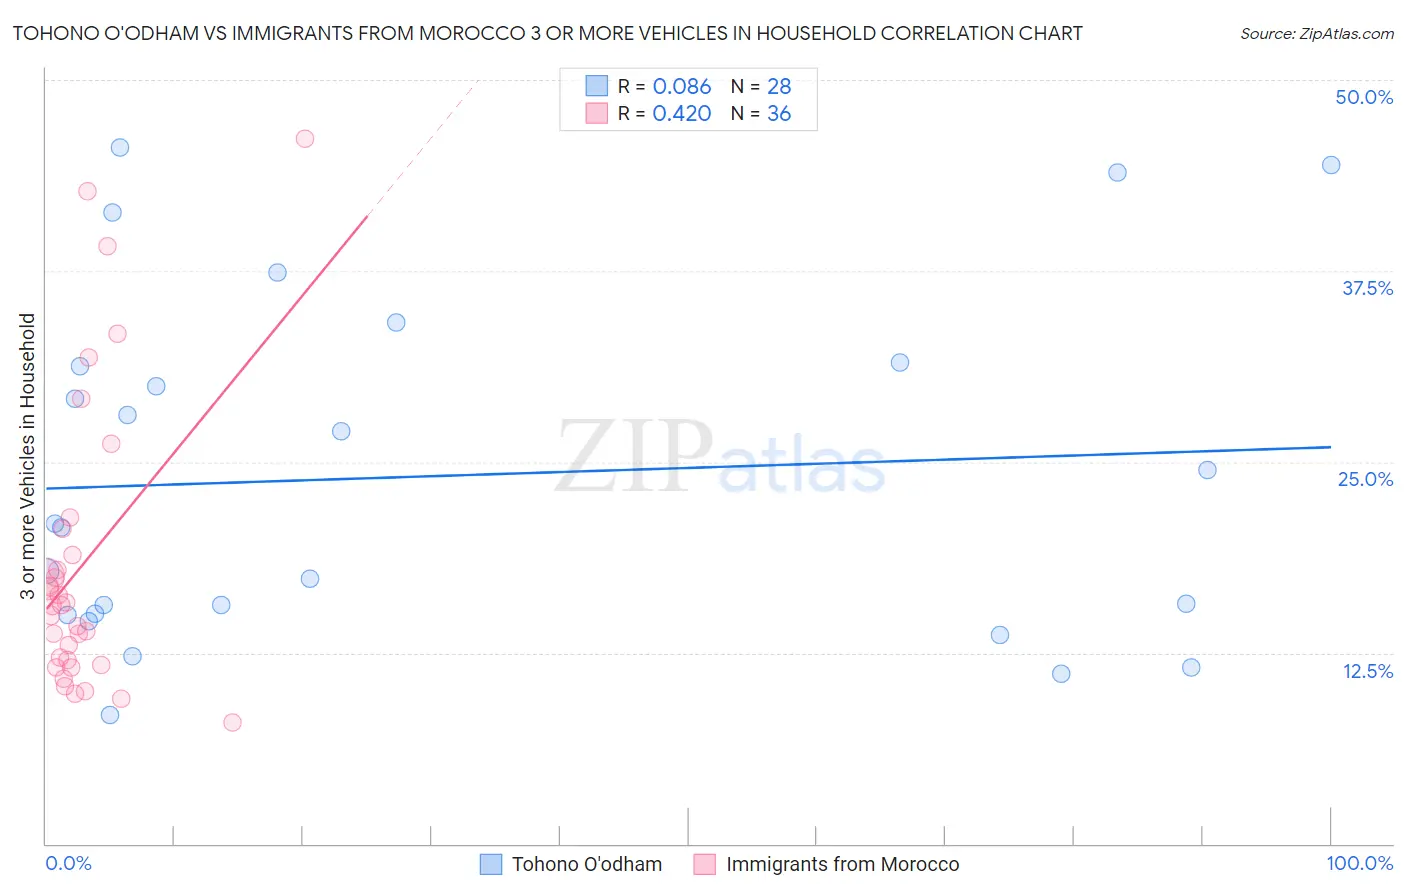
Tohono O'odham vs Immigrants from Morocco 3 or more Vehicles in Household Correlation Chart
The statistical analysis conducted on geographies consisting of 58,717,373 people shows a slight positive correlation between the proportion of Tohono O'odham and percentage of households with 3 or more vehicles available in the United States with a correlation coefficient (R) of 0.086 and weighted average of 18.9%. Similarly, the statistical analysis conducted on geographies consisting of 178,908,758 people shows a moderate positive correlation between the proportion of Immigrants from Morocco and percentage of households with 3 or more vehicles available in the United States with a correlation coefficient (R) of 0.420 and weighted average of 16.3%, a difference of 15.6%.
3 or more Vehicles in Household Correlation Summary
| Measurement | Tohono O'odham | Immigrants from Morocco |
| Minimum | 8.4% | 7.9% |
| Maximum | 45.6% | 46.2% |
| Range | 37.1% | 38.2% |
| Mean | 24.1% | 18.3% |
| Median | 20.8% | 15.6% |
| Interquartile 25% (IQ1) | 15.0% | 11.8% |
| Interquartile 75% (IQ3) | 31.4% | 19.8% |
| Interquartile Range (IQR) | 16.4% | 8.0% |
| Standard Deviation (Sample) | 11.3% | 9.6% |
| Standard Deviation (Population) | 11.1% | 9.5% |
Similar Demographics by 3 or more Vehicles in Household
Demographics Similar to Tohono O'odham by 3 or more Vehicles in Household
In terms of 3 or more vehicles in household, the demographic groups most similar to Tohono O'odham are Immigrants from Romania (18.9%, a difference of 0.030%), Immigrants from Austria (18.9%, a difference of 0.090%), Russian (18.8%, a difference of 0.10%), Immigrants from Eastern Asia (18.8%, a difference of 0.11%), and Immigrants from Chile (18.8%, a difference of 0.19%).
| Demographics | Rating | Rank | 3 or more Vehicles in Household |
| Central American Indians | 22.2 /100 | #196 | Fair 19.0% |
| Immigrants | Japan | 22.0 /100 | #197 | Fair 19.0% |
| Egyptians | 19.5 /100 | #198 | Poor 19.0% |
| Immigrants | Norway | 19.0 /100 | #199 | Poor 19.0% |
| Argentineans | 18.2 /100 | #200 | Poor 18.9% |
| Arabs | 17.7 /100 | #201 | Poor 18.9% |
| Immigrants | Austria | 15.4 /100 | #202 | Poor 18.9% |
| Tohono O'odham | 14.8 /100 | #203 | Poor 18.9% |
| Immigrants | Romania | 14.6 /100 | #204 | Poor 18.9% |
| Russians | 14.2 /100 | #205 | Poor 18.8% |
| Immigrants | Eastern Asia | 14.1 /100 | #206 | Poor 18.8% |
| Immigrants | Chile | 13.6 /100 | #207 | Poor 18.8% |
| Immigrants | Burma/Myanmar | 13.6 /100 | #208 | Poor 18.8% |
| Immigrants | Egypt | 13.5 /100 | #209 | Poor 18.8% |
| Bulgarians | 13.1 /100 | #210 | Poor 18.8% |
Demographics Similar to Immigrants from Morocco by 3 or more Vehicles in Household
In terms of 3 or more vehicles in household, the demographic groups most similar to Immigrants from Morocco are Ghanaian (16.4%, a difference of 0.26%), Immigrants from Serbia (16.4%, a difference of 0.74%), Somali (16.2%, a difference of 0.82%), Immigrants from Ghana (16.2%, a difference of 0.96%), and Immigrants from Greece (16.5%, a difference of 1.0%).
| Demographics | Rating | Rank | 3 or more Vehicles in Household |
| Immigrants | Zaire | 0.1 /100 | #298 | Tragic 16.7% |
| Immigrants | South America | 0.1 /100 | #299 | Tragic 16.7% |
| Cypriots | 0.0 /100 | #300 | Tragic 16.6% |
| Paraguayans | 0.0 /100 | #301 | Tragic 16.6% |
| Immigrants | Greece | 0.0 /100 | #302 | Tragic 16.5% |
| Immigrants | Serbia | 0.0 /100 | #303 | Tragic 16.4% |
| Ghanaians | 0.0 /100 | #304 | Tragic 16.4% |
| Immigrants | Morocco | 0.0 /100 | #305 | Tragic 16.3% |
| Somalis | 0.0 /100 | #306 | Tragic 16.2% |
| Immigrants | Ghana | 0.0 /100 | #307 | Tragic 16.2% |
| Houma | 0.0 /100 | #308 | Tragic 16.1% |
| Immigrants | Somalia | 0.0 /100 | #309 | Tragic 15.9% |
| Moroccans | 0.0 /100 | #310 | Tragic 15.9% |
| Albanians | 0.0 /100 | #311 | Tragic 15.8% |
| Puerto Ricans | 0.0 /100 | #312 | Tragic 15.6% |