Tohono O'odham Self-Care Disability
COMPARE
Tohono O'odham
Select to Compare
Self-Care Disability
Tohono O'odham Self-Care Disability
3.1%
SELF-CARE DISABILITY
0.0/ 100
METRIC RATING
343rd/ 347
METRIC RANK
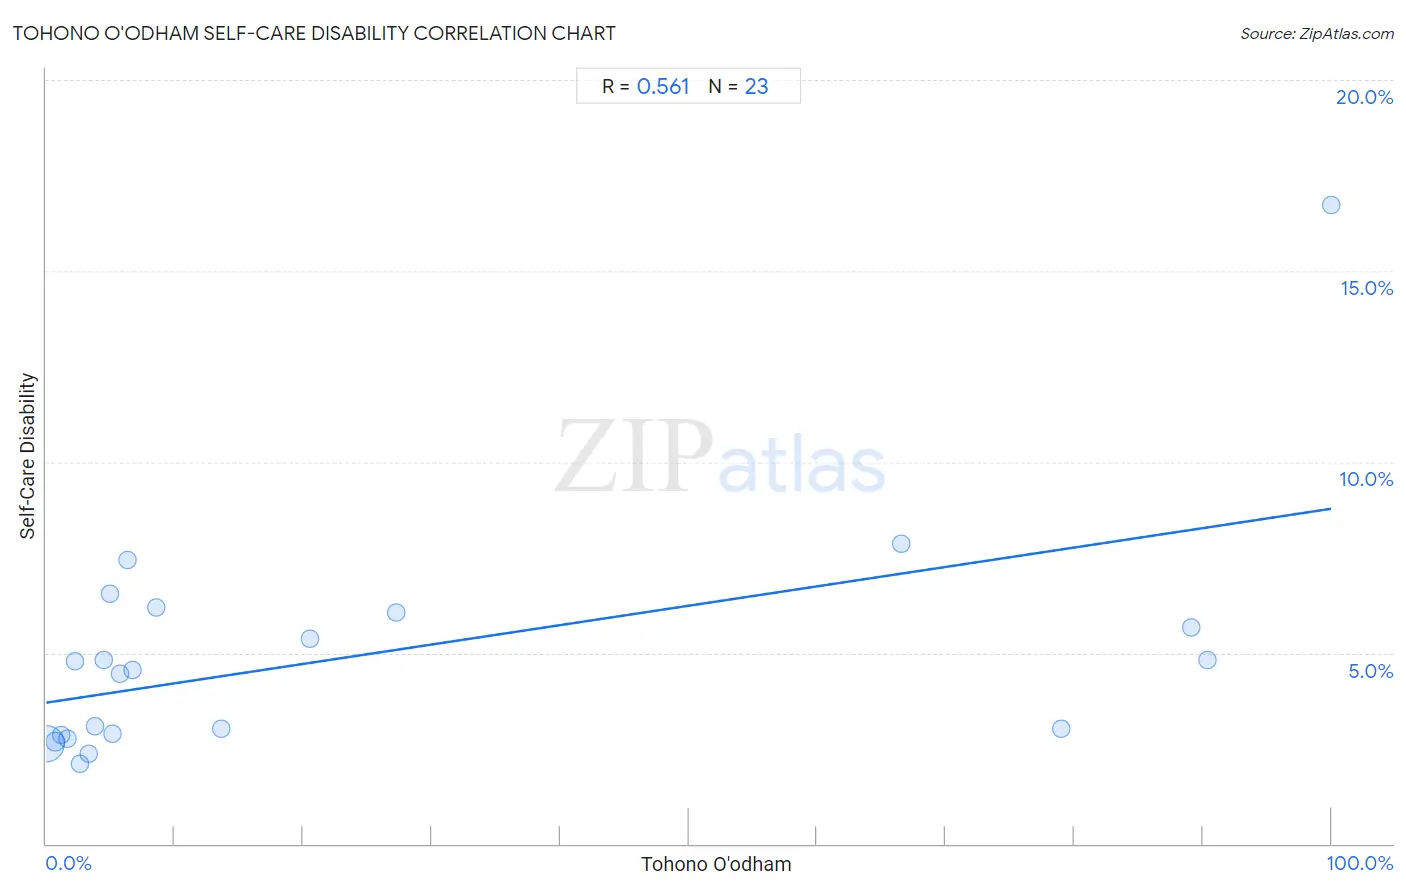
Tohono O'odham Self-Care Disability Correlation Chart
The statistical analysis conducted on geographies consisting of 58,708,856 people shows a substantial positive correlation between the proportion of Tohono O'odham and percentage of population with self-care disability in the United States with a correlation coefficient (R) of 0.561 and weighted average of 3.1%. On average, for every 1% (one percent) increase in Tohono O'odham within a typical geography, there is an increase of 0.051% in percentage of population with self-care disability.
It is essential to understand that the correlation between the percentage of Tohono O'odham and percentage of population with self-care disability does not imply a direct cause-and-effect relationship. It remains uncertain whether the presence of Tohono O'odham influences an upward or downward trend in the level of percentage of population with self-care disability within an area, or if Tohono O'odham simply ended up residing in those areas with higher or lower levels of percentage of population with self-care disability due to other factors.
Demographics Similar to Tohono O'odham by Self-Care Disability
In terms of self-care disability, the demographic groups most similar to Tohono O'odham are Colville (3.1%, a difference of 0.11%), Dominican (3.1%, a difference of 1.7%), Immigrants from Cabo Verde (3.1%, a difference of 2.0%), Immigrants from Dominican Republic (3.0%, a difference of 2.3%), and Cape Verdean (3.0%, a difference of 2.7%).
| Demographics | Rating | Rank | Self-Care Disability |
| Dutch West Indians | 0.0 /100 | #333 | Tragic 3.0% |
| Houma | 0.0 /100 | #334 | Tragic 3.0% |
| Immigrants from the Azores | 0.0 /100 | #335 | Tragic 3.0% |
| Immigrants from Yemen | 0.0 /100 | #336 | Tragic 3.0% |
| Choctaw | 0.0 /100 | #337 | Tragic 3.0% |
| Cape Verdeans | 0.0 /100 | #338 | Tragic 3.0% |
| Immigrants from Dominican Republic | 0.0 /100 | #339 | Tragic 3.0% |
| Immigrants from Cabo Verde | 0.0 /100 | #340 | Tragic 3.1% |
| Dominicans | 0.0 /100 | #341 | Tragic 3.1% |
| Colville | 0.0 /100 | #342 | Tragic 3.1% |
| Tohono O'odham | 0.0 /100 | #343 | Tragic 3.1% |
| Pueblo | 0.0 /100 | #344 | Tragic 3.3% |
| Armenians | 0.0 /100 | #345 | Tragic 3.4% |
| Puerto Ricans | 0.0 /100 | #346 | Tragic 3.7% |
| Immigrants from Armenia | 0.0 /100 | #347 | Tragic 4.2% |
Tohono O'odham Self-Care Disability Correlation Summary
| Measurement | Tohono O'odham Data | Self-Care Disability Data |
| Minimum | 0.034% | 2.1% |
| Maximum | 100.0% | 16.7% |
| Range | 100.0% | 14.6% |
| Mean | 23.6% | 4.9% |
| Median | 5.8% | 4.5% |
| Interquartile 25% (IQ1) | 2.6% | 2.9% |
| Interquartile 75% (IQ3) | 27.3% | 6.1% |
| Interquartile Range (IQR) | 24.6% | 3.2% |
| Standard Deviation (Sample) | 34.1% | 3.1% |
| Standard Deviation (Population) | 33.3% | 3.0% |
Correlation Details
| Tohono O'odham Percentile | Sample Size | Self-Care Disability |
[ 0.0% - 0.5% ] 0.034% | 56,790,678 | 2.6% |
[ 0.5% - 1.0% ] 0.71% | 1,357,108 | 2.7% |
[ 1.0% - 1.5% ] 1.19% | 382,469 | 2.9% |
[ 1.5% - 2.0% ] 1.66% | 66,171 | 2.8% |
[ 2.0% - 2.5% ] 2.25% | 11,962 | 4.8% |
[ 2.5% - 3.0% ] 2.63% | 56,832 | 2.1% |
[ 3.0% - 3.5% ] 3.32% | 7,268 | 2.4% |
[ 3.5% - 4.0% ] 3.81% | 1,835 | 3.1% |
[ 4.0% - 4.5% ] 4.50% | 1,178 | 4.8% |
[ 4.5% - 5.0% ] 4.93% | 1,824 | 6.5% |
[ 5.0% - 5.5% ] 5.18% | 965 | 2.9% |
[ 5.5% - 6.0% ] 5.77% | 5,424 | 4.5% |
[ 6.0% - 6.5% ] 6.28% | 733 | 7.4% |
[ 6.5% - 7.0% ] 6.68% | 7,564 | 4.5% |
[ 8.5% - 9.0% ] 8.57% | 2,403 | 6.2% |
[ 13.5% - 14.0% ] 13.66% | 454 | 3.0% |
[ 20.5% - 21.0% ] 20.52% | 3,621 | 5.4% |
[ 27.0% - 27.5% ] 27.26% | 2,021 | 6.1% |
[ 66.0% - 66.5% ] 66.49% | 749 | 7.8% |
[ 78.5% - 79.0% ] 78.94% | 6,012 | 3.0% |
[ 89.0% - 89.5% ] 89.12% | 882 | 5.7% |
[ 90.0% - 90.5% ] 90.37% | 187 | 4.8% |
[ 99.5% - 100.0% ] 100.00% | 516 | 16.7% |