Inupiat Male Disability
COMPARE
Inupiat
Select to Compare
Male Disability
Inupiat Male Disability
13.0%
DISABILITY | MALES
0.0/ 100
METRIC RATING
297th/ 347
METRIC RANK
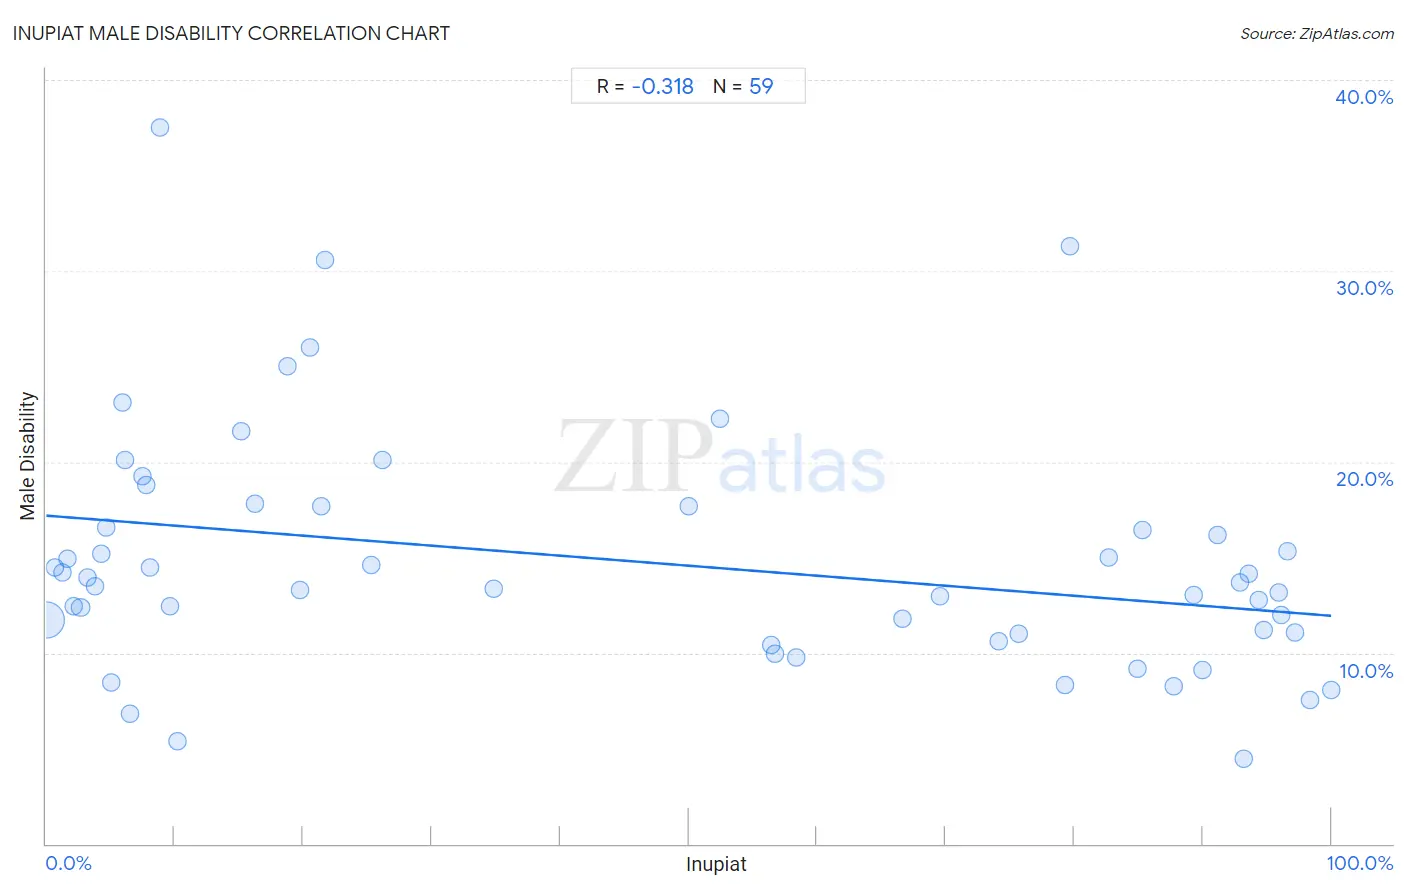
Inupiat Male Disability Correlation Chart
The statistical analysis conducted on geographies consisting of 96,329,518 people shows a mild negative correlation between the proportion of Inupiat and percentage of males with a disability in the United States with a correlation coefficient (R) of -0.318 and weighted average of 13.0%. On average, for every 1% (one percent) increase in Inupiat within a typical geography, there is a decrease of 0.052% in percentage of males with a disability.
It is essential to understand that the correlation between the percentage of Inupiat and percentage of males with a disability does not imply a direct cause-and-effect relationship. It remains uncertain whether the presence of Inupiat influences an upward or downward trend in the level of percentage of males with a disability within an area, or if Inupiat simply ended up residing in those areas with higher or lower levels of percentage of males with a disability due to other factors.
Demographics Similar to Inupiat by Male Disability
In terms of male disability, the demographic groups most similar to Inupiat are Nonimmigrants (12.9%, a difference of 0.11%), Immigrants from Micronesia (12.9%, a difference of 0.17%), Pennsylvania German (13.0%, a difference of 0.20%), Marshallese (12.9%, a difference of 0.27%), and Yaqui (12.9%, a difference of 0.51%).
| Demographics | Rating | Rank | Male Disability |
| Pima | 0.0 /100 | #290 | Tragic 12.8% |
| Whites/Caucasians | 0.0 /100 | #291 | Tragic 12.8% |
| English | 0.0 /100 | #292 | Tragic 12.8% |
| Yaqui | 0.0 /100 | #293 | Tragic 12.9% |
| Marshallese | 0.0 /100 | #294 | Tragic 12.9% |
| Immigrants from Micronesia | 0.0 /100 | #295 | Tragic 12.9% |
| Nonimmigrants | 0.0 /100 | #296 | Tragic 12.9% |
| Inupiat | 0.0 /100 | #297 | Tragic 13.0% |
| Pennsylvania Germans | 0.0 /100 | #298 | Tragic 13.0% |
| Celtics | 0.0 /100 | #299 | Tragic 13.0% |
| Cheyenne | 0.0 /100 | #300 | Tragic 13.0% |
| French | 0.0 /100 | #301 | Tragic 13.0% |
| Crow | 0.0 /100 | #302 | Tragic 13.1% |
| Scotch-Irish | 0.0 /100 | #303 | Tragic 13.2% |
| Blacks/African Americans | 0.0 /100 | #304 | Tragic 13.2% |
Inupiat Male Disability Correlation Summary
| Measurement | Inupiat Data | Male Disability Data |
| Minimum | 0.028% | 4.5% |
| Maximum | 100.0% | 37.5% |
| Range | 100.0% | 33.0% |
| Mean | 45.8% | 14.8% |
| Median | 34.8% | 13.5% |
| Interquartile 25% (IQ1) | 7.5% | 11.0% |
| Interquartile 75% (IQ3) | 87.8% | 17.6% |
| Interquartile Range (IQR) | 80.3% | 6.7% |
| Standard Deviation (Sample) | 38.2% | 6.3% |
| Standard Deviation (Population) | 37.8% | 6.2% |
Correlation Details
| Inupiat Percentile | Sample Size | Male Disability |
[ 0.0% - 0.5% ] 0.028% | 94,665,499 | 11.7% |
[ 0.5% - 1.0% ] 0.70% | 429,603 | 14.5% |
[ 1.0% - 1.5% ] 1.25% | 320,421 | 14.2% |
[ 1.5% - 2.0% ] 1.64% | 100,478 | 14.9% |
[ 2.0% - 2.5% ] 2.17% | 456,675 | 12.4% |
[ 2.5% - 3.0% ] 2.67% | 170,010 | 12.4% |
[ 3.0% - 3.5% ] 3.19% | 32,728 | 13.9% |
[ 3.5% - 4.0% ] 3.75% | 70,281 | 13.5% |
[ 4.0% - 4.5% ] 4.24% | 10,052 | 15.2% |
[ 4.5% - 5.0% ] 4.69% | 3,070 | 16.6% |
[ 5.0% - 5.5% ] 5.06% | 7,328 | 8.4% |
[ 5.5% - 6.0% ] 5.90% | 983 | 23.1% |
[ 6.0% - 6.5% ] 6.10% | 1,934 | 20.1% |
[ 6.5% - 7.0% ] 6.51% | 2,858 | 6.8% |
[ 7.0% - 7.5% ] 7.46% | 134 | 19.3% |
[ 7.5% - 8.0% ] 7.77% | 927 | 18.8% |
[ 8.0% - 8.5% ] 8.05% | 584 | 14.5% |
[ 8.5% - 9.0% ] 8.82% | 499 | 37.5% |
[ 9.5% - 10.0% ] 9.60% | 4,229 | 12.4% |
[ 10.0% - 10.5% ] 10.25% | 478 | 5.4% |
[ 15.0% - 15.5% ] 15.20% | 329 | 21.6% |
[ 16.0% - 16.5% ] 16.23% | 616 | 17.8% |
[ 18.5% - 19.0% ] 18.75% | 16 | 25.0% |
[ 19.5% - 20.0% ] 19.76% | 1,640 | 13.3% |
[ 20.5% - 21.0% ] 20.51% | 78 | 26.0% |
[ 21.0% - 21.5% ] 21.38% | 1,113 | 17.7% |
[ 21.5% - 22.0% ] 21.74% | 69 | 30.6% |
[ 25.0% - 25.5% ] 25.26% | 95 | 14.6% |
[ 26.0% - 26.5% ] 26.16% | 692 | 20.1% |
[ 34.5% - 35.0% ] 34.78% | 46 | 13.3% |
[ 50.0% - 50.5% ] 50.00% | 60 | 17.6% |
[ 52.0% - 52.5% ] 52.38% | 9,755 | 22.2% |
[ 56.0% - 56.5% ] 56.38% | 752 | 10.4% |
[ 56.5% - 57.0% ] 56.68% | 4,453 | 9.9% |
[ 58.0% - 58.5% ] 58.36% | 4,150 | 9.8% |
[ 66.5% - 67.0% ] 66.61% | 3,255 | 11.8% |
[ 69.5% - 70.0% ] 69.59% | 3,088 | 13.0% |
[ 74.0% - 74.5% ] 74.11% | 1,128 | 10.6% |
[ 75.5% - 76.0% ] 75.68% | 1,242 | 11.0% |
[ 79.0% - 79.5% ] 79.28% | 444 | 8.3% |
[ 79.5% - 80.0% ] 79.68% | 630 | 31.3% |
[ 82.5% - 83.0% ] 82.67% | 554 | 15.0% |
[ 84.5% - 85.0% ] 84.88% | 344 | 9.2% |
[ 85.0% - 85.5% ] 85.30% | 558 | 16.4% |
[ 87.5% - 88.0% ] 87.79% | 1,114 | 8.2% |
[ 89.0% - 89.5% ] 89.30% | 1,308 | 13.0% |
[ 89.5% - 90.0% ] 89.95% | 378 | 9.1% |
[ 91.0% - 91.5% ] 91.10% | 1,686 | 16.2% |
[ 92.5% - 93.0% ] 92.91% | 846 | 13.7% |
[ 93.0% - 93.5% ] 93.23% | 266 | 4.5% |
[ 93.5% - 94.0% ] 93.57% | 809 | 14.2% |
[ 94.0% - 94.5% ] 94.31% | 1,652 | 12.8% |
[ 94.5% - 95.0% ] 94.72% | 1,136 | 11.2% |
[ 95.5% - 96.0% ] 95.96% | 1,288 | 13.2% |
[ 96.0% - 96.5% ] 96.08% | 1,072 | 12.0% |
[ 96.5% - 97.0% ] 96.60% | 588 | 15.3% |
[ 97.0% - 97.5% ] 97.19% | 2,138 | 11.1% |
[ 98.0% - 98.5% ] 98.30% | 824 | 7.5% |
[ 99.5% - 100.0% ] 100.00% | 535 | 8.0% |