Inupiat vs Latvian 3 or more Vehicles in Household
COMPARE
Inupiat
Latvian
3 or more Vehicles in Household
3 or more Vehicles in Household Comparison
Inupiat
Latvians
16.9%
3 OR MORE VEHICLES IN HOUSEHOLD
0.1/ 100
METRIC RATING
296th/ 347
METRIC RANK
19.3%
3 OR MORE VEHICLES IN HOUSEHOLD
35.7/ 100
METRIC RATING
184th/ 347
METRIC RANK
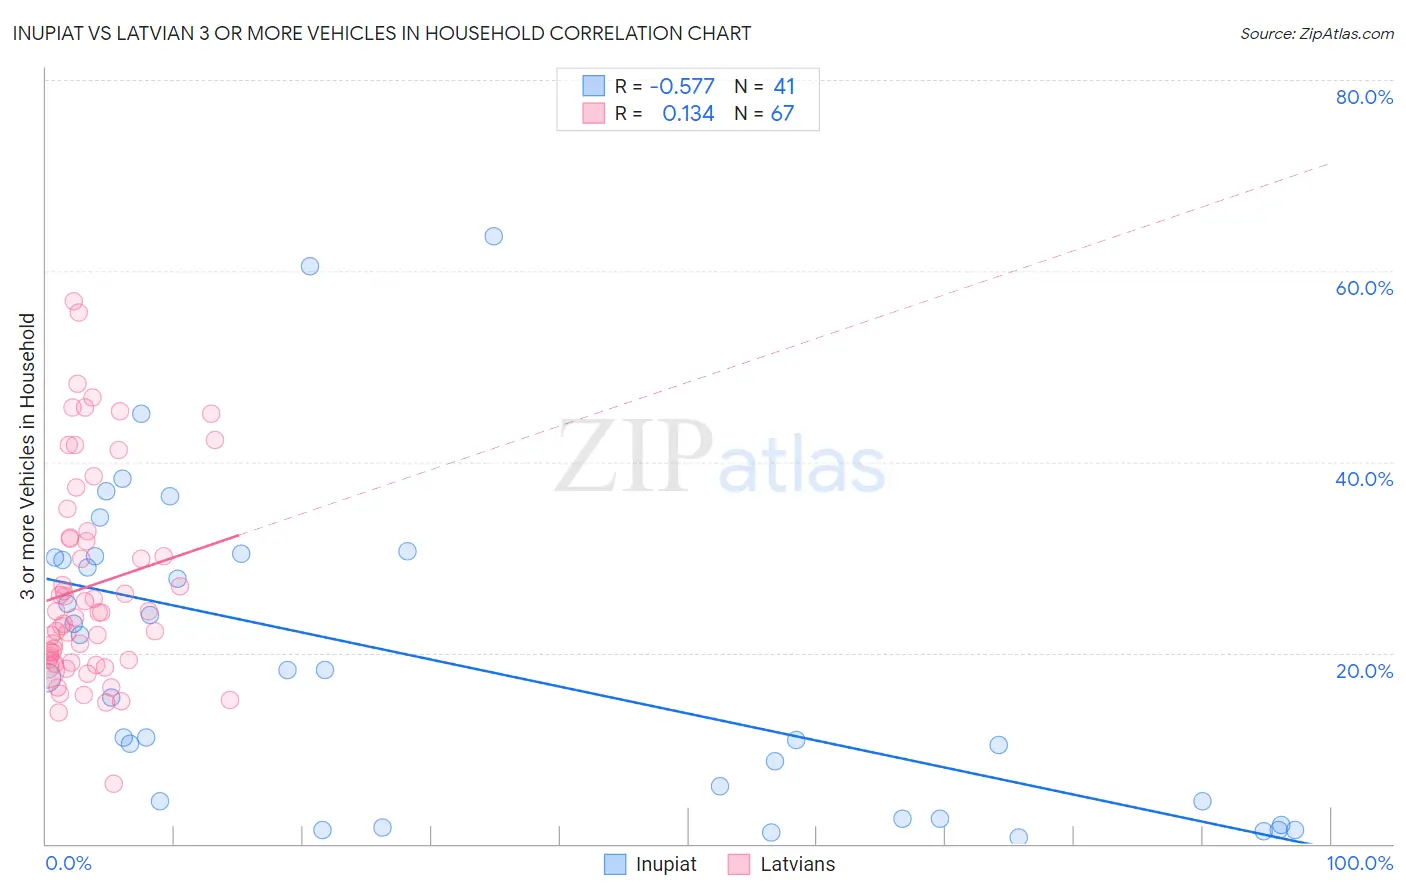
Inupiat vs Latvian 3 or more Vehicles in Household Correlation Chart
The statistical analysis conducted on geographies consisting of 96,277,833 people shows a substantial negative correlation between the proportion of Inupiat and percentage of households with 3 or more vehicles available in the United States with a correlation coefficient (R) of -0.577 and weighted average of 16.9%. Similarly, the statistical analysis conducted on geographies consisting of 220,591,398 people shows a poor positive correlation between the proportion of Latvians and percentage of households with 3 or more vehicles available in the United States with a correlation coefficient (R) of 0.134 and weighted average of 19.3%, a difference of 14.4%.
3 or more Vehicles in Household Correlation Summary
| Measurement | Inupiat | Latvian |
| Minimum | 0.71% | 6.2% |
| Maximum | 63.6% | 56.8% |
| Range | 62.9% | 50.6% |
| Mean | 19.0% | 27.0% |
| Median | 17.4% | 24.2% |
| Interquartile 25% (IQ1) | 3.5% | 19.0% |
| Interquartile 75% (IQ3) | 30.0% | 32.0% |
| Interquartile Range (IQR) | 26.5% | 13.0% |
| Standard Deviation (Sample) | 16.3% | 10.9% |
| Standard Deviation (Population) | 16.1% | 10.9% |
Similar Demographics by 3 or more Vehicles in Household
Demographics Similar to Inupiat by 3 or more Vehicles in Household
In terms of 3 or more vehicles in household, the demographic groups most similar to Inupiat are Immigrants from Russia (16.9%, a difference of 0.36%), Immigrants from Western Africa (16.9%, a difference of 0.41%), Israeli (16.8%, a difference of 0.47%), Bahamian (16.9%, a difference of 0.52%), and Immigrants from Spain (17.0%, a difference of 0.60%).
| Demographics | Rating | Rank | 3 or more Vehicles in Household |
| Immigrants | Liberia | 0.1 /100 | #289 | Tragic 17.1% |
| Liberians | 0.1 /100 | #290 | Tragic 17.0% |
| Immigrants | Congo | 0.1 /100 | #291 | Tragic 17.0% |
| Immigrants | Spain | 0.1 /100 | #292 | Tragic 17.0% |
| Bahamians | 0.1 /100 | #293 | Tragic 16.9% |
| Immigrants | Western Africa | 0.1 /100 | #294 | Tragic 16.9% |
| Immigrants | Russia | 0.1 /100 | #295 | Tragic 16.9% |
| Inupiat | 0.1 /100 | #296 | Tragic 16.9% |
| Israelis | 0.1 /100 | #297 | Tragic 16.8% |
| Immigrants | Zaire | 0.1 /100 | #298 | Tragic 16.7% |
| Immigrants | South America | 0.1 /100 | #299 | Tragic 16.7% |
| Cypriots | 0.0 /100 | #300 | Tragic 16.6% |
| Paraguayans | 0.0 /100 | #301 | Tragic 16.6% |
| Immigrants | Greece | 0.0 /100 | #302 | Tragic 16.5% |
| Immigrants | Serbia | 0.0 /100 | #303 | Tragic 16.4% |
Demographics Similar to Latvians by 3 or more Vehicles in Household
In terms of 3 or more vehicles in household, the demographic groups most similar to Latvians are Cajun (19.3%, a difference of 0.020%), Cuban (19.3%, a difference of 0.070%), Romanian (19.3%, a difference of 0.11%), South African (19.3%, a difference of 0.15%), and Immigrants from South Central Asia (19.3%, a difference of 0.26%).
| Demographics | Rating | Rank | 3 or more Vehicles in Household |
| Immigrants | Peru | 41.1 /100 | #177 | Average 19.4% |
| Immigrants | Syria | 40.3 /100 | #178 | Average 19.4% |
| Immigrants | South Central Asia | 38.9 /100 | #179 | Fair 19.3% |
| South Africans | 37.5 /100 | #180 | Fair 19.3% |
| Romanians | 37.1 /100 | #181 | Fair 19.3% |
| Cubans | 36.6 /100 | #182 | Fair 19.3% |
| Cajuns | 36.0 /100 | #183 | Fair 19.3% |
| Latvians | 35.7 /100 | #184 | Fair 19.3% |
| Immigrants | Sri Lanka | 30.7 /100 | #185 | Fair 19.2% |
| Immigrants | Sweden | 29.0 /100 | #186 | Fair 19.2% |
| Immigrants | Hong Kong | 28.3 /100 | #187 | Fair 19.2% |
| Immigrants | Kuwait | 26.1 /100 | #188 | Fair 19.1% |
| Indians (Asian) | 26.0 /100 | #189 | Fair 19.1% |
| Immigrants | Zimbabwe | 25.5 /100 | #190 | Fair 19.1% |
| South American Indians | 25.4 /100 | #191 | Fair 19.1% |