Immigrants from Trinidad and Tobago vs Immigrants from Saudi Arabia 3 or more Vehicles in Household
COMPARE
Immigrants from Trinidad and Tobago
Immigrants from Saudi Arabia
3 or more Vehicles in Household
3 or more Vehicles in Household Comparison
Immigrants from Trinidad and Tobago
Immigrants from Saudi Arabia
13.3%
3 OR MORE VEHICLES IN HOUSEHOLD
0.0/ 100
METRIC RATING
335th/ 347
METRIC RANK
18.0%
3 OR MORE VEHICLES IN HOUSEHOLD
1.7/ 100
METRIC RATING
249th/ 347
METRIC RANK
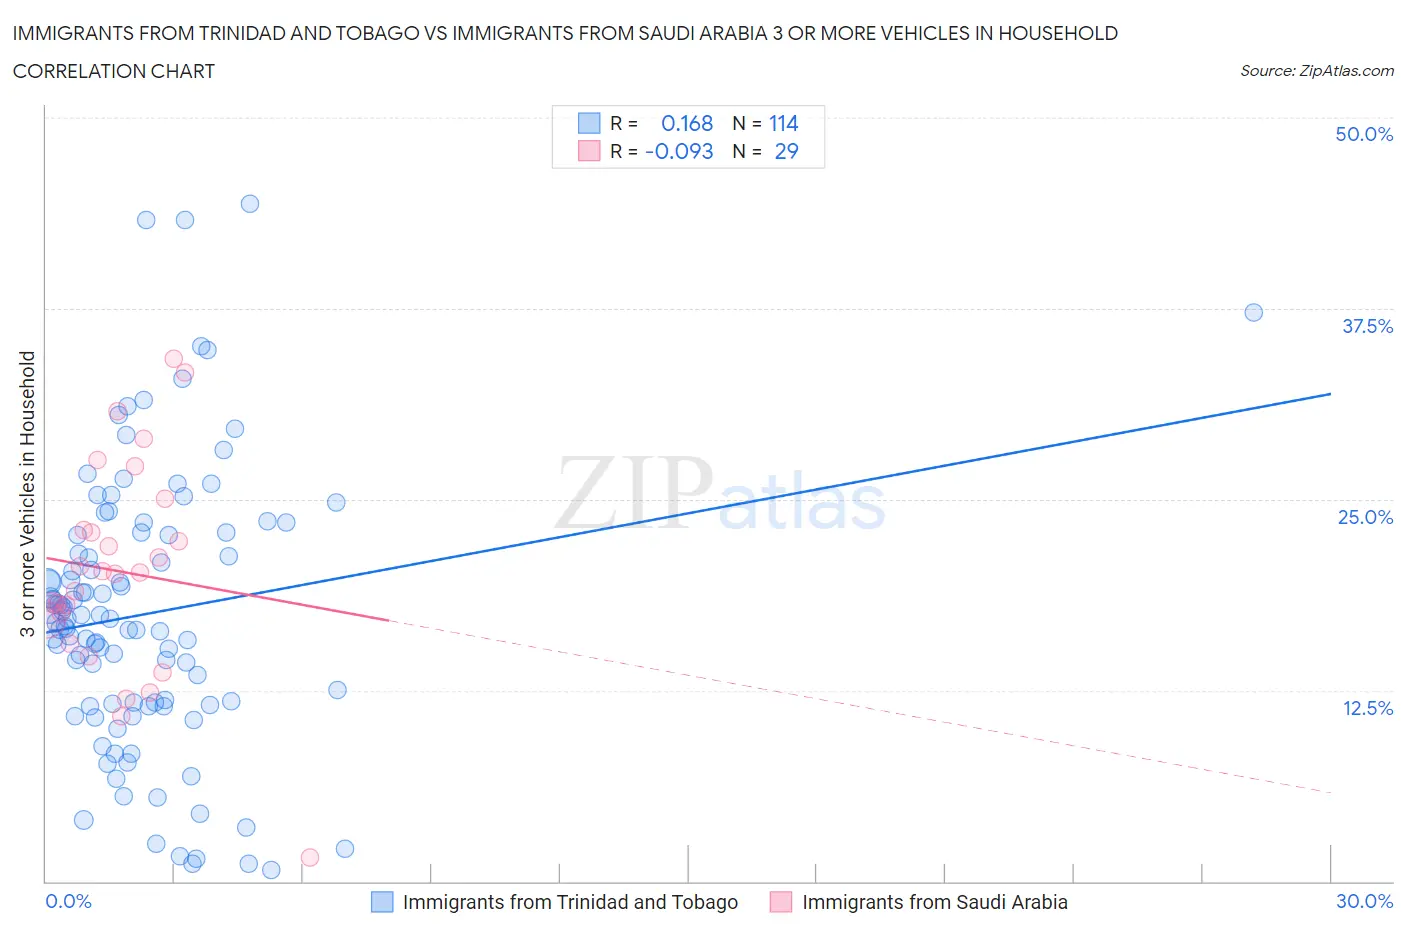
Immigrants from Trinidad and Tobago vs Immigrants from Saudi Arabia 3 or more Vehicles in Household Correlation Chart
The statistical analysis conducted on geographies consisting of 223,458,763 people shows a poor positive correlation between the proportion of Immigrants from Trinidad and Tobago and percentage of households with 3 or more vehicles available in the United States with a correlation coefficient (R) of 0.168 and weighted average of 13.3%. Similarly, the statistical analysis conducted on geographies consisting of 164,148,473 people shows a slight negative correlation between the proportion of Immigrants from Saudi Arabia and percentage of households with 3 or more vehicles available in the United States with a correlation coefficient (R) of -0.093 and weighted average of 18.0%, a difference of 35.0%.
3 or more Vehicles in Household Correlation Summary
| Measurement | Immigrants from Trinidad and Tobago | Immigrants from Saudi Arabia |
| Minimum | 0.77% | 1.5% |
| Maximum | 44.4% | 34.2% |
| Range | 43.6% | 32.7% |
| Mean | 17.5% | 20.3% |
| Median | 17.1% | 20.2% |
| Interquartile 25% (IQ1) | 11.6% | 16.4% |
| Interquartile 75% (IQ3) | 22.7% | 24.0% |
| Interquartile Range (IQR) | 11.0% | 7.7% |
| Standard Deviation (Sample) | 9.0% | 7.1% |
| Standard Deviation (Population) | 9.0% | 6.9% |
Similar Demographics by 3 or more Vehicles in Household
Demographics Similar to Immigrants from Trinidad and Tobago by 3 or more Vehicles in Household
In terms of 3 or more vehicles in household, the demographic groups most similar to Immigrants from Trinidad and Tobago are Immigrants from Ecuador (13.4%, a difference of 0.46%), Immigrants from Cabo Verde (13.6%, a difference of 1.7%), Trinidadian and Tobagonian (13.6%, a difference of 2.1%), Immigrants from Dominica (13.7%, a difference of 2.8%), and West Indian (13.7%, a difference of 3.0%).
| Demographics | Rating | Rank | 3 or more Vehicles in Household |
| Immigrants | Albania | 0.0 /100 | #328 | Tragic 14.0% |
| Immigrants | Senegal | 0.0 /100 | #329 | Tragic 13.8% |
| West Indians | 0.0 /100 | #330 | Tragic 13.7% |
| Immigrants | Dominica | 0.0 /100 | #331 | Tragic 13.7% |
| Trinidadians and Tobagonians | 0.0 /100 | #332 | Tragic 13.6% |
| Immigrants | Cabo Verde | 0.0 /100 | #333 | Tragic 13.6% |
| Immigrants | Ecuador | 0.0 /100 | #334 | Tragic 13.4% |
| Immigrants | Trinidad and Tobago | 0.0 /100 | #335 | Tragic 13.3% |
| Barbadians | 0.0 /100 | #336 | Tragic 12.6% |
| Immigrants | Bangladesh | 0.0 /100 | #337 | Tragic 12.5% |
| Vietnamese | 0.0 /100 | #338 | Tragic 12.5% |
| Immigrants | Uzbekistan | 0.0 /100 | #339 | Tragic 12.0% |
| Immigrants | Barbados | 0.0 /100 | #340 | Tragic 11.7% |
| Guyanese | 0.0 /100 | #341 | Tragic 11.5% |
| British West Indians | 0.0 /100 | #342 | Tragic 11.4% |
Demographics Similar to Immigrants from Saudi Arabia by 3 or more Vehicles in Household
In terms of 3 or more vehicles in household, the demographic groups most similar to Immigrants from Saudi Arabia are Venezuelan (18.0%, a difference of 0.020%), Immigrants from Eastern Africa (18.0%, a difference of 0.060%), Carpatho Rusyn (18.0%, a difference of 0.19%), Alsatian (18.0%, a difference of 0.22%), and Immigrants from Australia (18.1%, a difference of 0.35%).
| Demographics | Rating | Rank | 3 or more Vehicles in Household |
| Hopi | 2.5 /100 | #242 | Tragic 18.2% |
| Immigrants | Europe | 2.4 /100 | #243 | Tragic 18.1% |
| Mongolians | 2.3 /100 | #244 | Tragic 18.1% |
| Immigrants | Belize | 2.1 /100 | #245 | Tragic 18.1% |
| Immigrants | Australia | 2.0 /100 | #246 | Tragic 18.1% |
| Carpatho Rusyns | 1.9 /100 | #247 | Tragic 18.0% |
| Immigrants | Eastern Africa | 1.8 /100 | #248 | Tragic 18.0% |
| Immigrants | Saudi Arabia | 1.7 /100 | #249 | Tragic 18.0% |
| Venezuelans | 1.7 /100 | #250 | Tragic 18.0% |
| Alsatians | 1.5 /100 | #251 | Tragic 18.0% |
| Immigrants | Southern Europe | 1.4 /100 | #252 | Tragic 17.9% |
| Immigrants | Ethiopia | 1.3 /100 | #253 | Tragic 17.9% |
| Ethiopians | 1.2 /100 | #254 | Tragic 17.9% |
| Immigrants | Turkey | 1.2 /100 | #255 | Tragic 17.9% |
| Sub-Saharan Africans | 1.1 /100 | #256 | Tragic 17.9% |