Immigrants from Trinidad and Tobago vs Immigrants from Nepal 3 or more Vehicles in Household
COMPARE
Immigrants from Trinidad and Tobago
Immigrants from Nepal
3 or more Vehicles in Household
3 or more Vehicles in Household Comparison
Immigrants from Trinidad and Tobago
Immigrants from Nepal
13.3%
3 OR MORE VEHICLES IN HOUSEHOLD
0.0/ 100
METRIC RATING
335th/ 347
METRIC RANK
17.6%
3 OR MORE VEHICLES IN HOUSEHOLD
0.6/ 100
METRIC RATING
270th/ 347
METRIC RANK
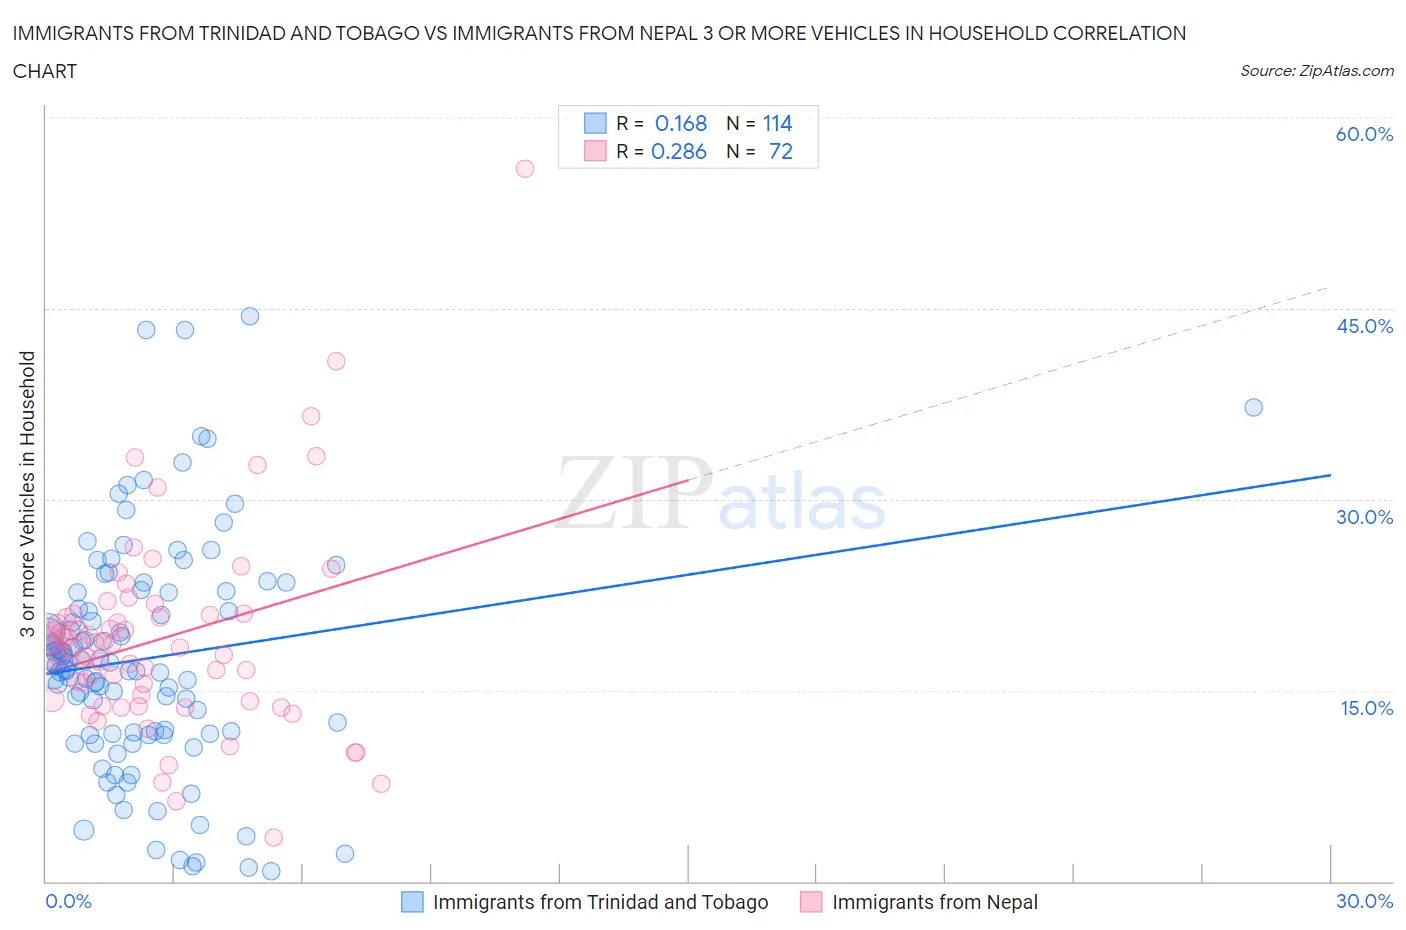
Immigrants from Trinidad and Tobago vs Immigrants from Nepal 3 or more Vehicles in Household Correlation Chart
The statistical analysis conducted on geographies consisting of 223,458,763 people shows a poor positive correlation between the proportion of Immigrants from Trinidad and Tobago and percentage of households with 3 or more vehicles available in the United States with a correlation coefficient (R) of 0.168 and weighted average of 13.3%. Similarly, the statistical analysis conducted on geographies consisting of 186,663,227 people shows a weak positive correlation between the proportion of Immigrants from Nepal and percentage of households with 3 or more vehicles available in the United States with a correlation coefficient (R) of 0.286 and weighted average of 17.6%, a difference of 32.2%.
3 or more Vehicles in Household Correlation Summary
| Measurement | Immigrants from Trinidad and Tobago | Immigrants from Nepal |
| Minimum | 0.77% | 3.4% |
| Maximum | 44.4% | 55.9% |
| Range | 43.6% | 52.5% |
| Mean | 17.5% | 19.0% |
| Median | 17.1% | 18.3% |
| Interquartile 25% (IQ1) | 11.6% | 14.2% |
| Interquartile 75% (IQ3) | 22.7% | 21.0% |
| Interquartile Range (IQR) | 11.0% | 6.8% |
| Standard Deviation (Sample) | 9.0% | 8.0% |
| Standard Deviation (Population) | 9.0% | 8.0% |
Similar Demographics by 3 or more Vehicles in Household
Demographics Similar to Immigrants from Trinidad and Tobago by 3 or more Vehicles in Household
In terms of 3 or more vehicles in household, the demographic groups most similar to Immigrants from Trinidad and Tobago are Immigrants from Ecuador (13.4%, a difference of 0.46%), Immigrants from Cabo Verde (13.6%, a difference of 1.7%), Trinidadian and Tobagonian (13.6%, a difference of 2.1%), Immigrants from Dominica (13.7%, a difference of 2.8%), and West Indian (13.7%, a difference of 3.0%).
| Demographics | Rating | Rank | 3 or more Vehicles in Household |
| Immigrants | Albania | 0.0 /100 | #328 | Tragic 14.0% |
| Immigrants | Senegal | 0.0 /100 | #329 | Tragic 13.8% |
| West Indians | 0.0 /100 | #330 | Tragic 13.7% |
| Immigrants | Dominica | 0.0 /100 | #331 | Tragic 13.7% |
| Trinidadians and Tobagonians | 0.0 /100 | #332 | Tragic 13.6% |
| Immigrants | Cabo Verde | 0.0 /100 | #333 | Tragic 13.6% |
| Immigrants | Ecuador | 0.0 /100 | #334 | Tragic 13.4% |
| Immigrants | Trinidad and Tobago | 0.0 /100 | #335 | Tragic 13.3% |
| Barbadians | 0.0 /100 | #336 | Tragic 12.6% |
| Immigrants | Bangladesh | 0.0 /100 | #337 | Tragic 12.5% |
| Vietnamese | 0.0 /100 | #338 | Tragic 12.5% |
| Immigrants | Uzbekistan | 0.0 /100 | #339 | Tragic 12.0% |
| Immigrants | Barbados | 0.0 /100 | #340 | Tragic 11.7% |
| Guyanese | 0.0 /100 | #341 | Tragic 11.5% |
| British West Indians | 0.0 /100 | #342 | Tragic 11.4% |
Demographics Similar to Immigrants from Nepal by 3 or more Vehicles in Household
In terms of 3 or more vehicles in household, the demographic groups most similar to Immigrants from Nepal are South American (17.6%, a difference of 0.0%), Immigrants from France (17.6%, a difference of 0.050%), Immigrants from Africa (17.6%, a difference of 0.41%), Immigrants from Sudan (17.6%, a difference of 0.45%), and Immigrants from Bulgaria (17.7%, a difference of 0.47%).
| Demographics | Rating | Rank | 3 or more Vehicles in Household |
| Bermudans | 0.9 /100 | #263 | Tragic 17.8% |
| Cambodians | 0.9 /100 | #264 | Tragic 17.8% |
| Immigrants | Panama | 0.8 /100 | #265 | Tragic 17.7% |
| Macedonians | 0.8 /100 | #266 | Tragic 17.7% |
| Immigrants | Venezuela | 0.8 /100 | #267 | Tragic 17.7% |
| Immigrants | Bulgaria | 0.8 /100 | #268 | Tragic 17.7% |
| Immigrants | France | 0.6 /100 | #269 | Tragic 17.6% |
| Immigrants | Nepal | 0.6 /100 | #270 | Tragic 17.6% |
| South Americans | 0.6 /100 | #271 | Tragic 17.6% |
| Immigrants | Africa | 0.5 /100 | #272 | Tragic 17.6% |
| Immigrants | Sudan | 0.5 /100 | #273 | Tragic 17.6% |
| Immigrants | Bosnia and Herzegovina | 0.5 /100 | #274 | Tragic 17.5% |
| Immigrants | Ukraine | 0.4 /100 | #275 | Tragic 17.5% |
| Okinawans | 0.4 /100 | #276 | Tragic 17.4% |
| Brazilians | 0.4 /100 | #277 | Tragic 17.4% |