Immigrants from Thailand vs Sierra Leonean 3 or more Vehicles in Household
COMPARE
Immigrants from Thailand
Sierra Leonean
3 or more Vehicles in Household
3 or more Vehicles in Household Comparison
Immigrants from Thailand
Sierra Leoneans
20.5%
3 OR MORE VEHICLES IN HOUSEHOLD
93.8/ 100
METRIC RATING
121st/ 347
METRIC RANK
18.3%
3 OR MORE VEHICLES IN HOUSEHOLD
3.9/ 100
METRIC RATING
235th/ 347
METRIC RANK
Immigrants from Thailand vs Sierra Leonean 3 or more Vehicles in Household Correlation Chart
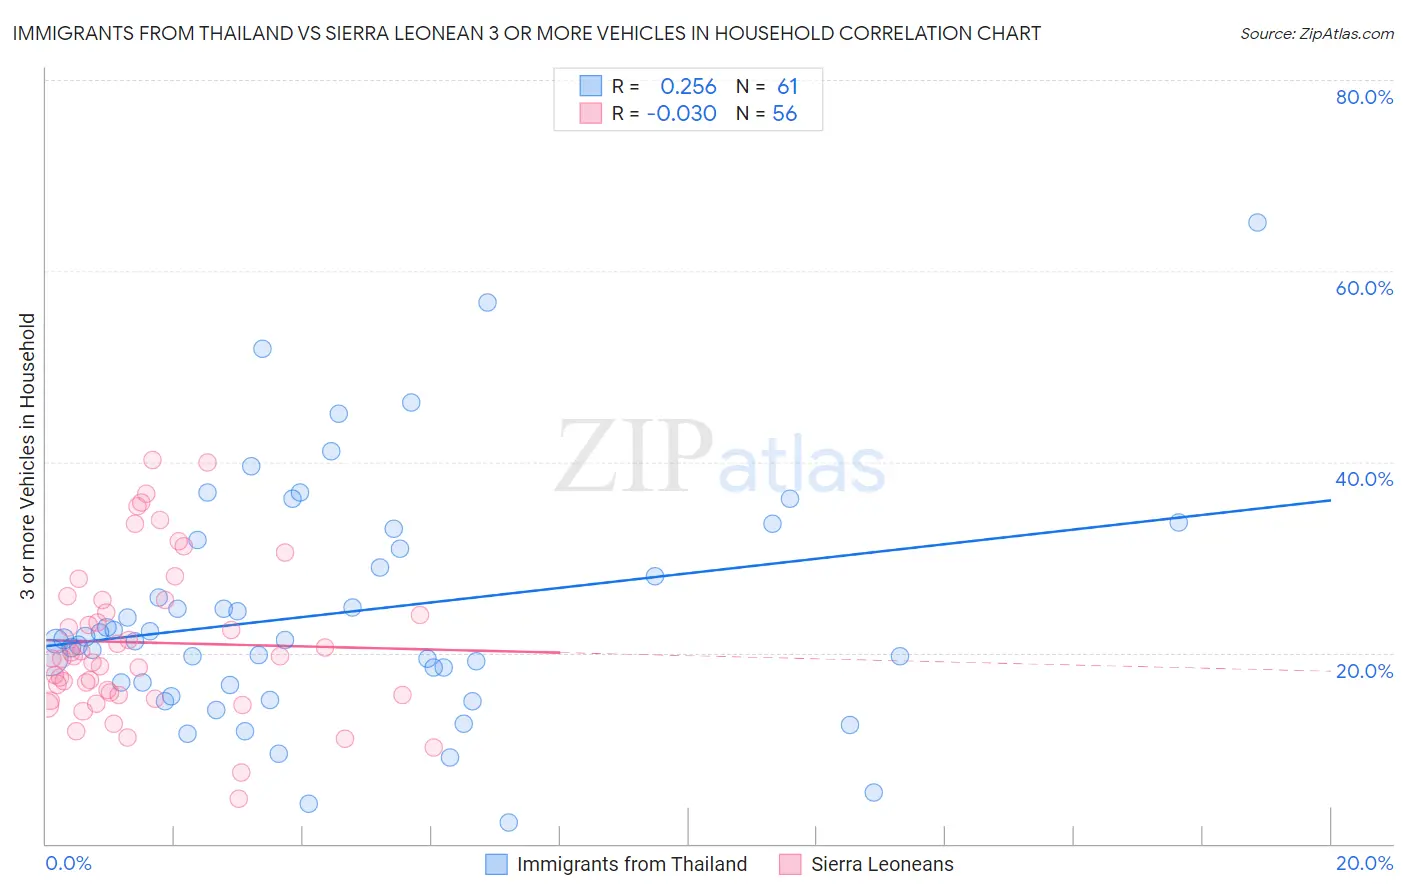
The statistical analysis conducted on geographies consisting of 316,892,438 people shows a weak positive correlation between the proportion of Immigrants from Thailand and percentage of households with 3 or more vehicles available in the United States with a correlation coefficient (R) of 0.256 and weighted average of 20.5%. Similarly, the statistical analysis conducted on geographies consisting of 83,340,667 people shows no correlation between the proportion of Sierra Leoneans and percentage of households with 3 or more vehicles available in the United States with a correlation coefficient (R) of -0.030 and weighted average of 18.3%, a difference of 11.9%.
3 or more Vehicles in Household Correlation Summary
| Measurement | Immigrants from Thailand | Sierra Leonean |
| Minimum | 2.3% | 4.7% |
| Maximum | 65.1% | 40.1% |
| Range | 62.9% | 35.5% |
| Mean | 24.2% | 21.1% |
| Median | 21.4% | 19.5% |
| Interquartile 25% (IQ1) | 16.7% | 15.6% |
| Interquartile 75% (IQ3) | 31.3% | 25.5% |
| Interquartile Range (IQR) | 14.6% | 10.0% |
| Standard Deviation (Sample) | 12.3% | 8.1% |
| Standard Deviation (Population) | 12.2% | 8.0% |
Similar Demographics by 3 or more Vehicles in Household
Demographics Similar to Immigrants from Thailand by 3 or more Vehicles in Household
In terms of 3 or more vehicles in household, the demographic groups most similar to Immigrants from Thailand are Maltese (20.5%, a difference of 0.010%), German Russian (20.5%, a difference of 0.040%), Immigrants from Korea (20.5%, a difference of 0.050%), Immigrants from Latin America (20.5%, a difference of 0.21%), and Central American (20.5%, a difference of 0.22%).
| Demographics | Rating | Rank | 3 or more Vehicles in Household |
| Burmese | 95.8 /100 | #114 | Exceptional 20.6% |
| French Canadians | 95.0 /100 | #115 | Exceptional 20.6% |
| Italians | 94.9 /100 | #116 | Exceptional 20.6% |
| Croatians | 94.9 /100 | #117 | Exceptional 20.6% |
| Costa Ricans | 94.6 /100 | #118 | Exceptional 20.6% |
| Immigrants | Latin America | 94.5 /100 | #119 | Exceptional 20.5% |
| Maltese | 93.9 /100 | #120 | Exceptional 20.5% |
| Immigrants | Thailand | 93.8 /100 | #121 | Exceptional 20.5% |
| German Russians | 93.7 /100 | #122 | Exceptional 20.5% |
| Immigrants | Korea | 93.7 /100 | #123 | Exceptional 20.5% |
| Central Americans | 93.1 /100 | #124 | Exceptional 20.5% |
| Immigrants | Netherlands | 92.9 /100 | #125 | Exceptional 20.4% |
| Slavs | 92.1 /100 | #126 | Exceptional 20.4% |
| Immigrants | Bolivia | 92.0 /100 | #127 | Exceptional 20.4% |
| New Zealanders | 91.3 /100 | #128 | Exceptional 20.4% |
Demographics Similar to Sierra Leoneans by 3 or more Vehicles in Household
In terms of 3 or more vehicles in household, the demographic groups most similar to Sierra Leoneans are Immigrants from Malaysia (18.3%, a difference of 0.18%), Indonesian (18.3%, a difference of 0.23%), Immigrants from North Macedonia (18.4%, a difference of 0.28%), Honduran (18.4%, a difference of 0.34%), and Immigrants from Uganda (18.4%, a difference of 0.36%).
| Demographics | Rating | Rank | 3 or more Vehicles in Household |
| Turks | 5.4 /100 | #228 | Tragic 18.4% |
| Immigrants | Switzerland | 5.0 /100 | #229 | Tragic 18.4% |
| Immigrants | Western Asia | 4.8 /100 | #230 | Tragic 18.4% |
| Immigrants | Belgium | 4.8 /100 | #231 | Tragic 18.4% |
| Immigrants | Uganda | 4.6 /100 | #232 | Tragic 18.4% |
| Hondurans | 4.6 /100 | #233 | Tragic 18.4% |
| Immigrants | North Macedonia | 4.4 /100 | #234 | Tragic 18.4% |
| Sierra Leoneans | 3.9 /100 | #235 | Tragic 18.3% |
| Immigrants | Malaysia | 3.6 /100 | #236 | Tragic 18.3% |
| Indonesians | 3.5 /100 | #237 | Tragic 18.3% |
| Immigrants | Honduras | 3.1 /100 | #238 | Tragic 18.2% |
| Immigrants | Middle Africa | 3.1 /100 | #239 | Tragic 18.2% |
| Immigrants | China | 2.9 /100 | #240 | Tragic 18.2% |
| Africans | 2.7 /100 | #241 | Tragic 18.2% |
| Hopi | 2.5 /100 | #242 | Tragic 18.2% |