Immigrants from Thailand vs Jamaican 3 or more Vehicles in Household
COMPARE
Immigrants from Thailand
Jamaican
3 or more Vehicles in Household
3 or more Vehicles in Household Comparison
Immigrants from Thailand
Jamaicans
20.5%
3 OR MORE VEHICLES IN HOUSEHOLD
93.8/ 100
METRIC RATING
121st/ 347
METRIC RANK
15.2%
3 OR MORE VEHICLES IN HOUSEHOLD
0.0/ 100
METRIC RATING
317th/ 347
METRIC RANK
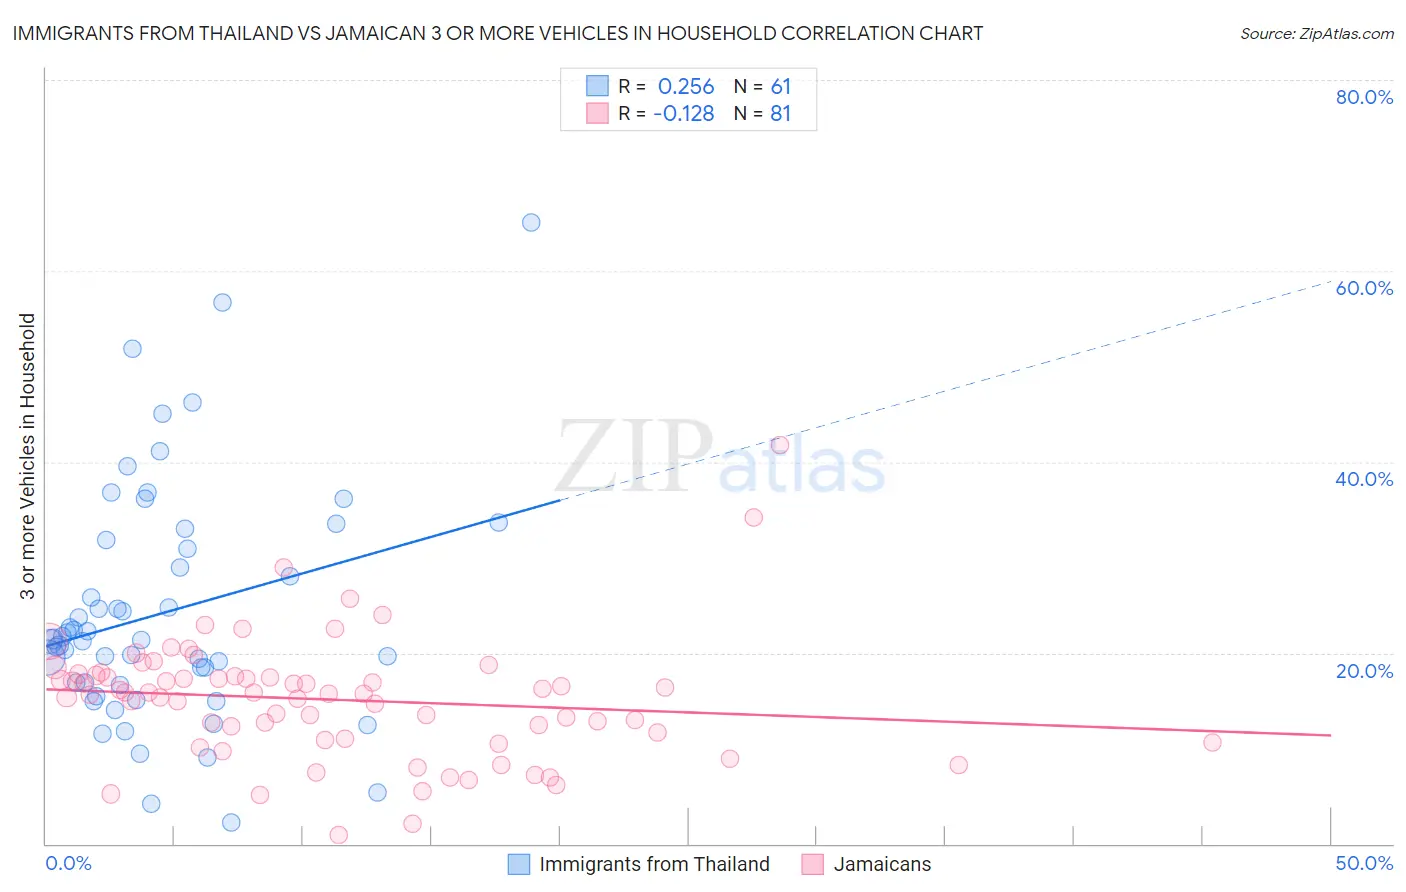
Immigrants from Thailand vs Jamaican 3 or more Vehicles in Household Correlation Chart
The statistical analysis conducted on geographies consisting of 316,892,438 people shows a weak positive correlation between the proportion of Immigrants from Thailand and percentage of households with 3 or more vehicles available in the United States with a correlation coefficient (R) of 0.256 and weighted average of 20.5%. Similarly, the statistical analysis conducted on geographies consisting of 367,542,736 people shows a poor negative correlation between the proportion of Jamaicans and percentage of households with 3 or more vehicles available in the United States with a correlation coefficient (R) of -0.128 and weighted average of 15.2%, a difference of 34.8%.
3 or more Vehicles in Household Correlation Summary
| Measurement | Immigrants from Thailand | Jamaican |
| Minimum | 2.3% | 0.94% |
| Maximum | 65.1% | 41.8% |
| Range | 62.9% | 40.8% |
| Mean | 24.2% | 15.1% |
| Median | 21.4% | 15.7% |
| Interquartile 25% (IQ1) | 16.7% | 10.9% |
| Interquartile 75% (IQ3) | 31.3% | 17.6% |
| Interquartile Range (IQR) | 14.6% | 6.7% |
| Standard Deviation (Sample) | 12.3% | 6.5% |
| Standard Deviation (Population) | 12.2% | 6.4% |
Similar Demographics by 3 or more Vehicles in Household
Demographics Similar to Immigrants from Thailand by 3 or more Vehicles in Household
In terms of 3 or more vehicles in household, the demographic groups most similar to Immigrants from Thailand are Maltese (20.5%, a difference of 0.010%), German Russian (20.5%, a difference of 0.040%), Immigrants from Korea (20.5%, a difference of 0.050%), Immigrants from Latin America (20.5%, a difference of 0.21%), and Central American (20.5%, a difference of 0.22%).
| Demographics | Rating | Rank | 3 or more Vehicles in Household |
| Burmese | 95.8 /100 | #114 | Exceptional 20.6% |
| French Canadians | 95.0 /100 | #115 | Exceptional 20.6% |
| Italians | 94.9 /100 | #116 | Exceptional 20.6% |
| Croatians | 94.9 /100 | #117 | Exceptional 20.6% |
| Costa Ricans | 94.6 /100 | #118 | Exceptional 20.6% |
| Immigrants | Latin America | 94.5 /100 | #119 | Exceptional 20.5% |
| Maltese | 93.9 /100 | #120 | Exceptional 20.5% |
| Immigrants | Thailand | 93.8 /100 | #121 | Exceptional 20.5% |
| German Russians | 93.7 /100 | #122 | Exceptional 20.5% |
| Immigrants | Korea | 93.7 /100 | #123 | Exceptional 20.5% |
| Central Americans | 93.1 /100 | #124 | Exceptional 20.5% |
| Immigrants | Netherlands | 92.9 /100 | #125 | Exceptional 20.4% |
| Slavs | 92.1 /100 | #126 | Exceptional 20.4% |
| Immigrants | Bolivia | 92.0 /100 | #127 | Exceptional 20.4% |
| New Zealanders | 91.3 /100 | #128 | Exceptional 20.4% |
Demographics Similar to Jamaicans by 3 or more Vehicles in Household
In terms of 3 or more vehicles in household, the demographic groups most similar to Jamaicans are Immigrants from Haiti (15.2%, a difference of 0.20%), U.S. Virgin Islander (15.4%, a difference of 1.2%), Cape Verdean (15.0%, a difference of 1.4%), Haitian (15.5%, a difference of 1.7%), and Immigrants from Belarus (15.5%, a difference of 2.0%).
| Demographics | Rating | Rank | 3 or more Vehicles in Household |
| Moroccans | 0.0 /100 | #310 | Tragic 15.9% |
| Albanians | 0.0 /100 | #311 | Tragic 15.8% |
| Puerto Ricans | 0.0 /100 | #312 | Tragic 15.6% |
| Immigrants | Israel | 0.0 /100 | #313 | Tragic 15.6% |
| Immigrants | Belarus | 0.0 /100 | #314 | Tragic 15.5% |
| Haitians | 0.0 /100 | #315 | Tragic 15.5% |
| U.S. Virgin Islanders | 0.0 /100 | #316 | Tragic 15.4% |
| Jamaicans | 0.0 /100 | #317 | Tragic 15.2% |
| Immigrants | Haiti | 0.0 /100 | #318 | Tragic 15.2% |
| Cape Verdeans | 0.0 /100 | #319 | Tragic 15.0% |
| Yup'ik | 0.0 /100 | #320 | Tragic 14.8% |
| Immigrants | Jamaica | 0.0 /100 | #321 | Tragic 14.7% |
| Immigrants | West Indies | 0.0 /100 | #322 | Tragic 14.6% |
| Immigrants | Caribbean | 0.0 /100 | #323 | Tragic 14.6% |
| Immigrants | Yemen | 0.0 /100 | #324 | Tragic 14.2% |