Immigrants from Burma/Myanmar Median Earnings
COMPARE
Immigrants from Burma/Myanmar
Select to Compare
Median Earnings
Immigrants from Burma/Myanmar Median Earnings
$43,998
EARNINGS
3.2/ 100
METRIC RATING
245th/ 347
METRIC RANK
Immigrants from Burma/Myanmar Median Earnings Correlation Chart
The statistical analysis conducted on geographies consisting of 172,362,577 people shows a weak negative correlation between the proportion of Immigrants from Burma/Myanmar and median earnings in the United States with a correlation coefficient (R) of -0.272 and weighted average of $43,998. On average, for every 1% (one percent) increase in Immigrants from Burma/Myanmar within a typical geography, there is a decrease of $555 in median earnings.
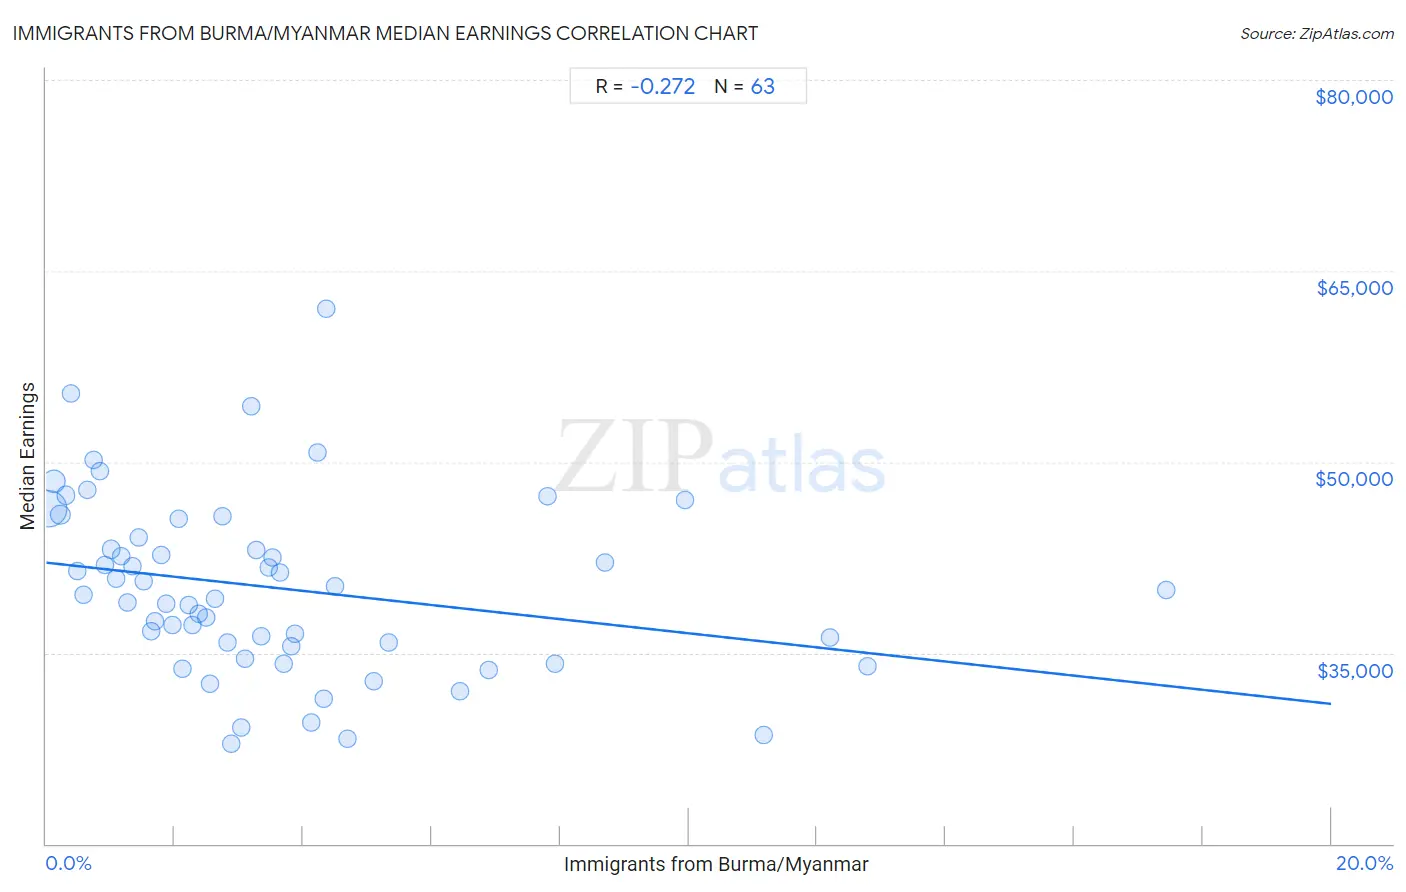
It is essential to understand that the correlation between the percentage of Immigrants from Burma/Myanmar and median earnings does not imply a direct cause-and-effect relationship. It remains uncertain whether the presence of Immigrants from Burma/Myanmar influences an upward or downward trend in the level of median earnings within an area, or if Immigrants from Burma/Myanmar simply ended up residing in those areas with higher or lower levels of median earnings due to other factors.
Demographics Similar to Immigrants from Burma/Myanmar by Median Earnings
In terms of median earnings, the demographic groups most similar to Immigrants from Burma/Myanmar are Immigrants from West Indies ($43,989, a difference of 0.020%), Immigrants from Cabo Verde ($43,963, a difference of 0.080%), Subsaharan African ($44,118, a difference of 0.27%), Nonimmigrants ($44,117, a difference of 0.27%), and Nepalese ($43,860, a difference of 0.31%).
| Demographics | Rating | Rank | Median Earnings |
| Sudanese | 5.6 /100 | #238 | Tragic $44,419 |
| Senegalese | 5.3 /100 | #239 | Tragic $44,373 |
| Aleuts | 4.4 /100 | #240 | Tragic $44,241 |
| Samoans | 4.2 /100 | #241 | Tragic $44,206 |
| Immigrants from Venezuela | 4.0 /100 | #242 | Tragic $44,163 |
| Sub-Saharan Africans | 3.7 /100 | #243 | Tragic $44,118 |
| Nonimmigrants | 3.7 /100 | #244 | Tragic $44,117 |
| Immigrants from Burma/Myanmar | 3.2 /100 | #245 | Tragic $43,998 |
| Immigrants from West Indies | 3.1 /100 | #246 | Tragic $43,989 |
| Immigrants from Cabo Verde | 3.0 /100 | #247 | Tragic $43,963 |
| Nepalese | 2.6 /100 | #248 | Tragic $43,860 |
| Malaysians | 2.6 /100 | #249 | Tragic $43,844 |
| Alaska Natives | 2.3 /100 | #250 | Tragic $43,750 |
| Tsimshian | 2.1 /100 | #251 | Tragic $43,695 |
| Hawaiians | 2.0 /100 | #252 | Tragic $43,673 |
Immigrants from Burma/Myanmar Median Earnings Correlation Summary
| Measurement | Immigrants from Burma/Myanmar Data | Median Earnings Data |
| Minimum | 0.038% | $27,898 |
| Maximum | 17.4% | $62,054 |
| Range | 17.4% | $34,156 |
| Mean | 3.6% | $40,087 |
| Median | 2.7% | $39,569 |
| Interquartile 25% (IQ1) | 1.3% | $35,543 |
| Interquartile 75% (IQ3) | 4.3% | $44,022 |
| Interquartile Range (IQR) | 3.0% | $8,479 |
| Standard Deviation (Sample) | 3.4% | $6,933 |
| Standard Deviation (Population) | 3.4% | $6,878 |
Correlation Details
| Immigrants from Burma/Myanmar Percentile | Sample Size | Median Earnings |
[ 0.0% - 0.5% ] 0.038% | 109,818,160 | $46,319 |
[ 0.0% - 0.5% ] 0.12% | 28,045,145 | $48,432 |
[ 0.0% - 0.5% ] 0.22% | 10,635,484 | $45,832 |
[ 0.0% - 0.5% ] 0.30% | 4,446,590 | $47,368 |
[ 0.0% - 0.5% ] 0.38% | 3,397,342 | $55,360 |
[ 0.0% - 0.5% ] 0.48% | 2,425,227 | $41,434 |
[ 0.5% - 1.0% ] 0.58% | 2,461,502 | $39,569 |
[ 0.5% - 1.0% ] 0.65% | 1,513,851 | $47,784 |
[ 0.5% - 1.0% ] 0.73% | 1,356,368 | $50,176 |
[ 0.5% - 1.0% ] 0.84% | 1,123,551 | $49,257 |
[ 0.5% - 1.0% ] 0.92% | 636,007 | $41,944 |
[ 1.0% - 1.5% ] 1.00% | 594,101 | $43,127 |
[ 1.0% - 1.5% ] 1.08% | 1,357,765 | $40,858 |
[ 1.0% - 1.5% ] 1.17% | 423,092 | $42,631 |
[ 1.0% - 1.5% ] 1.26% | 438,016 | $38,965 |
[ 1.0% - 1.5% ] 1.34% | 223,860 | $41,813 |
[ 1.0% - 1.5% ] 1.43% | 406,228 | $44,022 |
[ 1.5% - 2.0% ] 1.51% | 310,391 | $40,593 |
[ 1.5% - 2.0% ] 1.63% | 391,878 | $36,656 |
[ 1.5% - 2.0% ] 1.69% | 182,155 | $37,438 |
[ 1.5% - 2.0% ] 1.79% | 185,148 | $42,678 |
[ 1.5% - 2.0% ] 1.86% | 432,147 | $38,896 |
[ 1.5% - 2.0% ] 1.97% | 19,626 | $37,145 |
[ 2.0% - 2.5% ] 2.06% | 256,522 | $45,577 |
[ 2.0% - 2.5% ] 2.13% | 35,419 | $33,743 |
[ 2.0% - 2.5% ] 2.22% | 55,094 | $38,749 |
[ 2.0% - 2.5% ] 2.29% | 12,866 | $37,187 |
[ 2.0% - 2.5% ] 2.37% | 52,234 | $38,052 |
[ 2.0% - 2.5% ] 2.48% | 133,569 | $37,799 |
[ 2.5% - 3.0% ] 2.55% | 126,252 | $32,571 |
[ 2.5% - 3.0% ] 2.63% | 48,939 | $39,294 |
[ 2.5% - 3.0% ] 2.74% | 85,513 | $45,771 |
[ 2.5% - 3.0% ] 2.81% | 35,349 | $35,814 |
[ 2.5% - 3.0% ] 2.89% | 1,143 | $27,898 |
[ 3.0% - 3.5% ] 3.03% | 24,684 | $29,114 |
[ 3.0% - 3.5% ] 3.10% | 94,089 | $34,526 |
[ 3.0% - 3.5% ] 3.19% | 24,971 | $54,332 |
[ 3.0% - 3.5% ] 3.27% | 33,912 | $43,110 |
[ 3.0% - 3.5% ] 3.34% | 15,556 | $36,270 |
[ 3.0% - 3.5% ] 3.47% | 57,936 | $41,714 |
[ 3.5% - 4.0% ] 3.53% | 12,010 | $42,454 |
[ 3.5% - 4.0% ] 3.65% | 3,126 | $41,346 |
[ 3.5% - 4.0% ] 3.70% | 23,980 | $34,135 |
[ 3.5% - 4.0% ] 3.81% | 57,662 | $35,543 |
[ 3.5% - 4.0% ] 3.88% | 15,899 | $36,507 |
[ 4.0% - 4.5% ] 4.12% | 25,699 | $29,561 |
[ 4.0% - 4.5% ] 4.21% | 23,879 | $50,749 |
[ 4.0% - 4.5% ] 4.31% | 81,015 | $31,387 |
[ 4.0% - 4.5% ] 4.36% | 2,039 | $62,054 |
[ 4.0% - 4.5% ] 4.48% | 2,029 | $40,264 |
[ 4.5% - 5.0% ] 4.69% | 14,553 | $28,201 |
[ 5.0% - 5.5% ] 5.11% | 5,268 | $32,798 |
[ 5.0% - 5.5% ] 5.33% | 37,834 | $35,836 |
[ 6.0% - 6.5% ] 6.45% | 19,501 | $31,980 |
[ 6.5% - 7.0% ] 6.88% | 19,613 | $33,624 |
[ 7.5% - 8.0% ] 7.81% | 39,082 | $47,273 |
[ 7.5% - 8.0% ] 7.92% | 56,794 | $34,157 |
[ 8.5% - 9.0% ] 8.70% | 1,035 | $42,115 |
[ 9.5% - 10.0% ] 9.95% | 382 | $47,014 |
[ 11.0% - 11.5% ] 11.17% | 403 | $28,563 |
[ 12.0% - 12.5% ] 12.20% | 738 | $36,250 |
[ 12.5% - 13.0% ] 12.78% | 266 | $33,929 |
[ 17.0% - 17.5% ] 17.43% | 2,088 | $39,904 |