Immigrants from Burma/Myanmar 4 or more Vehicles in Household
COMPARE
Immigrants from Burma/Myanmar
Select to Compare
4 or more Vehicles in Household
Immigrants from Burma/Myanmar 4 or more Vehicles in Household
6.2%
4+ VEHICLES AVAILABLE
37.5/ 100
METRIC RATING
183rd/ 347
METRIC RANK
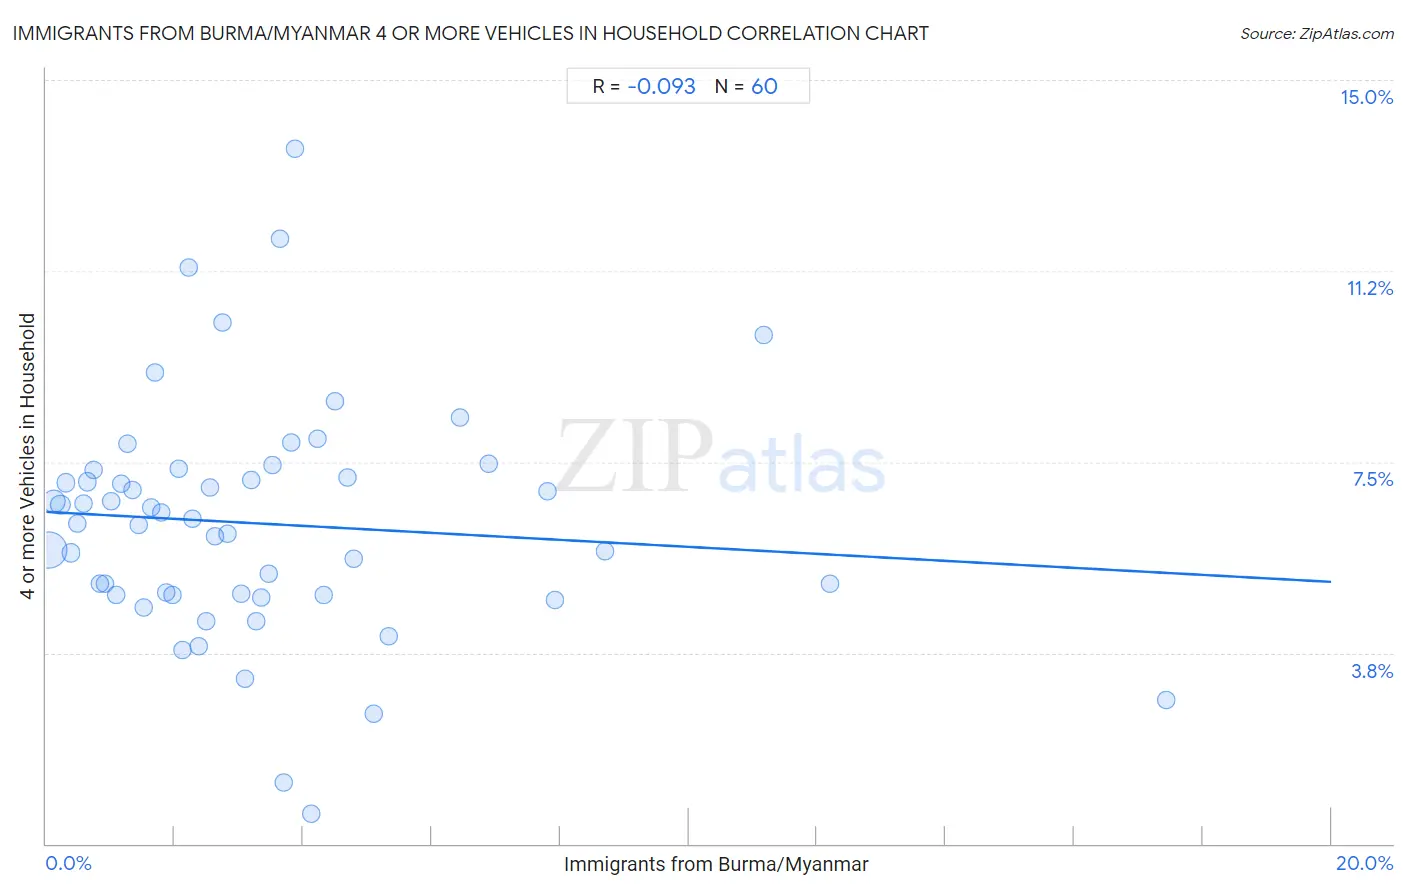
Immigrants from Burma/Myanmar 4 or more Vehicles in Household Correlation Chart
The statistical analysis conducted on geographies consisting of 171,874,303 people shows a slight negative correlation between the proportion of Immigrants from Burma/Myanmar and percentage of households with 4 or more vehicles available in the United States with a correlation coefficient (R) of -0.093 and weighted average of 6.2%. On average, for every 1% (one percent) increase in Immigrants from Burma/Myanmar within a typical geography, there is a decrease of 0.069% in percentage of households with 4 or more vehicles available.
It is essential to understand that the correlation between the percentage of Immigrants from Burma/Myanmar and percentage of households with 4 or more vehicles available does not imply a direct cause-and-effect relationship. It remains uncertain whether the presence of Immigrants from Burma/Myanmar influences an upward or downward trend in the level of percentage of households with 4 or more vehicles available within an area, or if Immigrants from Burma/Myanmar simply ended up residing in those areas with higher or lower levels of percentage of households with 4 or more vehicles available due to other factors.
Demographics Similar to Immigrants from Burma/Myanmar by 4 or more Vehicles in Household
In terms of 4 or more vehicles in household, the demographic groups most similar to Immigrants from Burma/Myanmar are Iraqi (6.2%, a difference of 0.020%), Thai (6.2%, a difference of 0.060%), Immigrants from Northern Europe (6.2%, a difference of 0.080%), Immigrants from South Africa (6.2%, a difference of 0.23%), and Kiowa (6.2%, a difference of 0.31%).
| Demographics | Rating | Rank | 4 or more Vehicles in Household |
| Ukrainians | 47.6 /100 | #176 | Average 6.3% |
| Slovaks | 46.9 /100 | #177 | Average 6.3% |
| Belizeans | 44.5 /100 | #178 | Average 6.3% |
| Immigrants from Japan | 43.1 /100 | #179 | Average 6.3% |
| Syrians | 42.0 /100 | #180 | Average 6.3% |
| Yugoslavians | 41.1 /100 | #181 | Average 6.3% |
| South American Indians | 40.7 /100 | #182 | Average 6.3% |
| Immigrants from Burma/Myanmar | 37.5 /100 | #183 | Fair 6.2% |
| Iraqis | 37.3 /100 | #184 | Fair 6.2% |
| Thais | 36.9 /100 | #185 | Fair 6.2% |
| Immigrants from Northern Europe | 36.8 /100 | #186 | Fair 6.2% |
| Immigrants from South Africa | 35.4 /100 | #187 | Fair 6.2% |
| Kiowa | 34.7 /100 | #188 | Fair 6.2% |
| Immigrants from Eastern Asia | 33.3 /100 | #189 | Fair 6.2% |
| South Africans | 32.2 /100 | #190 | Fair 6.2% |
Immigrants from Burma/Myanmar 4 or more Vehicles in Household Correlation Summary
| Measurement | Immigrants from Burma/Myanmar Data | 4 or more Vehicles in Household Data |
| Minimum | 0.038% | 0.59% |
| Maximum | 17.4% | 13.7% |
| Range | 17.4% | 13.1% |
| Mean | 3.3% | 6.3% |
| Median | 2.6% | 6.3% |
| Interquartile 25% (IQ1) | 1.3% | 4.9% |
| Interquartile 75% (IQ3) | 4.2% | 7.3% |
| Interquartile Range (IQR) | 2.9% | 2.4% |
| Standard Deviation (Sample) | 3.2% | 2.3% |
| Standard Deviation (Population) | 3.1% | 2.3% |
Correlation Details
| Immigrants from Burma/Myanmar Percentile | Sample Size | 4 or more Vehicles in Household |
[ 0.0% - 0.5% ] 0.038% | 109,607,645 | 5.8% |
[ 0.0% - 0.5% ] 0.12% | 27,975,767 | 6.7% |
[ 0.0% - 0.5% ] 0.22% | 10,588,578 | 6.7% |
[ 0.0% - 0.5% ] 0.30% | 4,363,109 | 7.1% |
[ 0.0% - 0.5% ] 0.38% | 3,395,169 | 5.7% |
[ 0.0% - 0.5% ] 0.48% | 2,375,682 | 6.3% |
[ 0.5% - 1.0% ] 0.58% | 2,458,006 | 6.7% |
[ 0.5% - 1.0% ] 0.65% | 1,513,851 | 7.1% |
[ 0.5% - 1.0% ] 0.73% | 1,356,368 | 7.3% |
[ 0.5% - 1.0% ] 0.84% | 1,123,551 | 5.1% |
[ 0.5% - 1.0% ] 0.92% | 636,007 | 5.1% |
[ 1.0% - 1.5% ] 1.00% | 592,676 | 6.7% |
[ 1.0% - 1.5% ] 1.08% | 1,357,765 | 4.9% |
[ 1.0% - 1.5% ] 1.17% | 419,756 | 7.1% |
[ 1.0% - 1.5% ] 1.26% | 438,016 | 7.8% |
[ 1.0% - 1.5% ] 1.34% | 221,300 | 7.0% |
[ 1.0% - 1.5% ] 1.43% | 403,554 | 6.3% |
[ 1.5% - 2.0% ] 1.51% | 310,391 | 4.6% |
[ 1.5% - 2.0% ] 1.63% | 391,878 | 6.6% |
[ 1.5% - 2.0% ] 1.69% | 182,155 | 9.3% |
[ 1.5% - 2.0% ] 1.79% | 181,526 | 6.5% |
[ 1.5% - 2.0% ] 1.86% | 432,147 | 4.9% |
[ 1.5% - 2.0% ] 1.97% | 19,626 | 4.9% |
[ 2.0% - 2.5% ] 2.06% | 256,522 | 7.4% |
[ 2.0% - 2.5% ] 2.13% | 35,419 | 3.8% |
[ 2.0% - 2.5% ] 2.22% | 53,324 | 11.3% |
[ 2.0% - 2.5% ] 2.29% | 12,866 | 6.4% |
[ 2.0% - 2.5% ] 2.37% | 51,767 | 3.9% |
[ 2.0% - 2.5% ] 2.48% | 133,569 | 4.4% |
[ 2.5% - 3.0% ] 2.55% | 126,252 | 7.0% |
[ 2.5% - 3.0% ] 2.63% | 48,939 | 6.0% |
[ 2.5% - 3.0% ] 2.74% | 85,513 | 10.2% |
[ 2.5% - 3.0% ] 2.81% | 33,467 | 6.1% |
[ 3.0% - 3.5% ] 3.03% | 24,684 | 4.9% |
[ 3.0% - 3.5% ] 3.10% | 94,089 | 3.2% |
[ 3.0% - 3.5% ] 3.19% | 24,971 | 7.2% |
[ 3.0% - 3.5% ] 3.27% | 31,976 | 4.4% |
[ 3.0% - 3.5% ] 3.35% | 13,421 | 4.8% |
[ 3.0% - 3.5% ] 3.47% | 58,574 | 5.3% |
[ 3.5% - 4.0% ] 3.53% | 12,010 | 7.4% |
[ 3.5% - 4.0% ] 3.65% | 3,126 | 11.9% |
[ 3.5% - 4.0% ] 3.70% | 23,980 | 1.2% |
[ 3.5% - 4.0% ] 3.81% | 57,662 | 7.9% |
[ 3.5% - 4.0% ] 3.88% | 15,899 | 13.7% |
[ 4.0% - 4.5% ] 4.12% | 25,699 | 0.59% |
[ 4.0% - 4.5% ] 4.21% | 23,879 | 7.9% |
[ 4.0% - 4.5% ] 4.31% | 81,015 | 4.9% |
[ 4.0% - 4.5% ] 4.48% | 2,029 | 8.7% |
[ 4.5% - 5.0% ] 4.69% | 14,553 | 7.2% |
[ 4.5% - 5.0% ] 4.78% | 2,219 | 5.6% |
[ 5.0% - 5.5% ] 5.11% | 5,268 | 2.6% |
[ 5.0% - 5.5% ] 5.33% | 37,834 | 4.1% |
[ 6.0% - 6.5% ] 6.45% | 19,501 | 8.4% |
[ 6.5% - 7.0% ] 6.88% | 19,613 | 7.5% |
[ 7.5% - 8.0% ] 7.81% | 39,082 | 6.9% |
[ 7.5% - 8.0% ] 7.92% | 56,794 | 4.8% |
[ 8.5% - 9.0% ] 8.70% | 1,035 | 5.8% |
[ 11.0% - 11.5% ] 11.17% | 403 | 10.0% |
[ 12.0% - 12.5% ] 12.20% | 738 | 5.1% |
[ 17.0% - 17.5% ] 17.43% | 2,088 | 2.8% |