Immigrants from Burma/Myanmar vs Macedonian 3 or more Vehicles in Household
COMPARE
Immigrants from Burma/Myanmar
Macedonian
3 or more Vehicles in Household
3 or more Vehicles in Household Comparison
Immigrants from Burma/Myanmar
Macedonians
18.8%
3 OR MORE VEHICLES IN HOUSEHOLD
13.6/ 100
METRIC RATING
208th/ 347
METRIC RANK
17.7%
3 OR MORE VEHICLES IN HOUSEHOLD
0.8/ 100
METRIC RATING
266th/ 347
METRIC RANK
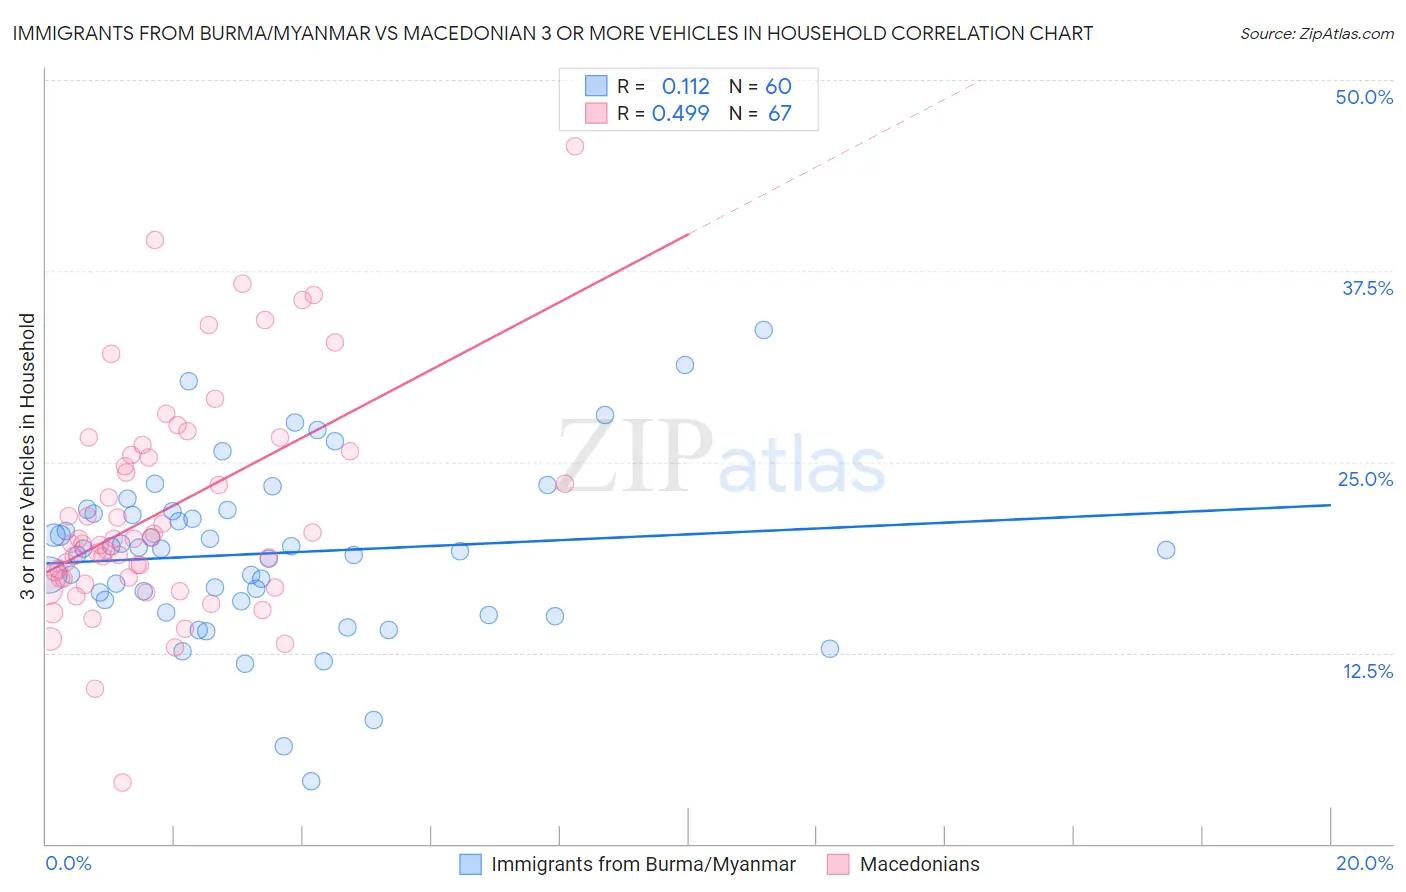
Immigrants from Burma/Myanmar vs Macedonian 3 or more Vehicles in Household Correlation Chart
The statistical analysis conducted on geographies consisting of 172,233,426 people shows a poor positive correlation between the proportion of Immigrants from Burma/Myanmar and percentage of households with 3 or more vehicles available in the United States with a correlation coefficient (R) of 0.112 and weighted average of 18.8%. Similarly, the statistical analysis conducted on geographies consisting of 132,563,114 people shows a moderate positive correlation between the proportion of Macedonians and percentage of households with 3 or more vehicles available in the United States with a correlation coefficient (R) of 0.499 and weighted average of 17.7%, a difference of 6.2%.
3 or more Vehicles in Household Correlation Summary
| Measurement | Immigrants from Burma/Myanmar | Macedonian |
| Minimum | 4.1% | 4.0% |
| Maximum | 33.6% | 45.7% |
| Range | 29.5% | 41.6% |
| Mean | 19.0% | 21.8% |
| Median | 19.3% | 19.9% |
| Interquartile 25% (IQ1) | 15.9% | 17.3% |
| Interquartile 75% (IQ3) | 21.7% | 25.7% |
| Interquartile Range (IQR) | 5.8% | 8.4% |
| Standard Deviation (Sample) | 5.6% | 7.4% |
| Standard Deviation (Population) | 5.5% | 7.3% |
Similar Demographics by 3 or more Vehicles in Household
Demographics Similar to Immigrants from Burma/Myanmar by 3 or more Vehicles in Household
In terms of 3 or more vehicles in household, the demographic groups most similar to Immigrants from Burma/Myanmar are Immigrants from Chile (18.8%, a difference of 0.010%), Immigrants from Egypt (18.8%, a difference of 0.010%), Immigrants from Eastern Asia (18.8%, a difference of 0.090%), Bulgarian (18.8%, a difference of 0.090%), and Russian (18.8%, a difference of 0.10%).
| Demographics | Rating | Rank | 3 or more Vehicles in Household |
| Arabs | 17.7 /100 | #201 | Poor 18.9% |
| Immigrants | Austria | 15.4 /100 | #202 | Poor 18.9% |
| Tohono O'odham | 14.8 /100 | #203 | Poor 18.9% |
| Immigrants | Romania | 14.6 /100 | #204 | Poor 18.9% |
| Russians | 14.2 /100 | #205 | Poor 18.8% |
| Immigrants | Eastern Asia | 14.1 /100 | #206 | Poor 18.8% |
| Immigrants | Chile | 13.6 /100 | #207 | Poor 18.8% |
| Immigrants | Burma/Myanmar | 13.6 /100 | #208 | Poor 18.8% |
| Immigrants | Egypt | 13.5 /100 | #209 | Poor 18.8% |
| Bulgarians | 13.1 /100 | #210 | Poor 18.8% |
| Immigrants | Kenya | 12.4 /100 | #211 | Poor 18.8% |
| Panamanians | 11.6 /100 | #212 | Poor 18.8% |
| Immigrants | Cuba | 11.6 /100 | #213 | Poor 18.8% |
| Immigrants | Sierra Leone | 10.8 /100 | #214 | Poor 18.7% |
| Eastern Europeans | 10.6 /100 | #215 | Poor 18.7% |
Demographics Similar to Macedonians by 3 or more Vehicles in Household
In terms of 3 or more vehicles in household, the demographic groups most similar to Macedonians are Immigrants from Panama (17.7%, a difference of 0.020%), Immigrants from Venezuela (17.7%, a difference of 0.050%), Immigrants from Bulgaria (17.7%, a difference of 0.070%), Cambodian (17.8%, a difference of 0.16%), and Bermudan (17.8%, a difference of 0.19%).
| Demographics | Rating | Rank | 3 or more Vehicles in Household |
| Uruguayans | 1.0 /100 | #259 | Tragic 17.8% |
| Ugandans | 0.9 /100 | #260 | Tragic 17.8% |
| Immigrants | Northern Africa | 0.9 /100 | #261 | Tragic 17.8% |
| Colombians | 0.9 /100 | #262 | Tragic 17.8% |
| Bermudans | 0.9 /100 | #263 | Tragic 17.8% |
| Cambodians | 0.9 /100 | #264 | Tragic 17.8% |
| Immigrants | Panama | 0.8 /100 | #265 | Tragic 17.7% |
| Macedonians | 0.8 /100 | #266 | Tragic 17.7% |
| Immigrants | Venezuela | 0.8 /100 | #267 | Tragic 17.7% |
| Immigrants | Bulgaria | 0.8 /100 | #268 | Tragic 17.7% |
| Immigrants | France | 0.6 /100 | #269 | Tragic 17.6% |
| Immigrants | Nepal | 0.6 /100 | #270 | Tragic 17.6% |
| South Americans | 0.6 /100 | #271 | Tragic 17.6% |
| Immigrants | Africa | 0.5 /100 | #272 | Tragic 17.6% |
| Immigrants | Sudan | 0.5 /100 | #273 | Tragic 17.6% |