Immigrants from Burma/Myanmar Family Poverty
COMPARE
Immigrants from Burma/Myanmar
Select to Compare
Family Poverty
Immigrants from Burma/Myanmar Family Poverty
10.5%
POVERTY | FAMILIES
0.6/ 100
METRIC RATING
245th/ 347
METRIC RANK
Immigrants from Burma/Myanmar Family Poverty Correlation Chart
The statistical analysis conducted on geographies consisting of 172,175,970 people shows a poor positive correlation between the proportion of Immigrants from Burma/Myanmar and poverty level among families in the United States with a correlation coefficient (R) of 0.187 and weighted average of 10.5%. On average, for every 1% (one percent) increase in Immigrants from Burma/Myanmar within a typical geography, there is an increase of 0.37% in poverty level among families.
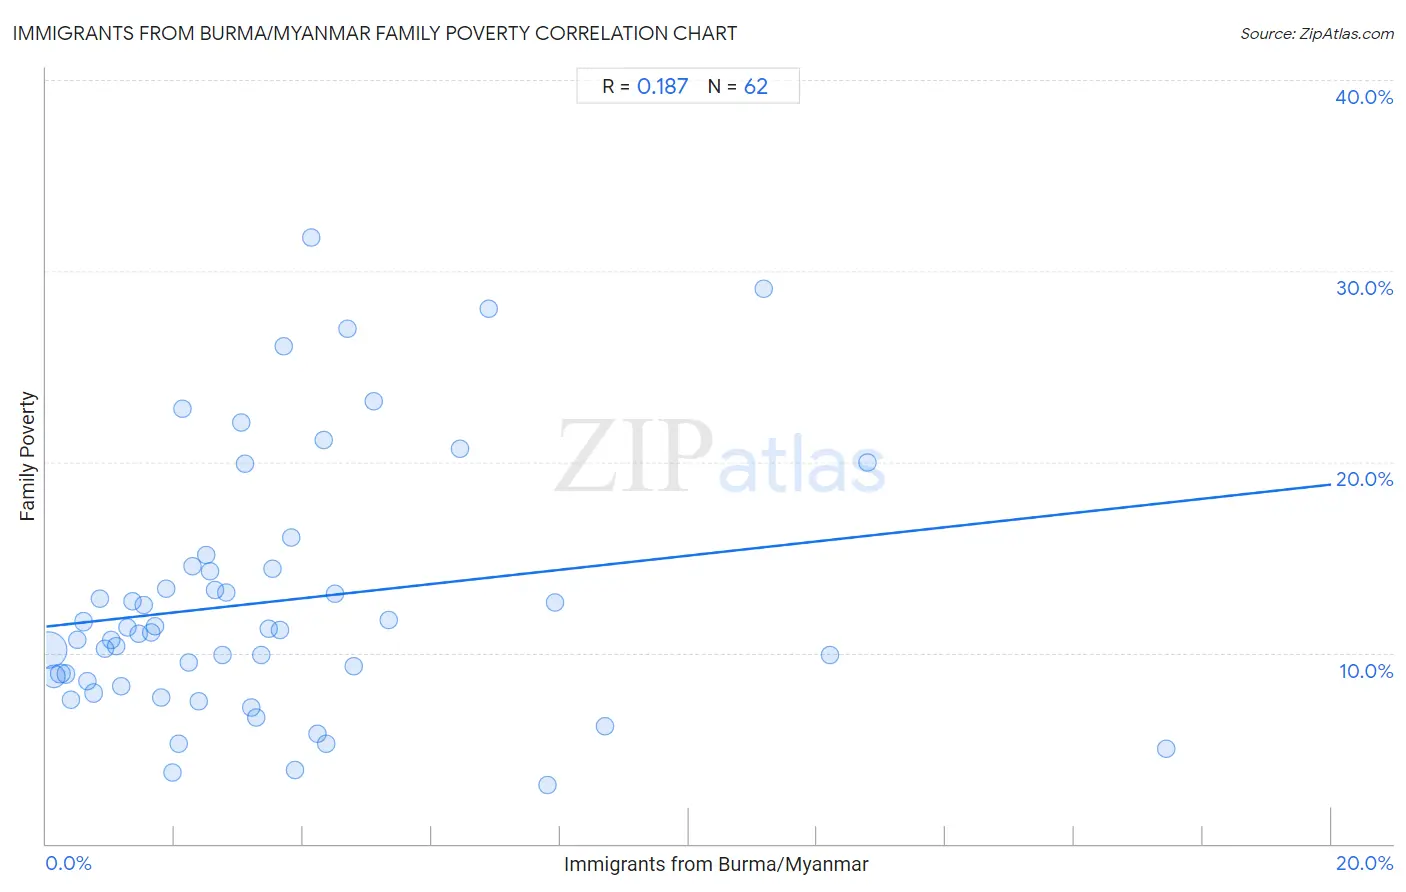
It is essential to understand that the correlation between the percentage of Immigrants from Burma/Myanmar and poverty level among families does not imply a direct cause-and-effect relationship. It remains uncertain whether the presence of Immigrants from Burma/Myanmar influences an upward or downward trend in the level of poverty level among families within an area, or if Immigrants from Burma/Myanmar simply ended up residing in those areas with higher or lower levels of poverty level among families due to other factors.
Demographics Similar to Immigrants from Burma/Myanmar by Family Poverty
In terms of family poverty, the demographic groups most similar to Immigrants from Burma/Myanmar are Cree (10.5%, a difference of 0.61%), Cherokee (10.6%, a difference of 0.64%), Liberian (10.6%, a difference of 0.73%), Nicaraguan (10.6%, a difference of 0.93%), and Cuban (10.6%, a difference of 0.98%).
| Demographics | Rating | Rank | Family Poverty |
| French American Indians | 1.5 /100 | #238 | Tragic 10.2% |
| Potawatomi | 1.5 /100 | #239 | Tragic 10.2% |
| Immigrants from the Azores | 1.4 /100 | #240 | Tragic 10.3% |
| Ghanaians | 1.3 /100 | #241 | Tragic 10.3% |
| Alaska Natives | 1.0 /100 | #242 | Tragic 10.4% |
| Nepalese | 0.8 /100 | #243 | Tragic 10.4% |
| Cree | 0.7 /100 | #244 | Tragic 10.5% |
| Immigrants from Burma/Myanmar | 0.6 /100 | #245 | Tragic 10.5% |
| Cherokee | 0.5 /100 | #246 | Tragic 10.6% |
| Liberians | 0.4 /100 | #247 | Tragic 10.6% |
| Nicaraguans | 0.4 /100 | #248 | Tragic 10.6% |
| Cubans | 0.4 /100 | #249 | Tragic 10.6% |
| Salvadorans | 0.3 /100 | #250 | Tragic 10.7% |
| Iroquois | 0.3 /100 | #251 | Tragic 10.7% |
| Immigrants from Zaire | 0.3 /100 | #252 | Tragic 10.7% |
Immigrants from Burma/Myanmar Family Poverty Correlation Summary
| Measurement | Immigrants from Burma/Myanmar Data | Family Poverty Data |
| Minimum | 0.038% | 3.0% |
| Maximum | 17.4% | 31.7% |
| Range | 17.4% | 28.7% |
| Mean | 3.5% | 12.7% |
| Median | 2.7% | 11.1% |
| Interquartile 25% (IQ1) | 1.3% | 8.5% |
| Interquartile 75% (IQ3) | 4.3% | 14.4% |
| Interquartile Range (IQR) | 3.0% | 5.8% |
| Standard Deviation (Sample) | 3.3% | 6.6% |
| Standard Deviation (Population) | 3.3% | 6.6% |
Correlation Details
| Immigrants from Burma/Myanmar Percentile | Sample Size | Family Poverty |
[ 0.0% - 0.5% ] 0.038% | 109,818,160 | 10.2% |
[ 0.0% - 0.5% ] 0.12% | 28,004,564 | 8.8% |
[ 0.0% - 0.5% ] 0.22% | 10,597,451 | 8.9% |
[ 0.0% - 0.5% ] 0.30% | 4,414,227 | 8.9% |
[ 0.0% - 0.5% ] 0.38% | 3,381,985 | 7.5% |
[ 0.0% - 0.5% ] 0.48% | 2,389,634 | 10.7% |
[ 0.5% - 1.0% ] 0.58% | 2,453,752 | 11.6% |
[ 0.5% - 1.0% ] 0.65% | 1,513,851 | 8.5% |
[ 0.5% - 1.0% ] 0.73% | 1,356,110 | 7.9% |
[ 0.5% - 1.0% ] 0.84% | 1,121,864 | 12.8% |
[ 0.5% - 1.0% ] 0.92% | 635,789 | 10.2% |
[ 1.0% - 1.5% ] 1.00% | 592,676 | 10.7% |
[ 1.0% - 1.5% ] 1.08% | 1,357,028 | 10.4% |
[ 1.0% - 1.5% ] 1.17% | 419,756 | 8.2% |
[ 1.0% - 1.5% ] 1.26% | 438,016 | 11.4% |
[ 1.0% - 1.5% ] 1.34% | 223,860 | 12.7% |
[ 1.0% - 1.5% ] 1.43% | 406,228 | 11.0% |
[ 1.5% - 2.0% ] 1.51% | 310,391 | 12.5% |
[ 1.5% - 2.0% ] 1.63% | 392,187 | 11.0% |
[ 1.5% - 2.0% ] 1.69% | 178,707 | 11.4% |
[ 1.5% - 2.0% ] 1.79% | 185,148 | 7.6% |
[ 1.5% - 2.0% ] 1.86% | 432,147 | 13.4% |
[ 1.5% - 2.0% ] 1.97% | 19,626 | 3.7% |
[ 2.0% - 2.5% ] 2.06% | 256,522 | 5.2% |
[ 2.0% - 2.5% ] 2.13% | 35,419 | 22.8% |
[ 2.0% - 2.5% ] 2.22% | 55,094 | 9.5% |
[ 2.0% - 2.5% ] 2.29% | 12,866 | 14.5% |
[ 2.0% - 2.5% ] 2.37% | 51,767 | 7.5% |
[ 2.0% - 2.5% ] 2.48% | 133,569 | 15.2% |
[ 2.5% - 3.0% ] 2.55% | 126,252 | 14.3% |
[ 2.5% - 3.0% ] 2.63% | 48,939 | 13.3% |
[ 2.5% - 3.0% ] 2.74% | 85,513 | 9.9% |
[ 2.5% - 3.0% ] 2.81% | 32,704 | 13.1% |
[ 3.0% - 3.5% ] 3.03% | 24,684 | 22.1% |
[ 3.0% - 3.5% ] 3.10% | 94,089 | 19.9% |
[ 3.0% - 3.5% ] 3.19% | 24,971 | 7.2% |
[ 3.0% - 3.5% ] 3.27% | 33,912 | 6.6% |
[ 3.0% - 3.5% ] 3.34% | 15,556 | 9.9% |
[ 3.0% - 3.5% ] 3.47% | 58,574 | 11.2% |
[ 3.5% - 4.0% ] 3.52% | 7,660 | 14.4% |
[ 3.5% - 4.0% ] 3.65% | 3,126 | 11.2% |
[ 3.5% - 4.0% ] 3.70% | 23,980 | 26.1% |
[ 3.5% - 4.0% ] 3.81% | 57,662 | 16.0% |
[ 3.5% - 4.0% ] 3.88% | 15,899 | 3.9% |
[ 4.0% - 4.5% ] 4.12% | 25,699 | 31.7% |
[ 4.0% - 4.5% ] 4.21% | 23,879 | 5.8% |
[ 4.0% - 4.5% ] 4.31% | 81,015 | 21.1% |
[ 4.0% - 4.5% ] 4.36% | 2,039 | 5.3% |
[ 4.0% - 4.5% ] 4.48% | 2,029 | 13.1% |
[ 4.5% - 5.0% ] 4.69% | 14,553 | 27.0% |
[ 4.5% - 5.0% ] 4.78% | 2,219 | 9.3% |
[ 5.0% - 5.5% ] 5.11% | 5,268 | 23.1% |
[ 5.0% - 5.5% ] 5.33% | 37,834 | 11.7% |
[ 6.0% - 6.5% ] 6.45% | 19,501 | 20.7% |
[ 6.5% - 7.0% ] 6.88% | 19,613 | 28.0% |
[ 7.5% - 8.0% ] 7.81% | 39,082 | 3.0% |
[ 7.5% - 8.0% ] 7.92% | 56,794 | 12.6% |
[ 8.5% - 9.0% ] 8.70% | 1,035 | 6.1% |
[ 11.0% - 11.5% ] 11.17% | 403 | 29.1% |
[ 12.0% - 12.5% ] 12.20% | 738 | 9.9% |
[ 12.5% - 13.0% ] 12.78% | 266 | 20.0% |
[ 17.0% - 17.5% ] 17.43% | 2,088 | 4.9% |