French vs Immigrants from Syria 3 or more Vehicles in Household
COMPARE
French
Immigrants from Syria
3 or more Vehicles in Household
3 or more Vehicles in Household Comparison
French
Immigrants from Syria
21.4%
3 OR MORE VEHICLES IN HOUSEHOLD
99.4/ 100
METRIC RATING
88th/ 347
METRIC RANK
19.4%
3 OR MORE VEHICLES IN HOUSEHOLD
40.3/ 100
METRIC RATING
178th/ 347
METRIC RANK
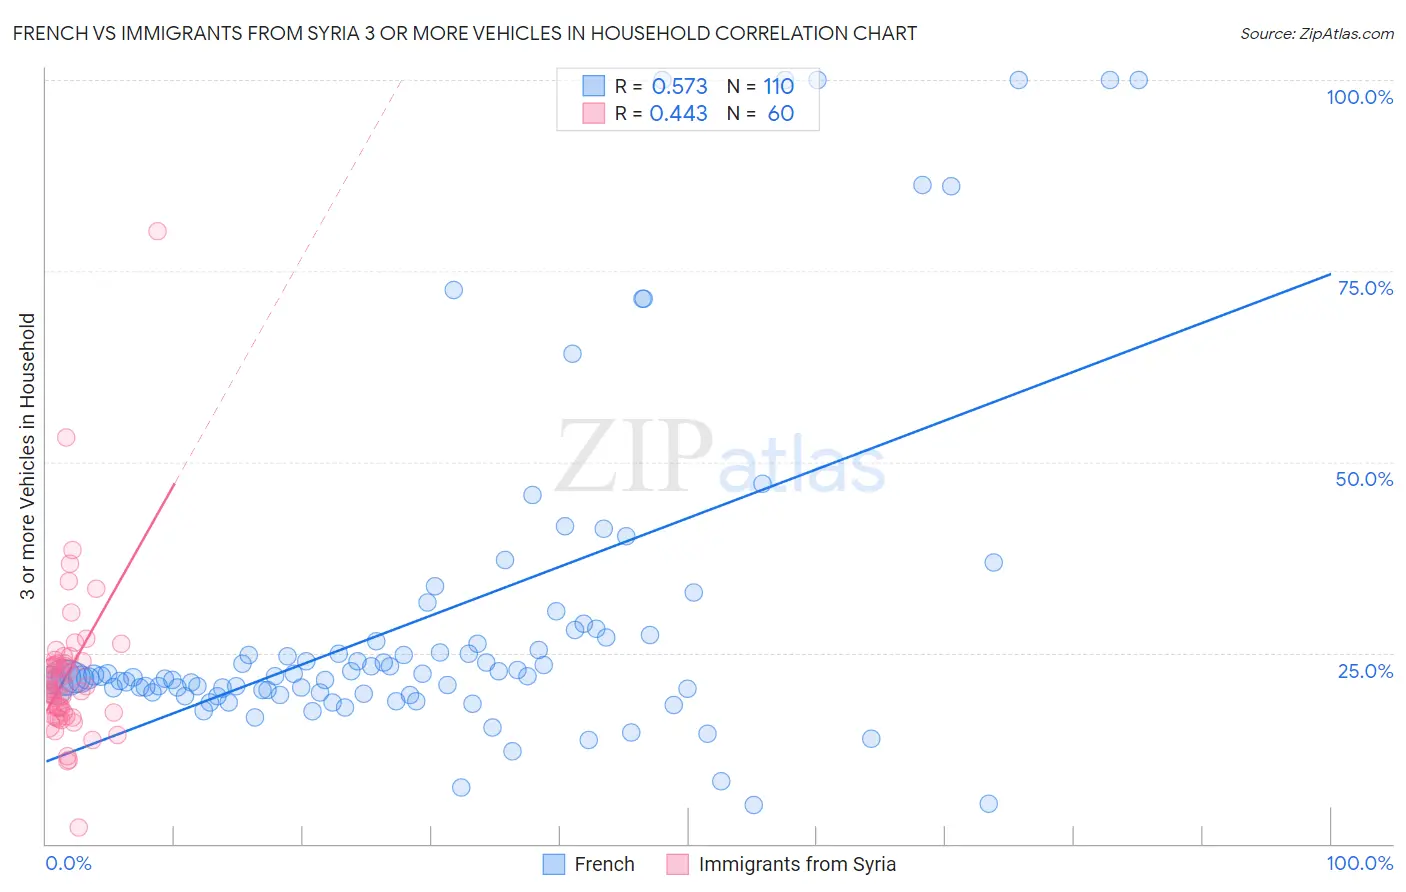
French vs Immigrants from Syria 3 or more Vehicles in Household Correlation Chart
The statistical analysis conducted on geographies consisting of 571,506,399 people shows a substantial positive correlation between the proportion of French and percentage of households with 3 or more vehicles available in the United States with a correlation coefficient (R) of 0.573 and weighted average of 21.4%. Similarly, the statistical analysis conducted on geographies consisting of 174,111,368 people shows a moderate positive correlation between the proportion of Immigrants from Syria and percentage of households with 3 or more vehicles available in the United States with a correlation coefficient (R) of 0.443 and weighted average of 19.4%, a difference of 10.6%.
3 or more Vehicles in Household Correlation Summary
| Measurement | French | Immigrants from Syria |
| Minimum | 5.1% | 2.1% |
| Maximum | 100.0% | 80.2% |
| Range | 94.9% | 78.1% |
| Mean | 29.6% | 22.3% |
| Median | 21.9% | 20.3% |
| Interquartile 25% (IQ1) | 19.8% | 17.0% |
| Interquartile 75% (IQ3) | 27.1% | 23.7% |
| Interquartile Range (IQR) | 7.3% | 6.7% |
| Standard Deviation (Sample) | 22.0% | 10.6% |
| Standard Deviation (Population) | 21.9% | 10.5% |
Similar Demographics by 3 or more Vehicles in Household
Demographics Similar to French by 3 or more Vehicles in Household
In terms of 3 or more vehicles in household, the demographic groups most similar to French are Immigrants from the Azores (21.5%, a difference of 0.26%), Delaware (21.5%, a difference of 0.38%), Laotian (21.5%, a difference of 0.46%), Icelander (21.5%, a difference of 0.47%), and Chippewa (21.5%, a difference of 0.53%).
| Demographics | Rating | Rank | 3 or more Vehicles in Household |
| Celtics | 99.7 /100 | #81 | Exceptional 21.7% |
| Immigrants | El Salvador | 99.6 /100 | #82 | Exceptional 21.5% |
| Chippewa | 99.6 /100 | #83 | Exceptional 21.5% |
| Icelanders | 99.6 /100 | #84 | Exceptional 21.5% |
| Laotians | 99.6 /100 | #85 | Exceptional 21.5% |
| Delaware | 99.6 /100 | #86 | Exceptional 21.5% |
| Immigrants | Azores | 99.5 /100 | #87 | Exceptional 21.5% |
| French | 99.4 /100 | #88 | Exceptional 21.4% |
| Marshallese | 99.2 /100 | #89 | Exceptional 21.3% |
| Immigrants | Afghanistan | 99.1 /100 | #90 | Exceptional 21.2% |
| Belgians | 98.9 /100 | #91 | Exceptional 21.2% |
| Apache | 98.9 /100 | #92 | Exceptional 21.2% |
| Immigrants | Indonesia | 98.8 /100 | #93 | Exceptional 21.1% |
| Immigrants | Cambodia | 98.6 /100 | #94 | Exceptional 21.1% |
| Pakistanis | 98.5 /100 | #95 | Exceptional 21.0% |
Demographics Similar to Immigrants from Syria by 3 or more Vehicles in Household
In terms of 3 or more vehicles in household, the demographic groups most similar to Immigrants from Syria are Immigrants from Peru (19.4%, a difference of 0.070%), Immigrants from South Central Asia (19.3%, a difference of 0.11%), South African (19.3%, a difference of 0.22%), Romanian (19.3%, a difference of 0.25%), and Cuban (19.3%, a difference of 0.30%).
| Demographics | Rating | Rank | 3 or more Vehicles in Household |
| Immigrants | Western Europe | 53.2 /100 | #171 | Average 19.5% |
| Kiowa | 50.9 /100 | #172 | Average 19.5% |
| Immigrants | Northern Europe | 50.2 /100 | #173 | Average 19.5% |
| Immigrants | South Africa | 50.0 /100 | #174 | Average 19.5% |
| Syrians | 47.0 /100 | #175 | Average 19.5% |
| Iroquois | 46.0 /100 | #176 | Average 19.4% |
| Immigrants | Peru | 41.1 /100 | #177 | Average 19.4% |
| Immigrants | Syria | 40.3 /100 | #178 | Average 19.4% |
| Immigrants | South Central Asia | 38.9 /100 | #179 | Fair 19.3% |
| South Africans | 37.5 /100 | #180 | Fair 19.3% |
| Romanians | 37.1 /100 | #181 | Fair 19.3% |
| Cubans | 36.6 /100 | #182 | Fair 19.3% |
| Cajuns | 36.0 /100 | #183 | Fair 19.3% |
| Latvians | 35.7 /100 | #184 | Fair 19.3% |
| Immigrants | Sri Lanka | 30.7 /100 | #185 | Fair 19.2% |