French Self-Care Disability
COMPARE
French
Select to Compare
Self-Care Disability
French Self-Care Disability
2.5%
SELF-CARE DISABILITY
9.9/ 100
METRIC RATING
207th/ 347
METRIC RANK
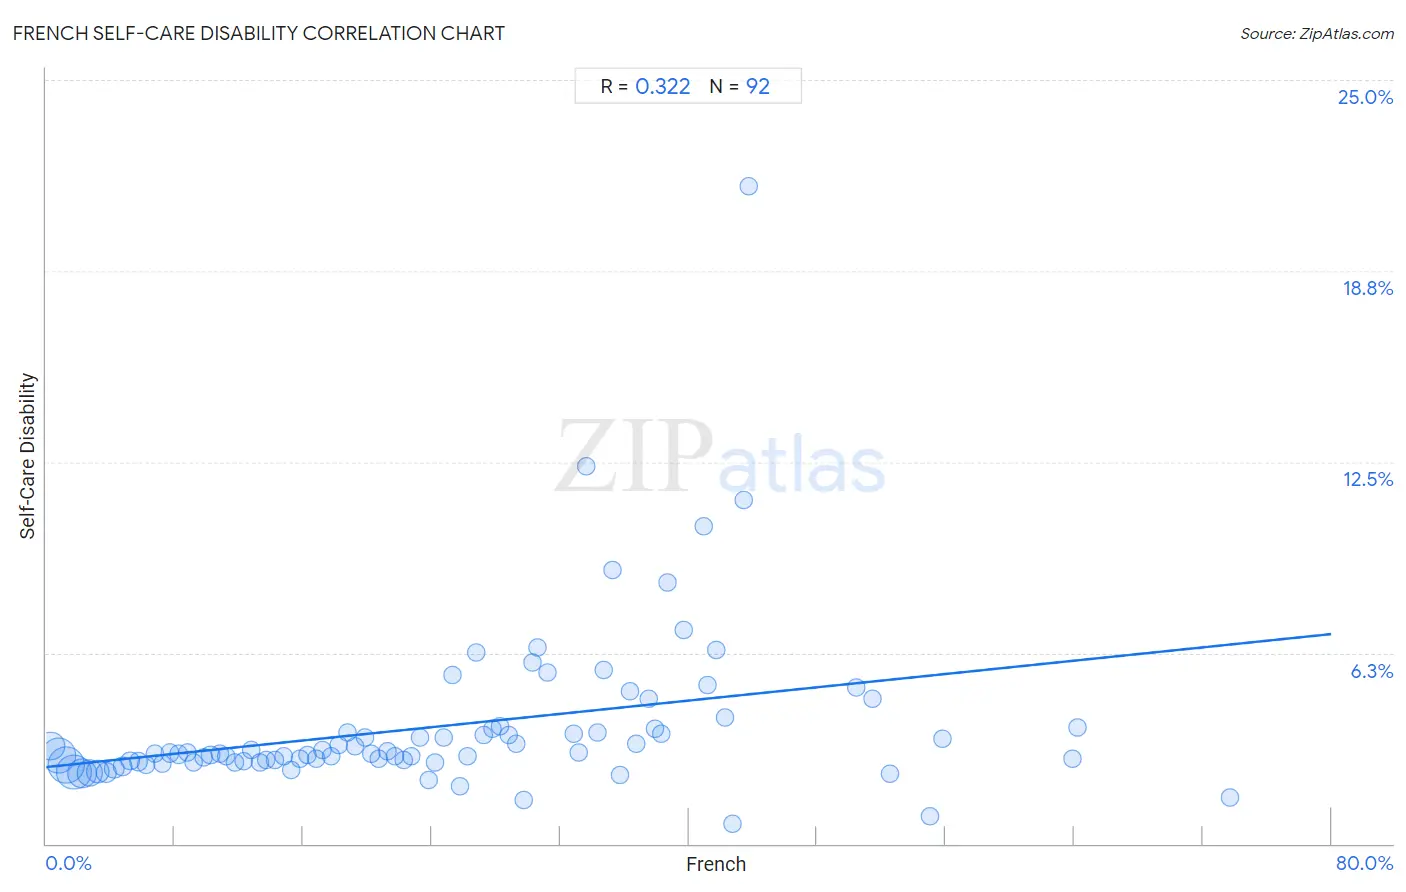
French Self-Care Disability Correlation Chart
The statistical analysis conducted on geographies consisting of 570,049,309 people shows a mild positive correlation between the proportion of French and percentage of population with self-care disability in the United States with a correlation coefficient (R) of 0.322 and weighted average of 2.5%. On average, for every 1% (one percent) increase in French within a typical geography, there is an increase of 0.054% in percentage of population with self-care disability.
It is essential to understand that the correlation between the percentage of French and percentage of population with self-care disability does not imply a direct cause-and-effect relationship. It remains uncertain whether the presence of French influences an upward or downward trend in the level of percentage of population with self-care disability within an area, or if French simply ended up residing in those areas with higher or lower levels of percentage of population with self-care disability due to other factors.
Demographics Similar to French by Self-Care Disability
In terms of self-care disability, the demographic groups most similar to French are Alaskan Athabascan (2.5%, a difference of 0.060%), Immigrants from Russia (2.5%, a difference of 0.14%), Central American (2.5%, a difference of 0.16%), Immigrants from Bahamas (2.5%, a difference of 0.25%), and Immigrants from Lebanon (2.5%, a difference of 0.30%).
| Demographics | Rating | Rank | Self-Care Disability |
| Immigrants from Western Africa | 13.3 /100 | #200 | Poor 2.5% |
| Immigrants from South Eastern Asia | 12.9 /100 | #201 | Poor 2.5% |
| Slovaks | 12.6 /100 | #202 | Poor 2.5% |
| Immigrants from Lebanon | 12.4 /100 | #203 | Poor 2.5% |
| Immigrants from Bahamas | 11.9 /100 | #204 | Poor 2.5% |
| Immigrants from Russia | 11.0 /100 | #205 | Poor 2.5% |
| Alaskan Athabascans | 10.4 /100 | #206 | Poor 2.5% |
| French | 9.9 /100 | #207 | Tragic 2.5% |
| Central Americans | 8.7 /100 | #208 | Tragic 2.5% |
| Malaysians | 7.7 /100 | #209 | Tragic 2.5% |
| Panamanians | 6.4 /100 | #210 | Tragic 2.5% |
| Native Hawaiians | 5.1 /100 | #211 | Tragic 2.6% |
| Samoans | 5.1 /100 | #212 | Tragic 2.6% |
| Ecuadorians | 4.7 /100 | #213 | Tragic 2.6% |
| Immigrants from Honduras | 4.7 /100 | #214 | Tragic 2.6% |
French Self-Care Disability Correlation Summary
| Measurement | French Data | Self-Care Disability Data |
| Minimum | 0.26% | 0.65% |
| Maximum | 73.7% | 21.5% |
| Range | 73.5% | 20.9% |
| Mean | 24.6% | 3.8% |
| Median | 23.0% | 2.9% |
| Interquartile 25% (IQ1) | 11.5% | 2.7% |
| Interquartile 75% (IQ3) | 35.5% | 3.8% |
| Interquartile Range (IQR) | 24.0% | 1.1% |
| Standard Deviation (Sample) | 16.2% | 2.7% |
| Standard Deviation (Population) | 16.1% | 2.7% |
Correlation Details
| French Percentile | Sample Size | Self-Care Disability |
[ 0.0% - 0.5% ] 0.26% | 61,395,470 | 3.2% |
[ 0.5% - 1.0% ] 0.77% | 96,744,239 | 2.9% |
[ 1.0% - 1.5% ] 1.25% | 110,711,154 | 2.6% |
[ 1.5% - 2.0% ] 1.74% | 101,204,407 | 2.4% |
[ 2.0% - 2.5% ] 2.24% | 71,351,653 | 2.3% |
[ 2.5% - 3.0% ] 2.72% | 46,609,651 | 2.3% |
[ 3.0% - 3.5% ] 3.22% | 25,952,420 | 2.4% |
[ 3.5% - 4.0% ] 3.72% | 14,563,757 | 2.4% |
[ 4.0% - 4.5% ] 4.24% | 8,728,342 | 2.5% |
[ 4.5% - 5.0% ] 4.75% | 5,687,618 | 2.5% |
[ 5.0% - 5.5% ] 5.23% | 4,634,373 | 2.7% |
[ 5.5% - 6.0% ] 5.74% | 2,772,396 | 2.7% |
[ 6.0% - 6.5% ] 6.23% | 1,717,491 | 2.6% |
[ 6.5% - 7.0% ] 6.75% | 1,699,433 | 2.9% |
[ 7.0% - 7.5% ] 7.25% | 1,289,674 | 2.6% |
[ 7.5% - 8.0% ] 7.72% | 1,252,922 | 3.0% |
[ 8.0% - 8.5% ] 8.23% | 1,244,013 | 2.9% |
[ 8.5% - 9.0% ] 8.76% | 1,033,913 | 3.0% |
[ 9.0% - 9.5% ] 9.21% | 1,094,958 | 2.7% |
[ 9.5% - 10.0% ] 9.78% | 1,011,866 | 2.8% |
[ 10.0% - 10.5% ] 10.23% | 715,193 | 2.9% |
[ 10.5% - 11.0% ] 10.80% | 1,114,402 | 2.9% |
[ 11.0% - 11.5% ] 11.24% | 440,919 | 2.9% |
[ 11.5% - 12.0% ] 11.75% | 416,660 | 2.6% |
[ 12.0% - 12.5% ] 12.26% | 613,932 | 2.7% |
[ 12.5% - 13.0% ] 12.77% | 589,676 | 3.1% |
[ 13.0% - 13.5% ] 13.28% | 676,876 | 2.7% |
[ 13.5% - 14.0% ] 13.71% | 490,377 | 2.7% |
[ 14.0% - 14.5% ] 14.24% | 572,130 | 2.7% |
[ 14.5% - 15.0% ] 14.76% | 337,312 | 2.9% |
[ 15.0% - 15.5% ] 15.27% | 455,408 | 2.4% |
[ 15.5% - 16.0% ] 15.79% | 320,168 | 2.8% |
[ 16.0% - 16.5% ] 16.24% | 474,319 | 2.9% |
[ 16.5% - 17.0% ] 16.81% | 335,844 | 2.8% |
[ 17.0% - 17.5% ] 17.24% | 169,346 | 3.1% |
[ 17.5% - 18.0% ] 17.78% | 290,722 | 2.9% |
[ 18.0% - 18.5% ] 18.20% | 176,356 | 3.2% |
[ 18.5% - 19.0% ] 18.76% | 59,984 | 3.6% |
[ 19.0% - 19.5% ] 19.25% | 81,992 | 3.2% |
[ 19.5% - 20.0% ] 19.81% | 148,682 | 3.5% |
[ 20.0% - 20.5% ] 20.23% | 55,976 | 3.0% |
[ 20.5% - 21.0% ] 20.73% | 135,922 | 2.8% |
[ 21.0% - 21.5% ] 21.27% | 81,081 | 3.0% |
[ 21.5% - 22.0% ] 21.68% | 71,746 | 2.9% |
[ 22.0% - 22.5% ] 22.28% | 61,881 | 2.7% |
[ 22.5% - 23.0% ] 22.76% | 58,973 | 2.9% |
[ 23.0% - 23.5% ] 23.25% | 89,186 | 3.5% |
[ 23.5% - 24.0% ] 23.78% | 47,246 | 2.1% |
[ 24.0% - 24.5% ] 24.22% | 30,366 | 2.7% |
[ 24.5% - 25.0% ] 24.74% | 19,263 | 3.5% |
[ 25.0% - 25.5% ] 25.30% | 15,611 | 5.5% |
[ 25.5% - 26.0% ] 25.73% | 7,323 | 1.9% |
[ 26.0% - 26.5% ] 26.25% | 20,692 | 2.9% |
[ 26.5% - 27.0% ] 26.78% | 6,109 | 6.2% |
[ 27.0% - 27.5% ] 27.25% | 28,482 | 3.6% |
[ 27.5% - 28.0% ] 27.79% | 20,491 | 3.8% |
[ 28.0% - 28.5% ] 28.28% | 16,133 | 3.9% |
[ 28.5% - 29.0% ] 28.81% | 7,200 | 3.5% |
[ 29.0% - 29.5% ] 29.28% | 20,003 | 3.3% |
[ 29.5% - 30.0% ] 29.72% | 8,487 | 1.4% |
[ 30.0% - 30.5% ] 30.29% | 2,222 | 5.9% |
[ 30.5% - 31.0% ] 30.59% | 5,416 | 6.4% |
[ 31.0% - 31.5% ] 31.23% | 7,809 | 5.6% |
[ 32.5% - 33.0% ] 32.86% | 3,947 | 3.6% |
[ 33.0% - 33.5% ] 33.16% | 3,534 | 3.0% |
[ 33.5% - 34.0% ] 33.64% | 327 | 12.4% |
[ 34.0% - 34.5% ] 34.29% | 1,782 | 3.6% |
[ 34.5% - 35.0% ] 34.69% | 8,236 | 5.7% |
[ 35.0% - 35.5% ] 35.27% | 1,656 | 9.0% |
[ 35.5% - 36.0% ] 35.69% | 650 | 2.2% |
[ 36.0% - 36.5% ] 36.31% | 2,702 | 5.0% |
[ 36.5% - 37.0% ] 36.70% | 4,741 | 3.3% |
[ 37.0% - 37.5% ] 37.48% | 3,685 | 4.7% |
[ 37.5% - 38.0% ] 37.87% | 375 | 3.8% |
[ 38.0% - 38.5% ] 38.29% | 5,370 | 3.6% |
[ 38.5% - 39.0% ] 38.69% | 2,724 | 8.5% |
[ 39.5% - 40.0% ] 39.67% | 1,346 | 7.0% |
[ 40.5% - 41.0% ] 40.91% | 154 | 10.4% |
[ 41.0% - 41.5% ] 41.14% | 1,524 | 5.2% |
[ 41.5% - 42.0% ] 41.72% | 731 | 6.4% |
[ 42.0% - 42.5% ] 42.23% | 959 | 4.1% |
[ 42.5% - 43.0% ] 42.72% | 1,271 | 0.65% |
[ 43.0% - 43.5% ] 43.41% | 949 | 11.3% |
[ 43.5% - 44.0% ] 43.71% | 151 | 21.5% |
[ 50.0% - 50.5% ] 50.39% | 1,153 | 5.1% |
[ 51.0% - 51.5% ] 51.42% | 1,474 | 4.7% |
[ 52.5% - 53.0% ] 52.51% | 219 | 2.3% |
[ 55.0% - 55.5% ] 55.05% | 218 | 0.92% |
[ 55.5% - 56.0% ] 55.80% | 1,353 | 3.4% |
[ 63.5% - 64.0% ] 63.89% | 180 | 2.8% |
[ 64.0% - 64.5% ] 64.21% | 95 | 3.8% |
[ 73.5% - 74.0% ] 73.72% | 137 | 1.5% |