French Disability Age 5 to 17
COMPARE
French
Select to Compare
Disability Age 5 to 17
French Disability Age 5 to 17
6.4%
DISABILITY | AGE 5 TO 17
0.0/ 100
METRIC RATING
314th/ 347
METRIC RANK
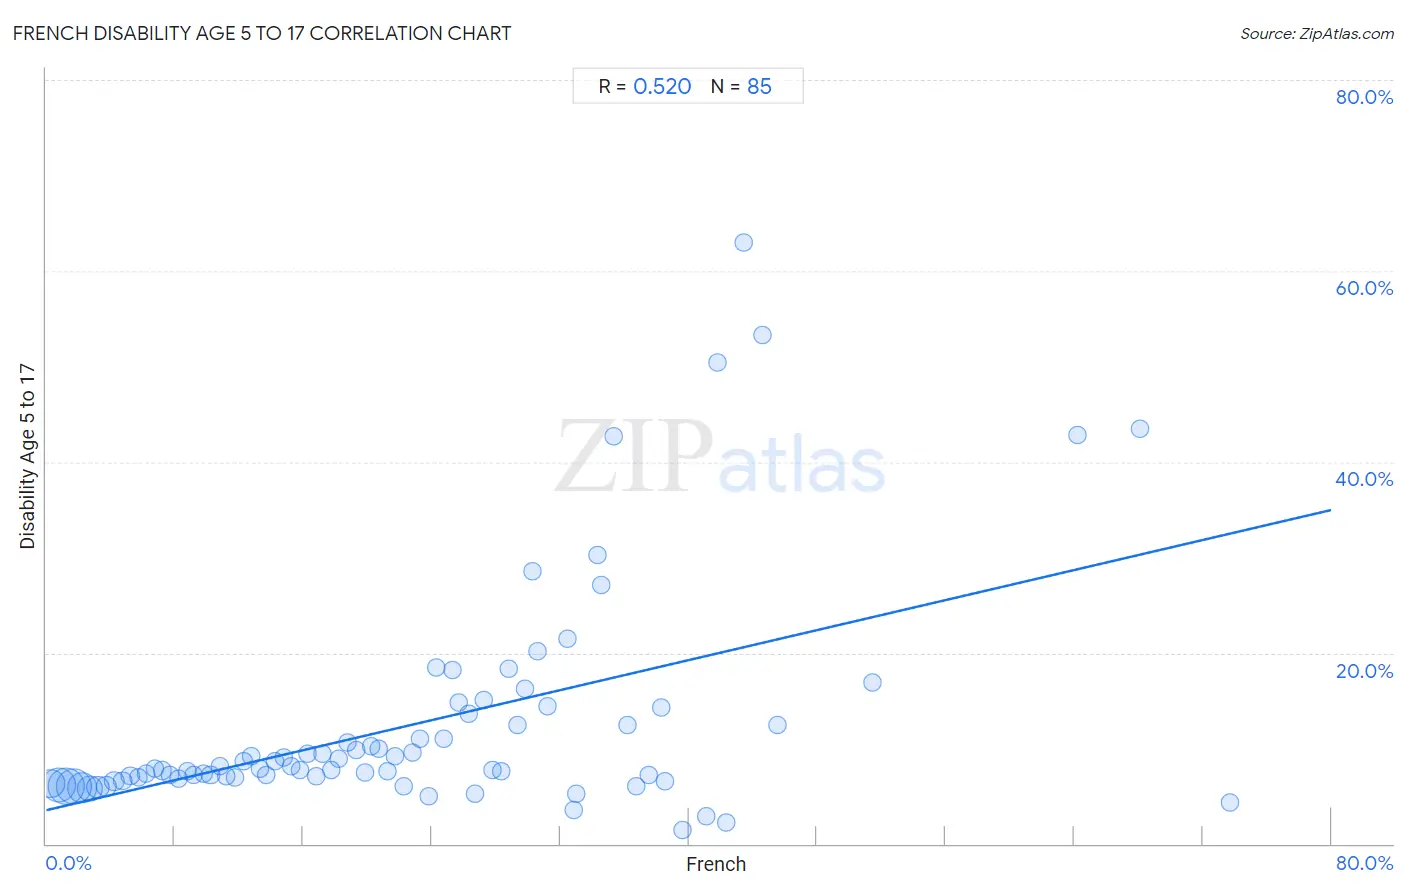
French Disability Age 5 to 17 Correlation Chart
The statistical analysis conducted on geographies consisting of 558,470,754 people shows a substantial positive correlation between the proportion of French and percentage of population with a disability between the ages 5 and 17 in the United States with a correlation coefficient (R) of 0.520 and weighted average of 6.4%. On average, for every 1% (one percent) increase in French within a typical geography, there is an increase of 0.39% in percentage of population with a disability between the ages 5 and 17.
It is essential to understand that the correlation between the percentage of French and percentage of population with a disability between the ages 5 and 17 does not imply a direct cause-and-effect relationship. It remains uncertain whether the presence of French influences an upward or downward trend in the level of percentage of population with a disability between the ages 5 and 17 within an area, or if French simply ended up residing in those areas with higher or lower levels of percentage of population with a disability between the ages 5 and 17 due to other factors.
Demographics Similar to French by Disability Age 5 to 17
In terms of disability age 5 to 17, the demographic groups most similar to French are Immigrants from Portugal (6.4%, a difference of 0.18%), Immigrants from Dominican Republic (6.4%, a difference of 0.36%), Kiowa (6.4%, a difference of 0.48%), Apache (6.4%, a difference of 0.51%), and Comanche (6.4%, a difference of 0.51%).
| Demographics | Rating | Rank | Disability Age 5 to 17 |
| Bahamians | 0.0 /100 | #307 | Tragic 6.3% |
| Scotch-Irish | 0.0 /100 | #308 | Tragic 6.3% |
| Hmong | 0.0 /100 | #309 | Tragic 6.3% |
| Alaskan Athabascans | 0.0 /100 | #310 | Tragic 6.3% |
| Immigrants from Dominica | 0.0 /100 | #311 | Tragic 6.3% |
| Bermudans | 0.0 /100 | #312 | Tragic 6.4% |
| Apache | 0.0 /100 | #313 | Tragic 6.4% |
| French | 0.0 /100 | #314 | Tragic 6.4% |
| Immigrants from Portugal | 0.0 /100 | #315 | Tragic 6.4% |
| Immigrants from Dominican Republic | 0.0 /100 | #316 | Tragic 6.4% |
| Kiowa | 0.0 /100 | #317 | Tragic 6.4% |
| Comanche | 0.0 /100 | #318 | Tragic 6.4% |
| Delaware | 0.0 /100 | #319 | Tragic 6.5% |
| Africans | 0.0 /100 | #320 | Tragic 6.5% |
| Tohono O'odham | 0.0 /100 | #321 | Tragic 6.5% |
French Disability Age 5 to 17 Correlation Summary
| Measurement | French Data | Disability Age 5 to 17 Data |
| Minimum | 0.26% | 1.4% |
| Maximum | 73.7% | 62.9% |
| Range | 73.5% | 61.5% |
| Mean | 22.8% | 12.5% |
| Median | 21.3% | 7.9% |
| Interquartile 25% (IQ1) | 10.5% | 6.7% |
| Interquartile 75% (IQ3) | 32.7% | 13.0% |
| Interquartile Range (IQR) | 22.1% | 6.3% |
| Standard Deviation (Sample) | 15.5% | 11.7% |
| Standard Deviation (Population) | 15.4% | 11.6% |
Correlation Details
| French Percentile | Sample Size | Disability Age 5 to 17 |
[ 0.0% - 0.5% ] 0.26% | 60,132,107 | 6.3% |
[ 0.5% - 1.0% ] 0.77% | 95,142,235 | 6.2% |
[ 1.0% - 1.5% ] 1.25% | 109,259,127 | 6.0% |
[ 1.5% - 2.0% ] 1.74% | 99,902,521 | 6.0% |
[ 2.0% - 2.5% ] 2.24% | 70,216,905 | 5.9% |
[ 2.5% - 3.0% ] 2.72% | 45,586,551 | 5.8% |
[ 3.0% - 3.5% ] 3.22% | 25,264,231 | 5.9% |
[ 3.5% - 4.0% ] 3.72% | 13,957,982 | 6.0% |
[ 4.0% - 4.5% ] 4.24% | 8,187,479 | 6.6% |
[ 4.5% - 5.0% ] 4.75% | 5,386,859 | 6.6% |
[ 5.0% - 5.5% ] 5.23% | 4,362,793 | 7.1% |
[ 5.5% - 6.0% ] 5.74% | 2,581,133 | 7.0% |
[ 6.0% - 6.5% ] 6.23% | 1,577,939 | 7.3% |
[ 6.5% - 7.0% ] 6.75% | 1,563,183 | 7.9% |
[ 7.0% - 7.5% ] 7.26% | 1,183,163 | 7.7% |
[ 7.5% - 8.0% ] 7.71% | 1,167,894 | 7.2% |
[ 8.0% - 8.5% ] 8.23% | 1,172,826 | 6.8% |
[ 8.5% - 9.0% ] 8.76% | 946,377 | 7.6% |
[ 9.0% - 9.5% ] 9.20% | 1,040,165 | 7.3% |
[ 9.5% - 10.0% ] 9.78% | 964,824 | 7.3% |
[ 10.0% - 10.5% ] 10.23% | 682,588 | 7.2% |
[ 10.5% - 11.0% ] 10.81% | 1,071,502 | 8.2% |
[ 11.0% - 11.5% ] 11.24% | 414,067 | 7.1% |
[ 11.5% - 12.0% ] 11.75% | 399,313 | 7.0% |
[ 12.0% - 12.5% ] 12.26% | 594,503 | 8.7% |
[ 12.5% - 13.0% ] 12.77% | 579,638 | 9.2% |
[ 13.0% - 13.5% ] 13.29% | 664,810 | 7.9% |
[ 13.5% - 14.0% ] 13.70% | 480,535 | 7.2% |
[ 14.0% - 14.5% ] 14.24% | 549,663 | 8.6% |
[ 14.5% - 15.0% ] 14.77% | 323,441 | 9.0% |
[ 15.0% - 15.5% ] 15.27% | 417,824 | 8.1% |
[ 15.5% - 16.0% ] 15.79% | 303,395 | 7.7% |
[ 16.0% - 16.5% ] 16.24% | 462,058 | 9.4% |
[ 16.5% - 17.0% ] 16.81% | 318,959 | 7.0% |
[ 17.0% - 17.5% ] 17.23% | 161,317 | 9.4% |
[ 17.5% - 18.0% ] 17.78% | 269,434 | 7.8% |
[ 18.0% - 18.5% ] 18.21% | 151,974 | 8.9% |
[ 18.5% - 19.0% ] 18.75% | 54,082 | 10.6% |
[ 19.0% - 19.5% ] 19.26% | 59,609 | 9.8% |
[ 19.5% - 20.0% ] 19.81% | 148,176 | 7.4% |
[ 20.0% - 20.5% ] 20.23% | 41,932 | 10.2% |
[ 20.5% - 21.0% ] 20.73% | 131,724 | 10.0% |
[ 21.0% - 21.5% ] 21.28% | 74,623 | 7.6% |
[ 21.5% - 22.0% ] 21.68% | 65,844 | 9.2% |
[ 22.0% - 22.5% ] 22.29% | 58,576 | 6.1% |
[ 22.5% - 23.0% ] 22.77% | 59,870 | 9.6% |
[ 23.0% - 23.5% ] 23.26% | 88,100 | 11.0% |
[ 23.5% - 24.0% ] 23.78% | 45,257 | 5.0% |
[ 24.0% - 24.5% ] 24.25% | 24,070 | 18.4% |
[ 24.5% - 25.0% ] 24.75% | 13,727 | 10.9% |
[ 25.0% - 25.5% ] 25.28% | 12,832 | 18.2% |
[ 25.5% - 26.0% ] 25.68% | 5,779 | 14.9% |
[ 26.0% - 26.5% ] 26.27% | 18,849 | 13.6% |
[ 26.5% - 27.0% ] 26.67% | 3,285 | 5.3% |
[ 27.0% - 27.5% ] 27.25% | 22,374 | 15.1% |
[ 27.5% - 28.0% ] 27.80% | 16,793 | 7.7% |
[ 28.0% - 28.5% ] 28.34% | 12,175 | 7.5% |
[ 28.5% - 29.0% ] 28.80% | 7,513 | 18.4% |
[ 29.0% - 29.5% ] 29.31% | 17,232 | 12.4% |
[ 29.5% - 30.0% ] 29.77% | 4,729 | 16.2% |
[ 30.0% - 30.5% ] 30.26% | 2,247 | 28.5% |
[ 30.5% - 31.0% ] 30.58% | 4,777 | 20.2% |
[ 31.0% - 31.5% ] 31.23% | 7,627 | 14.4% |
[ 32.0% - 32.5% ] 32.45% | 265 | 21.5% |
[ 32.5% - 33.0% ] 32.86% | 2,617 | 3.6% |
[ 33.0% - 33.5% ] 33.03% | 663 | 5.2% |
[ 34.0% - 34.5% ] 34.29% | 1,782 | 30.2% |
[ 34.5% - 35.0% ] 34.57% | 1,293 | 27.2% |
[ 35.0% - 35.5% ] 35.30% | 694 | 42.7% |
[ 36.0% - 36.5% ] 36.22% | 1,546 | 12.4% |
[ 36.5% - 37.0% ] 36.76% | 3,460 | 6.0% |
[ 37.0% - 37.5% ] 37.50% | 3,523 | 7.2% |
[ 38.0% - 38.5% ] 38.27% | 4,322 | 14.3% |
[ 38.5% - 39.0% ] 38.55% | 1,170 | 6.5% |
[ 39.5% - 40.0% ] 39.57% | 374 | 1.4% |
[ 41.0% - 41.5% ] 41.11% | 1,012 | 2.9% |
[ 41.5% - 42.0% ] 41.81% | 1,038 | 50.5% |
[ 42.0% - 42.5% ] 42.33% | 626 | 2.2% |
[ 43.0% - 43.5% ] 43.41% | 949 | 62.9% |
[ 44.5% - 45.0% ] 44.59% | 222 | 53.3% |
[ 45.5% - 46.0% ] 45.54% | 303 | 12.5% |
[ 51.0% - 51.5% ] 51.42% | 1,474 | 16.9% |
[ 64.0% - 64.5% ] 64.21% | 95 | 42.9% |
[ 68.0% - 68.5% ] 68.06% | 72 | 43.5% |
[ 73.5% - 74.0% ] 73.72% | 137 | 4.3% |