French vs Immigrants from Caribbean 3 or more Vehicles in Household
COMPARE
French
Immigrants from Caribbean
3 or more Vehicles in Household
3 or more Vehicles in Household Comparison
French
Immigrants from Caribbean
21.4%
3 OR MORE VEHICLES IN HOUSEHOLD
99.4/ 100
METRIC RATING
88th/ 347
METRIC RANK
14.6%
3 OR MORE VEHICLES IN HOUSEHOLD
0.0/ 100
METRIC RATING
323rd/ 347
METRIC RANK
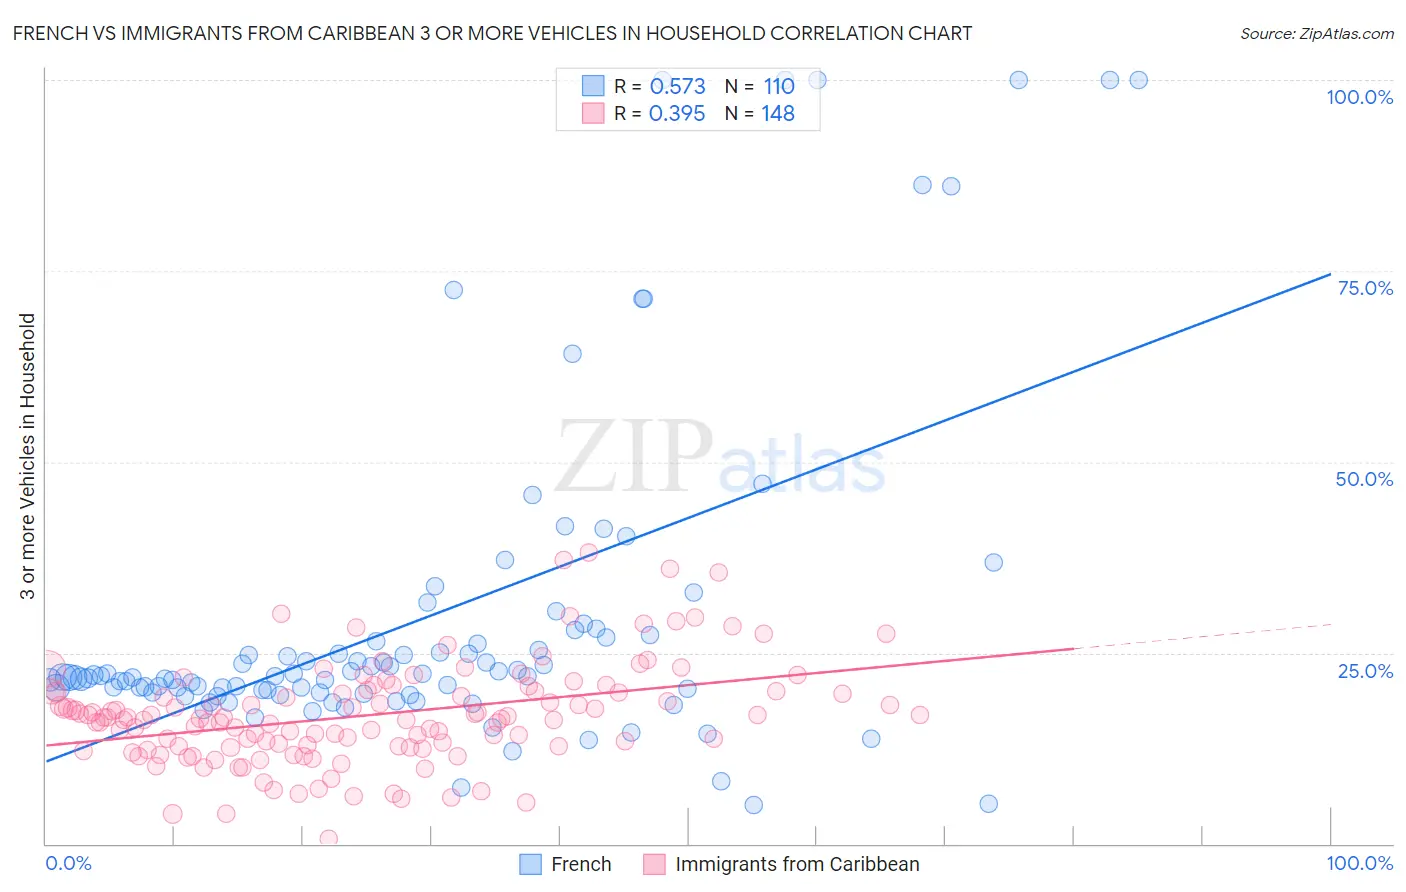
French vs Immigrants from Caribbean 3 or more Vehicles in Household Correlation Chart
The statistical analysis conducted on geographies consisting of 571,506,399 people shows a substantial positive correlation between the proportion of French and percentage of households with 3 or more vehicles available in the United States with a correlation coefficient (R) of 0.573 and weighted average of 21.4%. Similarly, the statistical analysis conducted on geographies consisting of 449,504,192 people shows a mild positive correlation between the proportion of Immigrants from Caribbean and percentage of households with 3 or more vehicles available in the United States with a correlation coefficient (R) of 0.395 and weighted average of 14.6%, a difference of 47.0%.
3 or more Vehicles in Household Correlation Summary
| Measurement | French | Immigrants from Caribbean |
| Minimum | 5.1% | 0.62% |
| Maximum | 100.0% | 38.1% |
| Range | 94.9% | 37.5% |
| Mean | 29.6% | 16.8% |
| Median | 21.9% | 16.5% |
| Interquartile 25% (IQ1) | 19.8% | 12.8% |
| Interquartile 75% (IQ3) | 27.1% | 19.9% |
| Interquartile Range (IQR) | 7.3% | 7.1% |
| Standard Deviation (Sample) | 22.0% | 6.6% |
| Standard Deviation (Population) | 21.9% | 6.5% |
Similar Demographics by 3 or more Vehicles in Household
Demographics Similar to French by 3 or more Vehicles in Household
In terms of 3 or more vehicles in household, the demographic groups most similar to French are Immigrants from the Azores (21.5%, a difference of 0.26%), Delaware (21.5%, a difference of 0.38%), Laotian (21.5%, a difference of 0.46%), Icelander (21.5%, a difference of 0.47%), and Chippewa (21.5%, a difference of 0.53%).
| Demographics | Rating | Rank | 3 or more Vehicles in Household |
| Celtics | 99.7 /100 | #81 | Exceptional 21.7% |
| Immigrants | El Salvador | 99.6 /100 | #82 | Exceptional 21.5% |
| Chippewa | 99.6 /100 | #83 | Exceptional 21.5% |
| Icelanders | 99.6 /100 | #84 | Exceptional 21.5% |
| Laotians | 99.6 /100 | #85 | Exceptional 21.5% |
| Delaware | 99.6 /100 | #86 | Exceptional 21.5% |
| Immigrants | Azores | 99.5 /100 | #87 | Exceptional 21.5% |
| French | 99.4 /100 | #88 | Exceptional 21.4% |
| Marshallese | 99.2 /100 | #89 | Exceptional 21.3% |
| Immigrants | Afghanistan | 99.1 /100 | #90 | Exceptional 21.2% |
| Belgians | 98.9 /100 | #91 | Exceptional 21.2% |
| Apache | 98.9 /100 | #92 | Exceptional 21.2% |
| Immigrants | Indonesia | 98.8 /100 | #93 | Exceptional 21.1% |
| Immigrants | Cambodia | 98.6 /100 | #94 | Exceptional 21.1% |
| Pakistanis | 98.5 /100 | #95 | Exceptional 21.0% |
Demographics Similar to Immigrants from Caribbean by 3 or more Vehicles in Household
In terms of 3 or more vehicles in household, the demographic groups most similar to Immigrants from Caribbean are Immigrants from West Indies (14.6%, a difference of 0.44%), Immigrants from Jamaica (14.7%, a difference of 0.75%), Yup'ik (14.8%, a difference of 1.9%), Immigrants from Yemen (14.2%, a difference of 2.3%), and Senegalese (14.2%, a difference of 2.4%).
| Demographics | Rating | Rank | 3 or more Vehicles in Household |
| U.S. Virgin Islanders | 0.0 /100 | #316 | Tragic 15.4% |
| Jamaicans | 0.0 /100 | #317 | Tragic 15.2% |
| Immigrants | Haiti | 0.0 /100 | #318 | Tragic 15.2% |
| Cape Verdeans | 0.0 /100 | #319 | Tragic 15.0% |
| Yup'ik | 0.0 /100 | #320 | Tragic 14.8% |
| Immigrants | Jamaica | 0.0 /100 | #321 | Tragic 14.7% |
| Immigrants | West Indies | 0.0 /100 | #322 | Tragic 14.6% |
| Immigrants | Caribbean | 0.0 /100 | #323 | Tragic 14.6% |
| Immigrants | Yemen | 0.0 /100 | #324 | Tragic 14.2% |
| Senegalese | 0.0 /100 | #325 | Tragic 14.2% |
| Soviet Union | 0.0 /100 | #326 | Tragic 14.2% |
| Ecuadorians | 0.0 /100 | #327 | Tragic 14.1% |
| Immigrants | Albania | 0.0 /100 | #328 | Tragic 14.0% |
| Immigrants | Senegal | 0.0 /100 | #329 | Tragic 13.8% |
| West Indians | 0.0 /100 | #330 | Tragic 13.7% |