French Female Disability
COMPARE
French
Select to Compare
Female Disability
French Female Disability
13.3%
DISABILITY | FEMALES
0.0/ 100
METRIC RATING
295th/ 347
METRIC RANK
French Female Disability Correlation Chart
The statistical analysis conducted on geographies consisting of 572,124,288 people shows a significant positive correlation between the proportion of French and percentage of females with a disability in the United States with a correlation coefficient (R) of 0.607 and weighted average of 13.3%. On average, for every 1% (one percent) increase in French within a typical geography, there is an increase of 0.43% in percentage of females with a disability.
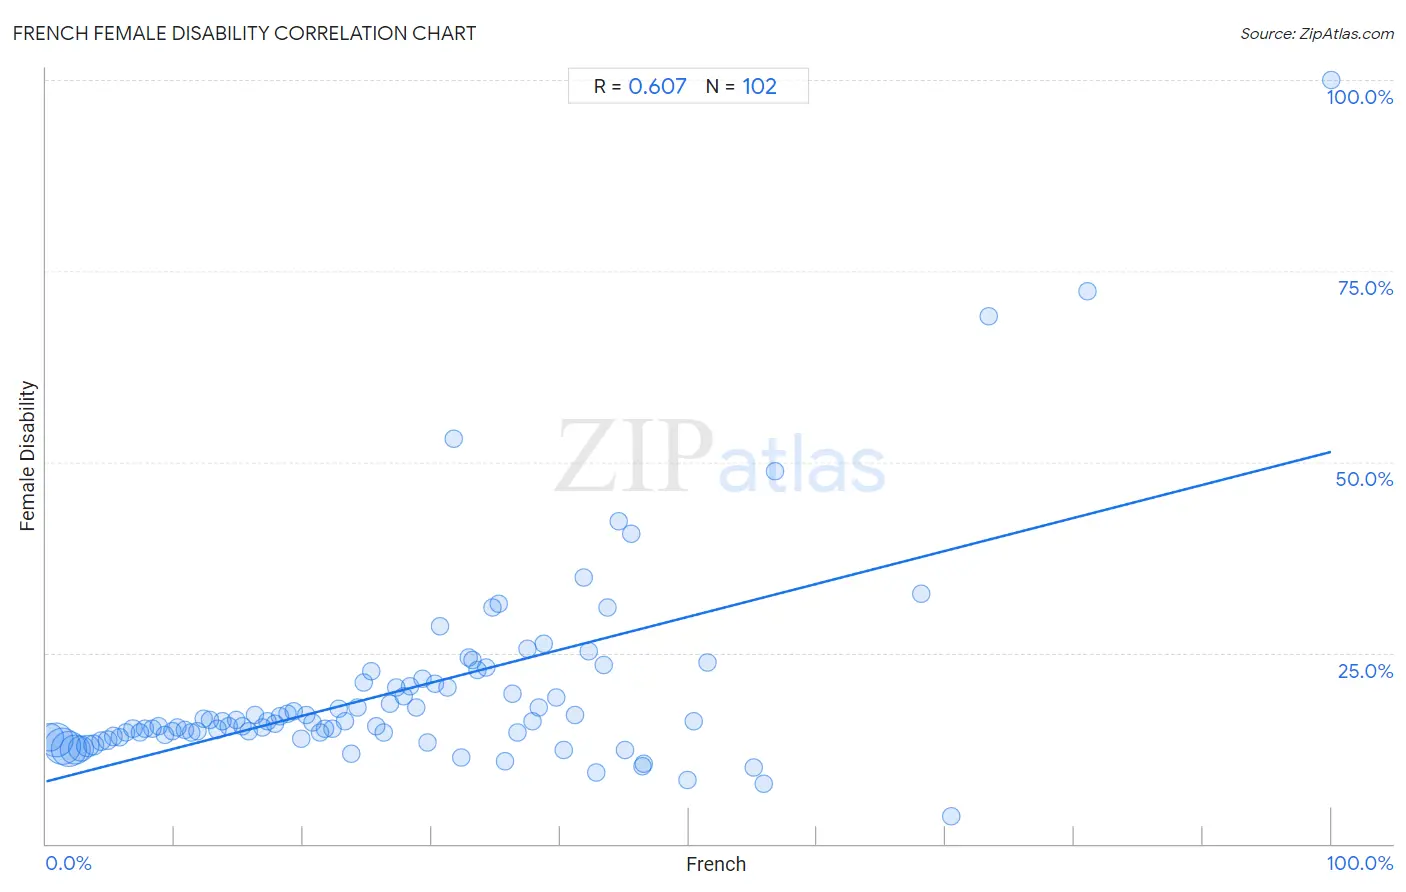
It is essential to understand that the correlation between the percentage of French and percentage of females with a disability does not imply a direct cause-and-effect relationship. It remains uncertain whether the presence of French influences an upward or downward trend in the level of percentage of females with a disability within an area, or if French simply ended up residing in those areas with higher or lower levels of percentage of females with a disability due to other factors.
Demographics Similar to French by Female Disability
In terms of female disability, the demographic groups most similar to French are Nepalese (13.3%, a difference of 0.14%), Slovak (13.3%, a difference of 0.17%), Celtic (13.3%, a difference of 0.21%), Marshallese (13.3%, a difference of 0.26%), and Nonimmigrants (13.4%, a difference of 0.47%).
| Demographics | Rating | Rank | Female Disability |
| Whites/Caucasians | 0.0 /100 | #288 | Tragic 13.2% |
| Tlingit-Haida | 0.0 /100 | #289 | Tragic 13.2% |
| Immigrants from Yemen | 0.0 /100 | #290 | Tragic 13.2% |
| Shoshone | 0.0 /100 | #291 | Tragic 13.2% |
| Yakama | 0.0 /100 | #292 | Tragic 13.2% |
| Marshallese | 0.0 /100 | #293 | Tragic 13.3% |
| Celtics | 0.0 /100 | #294 | Tragic 13.3% |
| French | 0.0 /100 | #295 | Tragic 13.3% |
| Nepalese | 0.0 /100 | #296 | Tragic 13.3% |
| Slovaks | 0.0 /100 | #297 | Tragic 13.3% |
| Nonimmigrants | 0.0 /100 | #298 | Tragic 13.4% |
| Immigrants from Dominican Republic | 0.0 /100 | #299 | Tragic 13.4% |
| Pennsylvania Germans | 0.0 /100 | #300 | Tragic 13.4% |
| Africans | 0.0 /100 | #301 | Tragic 13.4% |
| Scotch-Irish | 0.0 /100 | #302 | Tragic 13.4% |
French Female Disability Correlation Summary
| Measurement | French Data | Female Disability Data |
| Minimum | 0.26% | 3.6% |
| Maximum | 100.0% | 100.0% |
| Range | 99.7% | 96.4% |
| Mean | 27.4% | 20.0% |
| Median | 25.5% | 15.9% |
| Interquartile 25% (IQ1) | 12.8% | 14.0% |
| Interquartile 75% (IQ3) | 38.3% | 20.9% |
| Interquartile Range (IQR) | 25.5% | 6.9% |
| Standard Deviation (Sample) | 18.9% | 13.4% |
| Standard Deviation (Population) | 18.8% | 13.3% |
Correlation Details
| French Percentile | Sample Size | Female Disability |
[ 0.0% - 0.5% ] 0.26% | 61,550,090 | 13.9% |
[ 0.5% - 1.0% ] 0.77% | 97,085,177 | 13.6% |
[ 1.0% - 1.5% ] 1.25% | 110,995,932 | 12.8% |
[ 1.5% - 2.0% ] 1.74% | 101,439,250 | 12.4% |
[ 2.0% - 2.5% ] 2.24% | 71,550,536 | 12.3% |
[ 2.5% - 3.0% ] 2.72% | 46,771,550 | 12.5% |
[ 3.0% - 3.5% ] 3.22% | 26,095,298 | 12.8% |
[ 3.5% - 4.0% ] 3.72% | 14,652,368 | 13.0% |
[ 4.0% - 4.5% ] 4.24% | 8,792,681 | 13.4% |
[ 4.5% - 5.0% ] 4.75% | 5,734,889 | 13.6% |
[ 5.0% - 5.5% ] 5.23% | 4,682,181 | 14.0% |
[ 5.5% - 6.0% ] 5.74% | 2,804,962 | 14.0% |
[ 6.0% - 6.5% ] 6.23% | 1,743,474 | 14.6% |
[ 6.5% - 7.0% ] 6.75% | 1,722,227 | 15.0% |
[ 7.0% - 7.5% ] 7.26% | 1,310,062 | 14.6% |
[ 7.5% - 8.0% ] 7.72% | 1,269,319 | 15.0% |
[ 8.0% - 8.5% ] 8.23% | 1,259,783 | 15.1% |
[ 8.5% - 9.0% ] 8.76% | 1,043,737 | 15.4% |
[ 9.0% - 9.5% ] 9.21% | 1,116,448 | 14.3% |
[ 9.5% - 10.0% ] 9.78% | 1,032,460 | 14.8% |
[ 10.0% - 10.5% ] 10.23% | 721,023 | 15.3% |
[ 10.5% - 11.0% ] 10.80% | 1,126,434 | 14.9% |
[ 11.0% - 11.5% ] 11.24% | 444,296 | 14.6% |
[ 11.5% - 12.0% ] 11.75% | 424,203 | 14.7% |
[ 12.0% - 12.5% ] 12.26% | 618,020 | 16.4% |
[ 12.5% - 13.0% ] 12.76% | 596,014 | 16.2% |
[ 13.0% - 13.5% ] 13.29% | 686,036 | 15.0% |
[ 13.5% - 14.0% ] 13.71% | 497,604 | 16.1% |
[ 14.0% - 14.5% ] 14.24% | 573,838 | 15.3% |
[ 14.5% - 15.0% ] 14.76% | 346,359 | 16.2% |
[ 15.0% - 15.5% ] 15.27% | 457,507 | 15.4% |
[ 15.5% - 16.0% ] 15.79% | 323,045 | 14.8% |
[ 16.0% - 16.5% ] 16.24% | 477,568 | 16.8% |
[ 16.5% - 17.0% ] 16.80% | 339,471 | 15.3% |
[ 17.0% - 17.5% ] 17.24% | 170,956 | 16.0% |
[ 17.5% - 18.0% ] 17.78% | 291,547 | 15.7% |
[ 18.0% - 18.5% ] 18.20% | 180,802 | 16.7% |
[ 18.5% - 19.0% ] 18.76% | 61,843 | 17.1% |
[ 19.0% - 19.5% ] 19.25% | 83,072 | 17.4% |
[ 19.5% - 20.0% ] 19.81% | 153,430 | 13.7% |
[ 20.0% - 20.5% ] 20.24% | 57,742 | 16.9% |
[ 20.5% - 21.0% ] 20.73% | 138,315 | 15.9% |
[ 21.0% - 21.5% ] 21.27% | 82,527 | 14.5% |
[ 21.5% - 22.0% ] 21.69% | 72,218 | 15.1% |
[ 22.0% - 22.5% ] 22.28% | 62,076 | 15.0% |
[ 22.5% - 23.0% ] 22.77% | 63,950 | 17.6% |
[ 23.0% - 23.5% ] 23.26% | 90,366 | 16.0% |
[ 23.5% - 24.0% ] 23.78% | 48,520 | 11.8% |
[ 24.0% - 24.5% ] 24.22% | 34,655 | 17.8% |
[ 24.5% - 25.0% ] 24.75% | 19,979 | 21.1% |
[ 25.0% - 25.5% ] 25.29% | 16,831 | 22.5% |
[ 25.5% - 26.0% ] 25.73% | 7,323 | 15.3% |
[ 26.0% - 26.5% ] 26.25% | 20,692 | 14.5% |
[ 26.5% - 27.0% ] 26.76% | 6,746 | 18.4% |
[ 27.0% - 27.5% ] 27.25% | 28,235 | 20.5% |
[ 27.5% - 28.0% ] 27.79% | 20,847 | 19.4% |
[ 28.0% - 28.5% ] 28.28% | 16,253 | 20.6% |
[ 28.5% - 29.0% ] 28.81% | 7,994 | 17.9% |
[ 29.0% - 29.5% ] 29.28% | 20,003 | 21.6% |
[ 29.5% - 30.0% ] 29.72% | 8,611 | 13.2% |
[ 30.0% - 30.5% ] 30.24% | 3,756 | 20.9% |
[ 30.5% - 31.0% ] 30.61% | 5,822 | 28.4% |
[ 31.0% - 31.5% ] 31.23% | 7,809 | 20.4% |
[ 31.5% - 32.0% ] 31.71% | 123 | 53.0% |
[ 32.0% - 32.5% ] 32.25% | 524 | 11.3% |
[ 32.5% - 33.0% ] 32.86% | 3,947 | 24.4% |
[ 33.0% - 33.5% ] 33.17% | 3,579 | 24.1% |
[ 33.5% - 34.0% ] 33.58% | 813 | 22.7% |
[ 34.0% - 34.5% ] 34.29% | 1,782 | 23.1% |
[ 34.5% - 35.0% ] 34.69% | 8,236 | 30.9% |
[ 35.0% - 35.5% ] 35.24% | 1,938 | 31.4% |
[ 35.5% - 36.0% ] 35.73% | 1,198 | 10.8% |
[ 36.0% - 36.5% ] 36.31% | 2,713 | 19.7% |
[ 36.5% - 37.0% ] 36.70% | 4,741 | 14.6% |
[ 37.0% - 37.5% ] 37.48% | 3,685 | 25.5% |
[ 37.5% - 38.0% ] 37.87% | 375 | 16.0% |
[ 38.0% - 38.5% ] 38.29% | 5,490 | 17.9% |
[ 38.5% - 39.0% ] 38.69% | 3,027 | 26.2% |
[ 39.5% - 40.0% ] 39.67% | 1,346 | 19.2% |
[ 40.0% - 40.5% ] 40.32% | 888 | 12.3% |
[ 41.0% - 41.5% ] 41.13% | 1,133 | 16.9% |
[ 41.5% - 42.0% ] 41.78% | 1,290 | 34.9% |
[ 42.0% - 42.5% ] 42.23% | 959 | 25.2% |
[ 42.5% - 43.0% ] 42.76% | 1,527 | 9.4% |
[ 43.0% - 43.5% ] 43.41% | 949 | 23.4% |
[ 43.5% - 44.0% ] 43.66% | 284 | 31.0% |
[ 44.5% - 45.0% ] 44.59% | 222 | 42.2% |
[ 45.0% - 45.5% ] 45.03% | 795 | 12.3% |
[ 45.5% - 46.0% ] 45.54% | 303 | 40.7% |
[ 46.0% - 46.5% ] 46.39% | 97 | 10.2% |
[ 46.5% - 47.0% ] 46.51% | 43 | 10.5% |
[ 49.5% - 50.0% ] 49.90% | 497 | 8.4% |
[ 50.0% - 50.5% ] 50.39% | 1,153 | 16.0% |
[ 51.0% - 51.5% ] 51.42% | 1,474 | 23.7% |
[ 55.0% - 55.5% ] 55.05% | 218 | 10.0% |
[ 55.5% - 56.0% ] 55.80% | 1,353 | 7.9% |
[ 56.5% - 57.0% ] 56.72% | 67 | 48.7% |
[ 68.0% - 68.5% ] 68.06% | 72 | 32.8% |
[ 70.0% - 70.5% ] 70.45% | 335 | 3.6% |
[ 73.0% - 73.5% ] 73.33% | 225 | 69.1% |
[ 81.0% - 81.5% ] 81.03% | 116 | 72.3% |
[ 99.5% - 100.0% ] 100.00% | 9 | 100.0% |