Zip Codes with the Highest Percentage of Population Employed in Security & Protection in Montana
RELATED REPORTS & OPTIONS
Security & Protection
Montana
Compare Zip Codes
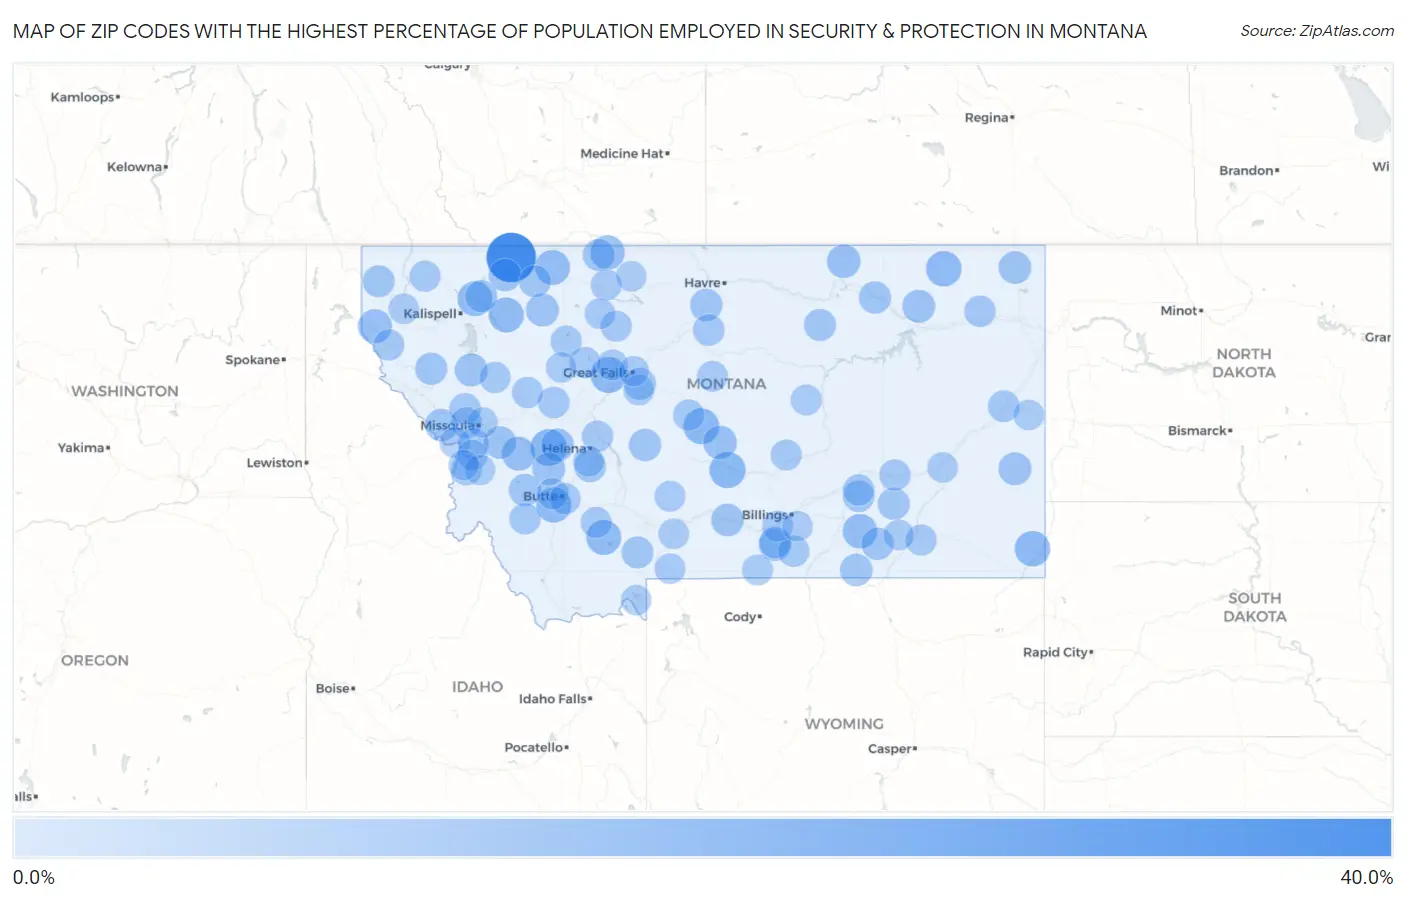
Map of Zip Codes with the Highest Percentage of Population Employed in Security & Protection in Montana
0.0%
40.0%
Zip Codes with the Highest Percentage of Population Employed in Security & Protection in Montana
| Zip Code | % Employed | vs State | vs National | |
| 1. | 59411 | 35.0% | 1.9%(+33.1)#1 | 2.1%(+32.9)#71 |
| 2. | 59731 | 12.5% | 1.9%(+10.6)#2 | 2.1%(+10.4)#505 |
| 3. | 59078 | 11.7% | 1.9%(+9.76)#3 | 2.1%(+9.52)#583 |
| 4. | 59483 | 11.6% | 1.9%(+9.65)#4 | 2.1%(+9.41)#591 |
| 5. | 59452 | 11.0% | 1.9%(+9.11)#5 | 2.1%(+8.87)#650 |
| 6. | 59253 | 10.5% | 1.9%(+8.62)#6 | 2.1%(+8.38)#699 |
| 7. | 59319 | 10.5% | 1.9%(+8.62)#7 | 2.1%(+8.38)#700 |
| 8. | 59750 | 10.2% | 1.9%(+8.26)#8 | 2.1%(+8.02)#747 |
| 9. | 59740 | 9.8% | 1.9%(+7.88)#9 | 2.1%(+7.65)#797 |
| 10. | 59936 | 9.7% | 1.9%(+7.84)#10 | 2.1%(+7.60)#799 |
| 11. | 59427 | 9.6% | 1.9%(+7.70)#11 | 2.1%(+7.46)#818 |
| 12. | 59919 | 9.5% | 1.9%(+7.63)#12 | 2.1%(+7.39)#833 |
| 13. | 59022 | 9.0% | 1.9%(+7.05)#13 | 2.1%(+6.81)#923 |
| 14. | 59484 | 8.9% | 1.9%(+6.98)#14 | 2.1%(+6.74)#935 |
| 15. | 59853 | 8.1% | 1.9%(+6.22)#15 | 2.1%(+5.98)#1,122 |
| 16. | 59837 | 7.9% | 1.9%(+5.96)#16 | 2.1%(+5.72)#1,213 |
| 17. | 59453 | 7.5% | 1.9%(+5.61)#17 | 2.1%(+5.37)#1,326 |
| 18. | 59544 | 7.3% | 1.9%(+5.38)#18 | 2.1%(+5.14)#1,402 |
| 19. | 59864 | 6.4% | 1.9%(+4.45)#19 | 2.1%(+4.21)#1,855 |
| 20. | 59248 | 6.3% | 1.9%(+4.38)#20 | 2.1%(+4.15)#1,903 |
| 21. | 59344 | 6.2% | 1.9%(+4.34)#21 | 2.1%(+4.10)#1,922 |
| 22. | 59713 | 6.2% | 1.9%(+4.34)#22 | 2.1%(+4.10)#1,924 |
| 23. | 59448 | 6.2% | 1.9%(+4.29)#23 | 2.1%(+4.05)#1,957 |
| 24. | 59722 | 6.1% | 1.9%(+4.23)#24 | 2.1%(+3.99)#1,993 |
| 25. | 59254 | 6.0% | 1.9%(+4.13)#25 | 2.1%(+3.89)#2,051 |
| 26. | 59825 | 5.8% | 1.9%(+3.90)#26 | 2.1%(+3.66)#2,203 |
| 27. | 59434 | 5.8% | 1.9%(+3.86)#27 | 2.1%(+3.62)#2,239 |
| 28. | 59069 | 5.7% | 1.9%(+3.82)#28 | 2.1%(+3.58)#2,266 |
| 29. | 59089 | 5.6% | 1.9%(+3.65)#29 | 2.1%(+3.41)#2,408 |
| 30. | 59016 | 5.5% | 1.9%(+3.61)#30 | 2.1%(+3.37)#2,442 |
| 31. | 59521 | 5.4% | 1.9%(+3.52)#31 | 2.1%(+3.28)#2,517 |
| 32. | 59645 | 5.4% | 1.9%(+3.49)#32 | 2.1%(+3.25)#2,540 |
| 33. | 59820 | 5.3% | 1.9%(+3.44)#33 | 2.1%(+3.20)#2,585 |
| 34. | 59711 | 5.3% | 1.9%(+3.43)#34 | 2.1%(+3.20)#2,593 |
| 35. | 59241 | 5.1% | 1.9%(+3.18)#35 | 2.1%(+2.94)#2,815 |
| 36. | 59859 | 5.1% | 1.9%(+3.16)#36 | 2.1%(+2.92)#2,848 |
| 37. | 59323 | 5.0% | 1.9%(+3.06)#37 | 2.1%(+2.82)#2,965 |
| 38. | 59538 | 4.9% | 1.9%(+3.02)#38 | 2.1%(+2.79)#3,006 |
| 39. | 59029 | 4.9% | 1.9%(+2.99)#39 | 2.1%(+2.75)#3,049 |
| 40. | 59482 | 4.8% | 1.9%(+2.87)#40 | 2.1%(+2.63)#3,203 |
| 41. | 59417 | 4.7% | 1.9%(+2.84)#41 | 2.1%(+2.60)#3,239 |
| 42. | 59913 | 4.7% | 1.9%(+2.82)#42 | 2.1%(+2.58)#3,260 |
| 43. | 59638 | 4.7% | 1.9%(+2.79)#43 | 2.1%(+2.55)#3,308 |
| 44. | 59935 | 4.6% | 1.9%(+2.68)#44 | 2.1%(+2.44)#3,473 |
| 45. | 59730 | 4.6% | 1.9%(+2.65)#45 | 2.1%(+2.41)#3,502 |
| 46. | 59472 | 4.5% | 1.9%(+2.62)#46 | 2.1%(+2.38)#3,570 |
| 47. | 59026 | 4.3% | 1.9%(+2.44)#47 | 2.1%(+2.20)#3,868 |
| 48. | 59330 | 4.2% | 1.9%(+2.26)#48 | 2.1%(+2.02)#4,180 |
| 49. | 59010 | 4.2% | 1.9%(+2.26)#49 | 2.1%(+2.02)#4,187 |
| 50. | 59520 | 4.0% | 1.9%(+2.08)#50 | 2.1%(+1.84)#4,512 |
| 51. | 59255 | 3.9% | 1.9%(+1.97)#51 | 2.1%(+1.73)#4,727 |
| 52. | 59639 | 3.9% | 1.9%(+1.97)#52 | 2.1%(+1.73)#4,748 |
| 53. | 59038 | 3.7% | 1.9%(+1.83)#53 | 2.1%(+1.59)#5,048 |
| 54. | 59834 | 3.7% | 1.9%(+1.79)#54 | 2.1%(+1.56)#5,131 |
| 55. | 59327 | 3.7% | 1.9%(+1.79)#55 | 2.1%(+1.55)#5,158 |
| 56. | 59748 | 3.6% | 1.9%(+1.74)#56 | 2.1%(+1.50)#5,288 |
| 57. | 59762 | 3.6% | 1.9%(+1.73)#57 | 2.1%(+1.49)#5,315 |
| 58. | 59602 | 3.6% | 1.9%(+1.71)#58 | 2.1%(+1.47)#5,352 |
| 59. | 59701 | 3.5% | 1.9%(+1.59)#59 | 2.1%(+1.35)#5,683 |
| 60. | 59066 | 3.5% | 1.9%(+1.57)#60 | 2.1%(+1.33)#5,728 |
| 61. | 59826 | 3.5% | 1.9%(+1.56)#61 | 2.1%(+1.32)#5,765 |
| 62. | 59422 | 3.4% | 1.9%(+1.52)#62 | 2.1%(+1.28)#5,856 |
| 63. | 59436 | 3.4% | 1.9%(+1.46)#63 | 2.1%(+1.22)#6,030 |
| 64. | 59874 | 3.3% | 1.9%(+1.44)#64 | 2.1%(+1.20)#6,108 |
| 65. | 59479 | 3.3% | 1.9%(+1.38)#65 | 2.1%(+1.14)#6,265 |
| 66. | 59747 | 3.2% | 1.9%(+1.32)#66 | 2.1%(+1.08)#6,481 |
| 67. | 59854 | 3.2% | 1.9%(+1.32)#67 | 2.1%(+1.08)#6,482 |
| 68. | 59934 | 3.2% | 1.9%(+1.31)#68 | 2.1%(+1.07)#6,504 |
| 69. | 59416 | 3.2% | 1.9%(+1.30)#69 | 2.1%(+1.06)#6,520 |
| 70. | 59804 | 3.2% | 1.9%(+1.24)#70 | 2.1%(+1.00)#6,689 |
| 71. | 59072 | 3.1% | 1.9%(+1.23)#71 | 2.1%(+0.992)#6,735 |
| 72. | 59833 | 3.1% | 1.9%(+1.22)#72 | 2.1%(+0.983)#6,769 |
| 73. | 59003 | 3.1% | 1.9%(+1.19)#73 | 2.1%(+0.954)#6,875 |
| 74. | 59474 | 3.1% | 1.9%(+1.14)#74 | 2.1%(+0.902)#7,036 |
| 75. | 59087 | 3.0% | 1.9%(+1.11)#75 | 2.1%(+0.867)#7,169 |
| 76. | 59044 | 2.9% | 1.9%(+1.03)#76 | 2.1%(+0.793)#7,468 |
| 77. | 59008 | 2.9% | 1.9%(+0.989)#77 | 2.1%(+0.750)#7,647 |
| 78. | 59086 | 2.8% | 1.9%(+0.940)#78 | 2.1%(+0.701)#7,873 |
| 79. | 59487 | 2.8% | 1.9%(+0.893)#79 | 2.1%(+0.654)#8,110 |
| 80. | 59847 | 2.7% | 1.9%(+0.808)#80 | 2.1%(+0.569)#8,458 |
| 81. | 59841 | 2.7% | 1.9%(+0.787)#81 | 2.1%(+0.548)#8,547 |
| 82. | 59430 | 2.7% | 1.9%(+0.779)#82 | 2.1%(+0.540)#8,594 |
| 83. | 59634 | 2.6% | 1.9%(+0.737)#83 | 2.1%(+0.497)#8,789 |
| 84. | 59425 | 2.6% | 1.9%(+0.644)#84 | 2.1%(+0.405)#9,232 |
| 85. | 59043 | 2.5% | 1.9%(+0.612)#85 | 2.1%(+0.373)#9,398 |
| 86. | 59405 | 2.5% | 1.9%(+0.595)#86 | 2.1%(+0.356)#9,485 |
| 87. | 59030 | 2.5% | 1.9%(+0.578)#87 | 2.1%(+0.339)#9,584 |
| 88. | 59353 | 2.5% | 1.9%(+0.565)#88 | 2.1%(+0.326)#9,652 |
| 89. | 59870 | 2.5% | 1.9%(+0.554)#89 | 2.1%(+0.315)#9,706 |
| 90. | 59047 | 2.5% | 1.9%(+0.554)#90 | 2.1%(+0.315)#9,710 |
| 91. | 59923 | 2.4% | 1.9%(+0.523)#91 | 2.1%(+0.284)#9,883 |
| 92. | 59410 | 2.4% | 1.9%(+0.500)#92 | 2.1%(+0.261)#10,013 |
| 93. | 59301 | 2.4% | 1.9%(+0.484)#93 | 2.1%(+0.244)#10,090 |
| 94. | 59444 | 2.3% | 1.9%(+0.364)#94 | 2.1%(+0.124)#10,820 |
| 95. | 59101 | 2.2% | 1.9%(+0.307)#95 | 2.1%(+0.067)#11,157 |
| 96. | 59828 | 2.2% | 1.9%(+0.273)#96 | 2.1%(+0.034)#11,359 |
| 97. | 59401 | 2.2% | 1.9%(+0.263)#97 | 2.1%(+0.023)#11,438 |
| 98. | 59875 | 2.2% | 1.9%(+0.243)#98 | 2.1%(+0.004)#11,555 |
| 99. | 59758 | 2.1% | 1.9%(+0.187)#99 | 2.1%(-0.052)#11,936 |
| 100. | 59802 | 2.1% | 1.9%(+0.173)#100 | 2.1%(-0.066)#12,036 |
Common Questions
What are the Top 10 Zip Codes with the Highest Percentage of Population Employed in Security & Protection in Montana?
Top 10 Zip Codes with the Highest Percentage of Population Employed in Security & Protection in Montana are:
What zip code has the Highest Percentage of Population Employed in Security & Protection in Montana?
59411 has the Highest Percentage of Population Employed in Security & Protection in Montana with 35.0%.
What is the Percentage of Population Employed in Security & Protection in the State of Montana?
Percentage of Population Employed in Security & Protection in Montana is 1.9%.
What is the Percentage of Population Employed in Security & Protection in the United States?
Percentage of Population Employed in Security & Protection in the United States is 2.1%.