East Glacier Park Village, MT Map & Demographics
East Glacier Park Village Map
East Glacier Park Village Overview
$31,445
PER CAPITA INCOME
$71,750
AVG FAMILY INCOME
$36,250
AVG HOUSEHOLD INCOME
11.0%
WAGE / INCOME GAP [ % ]
89.0¢/ $1
WAGE / INCOME GAP [ $ ]
0.47
INEQUALITY / GINI INDEX
262
TOTAL POPULATION
130
MALE POPULATION
132
FEMALE POPULATION
98.48
MALES / 100 FEMALES
101.54
FEMALES / 100 MALES
44.7
MEDIAN AGE
2.6
AVG FAMILY SIZE
1.9
AVG HOUSEHOLD SIZE
141
LABOR FORCE [ PEOPLE ]
62.7%
PERCENT IN LABOR FORCE
9.9%
UNEMPLOYMENT RATE
Income in East Glacier Park Village
Income Overview in East Glacier Park Village
Per Capita Income in East Glacier Park Village is $31,445, while median incomes of families and households are $71,750 and $36,250 respectively.
| Characteristic | Number | Measure |
| Per Capita Income | 262 | $31,445 |
| Median Family Income | 63 | $71,750 |
| Mean Family Income | 63 | $74,479 |
| Median Household Income | 136 | $36,250 |
| Mean Household Income | 136 | $59,616 |
| Income Deficit | 63 | $0 |
| Wage / Income Gap (%) | 262 | 11.02% |
| Wage / Income Gap ($) | 262 | 88.98¢ per $1 |
| Gini / Inequality Index | 262 | 0.47 |
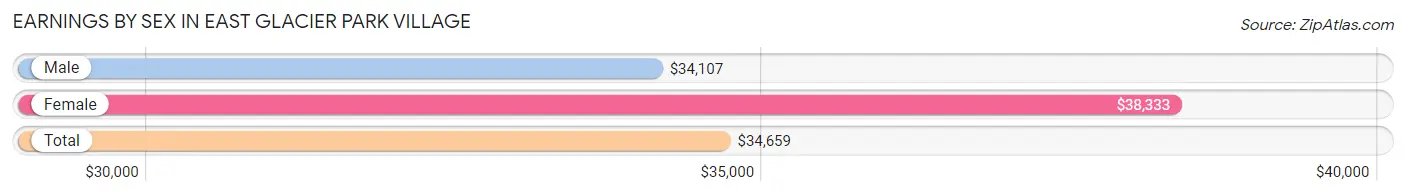
Earnings by Sex in East Glacier Park Village
Average Earnings in East Glacier Park Village are $34,659, $34,107 for men and $38,333 for women, a difference of 11.0%.
| Sex | Number | Average Earnings |
| Male | 71 (50.3%) | $34,107 |
| Female | 70 (49.6%) | $38,333 |
| Total | 141 (100.0%) | $34,659 |
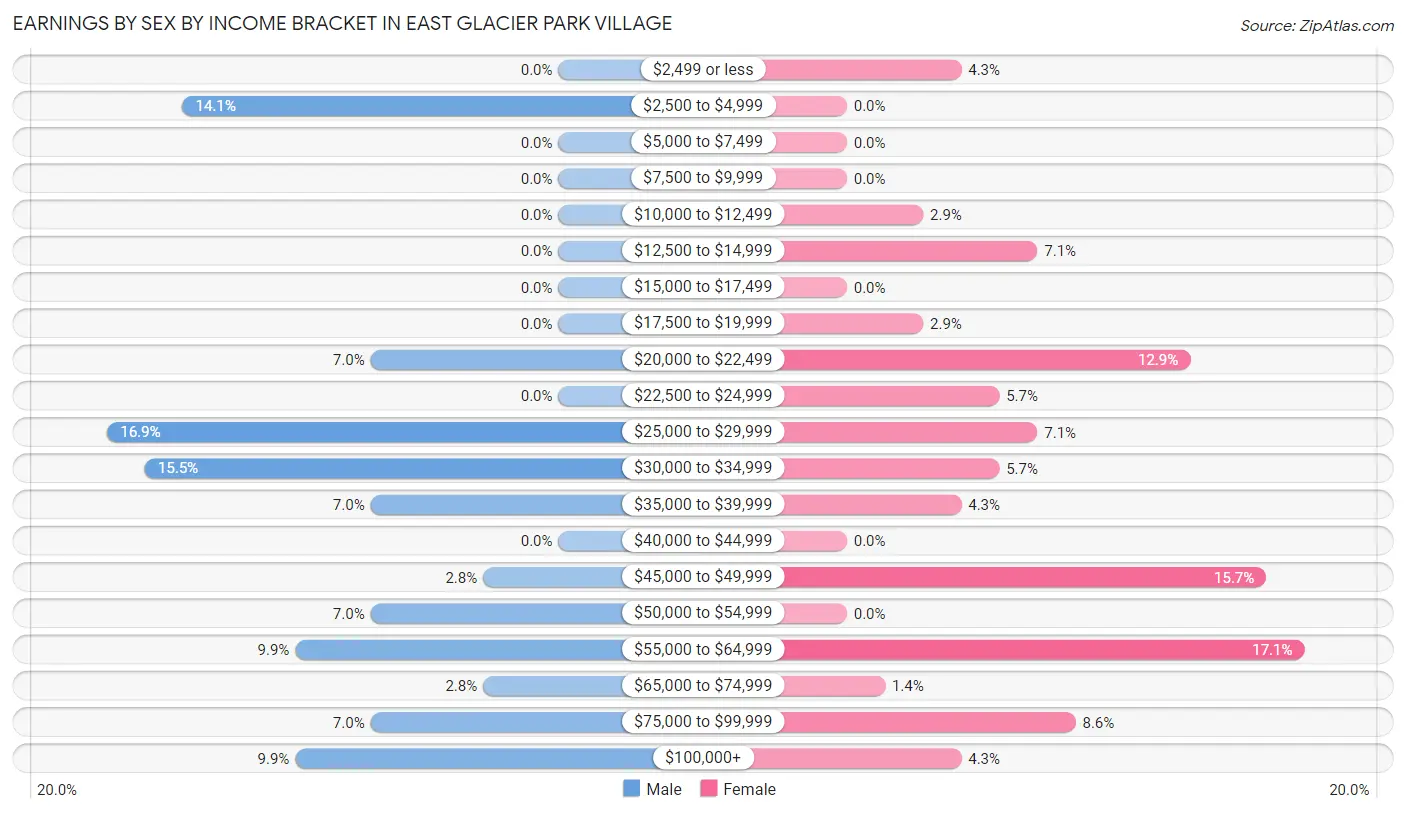
Earnings by Sex by Income Bracket in East Glacier Park Village
The most common earnings brackets in East Glacier Park Village are $25,000 to $29,999 for men (12 | 16.9%) and $55,000 to $64,999 for women (12 | 17.1%).
| Income | Male | Female |
| $2,499 or less | 0 (0.0%) | 3 (4.3%) |
| $2,500 to $4,999 | 10 (14.1%) | 0 (0.0%) |
| $5,000 to $7,499 | 0 (0.0%) | 0 (0.0%) |
| $7,500 to $9,999 | 0 (0.0%) | 0 (0.0%) |
| $10,000 to $12,499 | 0 (0.0%) | 2 (2.9%) |
| $12,500 to $14,999 | 0 (0.0%) | 5 (7.1%) |
| $15,000 to $17,499 | 0 (0.0%) | 0 (0.0%) |
| $17,500 to $19,999 | 0 (0.0%) | 2 (2.9%) |
| $20,000 to $22,499 | 5 (7.0%) | 9 (12.9%) |
| $22,500 to $24,999 | 0 (0.0%) | 4 (5.7%) |
| $25,000 to $29,999 | 12 (16.9%) | 5 (7.1%) |
| $30,000 to $34,999 | 11 (15.5%) | 4 (5.7%) |
| $35,000 to $39,999 | 5 (7.0%) | 3 (4.3%) |
| $40,000 to $44,999 | 0 (0.0%) | 0 (0.0%) |
| $45,000 to $49,999 | 2 (2.8%) | 11 (15.7%) |
| $50,000 to $54,999 | 5 (7.0%) | 0 (0.0%) |
| $55,000 to $64,999 | 7 (9.9%) | 12 (17.1%) |
| $65,000 to $74,999 | 2 (2.8%) | 1 (1.4%) |
| $75,000 to $99,999 | 5 (7.0%) | 6 (8.6%) |
| $100,000+ | 7 (9.9%) | 3 (4.3%) |
| Total | 71 (100.0%) | 70 (100.0%) |
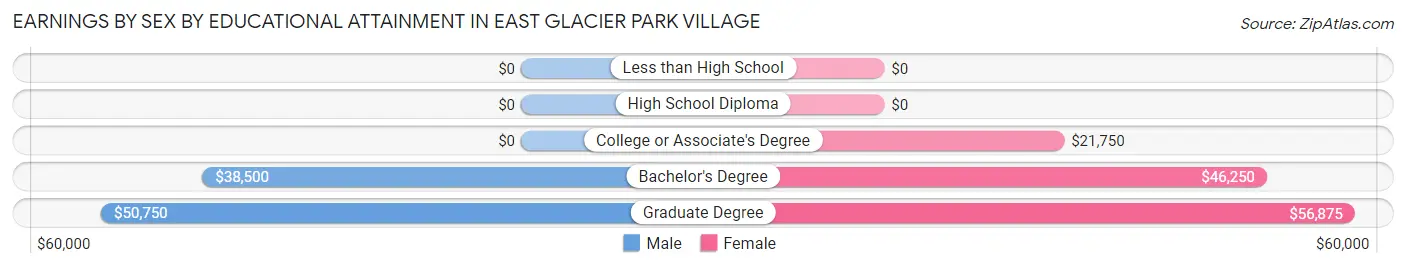
Earnings by Sex by Educational Attainment in East Glacier Park Village
Average earnings in East Glacier Park Village are $34,107 for men and $39,583 for women, a difference of 13.8%. Men with an educational attainment of graduate degree enjoy the highest average annual earnings of $50,750, while those with bachelor's degree education earn the least with $38,500. Women with an educational attainment of graduate degree earn the most with the average annual earnings of $56,875, while those with college or associate's degree education have the smallest earnings of $21,750.
| Educational Attainment | Male Income | Female Income |
| Less than High School | - | - |
| High School Diploma | - | - |
| College or Associate's Degree | - | - |
| Bachelor's Degree | $38,500 | $46,250 |
| Graduate Degree | $50,750 | $56,875 |
| Total | $34,107 | $39,583 |
Family Income in East Glacier Park Village
Family Income Brackets in East Glacier Park Village
According to the East Glacier Park Village family income data, there are 15 families falling into the $100,000 to $149,999 income range, which is the most common income bracket and makes up 23.8% of all families.
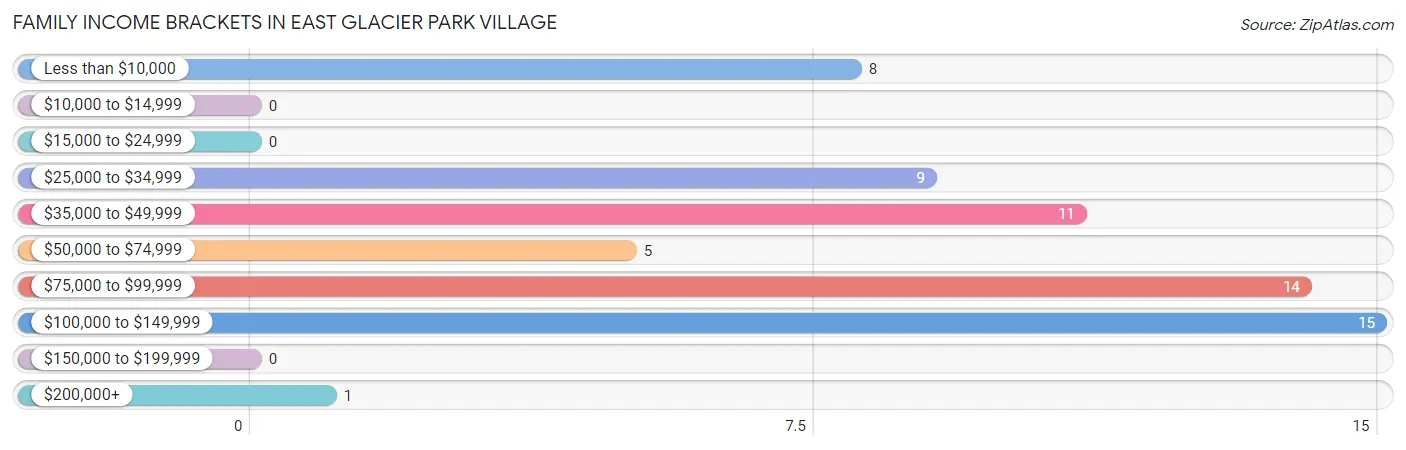
| Income Bracket | # Families | % Families |
| Less than $10,000 | 8 | 12.7% |
| $10,000 to $14,999 | 0 | 0.0% |
| $15,000 to $24,999 | 0 | 0.0% |
| $25,000 to $34,999 | 9 | 14.3% |
| $35,000 to $49,999 | 11 | 17.5% |
| $50,000 to $74,999 | 5 | 7.9% |
| $75,000 to $99,999 | 14 | 22.2% |
| $100,000 to $149,999 | 15 | 23.8% |
| $150,000 to $199,999 | 0 | 0.0% |
| $200,000+ | 1 | 1.6% |
Family Income by Famaliy Size in East Glacier Park Village
2-person families (34 | 54.0%) account for the highest median family income in East Glacier Park Village with $60,000 per family, while 2-person families (34 | 54.0%) have the highest median income of $30,000 per family member.
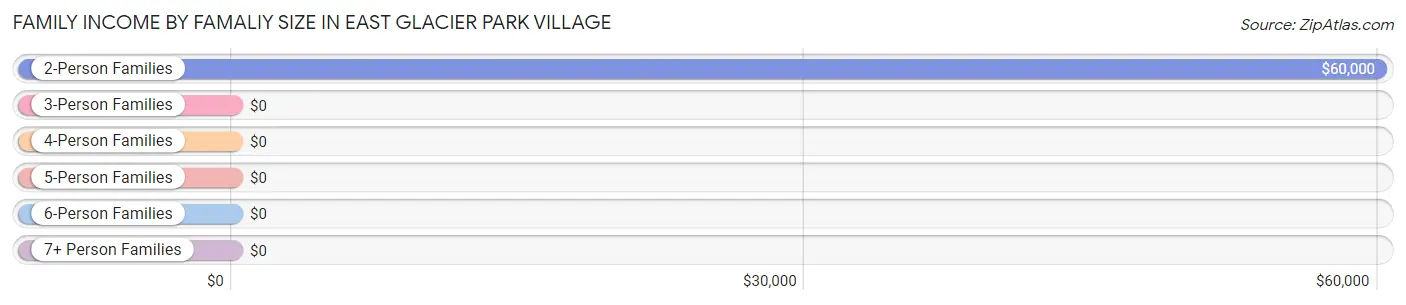
| Income Bracket | # Families | Median Income |
| 2-Person Families | 34 (54.0%) | $60,000 |
| 3-Person Families | 21 (33.3%) | $0 |
| 4-Person Families | 5 (7.9%) | $0 |
| 5-Person Families | 3 (4.8%) | $0 |
| 6-Person Families | 0 (0.0%) | $0 |
| 7+ Person Families | 0 (0.0%) | $0 |
| Total | 63 (100.0%) | $71,750 |
Family Income by Number of Earners in East Glacier Park Village
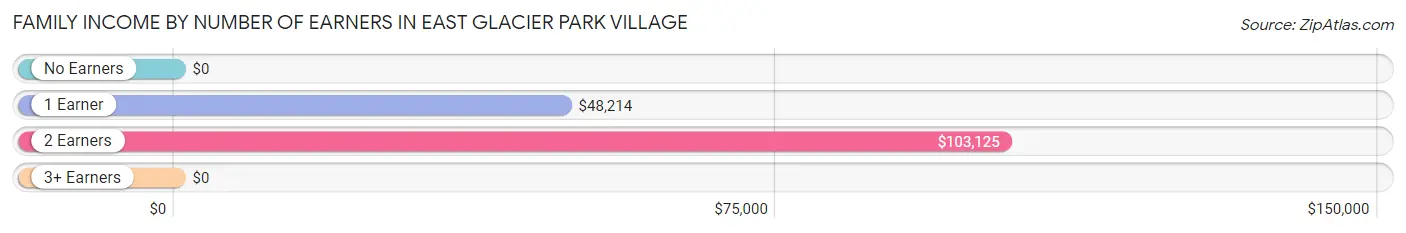
| Number of Earners | # Families | Median Income |
| No Earners | 14 (22.2%) | $0 |
| 1 Earner | 22 (34.9%) | $48,214 |
| 2 Earners | 25 (39.7%) | $103,125 |
| 3+ Earners | 2 (3.2%) | $0 |
| Total | 63 (100.0%) | $71,750 |
Household Income in East Glacier Park Village
Household Income Brackets in East Glacier Park Village
With 29 households falling in the category, the $100,000 to $149,999 income range is the most frequent in East Glacier Park Village, accounting for 21.3% of all households. In contrast, only 1 households (0.7%) fall into the $200,000+ income bracket, making it the least populous group.
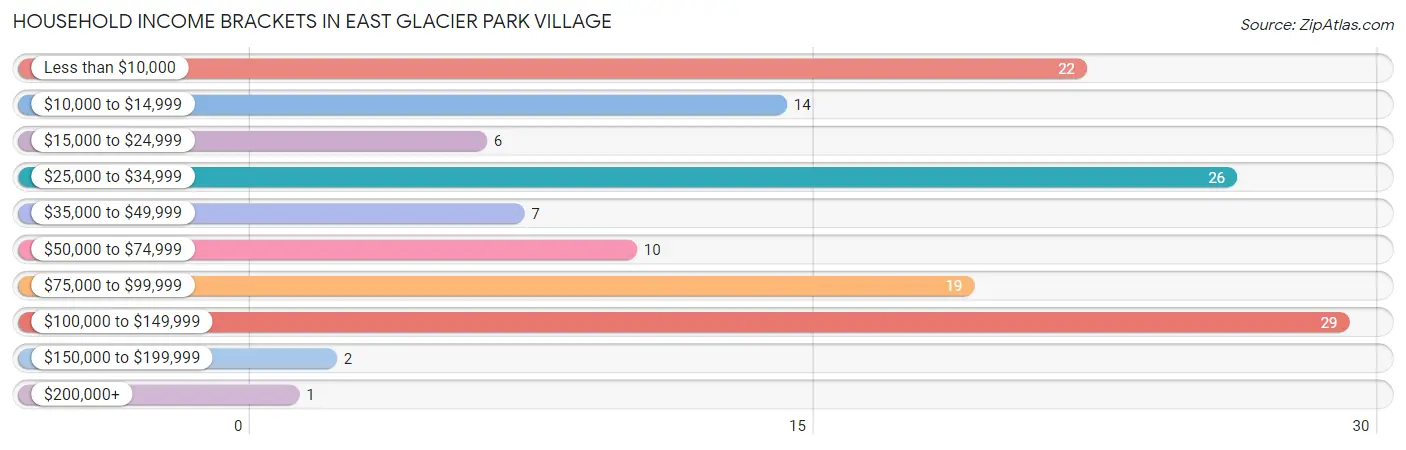
| Income Bracket | # Households | % Households |
| Less than $10,000 | 22 | 16.2% |
| $10,000 to $14,999 | 14 | 10.3% |
| $15,000 to $24,999 | 6 | 4.4% |
| $25,000 to $34,999 | 26 | 19.1% |
| $35,000 to $49,999 | 7 | 5.1% |
| $50,000 to $74,999 | 10 | 7.4% |
| $75,000 to $99,999 | 19 | 14.0% |
| $100,000 to $149,999 | 29 | 21.3% |
| $150,000 to $199,999 | 2 | 1.5% |
| $200,000+ | 1 | 0.7% |
Household Income by Householder Age in East Glacier Park Village
The median household income in East Glacier Park Village is $36,250, with the highest median household income of $48,750 found in the 45 to 64 years age bracket for the primary householder. A total of 55 households (40.4%) fall into this category.
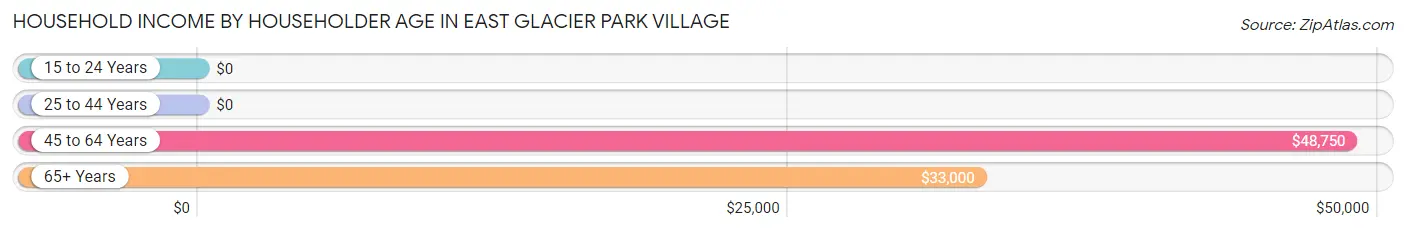
| Income Bracket | # Households | Median Income |
| 15 to 24 Years | 0 (0.0%) | $0 |
| 25 to 44 Years | 35 (25.7%) | $0 |
| 45 to 64 Years | 55 (40.4%) | $48,750 |
| 65+ Years | 46 (33.8%) | $33,000 |
| Total | 136 (100.0%) | $36,250 |
Poverty in East Glacier Park Village
Income Below Poverty by Sex and Age in East Glacier Park Village
With 23.8% poverty level for males and 21.2% for females among the residents of East Glacier Park Village, 6 to 11 year old males and 35 to 44 year old females are the most vulnerable to poverty, with 7 males (53.8%) and 9 females (42.9%) in their respective age groups living below the poverty level.
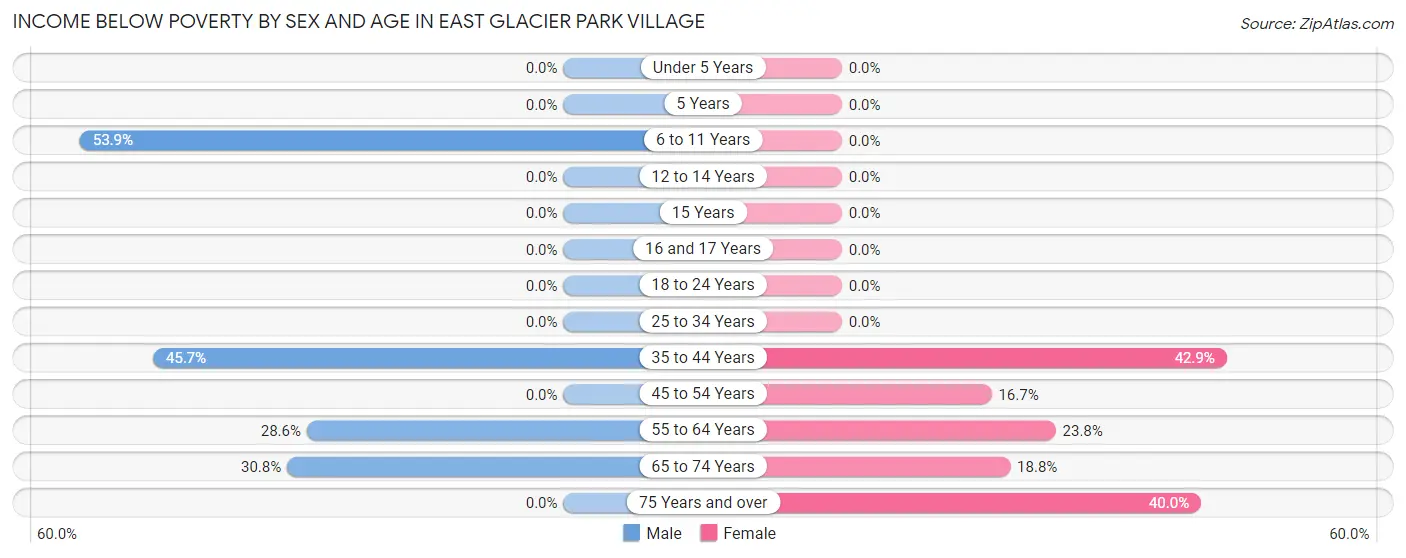
| Age Bracket | Male | Female |
| Under 5 Years | 0 (0.0%) | 0 (0.0%) |
| 5 Years | 0 (0.0%) | 0 (0.0%) |
| 6 to 11 Years | 7 (53.8%) | 0 (0.0%) |
| 12 to 14 Years | 0 (0.0%) | 0 (0.0%) |
| 15 Years | 0 (0.0%) | 0 (0.0%) |
| 16 and 17 Years | 0 (0.0%) | 0 (0.0%) |
| 18 to 24 Years | 0 (0.0%) | 0 (0.0%) |
| 25 to 34 Years | 0 (0.0%) | 0 (0.0%) |
| 35 to 44 Years | 16 (45.7%) | 9 (42.9%) |
| 45 to 54 Years | 0 (0.0%) | 3 (16.7%) |
| 55 to 64 Years | 4 (28.6%) | 5 (23.8%) |
| 65 to 74 Years | 4 (30.8%) | 3 (18.8%) |
| 75 Years and over | 0 (0.0%) | 8 (40.0%) |
| Total | 31 (23.8%) | 28 (21.2%) |
Income Above Poverty by Sex and Age in East Glacier Park Village
According to the poverty statistics in East Glacier Park Village, males aged under 5 years and females aged under 5 years are the age groups that are most secure financially, with 100.0% of males and 100.0% of females in these age groups living above the poverty line.
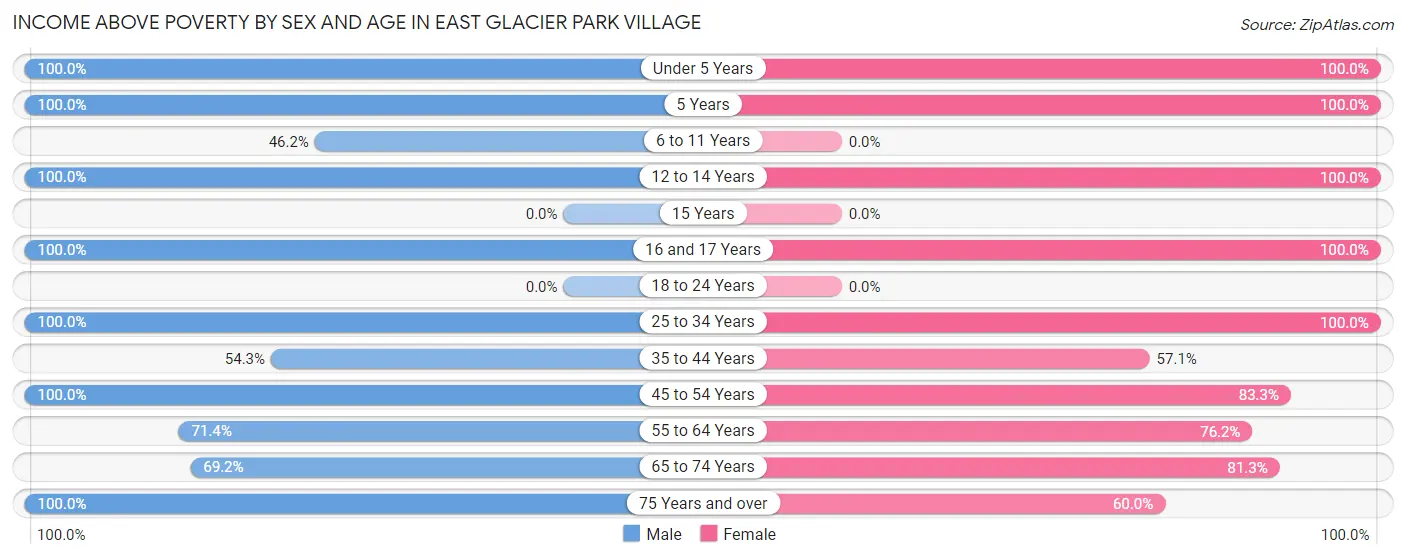
| Age Bracket | Male | Female |
| Under 5 Years | 5 (100.0%) | 4 (100.0%) |
| 5 Years | 3 (100.0%) | 5 (100.0%) |
| 6 to 11 Years | 6 (46.2%) | 0 (0.0%) |
| 12 to 14 Years | 2 (100.0%) | 5 (100.0%) |
| 15 Years | 0 (0.0%) | 0 (0.0%) |
| 16 and 17 Years | 3 (100.0%) | 6 (100.0%) |
| 18 to 24 Years | 0 (0.0%) | 0 (0.0%) |
| 25 to 34 Years | 14 (100.0%) | 16 (100.0%) |
| 35 to 44 Years | 19 (54.3%) | 12 (57.1%) |
| 45 to 54 Years | 18 (100.0%) | 15 (83.3%) |
| 55 to 64 Years | 10 (71.4%) | 16 (76.2%) |
| 65 to 74 Years | 9 (69.2%) | 13 (81.2%) |
| 75 Years and over | 10 (100.0%) | 12 (60.0%) |
| Total | 99 (76.1%) | 104 (78.8%) |
Income Below Poverty Among Married-Couple Families in East Glacier Park Village
The poverty statistics for married-couple families in East Glacier Park Village show that 18.2% or 8 of the total 44 families live below the poverty line. Families with 1 or 2 children have the highest poverty rate of 30.8%, comprising of 8 families. On the other hand, families with no children have the lowest poverty rate of 0.0%, which includes 0 families.
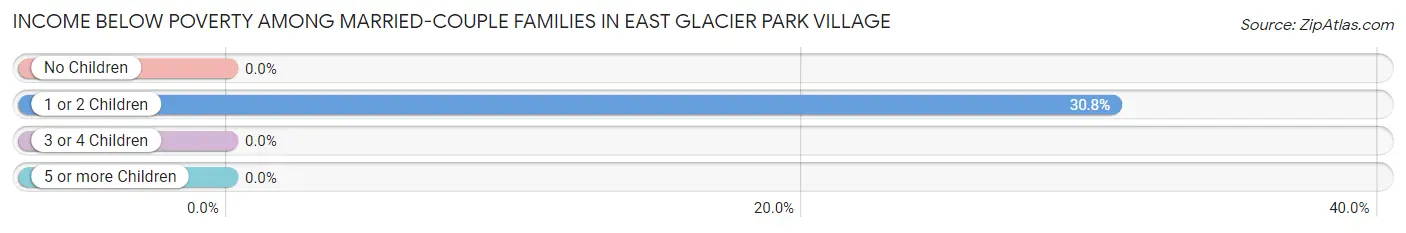
| Children | Above Poverty | Below Poverty |
| No Children | 15 (100.0%) | 0 (0.0%) |
| 1 or 2 Children | 18 (69.2%) | 8 (30.8%) |
| 3 or 4 Children | 3 (100.0%) | 0 (0.0%) |
| 5 or more Children | 0 (0.0%) | 0 (0.0%) |
| Total | 36 (81.8%) | 8 (18.2%) |
Income Below Poverty Among Single-Parent Households in East Glacier Park Village
| Children | Single Father | Single Mother |
| No Children | 0 (0.0%) | 0 (0.0%) |
| 1 or 2 Children | 0 (0.0%) | 0 (0.0%) |
| 3 or 4 Children | 0 (0.0%) | 0 (0.0%) |
| 5 or more Children | 0 (0.0%) | 0 (0.0%) |
| Total | 0 (0.0%) | 0 (0.0%) |
Income Below Poverty Among Married-Couple vs Single-Parent Households in East Glacier Park Village
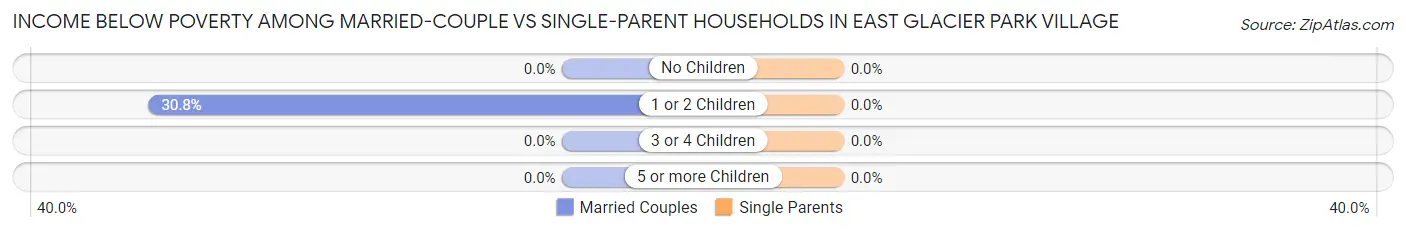
| Children | Married-Couple Families | Single-Parent Households |
| No Children | 0 (0.0%) | 0 (0.0%) |
| 1 or 2 Children | 8 (30.8%) | 0 (0.0%) |
| 3 or 4 Children | 0 (0.0%) | 0 (0.0%) |
| 5 or more Children | 0 (0.0%) | 0 (0.0%) |
| Total | 8 (18.2%) | 0 (0.0%) |
Race in East Glacier Park Village
The most populous races in East Glacier Park Village are White / Caucasian (155 | 59.2%), Native / Alaskan (89 | 34.0%), and Hawaiian / Pacific (10 | 3.8%).
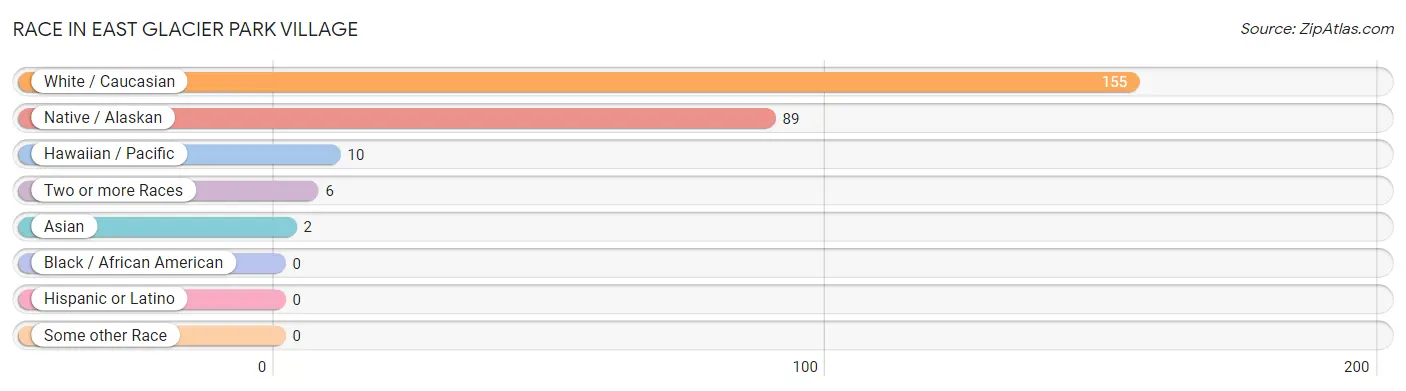
| Race | # Population | % Population |
| Asian | 2 | 0.8% |
| Black / African American | 0 | 0.0% |
| Hawaiian / Pacific | 10 | 3.8% |
| Hispanic or Latino | 0 | 0.0% |
| Native / Alaskan | 89 | 34.0% |
| White / Caucasian | 155 | 59.2% |
| Two or more Races | 6 | 2.3% |
| Some other Race | 0 | 0.0% |
| Total | 262 | 100.0% |
Ancestry in East Glacier Park Village
The most populous ancestries reported in East Glacier Park Village are Blackfeet (84 | 32.1%), English (53 | 20.2%), Irish (33 | 12.6%), German (23 | 8.8%), and Norwegian (23 | 8.8%), together accounting for 82.5% of all East Glacier Park Village residents.
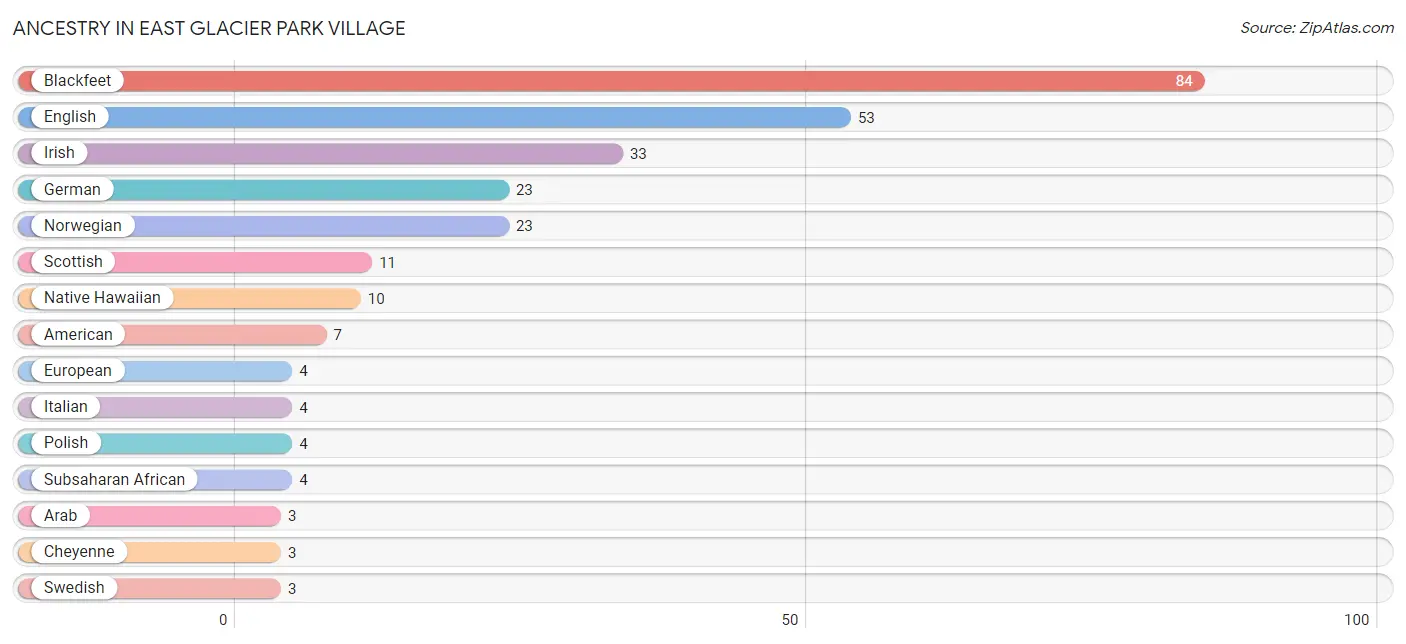
| Ancestry | # Population | % Population |
| American | 7 | 2.7% |
| Apache | 2 | 0.8% |
| Arab | 3 | 1.1% |
| Blackfeet | 84 | 32.1% |
| Cherokee | 1 | 0.4% |
| Cheyenne | 3 | 1.1% |
| English | 53 | 20.2% |
| European | 4 | 1.5% |
| German | 23 | 8.8% |
| Irish | 33 | 12.6% |
| Italian | 4 | 1.5% |
| Korean | 2 | 0.8% |
| Native Hawaiian | 10 | 3.8% |
| Norwegian | 23 | 8.8% |
| Polish | 4 | 1.5% |
| Scottish | 11 | 4.2% |
| Subsaharan African | 4 | 1.5% |
| Swedish | 3 | 1.1% | View All 18 Rows |
Immigrants in East Glacier Park Village
The most numerous immigrant groups reported in East Glacier Park Village came from Asia (2 | 0.8%), Philippines (2 | 0.8%), and South Eastern Asia (2 | 0.8%), together accounting for 2.3% of all East Glacier Park Village residents.
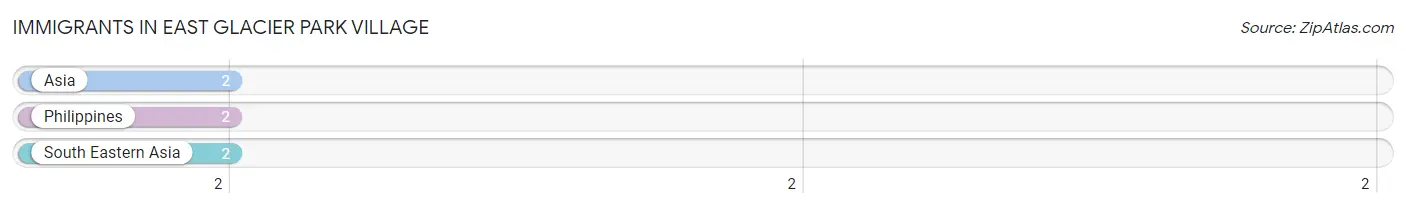
| Immigration Origin | # Population | % Population |
| Asia | 2 | 0.8% |
| Philippines | 2 | 0.8% |
| South Eastern Asia | 2 | 0.8% | View All 3 Rows |
Sex and Age in East Glacier Park Village
Sex and Age in East Glacier Park Village
The most populous age groups in East Glacier Park Village are 40 to 44 Years (23 | 17.7%) for men and 35 to 39 Years (15 | 11.4%) for women.
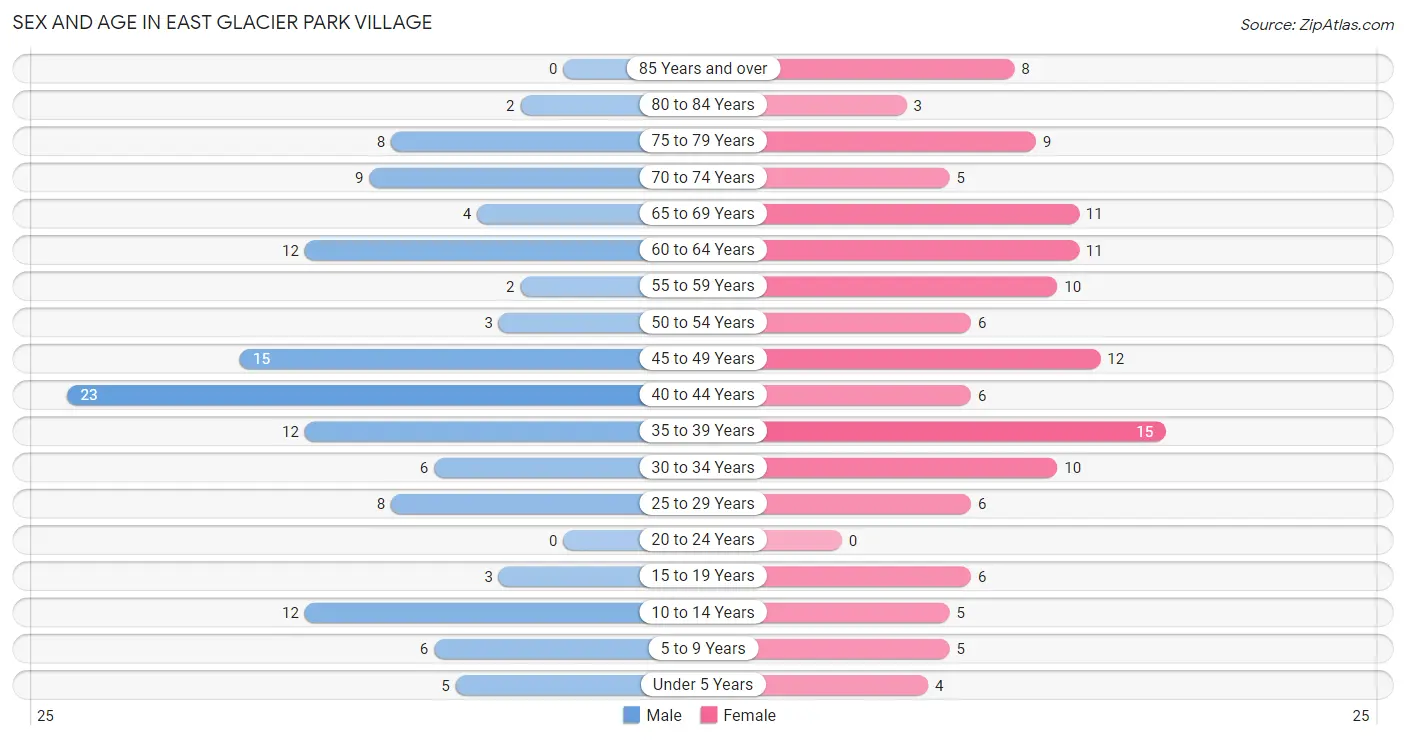
| Age Bracket | Male | Female |
| Under 5 Years | 5 (3.8%) | 4 (3.0%) |
| 5 to 9 Years | 6 (4.6%) | 5 (3.8%) |
| 10 to 14 Years | 12 (9.2%) | 5 (3.8%) |
| 15 to 19 Years | 3 (2.3%) | 6 (4.5%) |
| 20 to 24 Years | 0 (0.0%) | 0 (0.0%) |
| 25 to 29 Years | 8 (6.1%) | 6 (4.5%) |
| 30 to 34 Years | 6 (4.6%) | 10 (7.6%) |
| 35 to 39 Years | 12 (9.2%) | 15 (11.4%) |
| 40 to 44 Years | 23 (17.7%) | 6 (4.5%) |
| 45 to 49 Years | 15 (11.5%) | 12 (9.1%) |
| 50 to 54 Years | 3 (2.3%) | 6 (4.5%) |
| 55 to 59 Years | 2 (1.5%) | 10 (7.6%) |
| 60 to 64 Years | 12 (9.2%) | 11 (8.3%) |
| 65 to 69 Years | 4 (3.1%) | 11 (8.3%) |
| 70 to 74 Years | 9 (6.9%) | 5 (3.8%) |
| 75 to 79 Years | 8 (6.1%) | 9 (6.8%) |
| 80 to 84 Years | 2 (1.5%) | 3 (2.3%) |
| 85 Years and over | 0 (0.0%) | 8 (6.1%) |
| Total | 130 (100.0%) | 132 (100.0%) |
Families and Households in East Glacier Park Village
Median Family Size in East Glacier Park Village
The median family size in East Glacier Park Village is 2.56 persons per family, with married-couple families (44 | 69.8%) accounting for the largest median family size of 2.73 persons per family. On the other hand, single male/father families (6 | 9.5%) represent the smallest median family size with 1.83 persons per family.
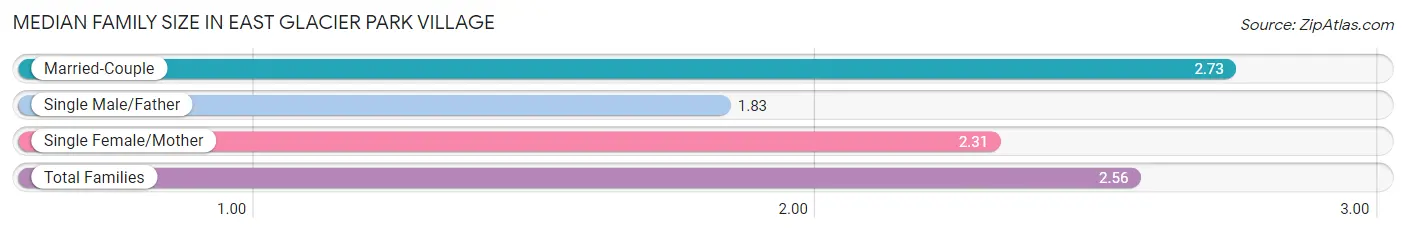
| Family Type | # Families | Family Size |
| Married-Couple | 44 (69.8%) | 2.73 |
| Single Male/Father | 6 (9.5%) | 1.83 |
| Single Female/Mother | 13 (20.6%) | 2.31 |
| Total Families | 63 (100.0%) | 2.56 |
Median Household Size in East Glacier Park Village
The median household size in East Glacier Park Village is 1.93 persons per household, with single female/mother households (13 | 9.6%) accounting for the largest median household size of 3.38 persons per household. non-family households (73 | 53.7%) represent the smallest median household size with 1.15 persons per household.
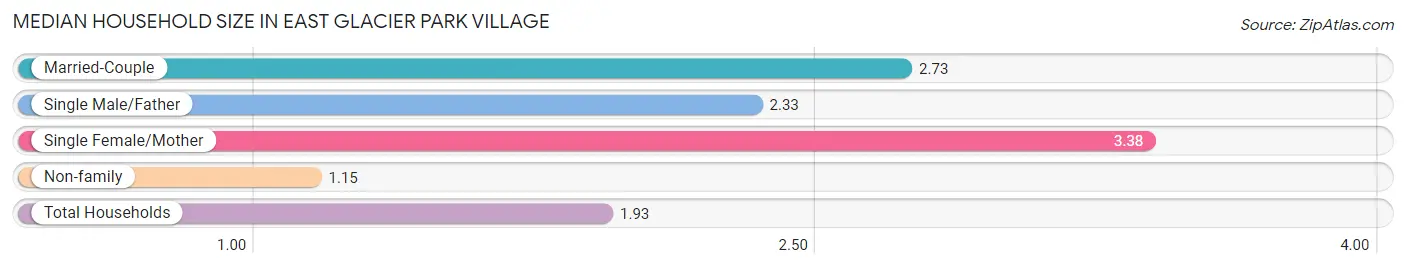
| Household Type | # Households | Household Size |
| Married-Couple | 44 (32.4%) | 2.73 |
| Single Male/Father | 6 (4.4%) | 2.33 |
| Single Female/Mother | 13 (9.6%) | 3.38 |
| Non-family | 73 (53.7%) | 1.15 |
| Total Households | 136 (100.0%) | 1.93 |
Household Size by Marriage Status in East Glacier Park Village
Out of a total of 136 households in East Glacier Park Village, 63 (46.3%) are family households, while 73 (53.7%) are nonfamily households. The most numerous type of family households are 3-person households, comprising 29, and the most common type of nonfamily households are 1-person households, comprising 69.
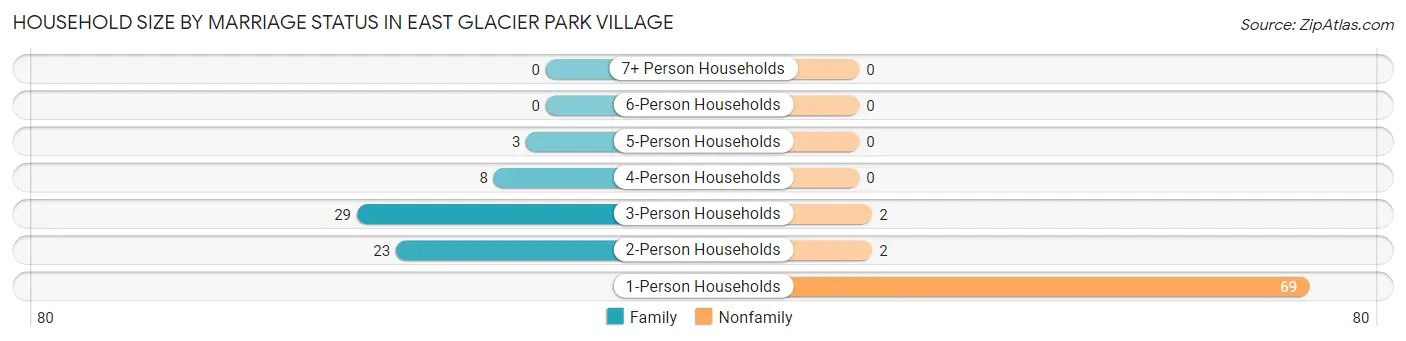
| Household Size | Family Households | Nonfamily Households |
| 1-Person Households | - | 69 (50.7%) |
| 2-Person Households | 23 (16.9%) | 2 (1.5%) |
| 3-Person Households | 29 (21.3%) | 2 (1.5%) |
| 4-Person Households | 8 (5.9%) | 0 (0.0%) |
| 5-Person Households | 3 (2.2%) | 0 (0.0%) |
| 6-Person Households | 0 (0.0%) | 0 (0.0%) |
| 7+ Person Households | 0 (0.0%) | 0 (0.0%) |
| Total | 63 (46.3%) | 73 (53.7%) |
Female Fertility in East Glacier Park Village
Fertility by Age in East Glacier Park Village
| Age Bracket | Women with Births | Births / 1,000 Women |
| 15 to 19 years | 0 (0.0%) | 0.0 |
| 20 to 34 years | 0 (0.0%) | 0.0 |
| 35 to 50 years | 0 (0.0%) | 0.0 |
| Total | 0 (0.0%) | 0.0 |
Fertility by Age by Marriage Status in East Glacier Park Village
| Age Bracket | Married | Unmarried |
| 15 to 19 years | 0 (0.0%) | 0 (0.0%) |
| 20 to 34 years | 0 (0.0%) | 0 (0.0%) |
| 35 to 50 years | 0 (0.0%) | 0 (0.0%) |
| Total | 0 (0.0%) | 0 (0.0%) |
Fertility by Education in East Glacier Park Village
| Educational Attainment | Women with Births | Births / 1,000 Women |
| Less than High School | 0 (0.0%) | 0.0 |
| High School Diploma | 0 (0.0%) | 0.0 |
| College or Associate's Degree | 0 (0.0%) | 0.0 |
| Bachelor's Degree | 0 (0.0%) | 0.0 |
| Graduate Degree | 0 (0.0%) | 0.0 |
| Total | 0 (0.0%) | 0.0 |
Fertility by Education by Marriage Status in East Glacier Park Village
| Educational Attainment | Married | Unmarried |
| Less than High School | 0 (0.0%) | 0 (0.0%) |
| High School Diploma | 0 (0.0%) | 0 (0.0%) |
| College or Associate's Degree | 0 (0.0%) | 0 (0.0%) |
| Bachelor's Degree | 0 (0.0%) | 0 (0.0%) |
| Graduate Degree | 0 (0.0%) | 0 (0.0%) |
| Total | 0 (0.0%) | 0 (0.0%) |
Employment Characteristics in East Glacier Park Village
Employment by Class of Employer in East Glacier Park Village
Among the 126 employed individuals in East Glacier Park Village, private company employees (52 | 41.3%), federal government employees (44 | 34.9%), and local government employees (20 | 15.9%) make up the most common classes of employment.
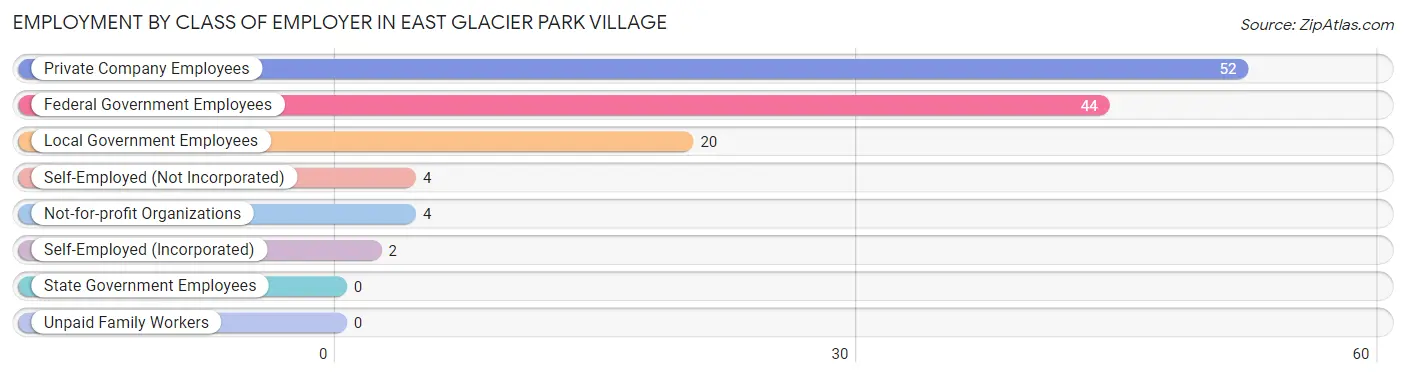
| Employer Class | # Employees | % Employees |
| Private Company Employees | 52 | 41.3% |
| Self-Employed (Incorporated) | 2 | 1.6% |
| Self-Employed (Not Incorporated) | 4 | 3.2% |
| Not-for-profit Organizations | 4 | 3.2% |
| Local Government Employees | 20 | 15.9% |
| State Government Employees | 0 | 0.0% |
| Federal Government Employees | 44 | 34.9% |
| Unpaid Family Workers | 0 | 0.0% |
| Total | 126 | 100.0% |
Employment Status by Age in East Glacier Park Village
According to the labor force statistics for East Glacier Park Village, out of the total population over 16 years of age (225), 62.7% or 141 individuals are in the labor force, with 9.9% or 14 of them unemployed. The age group with the highest labor force participation rate is 25 to 29 years, with 100.0% or 14 individuals in the labor force. Within the labor force, the 35 to 44 years age range has the highest percentage of unemployed individuals, with 22.2% or 8 of them being unemployed.
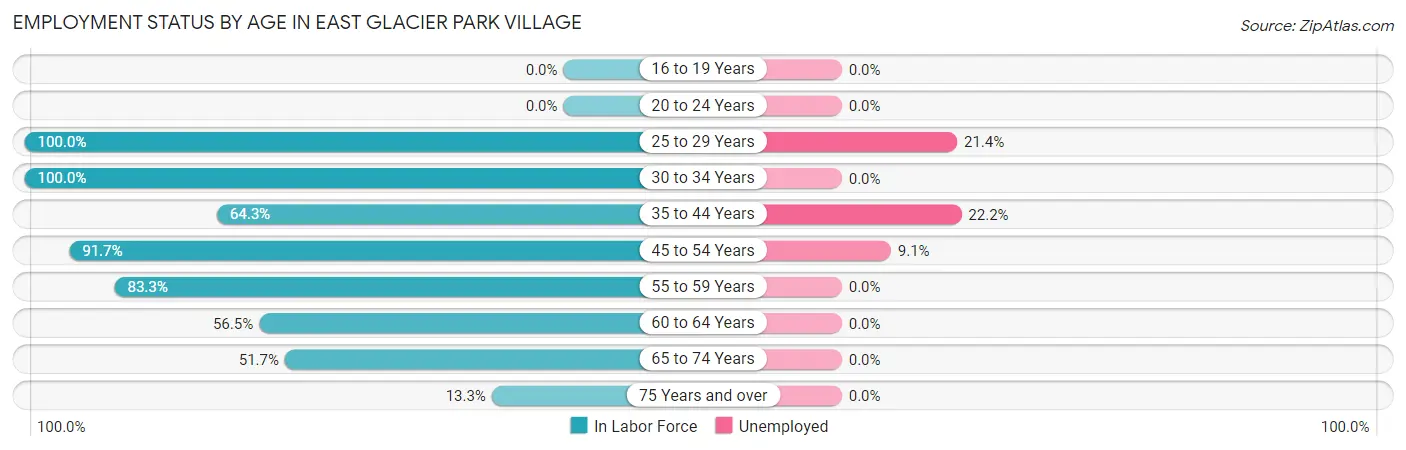
| Age Bracket | In Labor Force | Unemployed |
| 16 to 19 Years | 0 (0.0%) | 0 (0.0%) |
| 20 to 24 Years | 0 (0.0%) | 0 (0.0%) |
| 25 to 29 Years | 14 (100.0%) | 3 (21.4%) |
| 30 to 34 Years | 16 (100.0%) | 0 (0.0%) |
| 35 to 44 Years | 36 (64.3%) | 8 (22.2%) |
| 45 to 54 Years | 33 (91.7%) | 3 (9.1%) |
| 55 to 59 Years | 10 (83.3%) | 0 (0.0%) |
| 60 to 64 Years | 13 (56.5%) | 0 (0.0%) |
| 65 to 74 Years | 15 (51.7%) | 0 (0.0%) |
| 75 Years and over | 4 (13.3%) | 0 (0.0%) |
| Total | 141 (62.7%) | 14 (9.9%) |
Employment Status by Educational Attainment in East Glacier Park Village
According to labor force statistics for East Glacier Park Village, 77.7% of individuals (122) out of the total population between 25 and 64 years of age (157) are in the labor force, with 11.5% or 14 of them being unemployed. The group with the highest labor force participation rate are those with the educational attainment of bachelor's degree or higher, with 88.0% or 81 individuals in the labor force. Within the labor force, individuals with high school diploma education have the highest percentage of unemployment, with 64.7% or 11 of them being unemployed.
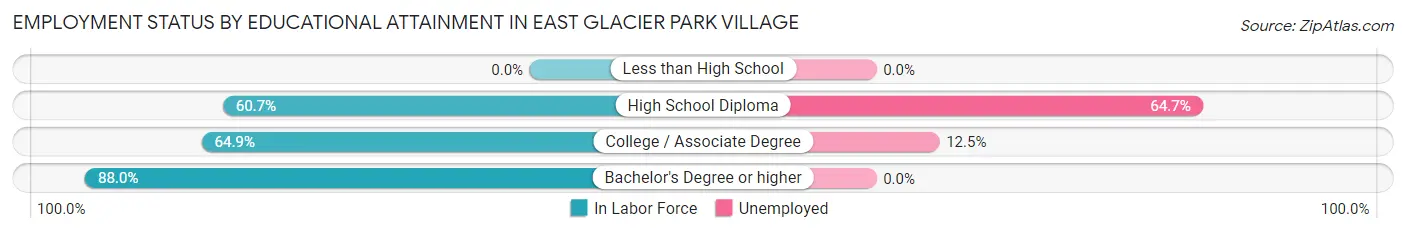
| Educational Attainment | In Labor Force | Unemployed |
| Less than High School | 0 (0.0%) | 0 (0.0%) |
| High School Diploma | 17 (60.7%) | 18 (64.7%) |
| College / Associate Degree | 24 (64.9%) | 5 (12.5%) |
| Bachelor's Degree or higher | 81 (88.0%) | 0 (0.0%) |
| Total | 122 (77.7%) | 18 (11.5%) |
Employment Occupations by Sex in East Glacier Park Village
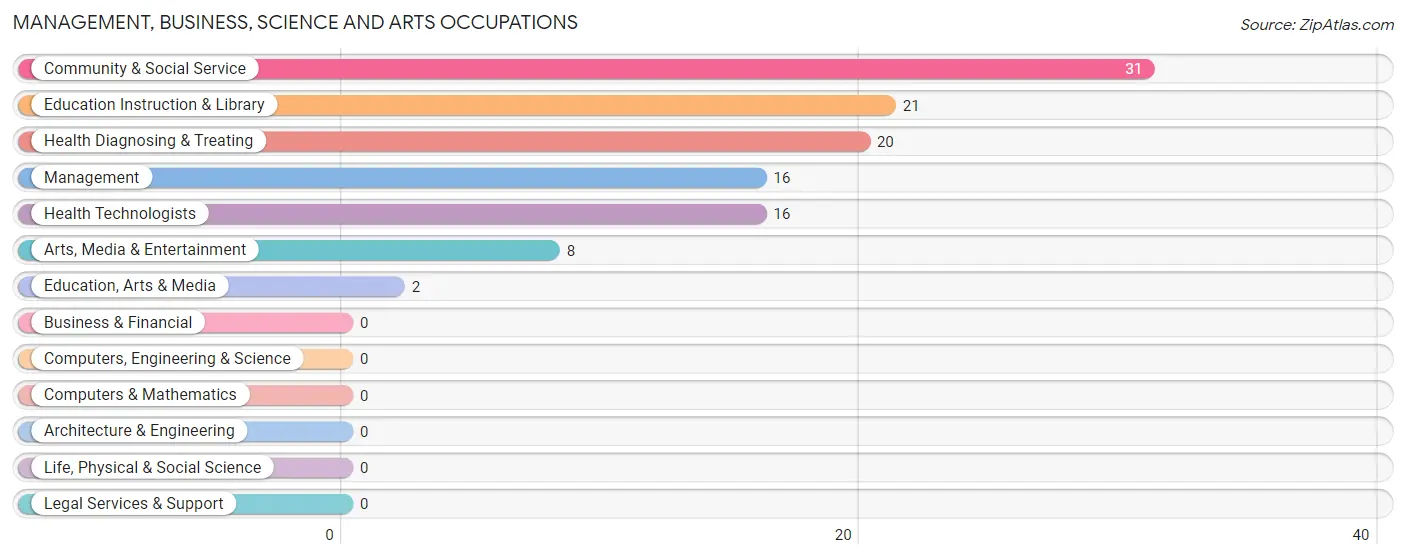
Management, Business, Science and Arts Occupations
The most common Management, Business, Science and Arts occupations in East Glacier Park Village are Community & Social Service (31 | 24.4%), Education Instruction & Library (21 | 16.5%), Health Diagnosing & Treating (20 | 15.8%), Management (16 | 12.6%), and Health Technologists (16 | 12.6%).
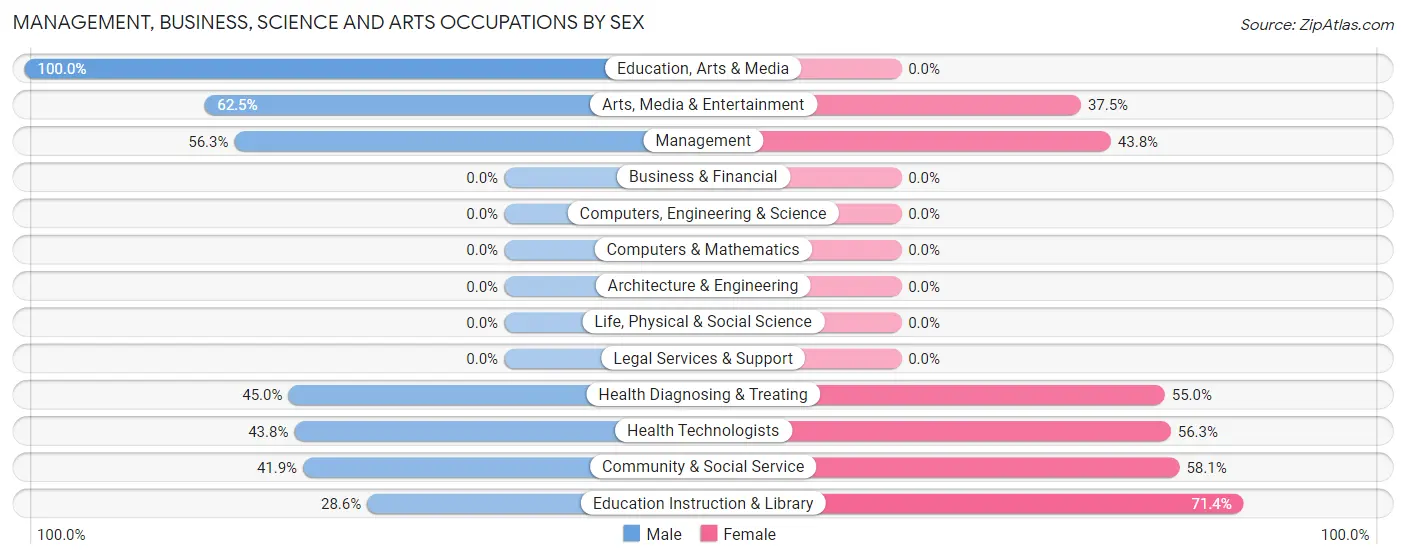
Management, Business, Science and Arts Occupations by Sex
Within the Management, Business, Science and Arts occupations in East Glacier Park Village, the most male-oriented occupations are Education, Arts & Media (100.0%), Arts, Media & Entertainment (62.5%), and Management (56.2%), while the most female-oriented occupations are Education Instruction & Library (71.4%), Community & Social Service (58.1%), and Health Technologists (56.2%).
| Occupation | Male | Female |
| Management | 9 (56.2%) | 7 (43.8%) |
| Business & Financial | 0 (0.0%) | 0 (0.0%) |
| Computers, Engineering & Science | 0 (0.0%) | 0 (0.0%) |
| Computers & Mathematics | 0 (0.0%) | 0 (0.0%) |
| Architecture & Engineering | 0 (0.0%) | 0 (0.0%) |
| Life, Physical & Social Science | 0 (0.0%) | 0 (0.0%) |
| Community & Social Service | 13 (41.9%) | 18 (58.1%) |
| Education, Arts & Media | 2 (100.0%) | 0 (0.0%) |
| Legal Services & Support | 0 (0.0%) | 0 (0.0%) |
| Education Instruction & Library | 6 (28.6%) | 15 (71.4%) |
| Arts, Media & Entertainment | 5 (62.5%) | 3 (37.5%) |
| Health Diagnosing & Treating | 9 (45.0%) | 11 (55.0%) |
| Health Technologists | 7 (43.8%) | 9 (56.2%) |
| Total (Category) | 31 (46.3%) | 36 (53.7%) |
| Total (Overall) | 63 (49.6%) | 64 (50.4%) |
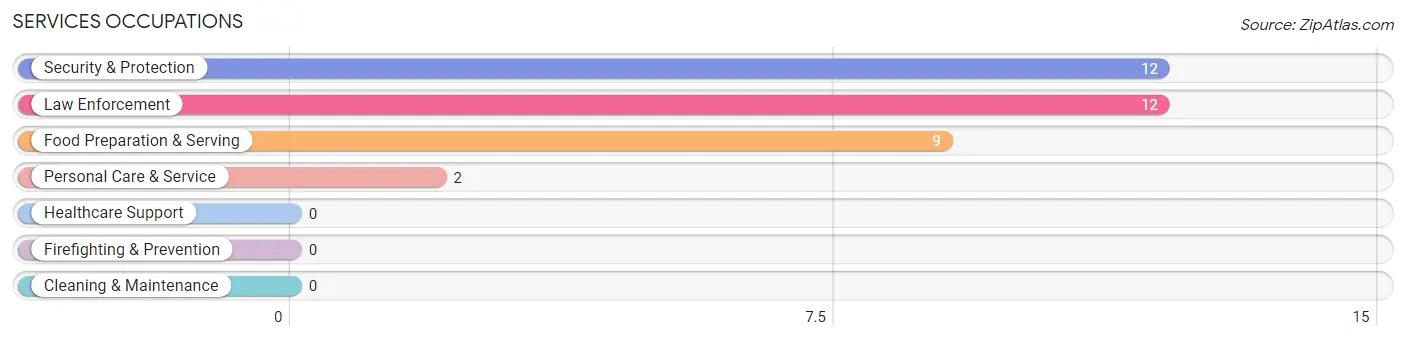
Services Occupations
The most common Services occupations in East Glacier Park Village are Security & Protection (12 | 9.5%), Law Enforcement (12 | 9.5%), Food Preparation & Serving (9 | 7.1%), and Personal Care & Service (2 | 1.6%).
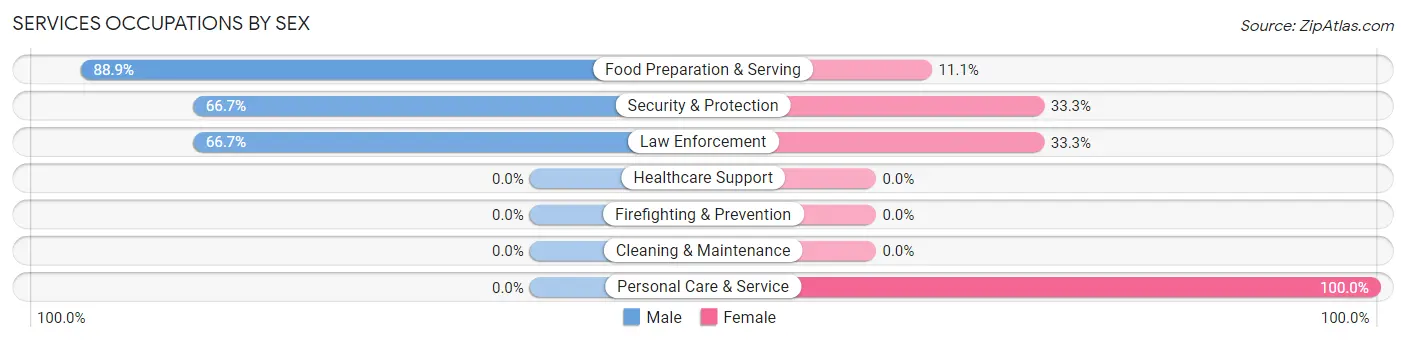
Services Occupations by Sex
Within the Services occupations in East Glacier Park Village, the most male-oriented occupations are Food Preparation & Serving (88.9%), Security & Protection (66.7%), and Law Enforcement (66.7%), while the most female-oriented occupations are Personal Care & Service (100.0%), Security & Protection (33.3%), and Law Enforcement (33.3%).
| Occupation | Male | Female |
| Healthcare Support | 0 (0.0%) | 0 (0.0%) |
| Security & Protection | 8 (66.7%) | 4 (33.3%) |
| Firefighting & Prevention | 0 (0.0%) | 0 (0.0%) |
| Law Enforcement | 8 (66.7%) | 4 (33.3%) |
| Food Preparation & Serving | 8 (88.9%) | 1 (11.1%) |
| Cleaning & Maintenance | 0 (0.0%) | 0 (0.0%) |
| Personal Care & Service | 0 (0.0%) | 2 (100.0%) |
| Total (Category) | 16 (69.6%) | 7 (30.4%) |
| Total (Overall) | 63 (49.6%) | 64 (50.4%) |
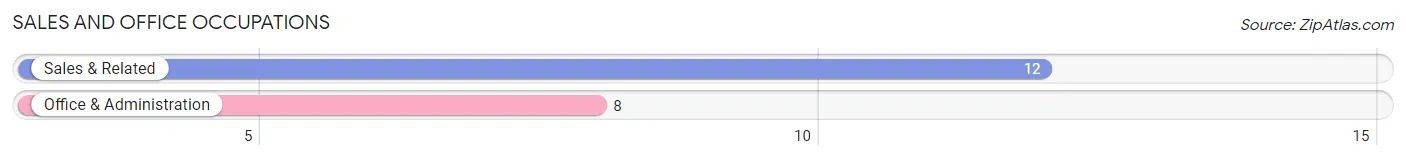
Sales and Office Occupations
The most common Sales and Office occupations in East Glacier Park Village are Sales & Related (12 | 9.5%), and Office & Administration (8 | 6.3%).
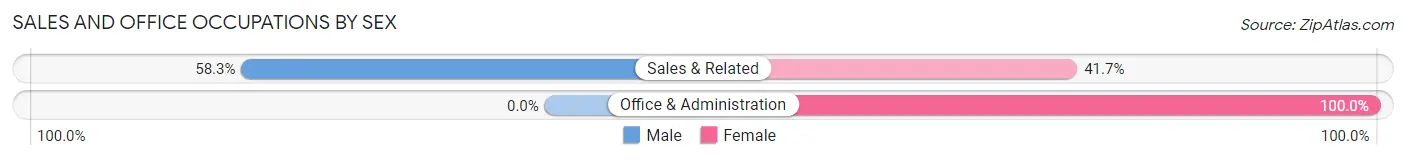
Sales and Office Occupations by Sex
| Occupation | Male | Female |
| Sales & Related | 7 (58.3%) | 5 (41.7%) |
| Office & Administration | 0 (0.0%) | 8 (100.0%) |
| Total (Category) | 7 (35.0%) | 13 (65.0%) |
| Total (Overall) | 63 (49.6%) | 64 (50.4%) |
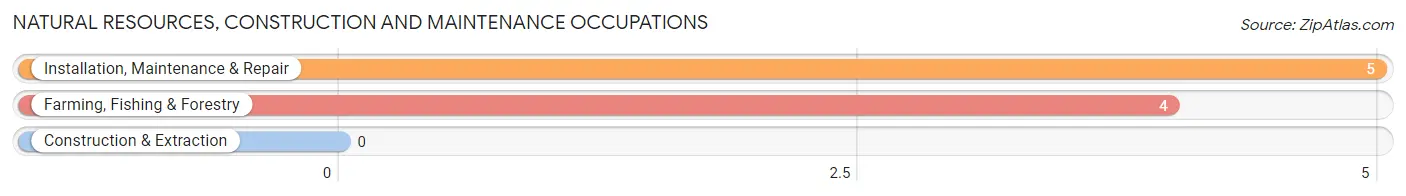
Natural Resources, Construction and Maintenance Occupations
The most common Natural Resources, Construction and Maintenance occupations in East Glacier Park Village are Installation, Maintenance & Repair (5 | 3.9%), and Farming, Fishing & Forestry (4 | 3.2%).
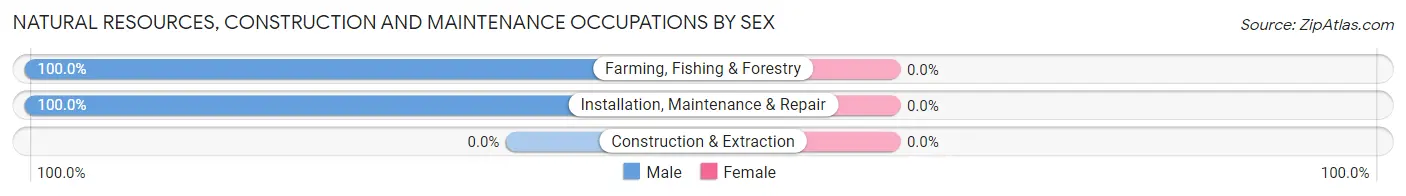
Natural Resources, Construction and Maintenance Occupations by Sex
| Occupation | Male | Female |
| Farming, Fishing & Forestry | 4 (100.0%) | 0 (0.0%) |
| Construction & Extraction | 0 (0.0%) | 0 (0.0%) |
| Installation, Maintenance & Repair | 5 (100.0%) | 0 (0.0%) |
| Total (Category) | 9 (100.0%) | 0 (0.0%) |
| Total (Overall) | 63 (49.6%) | 64 (50.4%) |
Production, Transportation and Moving Occupations
The most common Production, Transportation and Moving occupations in East Glacier Park Village are , and Production (8 | 6.3%).
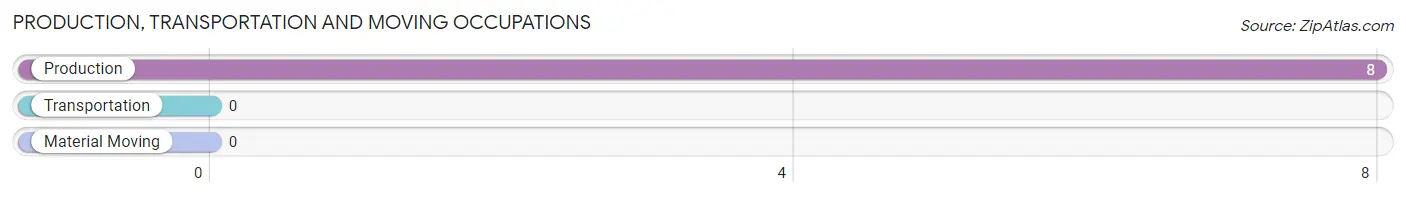
Production, Transportation and Moving Occupations by Sex
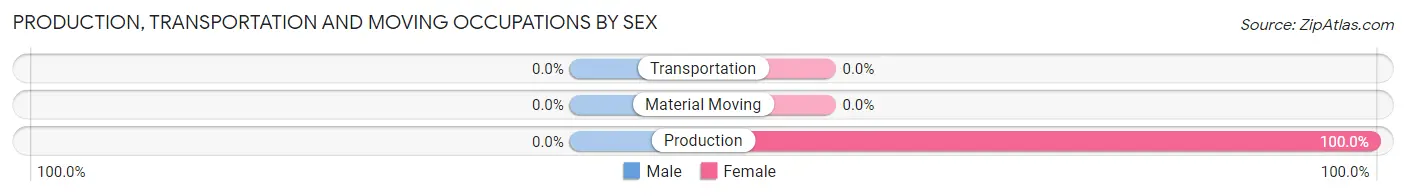
| Occupation | Male | Female |
| Production | 0 (0.0%) | 8 (100.0%) |
| Transportation | 0 (0.0%) | 0 (0.0%) |
| Material Moving | 0 (0.0%) | 0 (0.0%) |
| Total (Category) | 0 (0.0%) | 8 (100.0%) |
| Total (Overall) | 63 (49.6%) | 64 (50.4%) |
Employment Industries by Sex in East Glacier Park Village
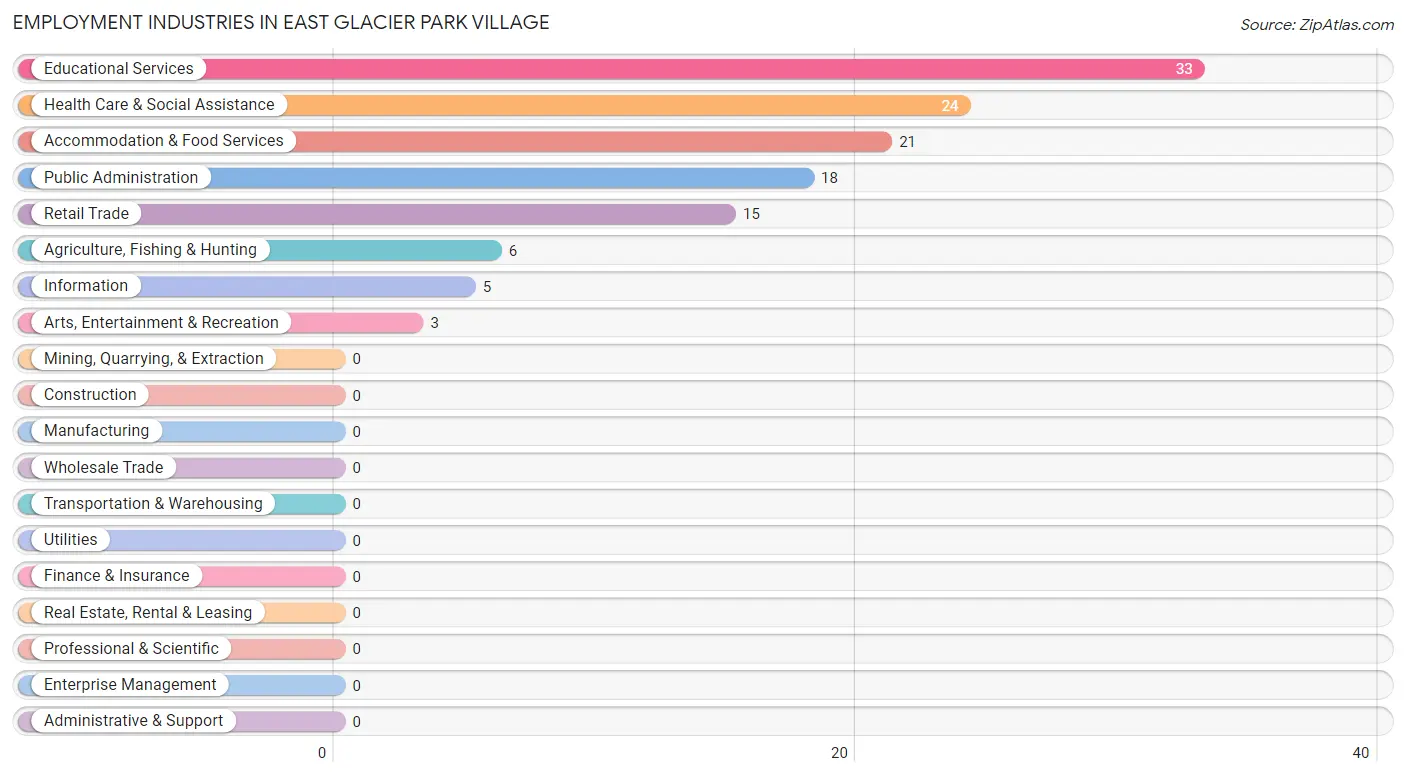
Employment Industries in East Glacier Park Village
The major employment industries in East Glacier Park Village include Educational Services (33 | 26.0%), Health Care & Social Assistance (24 | 18.9%), Accommodation & Food Services (21 | 16.5%), Public Administration (18 | 14.2%), and Retail Trade (15 | 11.8%).
Employment Industries by Sex in East Glacier Park Village
The East Glacier Park Village industries that see more men than women are Agriculture, Fishing & Hunting (100.0%), Information (100.0%), and Retail Trade (66.7%), whereas the industries that tend to have a higher number of women are Arts, Entertainment & Recreation (100.0%), Health Care & Social Assistance (62.5%), and Accommodation & Food Services (61.9%).
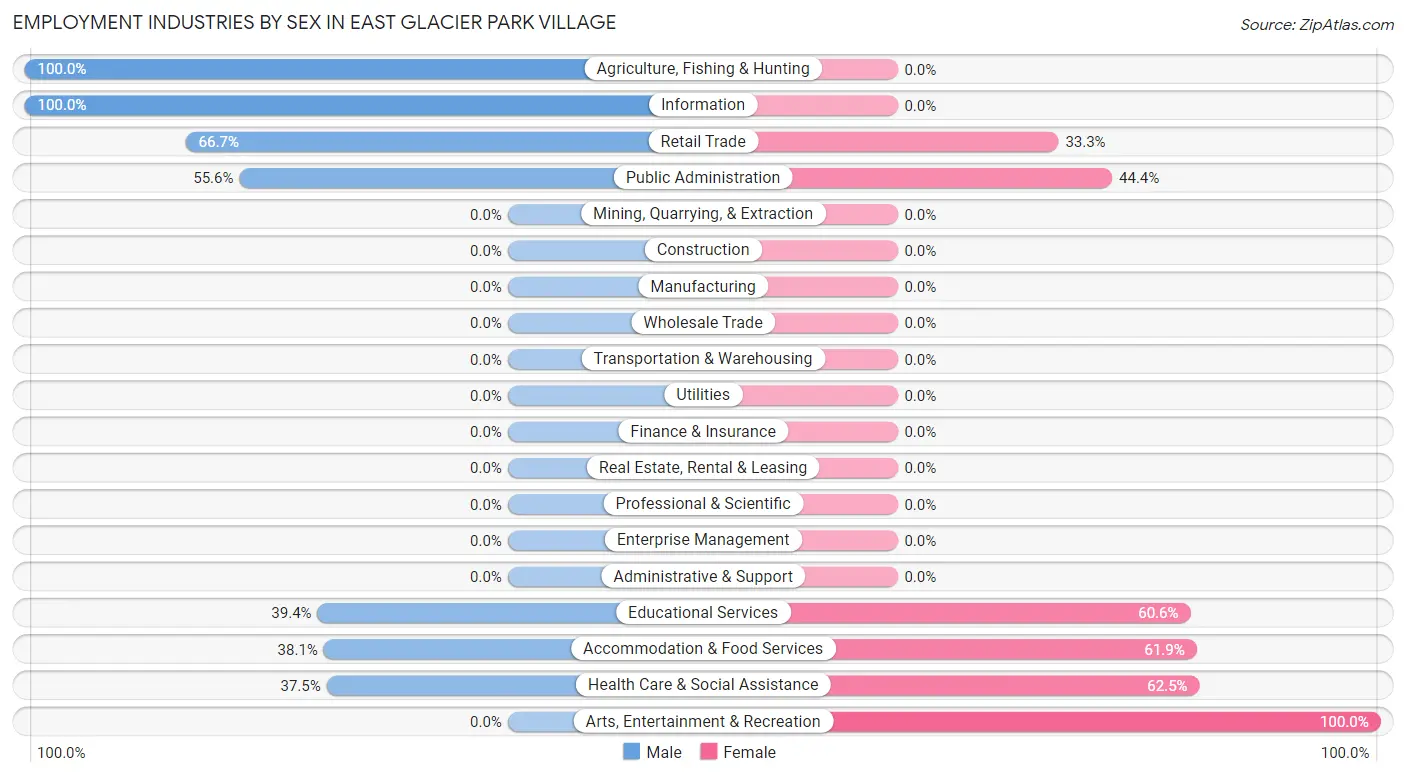
| Industry | Male | Female |
| Agriculture, Fishing & Hunting | 6 (100.0%) | 0 (0.0%) |
| Mining, Quarrying, & Extraction | 0 (0.0%) | 0 (0.0%) |
| Construction | 0 (0.0%) | 0 (0.0%) |
| Manufacturing | 0 (0.0%) | 0 (0.0%) |
| Wholesale Trade | 0 (0.0%) | 0 (0.0%) |
| Retail Trade | 10 (66.7%) | 5 (33.3%) |
| Transportation & Warehousing | 0 (0.0%) | 0 (0.0%) |
| Utilities | 0 (0.0%) | 0 (0.0%) |
| Information | 5 (100.0%) | 0 (0.0%) |
| Finance & Insurance | 0 (0.0%) | 0 (0.0%) |
| Real Estate, Rental & Leasing | 0 (0.0%) | 0 (0.0%) |
| Professional & Scientific | 0 (0.0%) | 0 (0.0%) |
| Enterprise Management | 0 (0.0%) | 0 (0.0%) |
| Administrative & Support | 0 (0.0%) | 0 (0.0%) |
| Educational Services | 13 (39.4%) | 20 (60.6%) |
| Health Care & Social Assistance | 9 (37.5%) | 15 (62.5%) |
| Arts, Entertainment & Recreation | 0 (0.0%) | 3 (100.0%) |
| Accommodation & Food Services | 8 (38.1%) | 13 (61.9%) |
| Public Administration | 10 (55.6%) | 8 (44.4%) |
| Total | 63 (49.6%) | 64 (50.4%) |
Education in East Glacier Park Village
School Enrollment in East Glacier Park Village
The most common levels of schooling among the 28 students in East Glacier Park Village are middle school (12 | 42.9%), high school (8 | 28.6%), and kindergarten (5 | 17.9%).
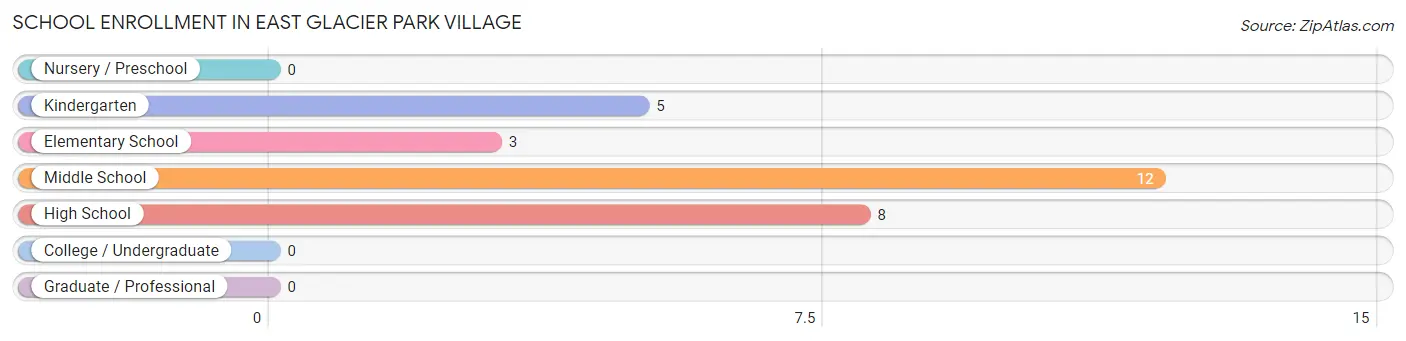
| School Level | # Students | % Students |
| Nursery / Preschool | 0 | 0.0% |
| Kindergarten | 5 | 17.9% |
| Elementary School | 3 | 10.7% |
| Middle School | 12 | 42.9% |
| High School | 8 | 28.6% |
| College / Undergraduate | 0 | 0.0% |
| Graduate / Professional | 0 | 0.0% |
| Total | 28 | 100.0% |
School Enrollment by Age by Funding Source in East Glacier Park Village
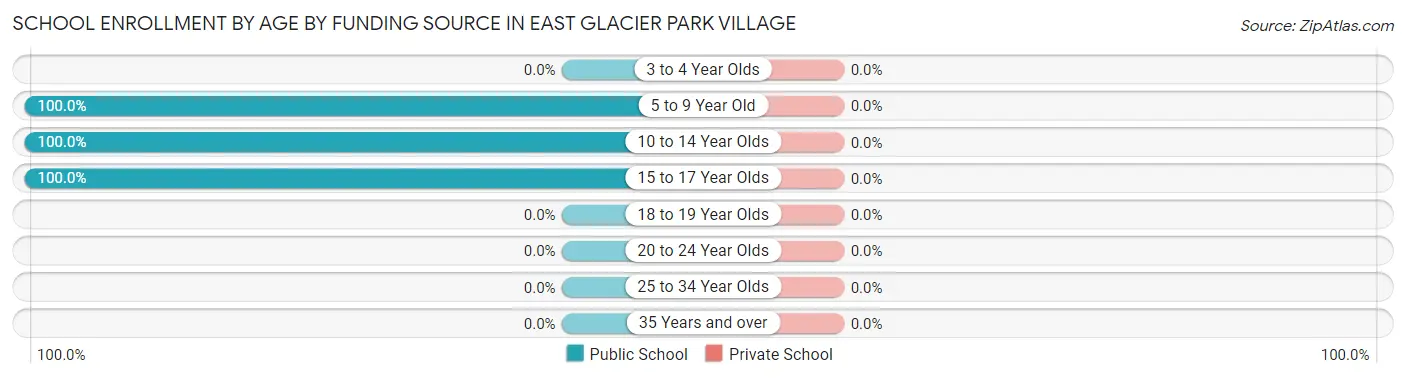
| Age Bracket | Public School | Private School |
| 3 to 4 Year Olds | 0 (0.0%) | 0 (0.0%) |
| 5 to 9 Year Old | 8 (100.0%) | 0 (0.0%) |
| 10 to 14 Year Olds | 17 (100.0%) | 0 (0.0%) |
| 15 to 17 Year Olds | 3 (100.0%) | 0 (0.0%) |
| 18 to 19 Year Olds | 0 (0.0%) | 0 (0.0%) |
| 20 to 24 Year Olds | 0 (0.0%) | 0 (0.0%) |
| 25 to 34 Year Olds | 0 (0.0%) | 0 (0.0%) |
| 35 Years and over | 0 (0.0%) | 0 (0.0%) |
| Total | 28 (100.0%) | 0 (0.0%) |
Educational Attainment by Field of Study in East Glacier Park Village
Education (28 | 20.9%), social sciences (18 | 13.4%), arts & humanities (17 | 12.7%), bio, nature & agricultural (15 | 11.2%), and science & technology (15 | 11.2%) are the most common fields of study among 134 individuals in East Glacier Park Village who have obtained a bachelor's degree or higher.
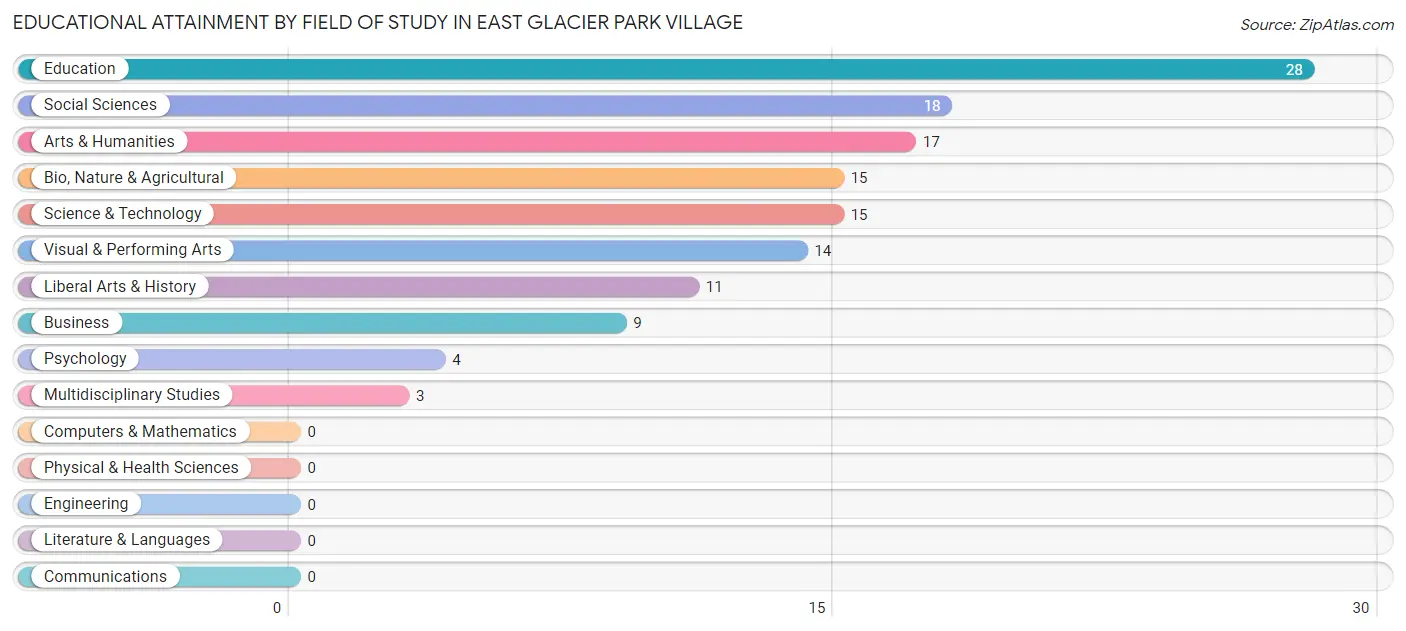
| Field of Study | # Graduates | % Graduates |
| Computers & Mathematics | 0 | 0.0% |
| Bio, Nature & Agricultural | 15 | 11.2% |
| Physical & Health Sciences | 0 | 0.0% |
| Psychology | 4 | 3.0% |
| Social Sciences | 18 | 13.4% |
| Engineering | 0 | 0.0% |
| Multidisciplinary Studies | 3 | 2.2% |
| Science & Technology | 15 | 11.2% |
| Business | 9 | 6.7% |
| Education | 28 | 20.9% |
| Literature & Languages | 0 | 0.0% |
| Liberal Arts & History | 11 | 8.2% |
| Visual & Performing Arts | 14 | 10.4% |
| Communications | 0 | 0.0% |
| Arts & Humanities | 17 | 12.7% |
| Total | 134 | 100.0% |
Transportation & Commute in East Glacier Park Village
Vehicle Availability by Sex in East Glacier Park Village
The most prevalent vehicle ownership categories in East Glacier Park Village are males with 2 vehicles (28, accounting for 44.4%) and females with 2 vehicles (22, making up 44.4%).
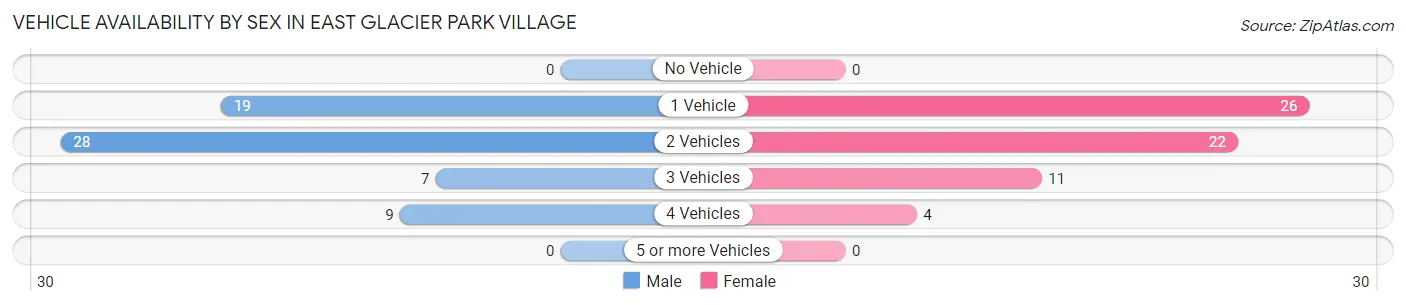
| Vehicles Available | Male | Female |
| No Vehicle | 0 (0.0%) | 0 (0.0%) |
| 1 Vehicle | 19 (30.2%) | 26 (41.3%) |
| 2 Vehicles | 28 (44.4%) | 22 (34.9%) |
| 3 Vehicles | 7 (11.1%) | 11 (17.5%) |
| 4 Vehicles | 9 (14.3%) | 4 (6.4%) |
| 5 or more Vehicles | 0 (0.0%) | 0 (0.0%) |
| Total | 63 (100.0%) | 63 (100.0%) |
Commute Time in East Glacier Park Village
The most frequently occuring commute durations in East Glacier Park Village are 30 to 34 minutes (37 commuters, 33.3%), 20 to 24 minutes (23 commuters, 20.7%), and 10 to 14 minutes (17 commuters, 15.3%).
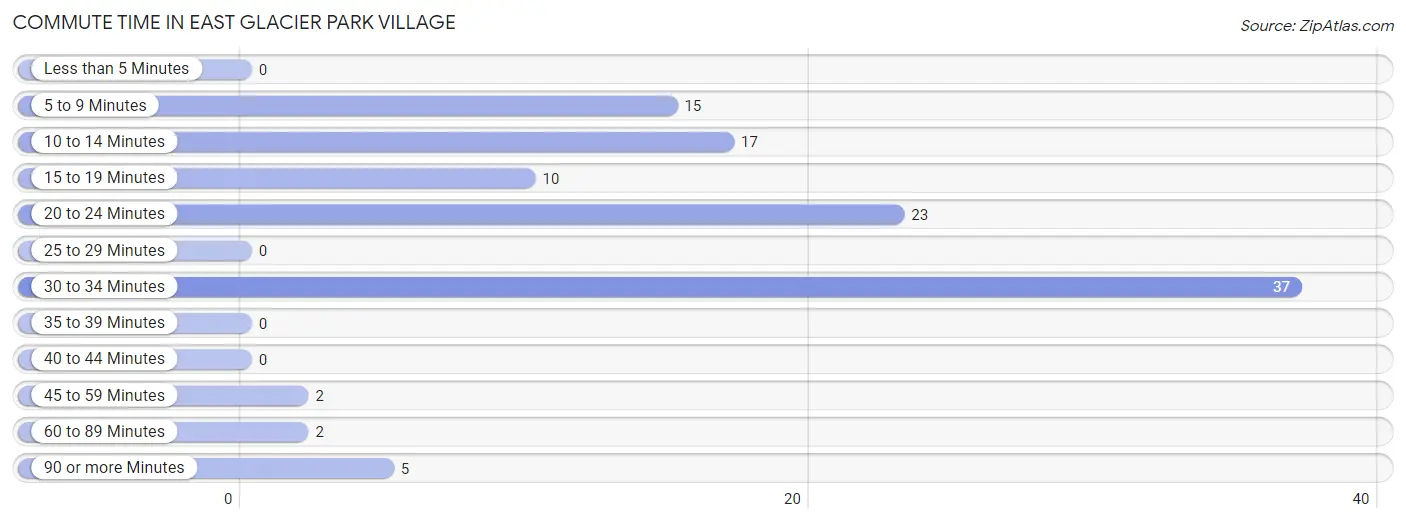
| Commute Time | # Commuters | % Commuters |
| Less than 5 Minutes | 0 | 0.0% |
| 5 to 9 Minutes | 15 | 13.5% |
| 10 to 14 Minutes | 17 | 15.3% |
| 15 to 19 Minutes | 10 | 9.0% |
| 20 to 24 Minutes | 23 | 20.7% |
| 25 to 29 Minutes | 0 | 0.0% |
| 30 to 34 Minutes | 37 | 33.3% |
| 35 to 39 Minutes | 0 | 0.0% |
| 40 to 44 Minutes | 0 | 0.0% |
| 45 to 59 Minutes | 2 | 1.8% |
| 60 to 89 Minutes | 2 | 1.8% |
| 90 or more Minutes | 5 | 4.5% |
Commute Time by Sex in East Glacier Park Village
The most common commute times in East Glacier Park Village are 30 to 34 minutes (26 commuters, 44.1%) for males and 20 to 24 minutes (19 commuters, 36.5%) for females.
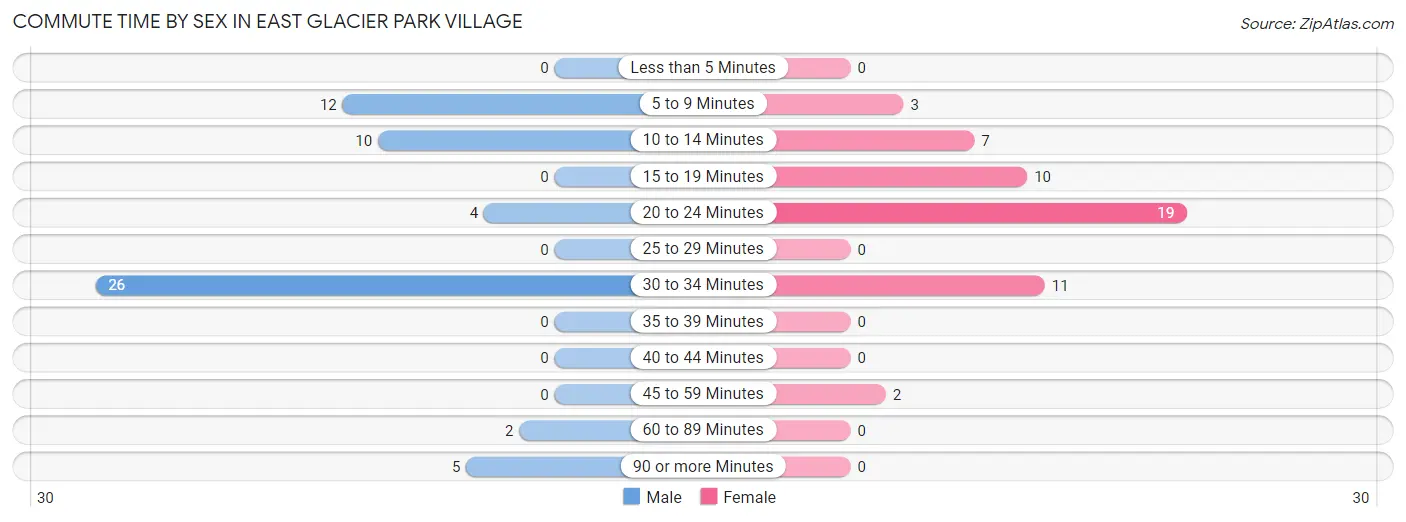
| Commute Time | Male | Female |
| Less than 5 Minutes | 0 (0.0%) | 0 (0.0%) |
| 5 to 9 Minutes | 12 (20.3%) | 3 (5.8%) |
| 10 to 14 Minutes | 10 (17.0%) | 7 (13.5%) |
| 15 to 19 Minutes | 0 (0.0%) | 10 (19.2%) |
| 20 to 24 Minutes | 4 (6.8%) | 19 (36.5%) |
| 25 to 29 Minutes | 0 (0.0%) | 0 (0.0%) |
| 30 to 34 Minutes | 26 (44.1%) | 11 (21.1%) |
| 35 to 39 Minutes | 0 (0.0%) | 0 (0.0%) |
| 40 to 44 Minutes | 0 (0.0%) | 0 (0.0%) |
| 45 to 59 Minutes | 0 (0.0%) | 2 (3.8%) |
| 60 to 89 Minutes | 2 (3.4%) | 0 (0.0%) |
| 90 or more Minutes | 5 (8.5%) | 0 (0.0%) |
Time of Departure to Work by Sex in East Glacier Park Village
The most frequent times of departure to work in East Glacier Park Village are 6:30 AM to 6:59 AM (12, 20.3%) for males and 7:30 AM to 7:59 AM (20, 38.5%) for females.
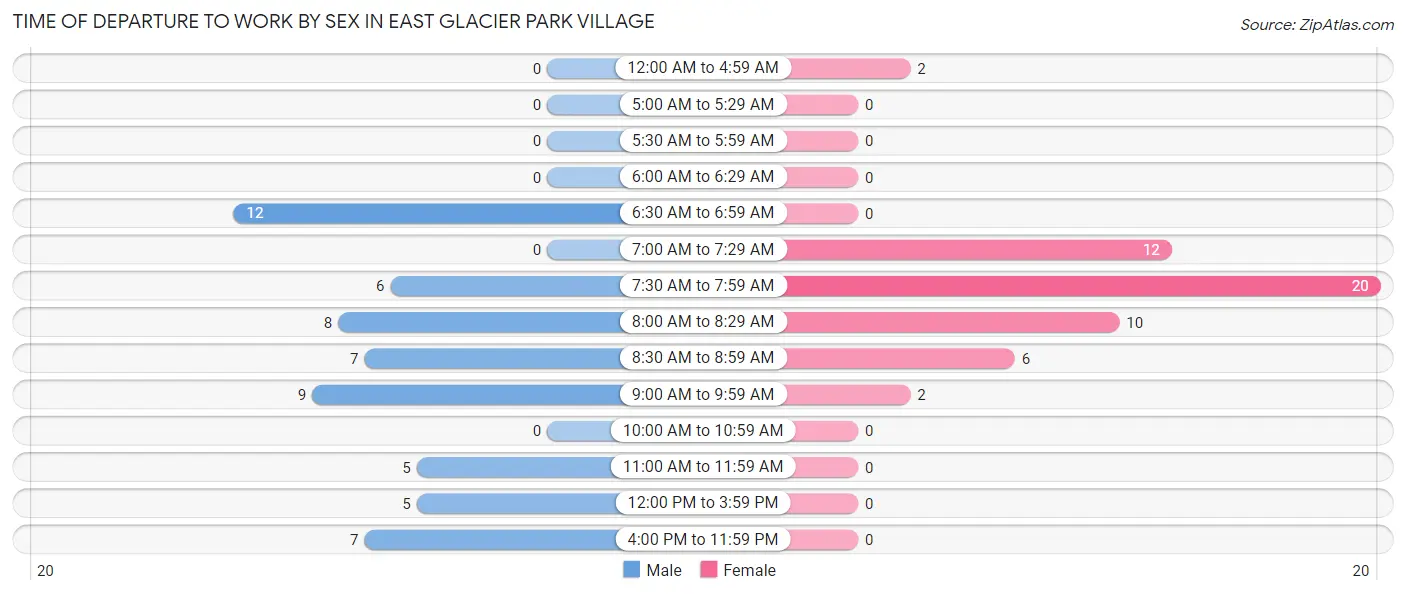
| Time of Departure | Male | Female |
| 12:00 AM to 4:59 AM | 0 (0.0%) | 2 (3.8%) |
| 5:00 AM to 5:29 AM | 0 (0.0%) | 0 (0.0%) |
| 5:30 AM to 5:59 AM | 0 (0.0%) | 0 (0.0%) |
| 6:00 AM to 6:29 AM | 0 (0.0%) | 0 (0.0%) |
| 6:30 AM to 6:59 AM | 12 (20.3%) | 0 (0.0%) |
| 7:00 AM to 7:29 AM | 0 (0.0%) | 12 (23.1%) |
| 7:30 AM to 7:59 AM | 6 (10.2%) | 20 (38.5%) |
| 8:00 AM to 8:29 AM | 8 (13.6%) | 10 (19.2%) |
| 8:30 AM to 8:59 AM | 7 (11.9%) | 6 (11.5%) |
| 9:00 AM to 9:59 AM | 9 (15.2%) | 2 (3.8%) |
| 10:00 AM to 10:59 AM | 0 (0.0%) | 0 (0.0%) |
| 11:00 AM to 11:59 AM | 5 (8.5%) | 0 (0.0%) |
| 12:00 PM to 3:59 PM | 5 (8.5%) | 0 (0.0%) |
| 4:00 PM to 11:59 PM | 7 (11.9%) | 0 (0.0%) |
| Total | 59 (100.0%) | 52 (100.0%) |
Housing Occupancy in East Glacier Park Village
Occupancy by Ownership in East Glacier Park Village
Of the total 136 dwellings in East Glacier Park Village, owner-occupied units account for 95 (69.9%), while renter-occupied units make up 41 (30.1%).
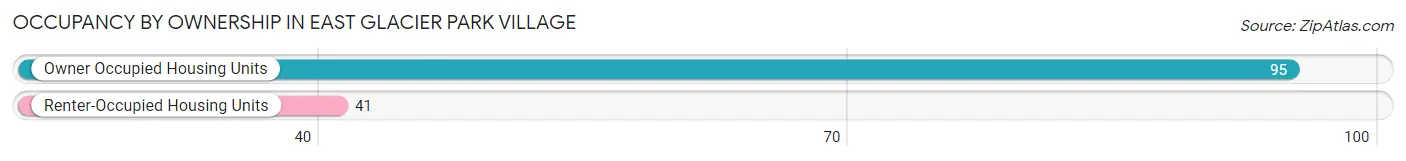
| Occupancy | # Housing Units | % Housing Units |
| Owner Occupied Housing Units | 95 | 69.9% |
| Renter-Occupied Housing Units | 41 | 30.1% |
| Total Occupied Housing Units | 136 | 100.0% |
Occupancy by Household Size in East Glacier Park Village
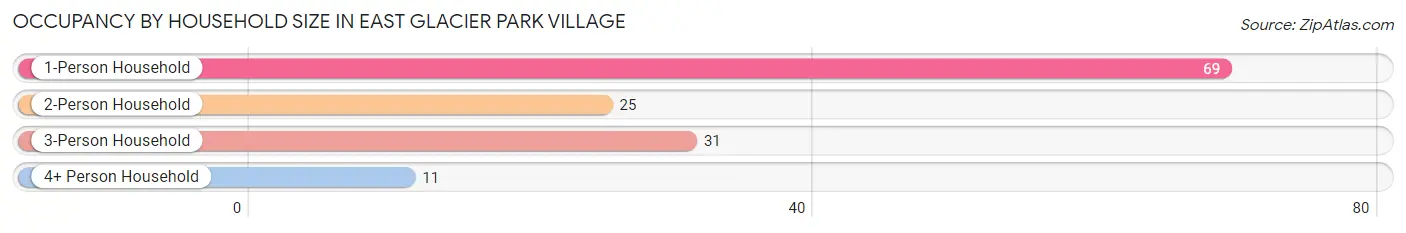
| Household Size | # Housing Units | % Housing Units |
| 1-Person Household | 69 | 50.7% |
| 2-Person Household | 25 | 18.4% |
| 3-Person Household | 31 | 22.8% |
| 4+ Person Household | 11 | 8.1% |
| Total Housing Units | 136 | 100.0% |
Occupancy by Ownership by Household Size in East Glacier Park Village
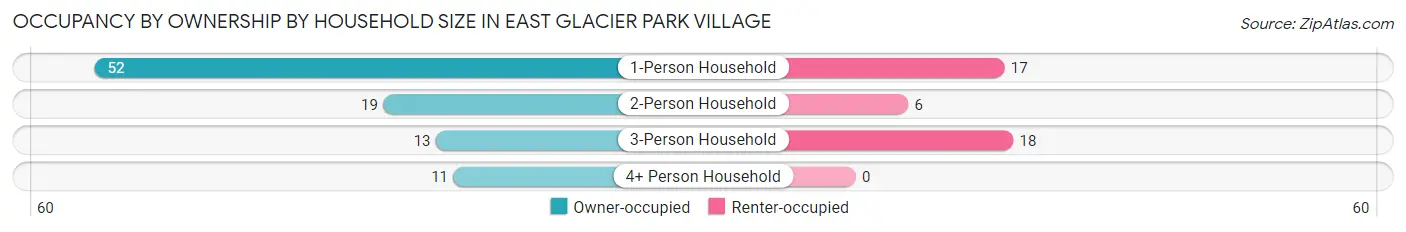
| Household Size | Owner-occupied | Renter-occupied |
| 1-Person Household | 52 (75.4%) | 17 (24.6%) |
| 2-Person Household | 19 (76.0%) | 6 (24.0%) |
| 3-Person Household | 13 (41.9%) | 18 (58.1%) |
| 4+ Person Household | 11 (100.0%) | 0 (0.0%) |
| Total Housing Units | 95 (69.9%) | 41 (30.1%) |
Occupancy by Educational Attainment in East Glacier Park Village
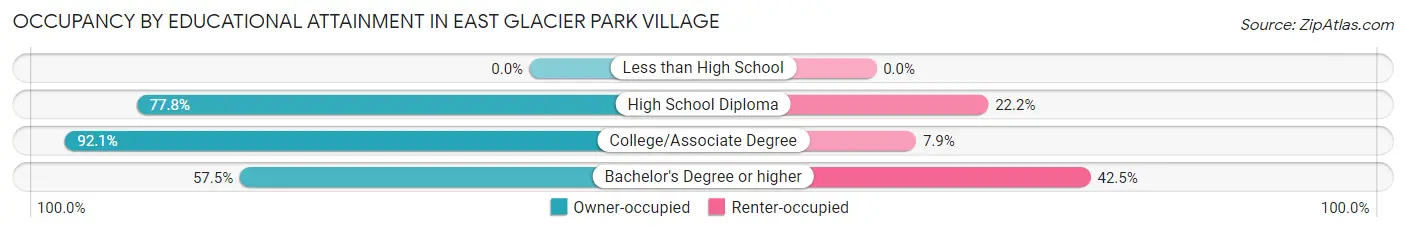
| Household Size | Owner-occupied | Renter-occupied |
| Less than High School | 0 (0.0%) | 0 (0.0%) |
| High School Diploma | 14 (77.8%) | 4 (22.2%) |
| College/Associate Degree | 35 (92.1%) | 3 (7.9%) |
| Bachelor's Degree or higher | 46 (57.5%) | 34 (42.5%) |
Occupancy by Age of Householder in East Glacier Park Village
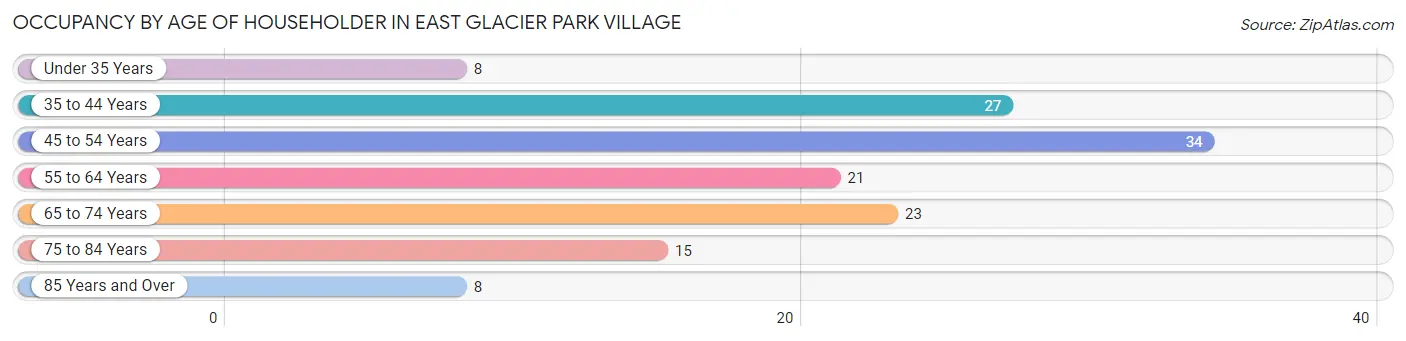
| Age Bracket | # Households | % Households |
| Under 35 Years | 8 | 5.9% |
| 35 to 44 Years | 27 | 19.9% |
| 45 to 54 Years | 34 | 25.0% |
| 55 to 64 Years | 21 | 15.4% |
| 65 to 74 Years | 23 | 16.9% |
| 75 to 84 Years | 15 | 11.0% |
| 85 Years and Over | 8 | 5.9% |
| Total | 136 | 100.0% |
Housing Finances in East Glacier Park Village
Median Income by Occupancy in East Glacier Park Village
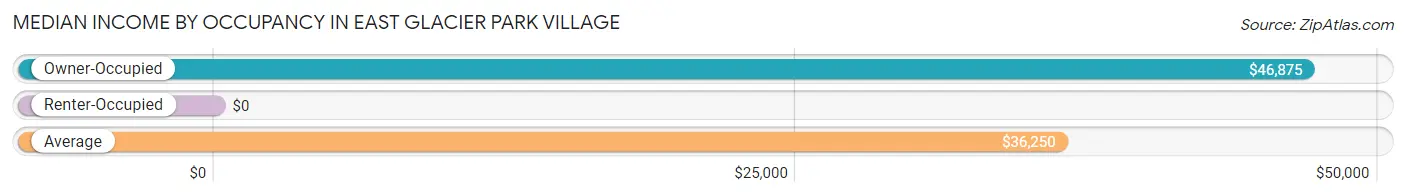
| Occupancy Type | # Households | Median Income |
| Owner-Occupied | 95 (69.9%) | $46,875 |
| Renter-Occupied | 41 (30.1%) | $0 |
| Average | 136 (100.0%) | $36,250 |
Occupancy by Householder Income Bracket in East Glacier Park Village
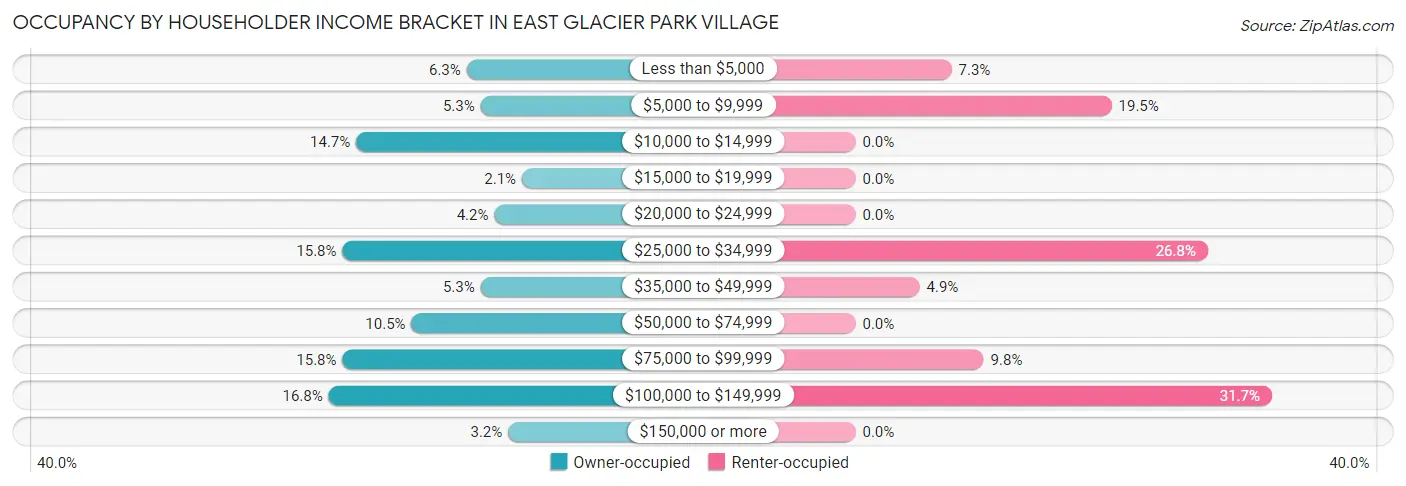
| Income Bracket | Owner-occupied | Renter-occupied |
| Less than $5,000 | 6 (6.3%) | 3 (7.3%) |
| $5,000 to $9,999 | 5 (5.3%) | 8 (19.5%) |
| $10,000 to $14,999 | 14 (14.7%) | 0 (0.0%) |
| $15,000 to $19,999 | 2 (2.1%) | 0 (0.0%) |
| $20,000 to $24,999 | 4 (4.2%) | 0 (0.0%) |
| $25,000 to $34,999 | 15 (15.8%) | 11 (26.8%) |
| $35,000 to $49,999 | 5 (5.3%) | 2 (4.9%) |
| $50,000 to $74,999 | 10 (10.5%) | 0 (0.0%) |
| $75,000 to $99,999 | 15 (15.8%) | 4 (9.8%) |
| $100,000 to $149,999 | 16 (16.8%) | 13 (31.7%) |
| $150,000 or more | 3 (3.2%) | 0 (0.0%) |
| Total | 95 (100.0%) | 41 (100.0%) |
Monthly Housing Cost Tiers in East Glacier Park Village
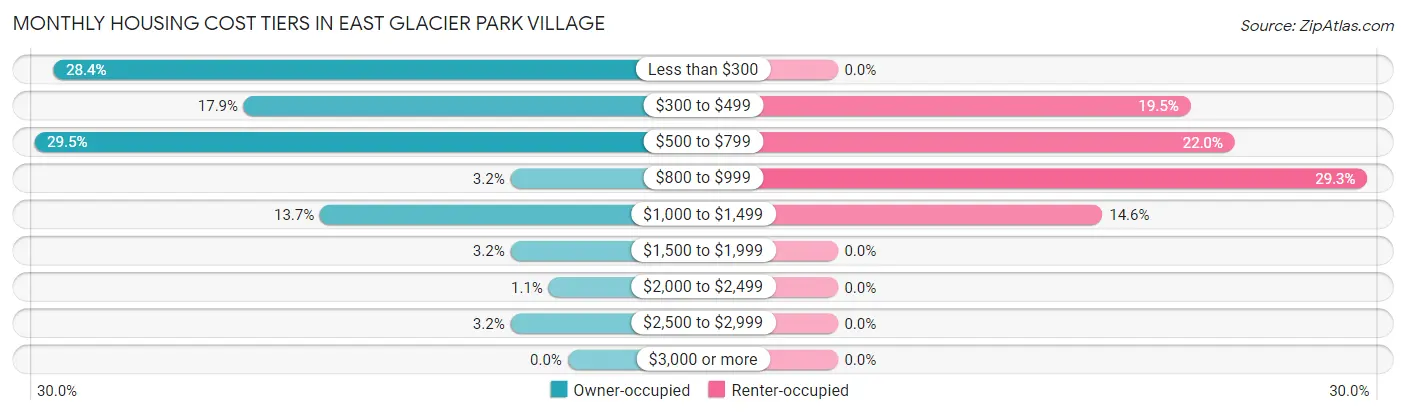
| Monthly Cost | Owner-occupied | Renter-occupied |
| Less than $300 | 27 (28.4%) | 0 (0.0%) |
| $300 to $499 | 17 (17.9%) | 8 (19.5%) |
| $500 to $799 | 28 (29.5%) | 9 (22.0%) |
| $800 to $999 | 3 (3.2%) | 12 (29.3%) |
| $1,000 to $1,499 | 13 (13.7%) | 6 (14.6%) |
| $1,500 to $1,999 | 3 (3.2%) | 0 (0.0%) |
| $2,000 to $2,499 | 1 (1.1%) | 0 (0.0%) |
| $2,500 to $2,999 | 3 (3.2%) | 0 (0.0%) |
| $3,000 or more | 0 (0.0%) | 0 (0.0%) |
| Total | 95 (100.0%) | 41 (100.0%) |
Physical Housing Characteristics in East Glacier Park Village
Housing Structures in East Glacier Park Village
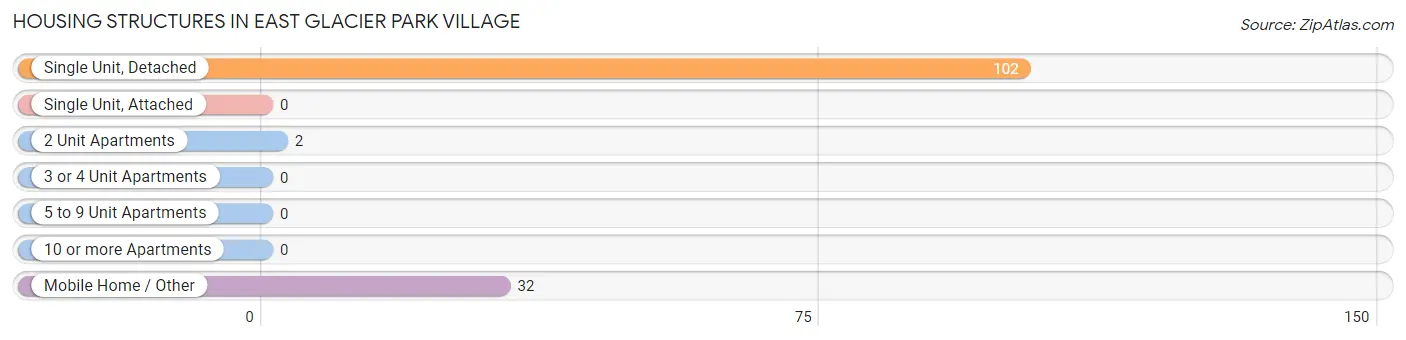
| Structure Type | # Housing Units | % Housing Units |
| Single Unit, Detached | 102 | 75.0% |
| Single Unit, Attached | 0 | 0.0% |
| 2 Unit Apartments | 2 | 1.5% |
| 3 or 4 Unit Apartments | 0 | 0.0% |
| 5 to 9 Unit Apartments | 0 | 0.0% |
| 10 or more Apartments | 0 | 0.0% |
| Mobile Home / Other | 32 | 23.5% |
| Total | 136 | 100.0% |
Housing Structures by Occupancy in East Glacier Park Village
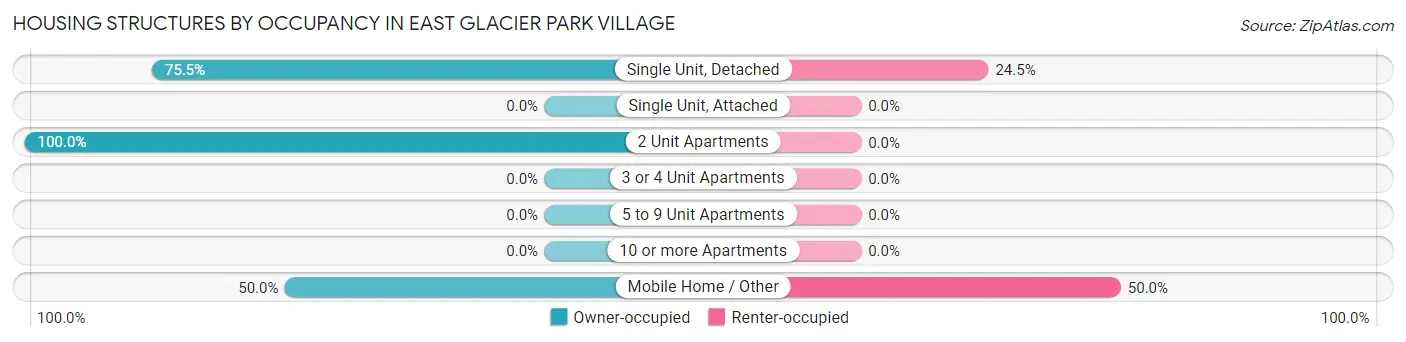
| Structure Type | Owner-occupied | Renter-occupied |
| Single Unit, Detached | 77 (75.5%) | 25 (24.5%) |
| Single Unit, Attached | 0 (0.0%) | 0 (0.0%) |
| 2 Unit Apartments | 2 (100.0%) | 0 (0.0%) |
| 3 or 4 Unit Apartments | 0 (0.0%) | 0 (0.0%) |
| 5 to 9 Unit Apartments | 0 (0.0%) | 0 (0.0%) |
| 10 or more Apartments | 0 (0.0%) | 0 (0.0%) |
| Mobile Home / Other | 16 (50.0%) | 16 (50.0%) |
| Total | 95 (69.9%) | 41 (30.1%) |
Housing Structures by Number of Rooms in East Glacier Park Village
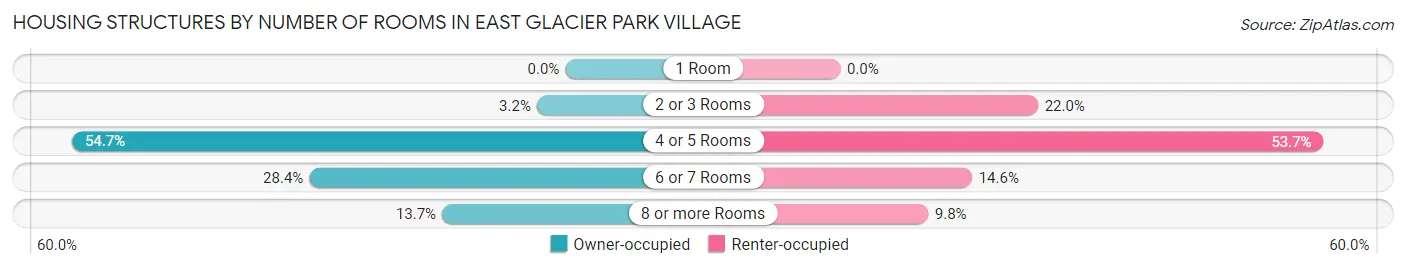
| Number of Rooms | Owner-occupied | Renter-occupied |
| 1 Room | 0 (0.0%) | 0 (0.0%) |
| 2 or 3 Rooms | 3 (3.2%) | 9 (22.0%) |
| 4 or 5 Rooms | 52 (54.7%) | 22 (53.7%) |
| 6 or 7 Rooms | 27 (28.4%) | 6 (14.6%) |
| 8 or more Rooms | 13 (13.7%) | 4 (9.8%) |
| Total | 95 (100.0%) | 41 (100.0%) |
Housing Structure by Heating Type in East Glacier Park Village
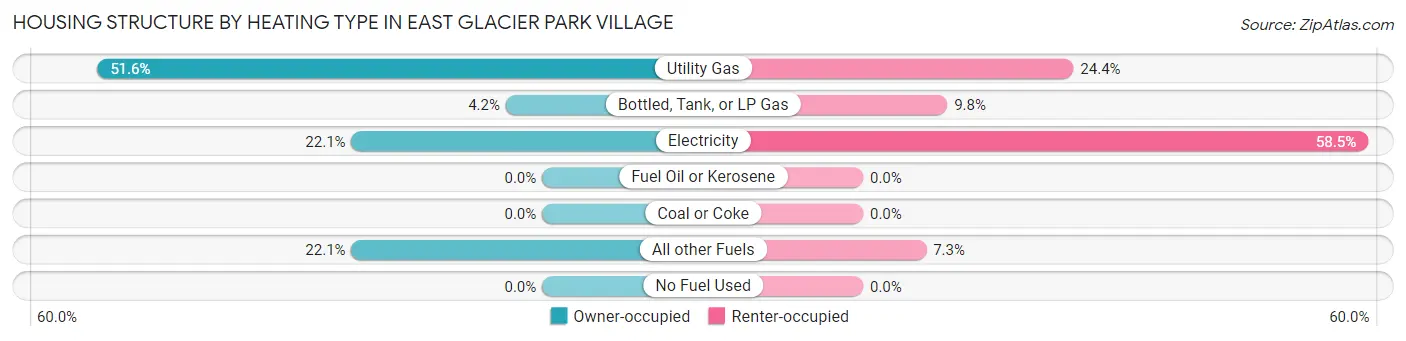
| Heating Type | Owner-occupied | Renter-occupied |
| Utility Gas | 49 (51.6%) | 10 (24.4%) |
| Bottled, Tank, or LP Gas | 4 (4.2%) | 4 (9.8%) |
| Electricity | 21 (22.1%) | 24 (58.5%) |
| Fuel Oil or Kerosene | 0 (0.0%) | 0 (0.0%) |
| Coal or Coke | 0 (0.0%) | 0 (0.0%) |
| All other Fuels | 21 (22.1%) | 3 (7.3%) |
| No Fuel Used | 0 (0.0%) | 0 (0.0%) |
| Total | 95 (100.0%) | 41 (100.0%) |
Household Vehicle Usage in East Glacier Park Village
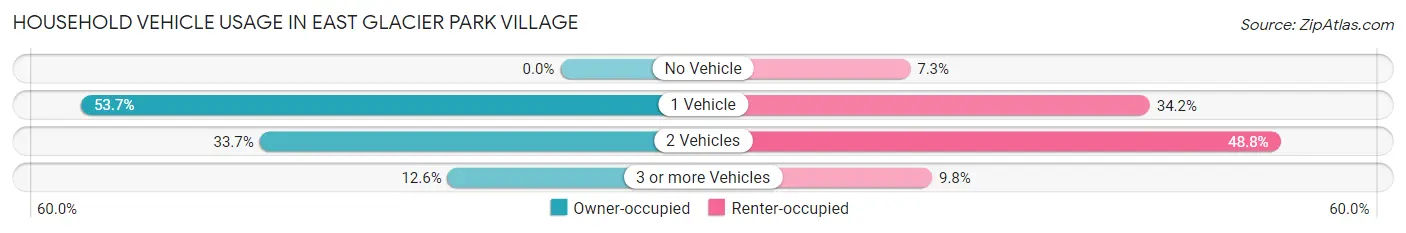
| Vehicles per Household | Owner-occupied | Renter-occupied |
| No Vehicle | 0 (0.0%) | 3 (7.3%) |
| 1 Vehicle | 51 (53.7%) | 14 (34.2%) |
| 2 Vehicles | 32 (33.7%) | 20 (48.8%) |
| 3 or more Vehicles | 12 (12.6%) | 4 (9.8%) |
| Total | 95 (100.0%) | 41 (100.0%) |
Real Estate & Mortgages in East Glacier Park Village
Real Estate and Mortgage Overview in East Glacier Park Village
| Characteristic | Without Mortgage | With Mortgage |
| Housing Units | 60 | 35 |
| Median Property Value | $159,400 | $156,300 |
| Median Household Income | $28,125 | $3 |
| Monthly Housing Costs | $325 | $0 |
| Real Estate Taxes | $1,286 | $0 |
Property Value by Mortgage Status in East Glacier Park Village
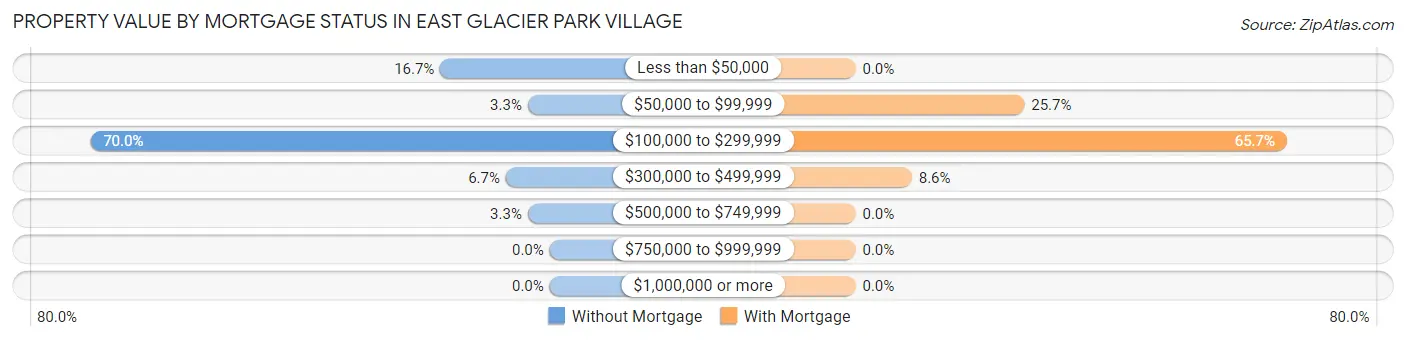
| Property Value | Without Mortgage | With Mortgage |
| Less than $50,000 | 10 (16.7%) | 0 (0.0%) |
| $50,000 to $99,999 | 2 (3.3%) | 9 (25.7%) |
| $100,000 to $299,999 | 42 (70.0%) | 23 (65.7%) |
| $300,000 to $499,999 | 4 (6.7%) | 3 (8.6%) |
| $500,000 to $749,999 | 2 (3.3%) | 0 (0.0%) |
| $750,000 to $999,999 | 0 (0.0%) | 0 (0.0%) |
| $1,000,000 or more | 0 (0.0%) | 0 (0.0%) |
| Total | 60 (100.0%) | 35 (100.0%) |
Household Income by Mortgage Status in East Glacier Park Village
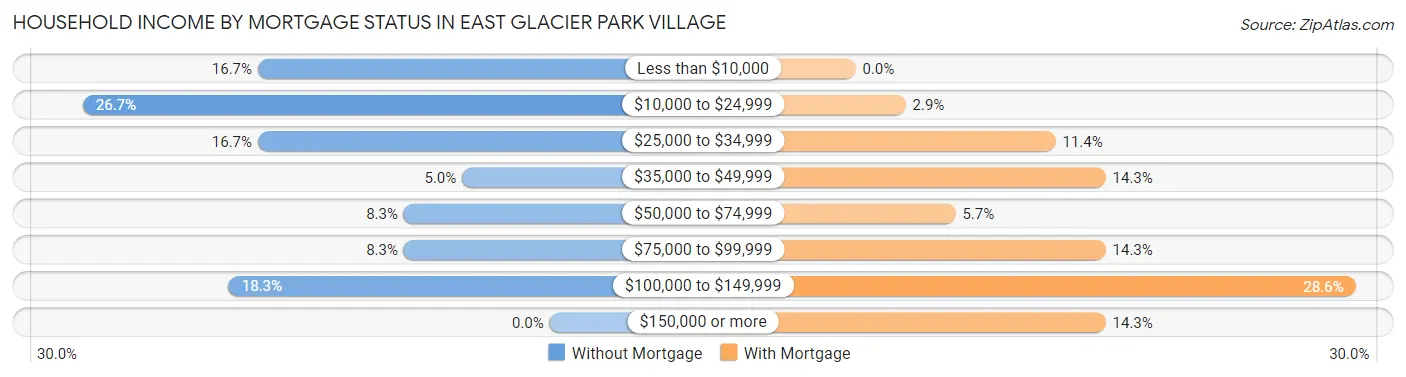
| Household Income | Without Mortgage | With Mortgage |
| Less than $10,000 | 10 (16.7%) | 0 (0.0%) |
| $10,000 to $24,999 | 16 (26.7%) | 1 (2.9%) |
| $25,000 to $34,999 | 10 (16.7%) | 4 (11.4%) |
| $35,000 to $49,999 | 3 (5.0%) | 5 (14.3%) |
| $50,000 to $74,999 | 5 (8.3%) | 2 (5.7%) |
| $75,000 to $99,999 | 5 (8.3%) | 5 (14.3%) |
| $100,000 to $149,999 | 11 (18.3%) | 10 (28.6%) |
| $150,000 or more | 0 (0.0%) | 5 (14.3%) |
| Total | 60 (100.0%) | 35 (100.0%) |
Property Value to Household Income Ratio in East Glacier Park Village
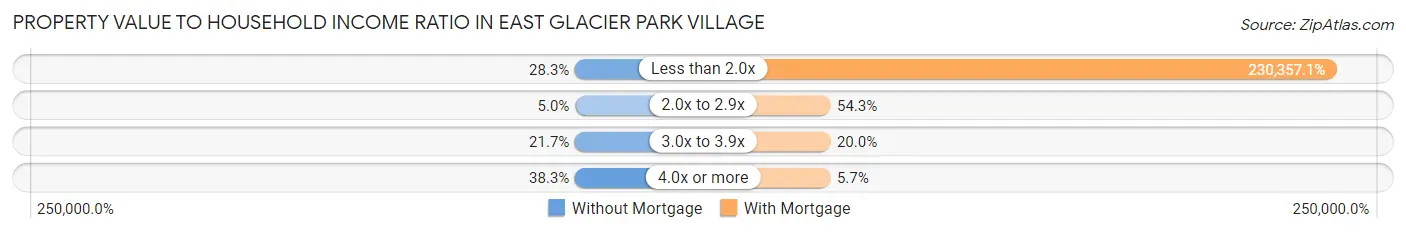
| Value-to-Income Ratio | Without Mortgage | With Mortgage |
| Less than 2.0x | 17 (28.3%) | 80,625 (230,357.1%) |
| 2.0x to 2.9x | 3 (5.0%) | 19 (54.3%) |
| 3.0x to 3.9x | 13 (21.7%) | 7 (20.0%) |
| 4.0x or more | 23 (38.3%) | 2 (5.7%) |
| Total | 60 (100.0%) | 35 (100.0%) |
Real Estate Taxes by Mortgage Status in East Glacier Park Village
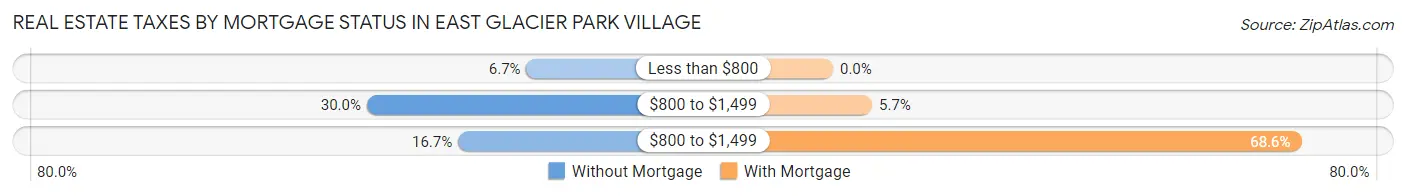
| Property Taxes | Without Mortgage | With Mortgage |
| Less than $800 | 4 (6.7%) | 0 (0.0%) |
| $800 to $1,499 | 18 (30.0%) | 2 (5.7%) |
| $800 to $1,499 | 10 (16.7%) | 24 (68.6%) |
| Total | 60 (100.0%) | 35 (100.0%) |
Health & Disability in East Glacier Park Village
Health Insurance Coverage by Age in East Glacier Park Village
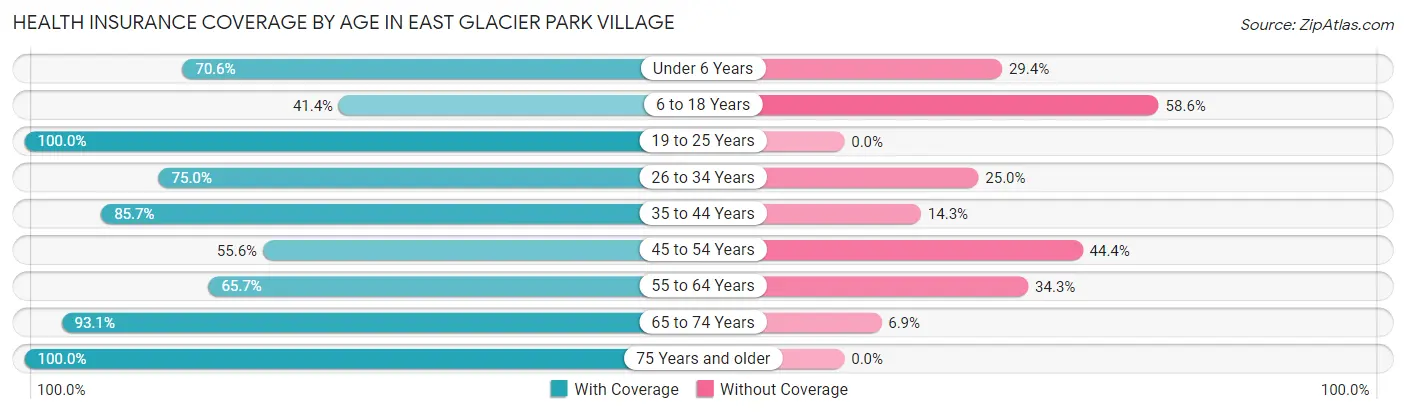
| Age Bracket | With Coverage | Without Coverage |
| Under 6 Years | 12 (70.6%) | 5 (29.4%) |
| 6 to 18 Years | 12 (41.4%) | 17 (58.6%) |
| 19 to 25 Years | 2 (100.0%) | 0 (0.0%) |
| 26 to 34 Years | 21 (75.0%) | 7 (25.0%) |
| 35 to 44 Years | 48 (85.7%) | 8 (14.3%) |
| 45 to 54 Years | 20 (55.6%) | 16 (44.4%) |
| 55 to 64 Years | 23 (65.7%) | 12 (34.3%) |
| 65 to 74 Years | 27 (93.1%) | 2 (6.9%) |
| 75 Years and older | 30 (100.0%) | 0 (0.0%) |
| Total | 195 (74.4%) | 67 (25.6%) |
Health Insurance Coverage by Citizenship Status in East Glacier Park Village
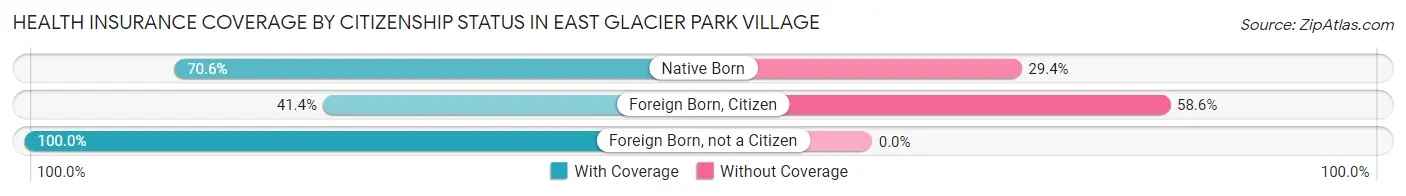
| Citizenship Status | With Coverage | Without Coverage |
| Native Born | 12 (70.6%) | 5 (29.4%) |
| Foreign Born, Citizen | 12 (41.4%) | 17 (58.6%) |
| Foreign Born, not a Citizen | 2 (100.0%) | 0 (0.0%) |
Health Insurance Coverage by Household Income in East Glacier Park Village
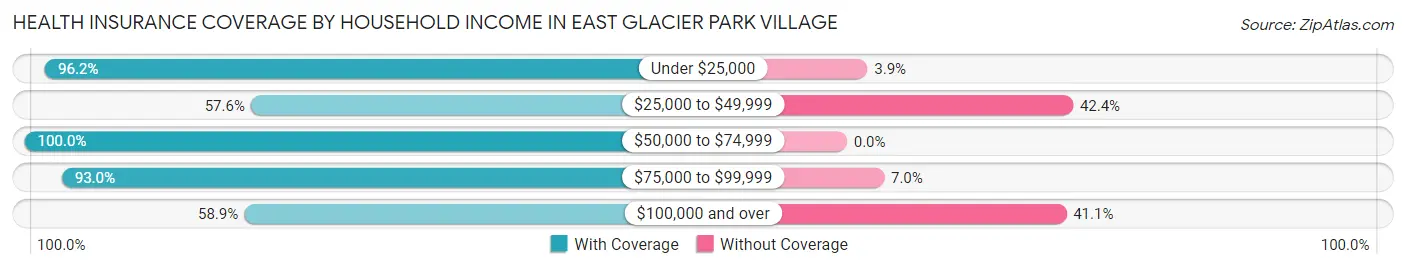
| Household Income | With Coverage | Without Coverage |
| Under $25,000 | 50 (96.2%) | 2 (3.8%) |
| $25,000 to $49,999 | 34 (57.6%) | 25 (42.4%) |
| $50,000 to $74,999 | 18 (100.0%) | 0 (0.0%) |
| $75,000 to $99,999 | 40 (93.0%) | 3 (7.0%) |
| $100,000 and over | 53 (58.9%) | 37 (41.1%) |
Public vs Private Health Insurance Coverage by Age in East Glacier Park Village
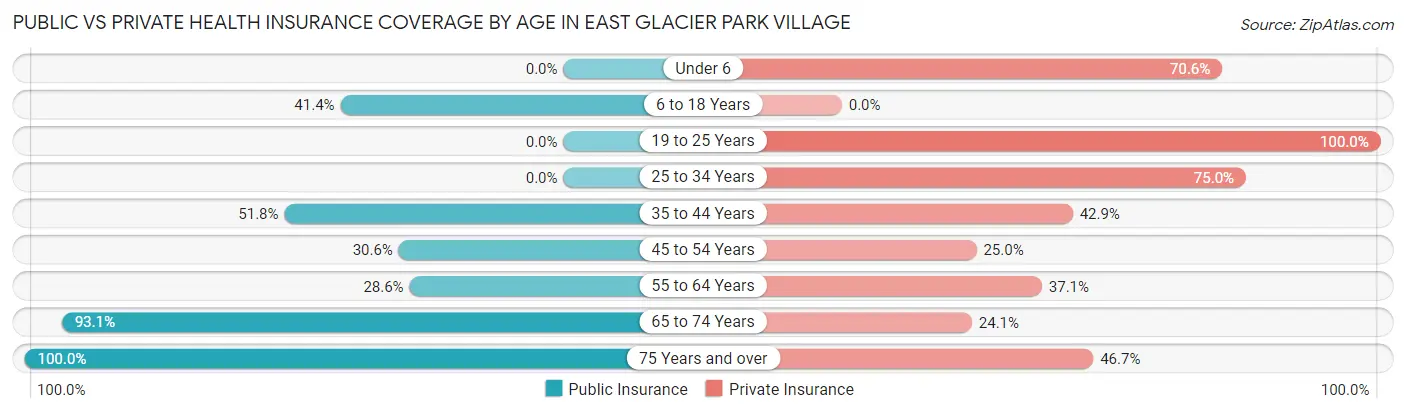
| Age Bracket | Public Insurance | Private Insurance |
| Under 6 | 0 (0.0%) | 12 (70.6%) |
| 6 to 18 Years | 12 (41.4%) | 0 (0.0%) |
| 19 to 25 Years | 0 (0.0%) | 2 (100.0%) |
| 25 to 34 Years | 0 (0.0%) | 21 (75.0%) |
| 35 to 44 Years | 29 (51.8%) | 24 (42.9%) |
| 45 to 54 Years | 11 (30.6%) | 9 (25.0%) |
| 55 to 64 Years | 10 (28.6%) | 13 (37.1%) |
| 65 to 74 Years | 27 (93.1%) | 7 (24.1%) |
| 75 Years and over | 30 (100.0%) | 14 (46.7%) |
| Total | 119 (45.4%) | 102 (38.9%) |
Disability Status by Sex by Age in East Glacier Park Village
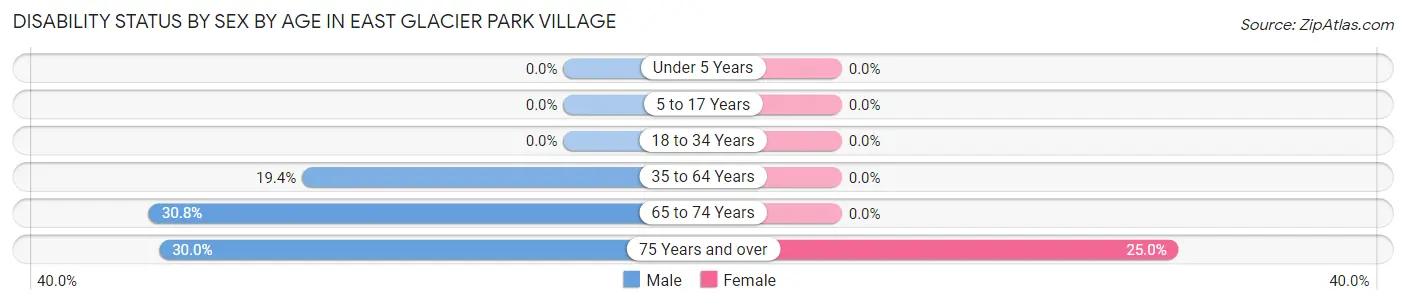
| Age Bracket | Male | Female |
| Under 5 Years | 0 (0.0%) | 0 (0.0%) |
| 5 to 17 Years | 0 (0.0%) | 0 (0.0%) |
| 18 to 34 Years | 0 (0.0%) | 0 (0.0%) |
| 35 to 64 Years | 13 (19.4%) | 0 (0.0%) |
| 65 to 74 Years | 4 (30.8%) | 0 (0.0%) |
| 75 Years and over | 3 (30.0%) | 5 (25.0%) |
Disability Class by Sex by Age in East Glacier Park Village
Disability Class: Hearing Difficulty
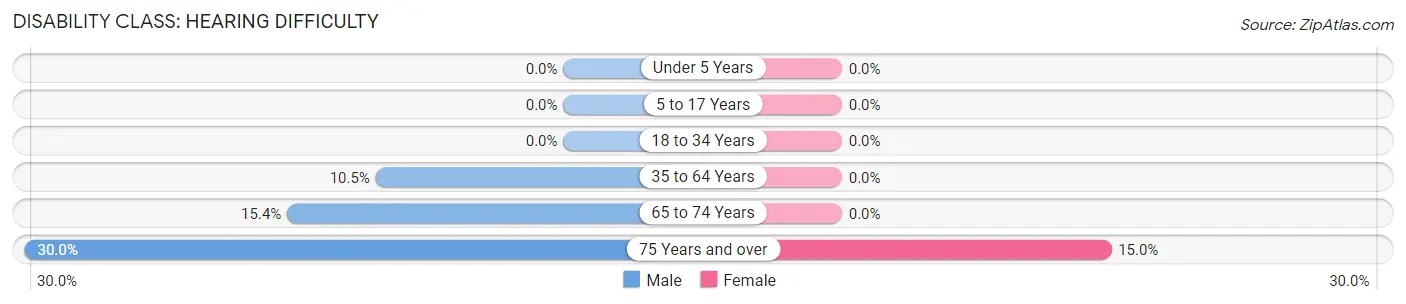
| Age Bracket | Male | Female |
| Under 5 Years | 0 (0.0%) | 0 (0.0%) |
| 5 to 17 Years | 0 (0.0%) | 0 (0.0%) |
| 18 to 34 Years | 0 (0.0%) | 0 (0.0%) |
| 35 to 64 Years | 7 (10.4%) | 0 (0.0%) |
| 65 to 74 Years | 2 (15.4%) | 0 (0.0%) |
| 75 Years and over | 3 (30.0%) | 3 (15.0%) |
Disability Class: Vision Difficulty
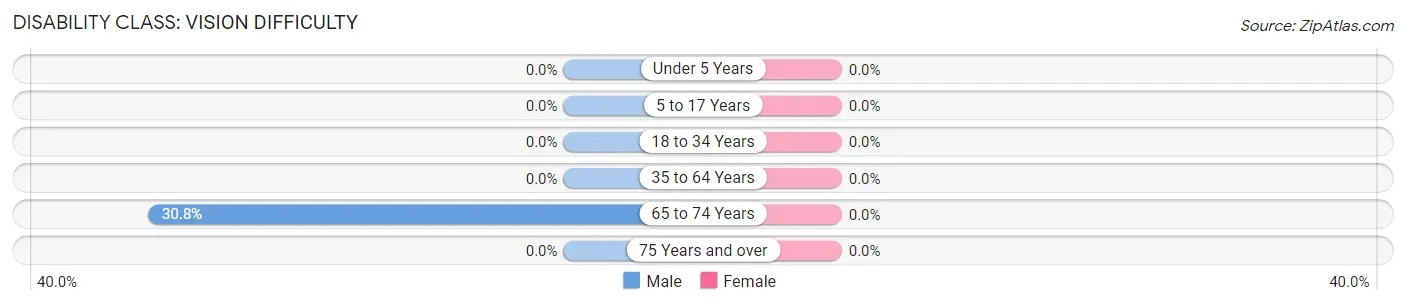
| Age Bracket | Male | Female |
| Under 5 Years | 0 (0.0%) | 0 (0.0%) |
| 5 to 17 Years | 0 (0.0%) | 0 (0.0%) |
| 18 to 34 Years | 0 (0.0%) | 0 (0.0%) |
| 35 to 64 Years | 0 (0.0%) | 0 (0.0%) |
| 65 to 74 Years | 4 (30.8%) | 0 (0.0%) |
| 75 Years and over | 0 (0.0%) | 0 (0.0%) |
Disability Class: Cognitive Difficulty
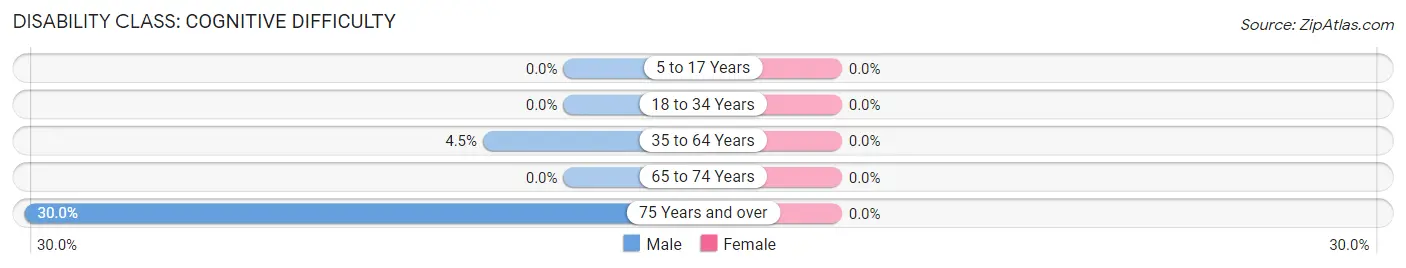
| Age Bracket | Male | Female |
| 5 to 17 Years | 0 (0.0%) | 0 (0.0%) |
| 18 to 34 Years | 0 (0.0%) | 0 (0.0%) |
| 35 to 64 Years | 3 (4.5%) | 0 (0.0%) |
| 65 to 74 Years | 0 (0.0%) | 0 (0.0%) |
| 75 Years and over | 3 (30.0%) | 0 (0.0%) |
Disability Class: Ambulatory Difficulty
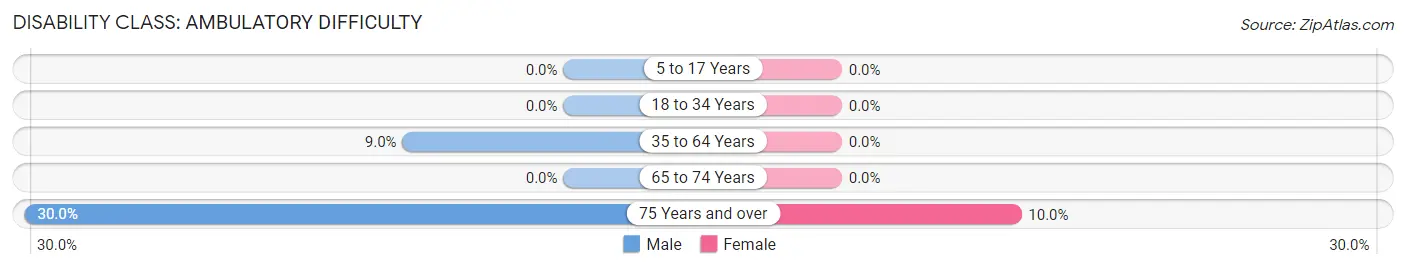
| Age Bracket | Male | Female |
| 5 to 17 Years | 0 (0.0%) | 0 (0.0%) |
| 18 to 34 Years | 0 (0.0%) | 0 (0.0%) |
| 35 to 64 Years | 6 (9.0%) | 0 (0.0%) |
| 65 to 74 Years | 0 (0.0%) | 0 (0.0%) |
| 75 Years and over | 3 (30.0%) | 2 (10.0%) |
Disability Class: Self-Care Difficulty
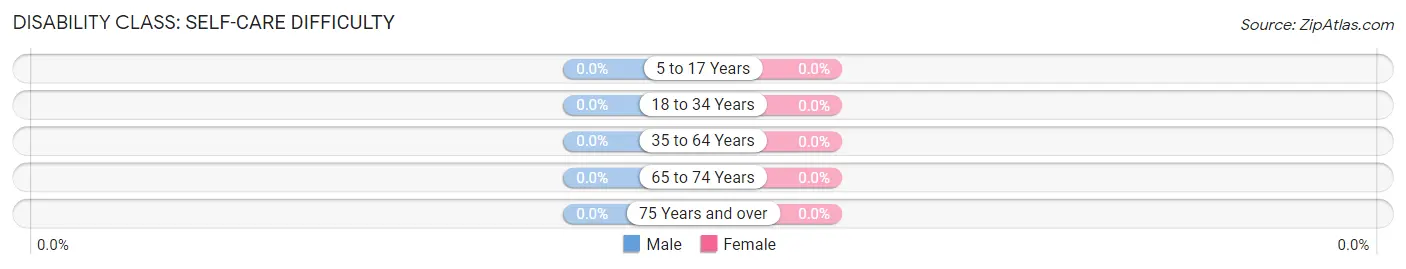
| Age Bracket | Male | Female |
| 5 to 17 Years | 0 (0.0%) | 0 (0.0%) |
| 18 to 34 Years | 0 (0.0%) | 0 (0.0%) |
| 35 to 64 Years | 0 (0.0%) | 0 (0.0%) |
| 65 to 74 Years | 0 (0.0%) | 0 (0.0%) |
| 75 Years and over | 0 (0.0%) | 0 (0.0%) |
Technology Access in East Glacier Park Village
Computing Device Access in East Glacier Park Village
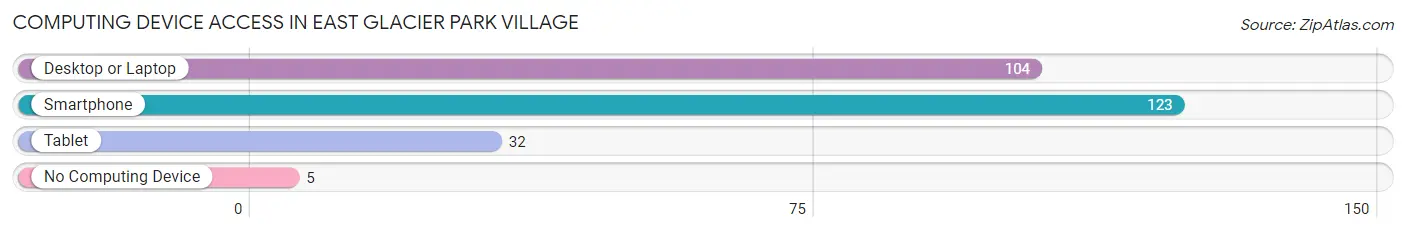
| Device Type | # Households | % Households |
| Desktop or Laptop | 104 | 76.5% |
| Smartphone | 123 | 90.4% |
| Tablet | 32 | 23.5% |
| No Computing Device | 5 | 3.7% |
| Total | 136 | 100.0% |
Internet Access in East Glacier Park Village
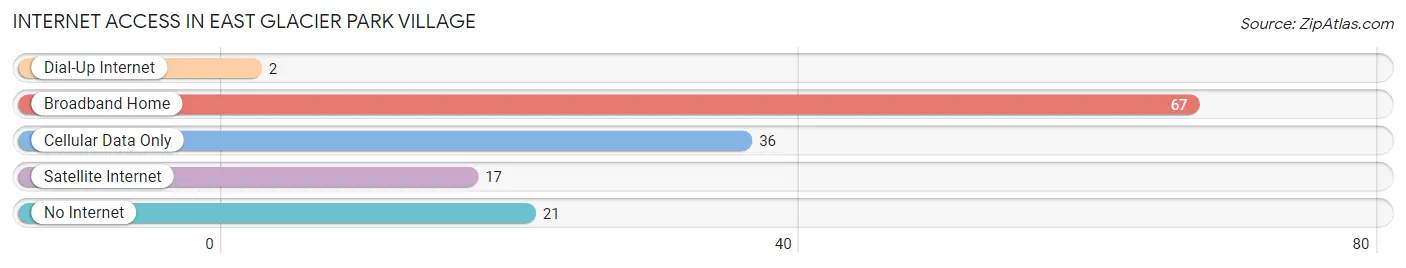
| Internet Type | # Households | % Households |
| Dial-Up Internet | 2 | 1.5% |
| Broadband Home | 67 | 49.3% |
| Cellular Data Only | 36 | 26.5% |
| Satellite Internet | 17 | 12.5% |
| No Internet | 21 | 15.4% |
| Total | 136 | 100.0% |
East Glacier Park Village Summary
History
East Glacier Park Village is a small unincorporated community located in Glacier County, Montana. It is situated on the Blackfeet Indian Reservation, just east of Glacier National Park. The village was established in the early 1900s as a railroad stop for the Great Northern Railway. It was originally known as Two Medicine Station, named after the nearby Two Medicine River. The village was renamed East Glacier Park in 1910, when the Great Northern Railway began offering passenger service to the area.
The village was a popular destination for tourists and travelers, and it quickly grew in size and popularity. By the 1920s, it had become a bustling tourist destination, with hotels, restaurants, and other businesses catering to visitors. The Great Northern Railway also built a large depot in the village, which served as a hub for the area.
In the 1930s, the Great Northern Railway began to decline, and the village began to suffer. The Great Depression hit the area hard, and many businesses closed. The village was further impacted by the construction of the Going-to-the-Sun Road, which bypassed the village and diverted traffic away from it.
By the 1950s, the village had become a quiet, sleepy community. The Great Northern Railway had ceased operations, and the village was no longer a popular tourist destination. However, the village was still home to a few businesses, including a general store, a post office, and a few restaurants.
In the late 1960s, the village began to experience a resurgence. The construction of the Going-to-the-Sun Road had made the area more accessible, and the village began to attract more visitors. The village was also home to a number of Native American tribes, including the Blackfeet, the Kootenai, and the Salish.
Today, East Glacier Park Village is a popular tourist destination. It is home to a number of hotels, restaurants, and other businesses catering to visitors. The village is also home to a number of Native American tribes, and it is a popular destination for outdoor activities such as hiking, fishing, and camping.
Geography
East Glacier Park Village is located in Glacier County, Montana, on the Blackfeet Indian Reservation. It is situated on the eastern edge of Glacier National Park, just south of the Two Medicine River. The village is located at an elevation of 4,400 feet, and it is surrounded by the Rocky Mountains.
The village is located in a temperate climate, with warm summers and cold winters. The average temperature in the summer is around 70 degrees Fahrenheit, and the average temperature in the winter is around 20 degrees Fahrenheit. The village receives an average of 20 inches of precipitation per year.
Economy
The economy of East Glacier Park Village is largely based on tourism. The village is a popular destination for visitors to Glacier National Park, and it is home to a number of hotels, restaurants, and other businesses catering to tourists. The village is also home to a number of Native American tribes, and it is a popular destination for outdoor activities such as hiking, fishing, and camping.
The village is also home to a number of small businesses, including a general store, a post office, and a few restaurants. The village is also home to a number of art galleries, which feature the work of local artists.
Demographics
As of the 2010 census, the population of East Glacier Park Village was 545. The village is predominantly white, with a small Native American population. The median age of the village is 44.7 years, and the median household income is $37,500. The village has a poverty rate of 16.3%, and the unemployment rate is 8.3%.
Common Questions
What is Per Capita Income in East Glacier Park Village?
Per Capita income in East Glacier Park Village is $31,445.
What is the Median Family Income in East Glacier Park Village?
Median Family Income in East Glacier Park Village is $71,750.
What is the Median Household income in East Glacier Park Village?
Median Household Income in East Glacier Park Village is $36,250.
What is Income or Wage Gap in East Glacier Park Village?
Income or Wage Gap in East Glacier Park Village is 11.0%.
Women in East Glacier Park Village earn 89.0 cents for every dollar earned by a man.
What is Inequality or Gini Index in East Glacier Park Village?
Inequality or Gini Index in East Glacier Park Village is 0.47.
What is the Total Population of East Glacier Park Village?
Total Population of East Glacier Park Village is 262.
What is the Total Male Population of East Glacier Park Village?
Total Male Population of East Glacier Park Village is 130.
What is the Total Female Population of East Glacier Park Village?
Total Female Population of East Glacier Park Village is 132.
What is the Ratio of Males per 100 Females in East Glacier Park Village?
There are 98.48 Males per 100 Females in East Glacier Park Village.
What is the Ratio of Females per 100 Males in East Glacier Park Village?
There are 101.54 Females per 100 Males in East Glacier Park Village.
What is the Median Population Age in East Glacier Park Village?
Median Population Age in East Glacier Park Village is 44.7 Years.
What is the Average Family Size in East Glacier Park Village
Average Family Size in East Glacier Park Village is 2.6 People.
What is the Average Household Size in East Glacier Park Village
Average Household Size in East Glacier Park Village is 1.9 People.
How Large is the Labor Force in East Glacier Park Village?
There are 141 People in the Labor Forcein in East Glacier Park Village.
What is the Percentage of People in the Labor Force in East Glacier Park Village?
62.7% of People are in the Labor Force in East Glacier Park Village.
What is the Unemployment Rate in East Glacier Park Village?
Unemployment Rate in East Glacier Park Village is 9.9%.