Ovando, MT Map & Demographics
Ovando Map
Ovando Overview
$46,518
PER CAPITA INCOME
$70,417
AVG FAMILY INCOME
$56,563
AVG HOUSEHOLD INCOME
24.3%
WAGE / INCOME GAP [ % ]
75.7¢/ $1
WAGE / INCOME GAP [ $ ]
0.22
INEQUALITY / GINI INDEX
44
TOTAL POPULATION
30
MALE POPULATION
14
FEMALE POPULATION
214.29
MALES / 100 FEMALES
46.67
FEMALES / 100 MALES
66.2
MEDIAN AGE
2.3
AVG FAMILY SIZE
1.6
AVG HOUSEHOLD SIZE
23
LABOR FORCE [ PEOPLE ]
52.3%
PERCENT IN LABOR FORCE
Ovando Zip Codes
Ovando Area Codes
Income in Ovando
Income Overview in Ovando
Per Capita Income in Ovando is $46,518, while median incomes of families and households are $70,417 and $56,563 respectively.
| Characteristic | Number | Measure |
| Per Capita Income | 44 | $46,518 |
| Median Family Income | 13 | $70,417 |
| Mean Family Income | 13 | $81,315 |
| Median Household Income | 27 | $56,563 |
| Mean Household Income | 27 | $67,752 |
| Income Deficit | 13 | $0 |
| Wage / Income Gap (%) | 44 | 24.26% |
| Wage / Income Gap ($) | 44 | 75.74¢ per $1 |
| Gini / Inequality Index | 44 | 0.22 |
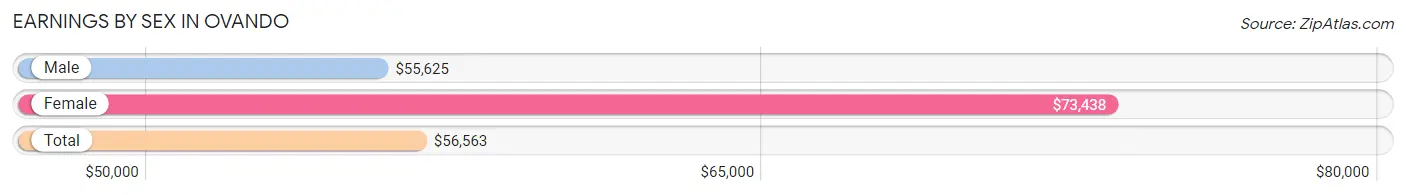
Earnings by Sex in Ovando
Average Earnings in Ovando are $56,563, $55,625 for men and $73,438 for women, a difference of 24.3%.
| Sex | Number | Average Earnings |
| Male | 18 (72.0%) | $55,625 |
| Female | 7 (28.0%) | $73,438 |
| Total | 25 (100.0%) | $56,563 |
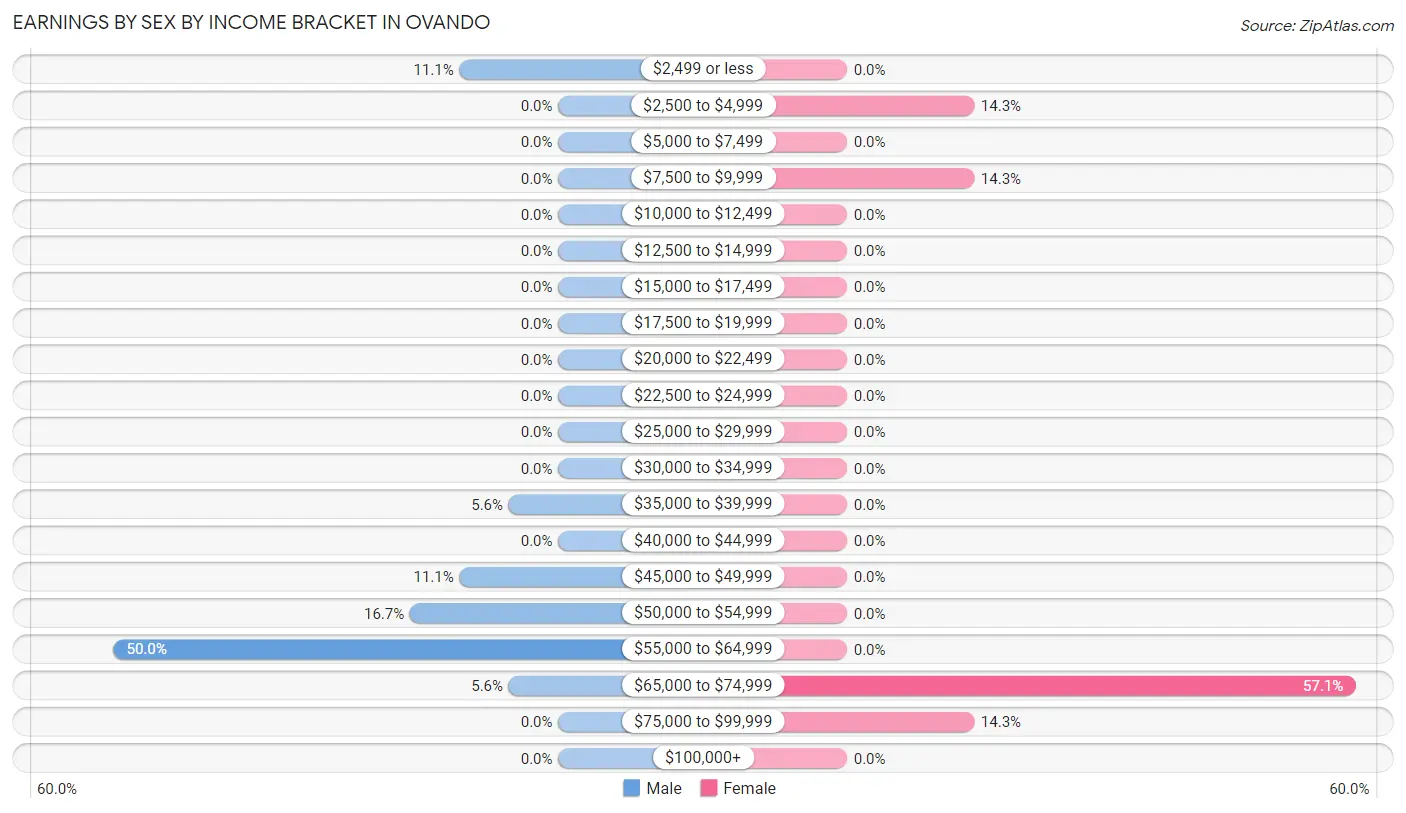
Earnings by Sex by Income Bracket in Ovando
The most common earnings brackets in Ovando are $55,000 to $64,999 for men (9 | 50.0%) and $65,000 to $74,999 for women (4 | 57.1%).
| Income | Male | Female |
| $2,499 or less | 2 (11.1%) | 0 (0.0%) |
| $2,500 to $4,999 | 0 (0.0%) | 1 (14.3%) |
| $5,000 to $7,499 | 0 (0.0%) | 0 (0.0%) |
| $7,500 to $9,999 | 0 (0.0%) | 1 (14.3%) |
| $10,000 to $12,499 | 0 (0.0%) | 0 (0.0%) |
| $12,500 to $14,999 | 0 (0.0%) | 0 (0.0%) |
| $15,000 to $17,499 | 0 (0.0%) | 0 (0.0%) |
| $17,500 to $19,999 | 0 (0.0%) | 0 (0.0%) |
| $20,000 to $22,499 | 0 (0.0%) | 0 (0.0%) |
| $22,500 to $24,999 | 0 (0.0%) | 0 (0.0%) |
| $25,000 to $29,999 | 0 (0.0%) | 0 (0.0%) |
| $30,000 to $34,999 | 0 (0.0%) | 0 (0.0%) |
| $35,000 to $39,999 | 1 (5.6%) | 0 (0.0%) |
| $40,000 to $44,999 | 0 (0.0%) | 0 (0.0%) |
| $45,000 to $49,999 | 2 (11.1%) | 0 (0.0%) |
| $50,000 to $54,999 | 3 (16.7%) | 0 (0.0%) |
| $55,000 to $64,999 | 9 (50.0%) | 0 (0.0%) |
| $65,000 to $74,999 | 1 (5.6%) | 4 (57.1%) |
| $75,000 to $99,999 | 0 (0.0%) | 1 (14.3%) |
| $100,000+ | 0 (0.0%) | 0 (0.0%) |
| Total | 18 (100.0%) | 7 (100.0%) |
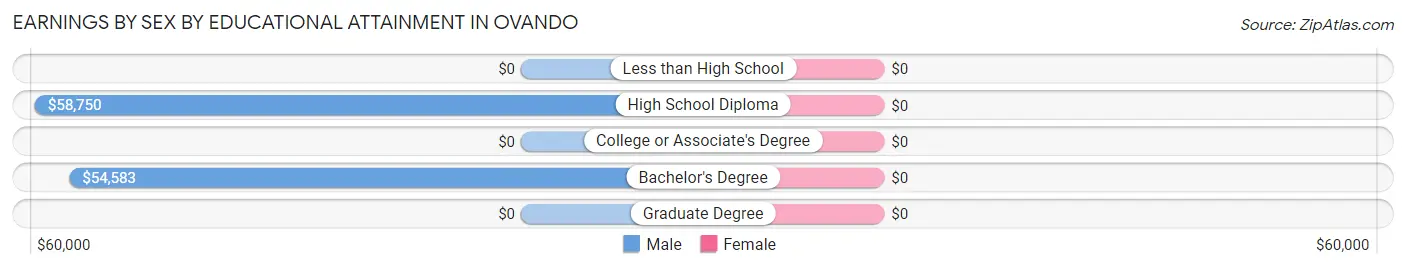
Earnings by Sex by Educational Attainment in Ovando
| Educational Attainment | Male Income | Female Income |
| Less than High School | - | - |
| High School Diploma | $58,750 | $0 |
| College or Associate's Degree | - | - |
| Bachelor's Degree | $54,583 | $0 |
| Graduate Degree | - | - |
| Total | $55,625 | $73,438 |
Family Income in Ovando
Family Income Brackets in Ovando
According to the Ovando family income data, there are 6 families falling into the $50,000 to $74,999 income range, which is the most common income bracket and makes up 46.2% of all families.
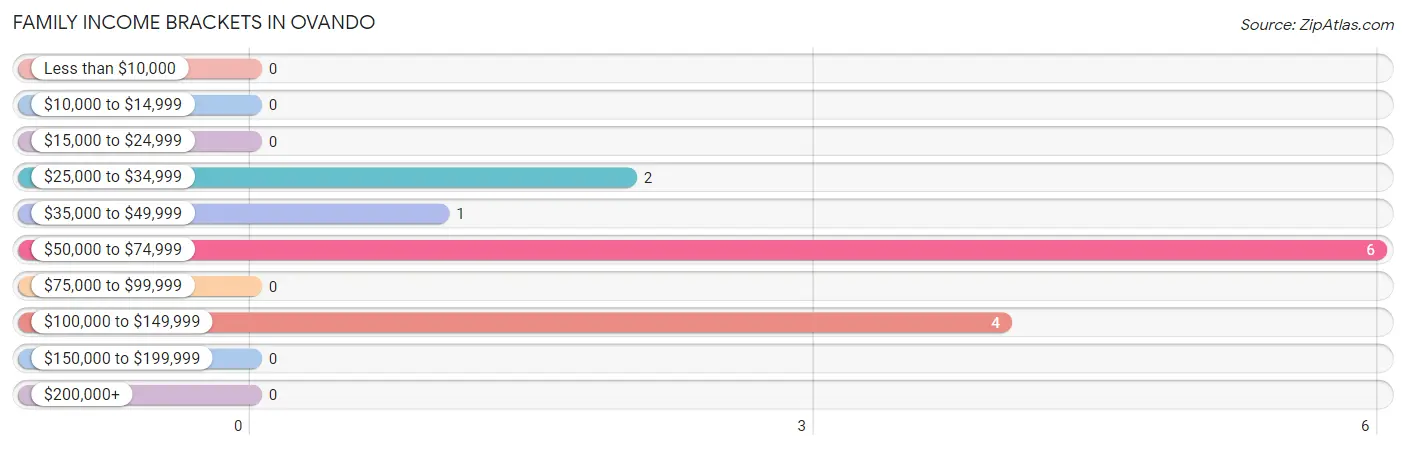
| Income Bracket | # Families | % Families |
| Less than $10,000 | 0 | 0.0% |
| $10,000 to $14,999 | 0 | 0.0% |
| $15,000 to $24,999 | 0 | 0.0% |
| $25,000 to $34,999 | 2 | 15.4% |
| $35,000 to $49,999 | 1 | 7.7% |
| $50,000 to $74,999 | 6 | 46.2% |
| $75,000 to $99,999 | 0 | 0.0% |
| $100,000 to $149,999 | 4 | 30.8% |
| $150,000 to $199,999 | 0 | 0.0% |
| $200,000+ | 0 | 0.0% |
Family Income by Famaliy Size in Ovando
2-person families (12 | 92.3%) account for the highest median family income in Ovando with $70,833 per family, while 2-person families (12 | 92.3%) have the highest median income of $35,416 per family member.
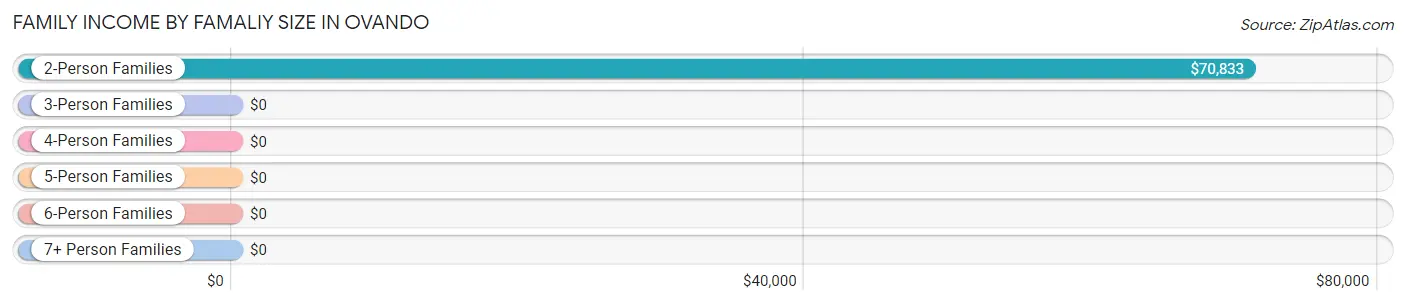
| Income Bracket | # Families | Median Income |
| 2-Person Families | 12 (92.3%) | $70,833 |
| 3-Person Families | 1 (7.7%) | $0 |
| 4-Person Families | 0 (0.0%) | $0 |
| 5-Person Families | 0 (0.0%) | $0 |
| 6-Person Families | 0 (0.0%) | $0 |
| 7+ Person Families | 0 (0.0%) | $0 |
| Total | 13 (100.0%) | $70,417 |
Family Income by Number of Earners in Ovando
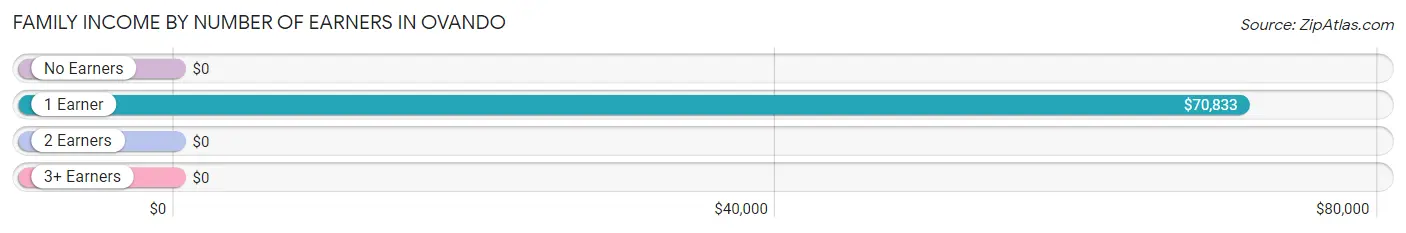
| Number of Earners | # Families | Median Income |
| No Earners | 3 (23.1%) | $0 |
| 1 Earner | 6 (46.2%) | $70,833 |
| 2 Earners | 4 (30.8%) | $0 |
| 3+ Earners | 0 (0.0%) | $0 |
| Total | 13 (100.0%) | $70,417 |
Household Income in Ovando
Household Income Brackets in Ovando
With 12 households falling in the category, the $50,000 to $74,999 income range is the most frequent in Ovando, accounting for 44.4% of all households.
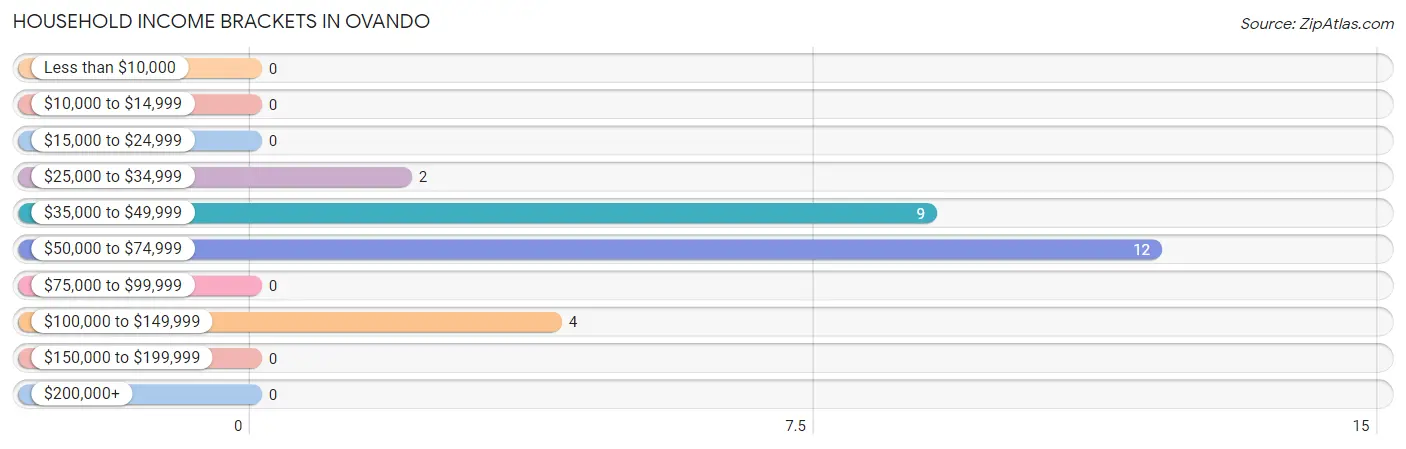
| Income Bracket | # Households | % Households |
| Less than $10,000 | 0 | 0.0% |
| $10,000 to $14,999 | 0 | 0.0% |
| $15,000 to $24,999 | 0 | 0.0% |
| $25,000 to $34,999 | 2 | 7.4% |
| $35,000 to $49,999 | 9 | 33.3% |
| $50,000 to $74,999 | 12 | 44.4% |
| $75,000 to $99,999 | 0 | 0.0% |
| $100,000 to $149,999 | 4 | 14.8% |
| $150,000 to $199,999 | 0 | 0.0% |
| $200,000+ | 0 | 0.0% |
Household Income by Householder Age in Ovando
The median household income in Ovando is $56,563, with the highest median household income of $71,667 found in the 45 to 64 years age bracket for the primary householder. A total of 10 households (37.0%) fall into this category.
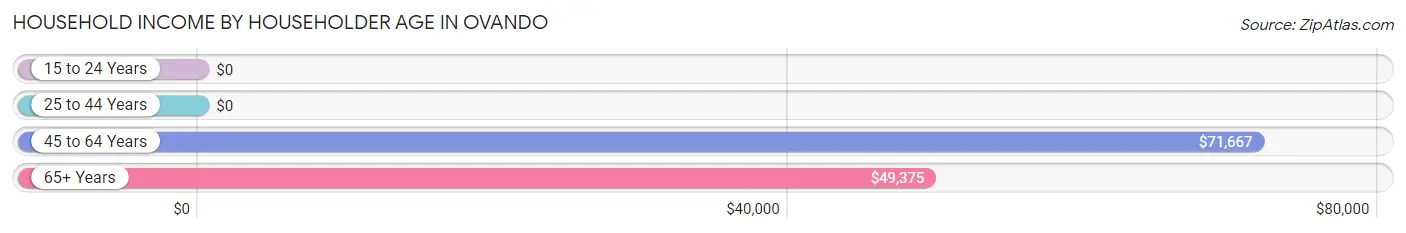
| Income Bracket | # Households | Median Income |
| 15 to 24 Years | 0 (0.0%) | $0 |
| 25 to 44 Years | 4 (14.8%) | $0 |
| 45 to 64 Years | 10 (37.0%) | $71,667 |
| 65+ Years | 13 (48.1%) | $49,375 |
| Total | 27 (100.0%) | $56,563 |
Poverty in Ovando
Income Below Poverty by Sex and Age in Ovando
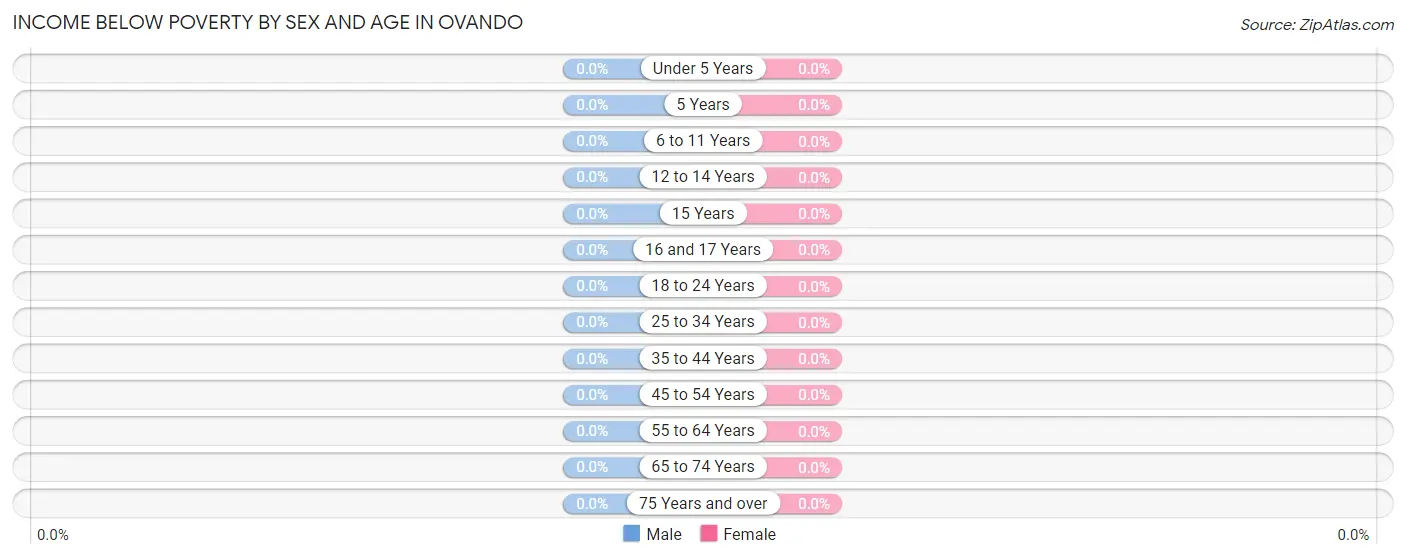
| Age Bracket | Male | Female |
| Under 5 Years | 0 (0.0%) | 0 (0.0%) |
| 5 Years | 0 (0.0%) | 0 (0.0%) |
| 6 to 11 Years | 0 (0.0%) | 0 (0.0%) |
| 12 to 14 Years | 0 (0.0%) | 0 (0.0%) |
| 15 Years | 0 (0.0%) | 0 (0.0%) |
| 16 and 17 Years | 0 (0.0%) | 0 (0.0%) |
| 18 to 24 Years | 0 (0.0%) | 0 (0.0%) |
| 25 to 34 Years | 0 (0.0%) | 0 (0.0%) |
| 35 to 44 Years | 0 (0.0%) | 0 (0.0%) |
| 45 to 54 Years | 0 (0.0%) | 0 (0.0%) |
| 55 to 64 Years | 0 (0.0%) | 0 (0.0%) |
| 65 to 74 Years | 0 (0.0%) | 0 (0.0%) |
| 75 Years and over | 0 (0.0%) | 0 (0.0%) |
| Total | 0 (0.0%) | 0 (0.0%) |
Income Above Poverty by Sex and Age in Ovando
According to the poverty statistics in Ovando, males aged 35 to 44 years and females aged 18 to 24 years are the age groups that are most secure financially, with 100.0% of males and 100.0% of females in these age groups living above the poverty line.
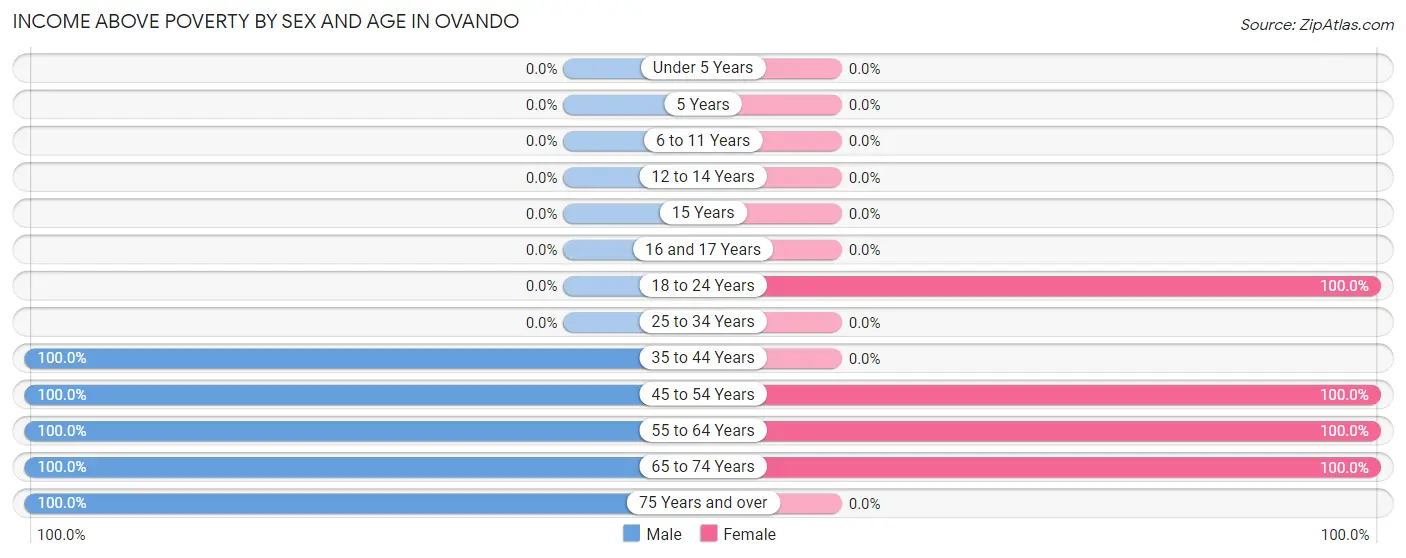
| Age Bracket | Male | Female |
| Under 5 Years | 0 (0.0%) | 0 (0.0%) |
| 5 Years | 0 (0.0%) | 0 (0.0%) |
| 6 to 11 Years | 0 (0.0%) | 0 (0.0%) |
| 12 to 14 Years | 0 (0.0%) | 0 (0.0%) |
| 15 Years | 0 (0.0%) | 0 (0.0%) |
| 16 and 17 Years | 0 (0.0%) | 0 (0.0%) |
| 18 to 24 Years | 0 (0.0%) | 1 (100.0%) |
| 25 to 34 Years | 0 (0.0%) | 0 (0.0%) |
| 35 to 44 Years | 4 (100.0%) | 0 (0.0%) |
| 45 to 54 Years | 3 (100.0%) | 5 (100.0%) |
| 55 to 64 Years | 5 (100.0%) | 3 (100.0%) |
| 65 to 74 Years | 12 (100.0%) | 5 (100.0%) |
| 75 Years and over | 6 (100.0%) | 0 (0.0%) |
| Total | 30 (100.0%) | 14 (100.0%) |
Income Below Poverty Among Married-Couple Families in Ovando
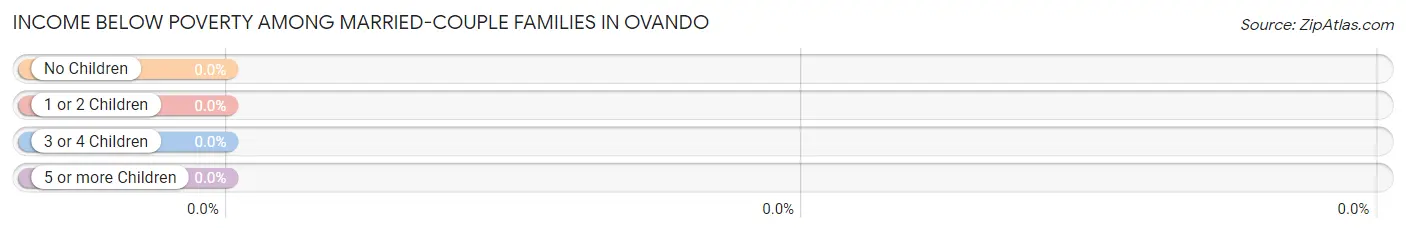
| Children | Above Poverty | Below Poverty |
| No Children | 12 (100.0%) | 0 (0.0%) |
| 1 or 2 Children | 0 (0.0%) | 0 (0.0%) |
| 3 or 4 Children | 0 (0.0%) | 0 (0.0%) |
| 5 or more Children | 0 (0.0%) | 0 (0.0%) |
| Total | 12 (100.0%) | 0 (0.0%) |
Income Below Poverty Among Single-Parent Households in Ovando
| Children | Single Father | Single Mother |
| No Children | 0 (0.0%) | 0 (0.0%) |
| 1 or 2 Children | 0 (0.0%) | 0 (0.0%) |
| 3 or 4 Children | 0 (0.0%) | 0 (0.0%) |
| 5 or more Children | 0 (0.0%) | 0 (0.0%) |
| Total | 0 (0.0%) | 0 (0.0%) |
Income Below Poverty Among Married-Couple vs Single-Parent Households in Ovando
| Children | Married-Couple Families | Single-Parent Households |
| No Children | 0 (0.0%) | 0 (0.0%) |
| 1 or 2 Children | 0 (0.0%) | 0 (0.0%) |
| 3 or 4 Children | 0 (0.0%) | 0 (0.0%) |
| 5 or more Children | 0 (0.0%) | 0 (0.0%) |
| Total | 0 (0.0%) | 0 (0.0%) |
Race in Ovando
The most populous races in Ovando are White / Caucasian (38 | 86.4%), and Some other Race (6 | 13.6%).
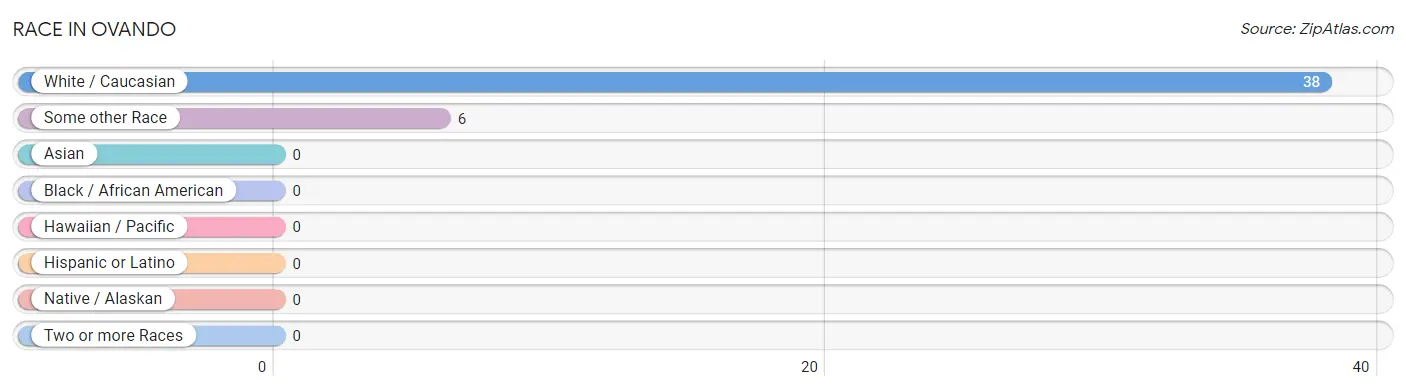
| Race | # Population | % Population |
| Asian | 0 | 0.0% |
| Black / African American | 0 | 0.0% |
| Hawaiian / Pacific | 0 | 0.0% |
| Hispanic or Latino | 0 | 0.0% |
| Native / Alaskan | 0 | 0.0% |
| White / Caucasian | 38 | 86.4% |
| Two or more Races | 0 | 0.0% |
| Some other Race | 6 | 13.6% |
| Total | 44 | 100.0% |
Ancestry in Ovando
The most populous ancestries reported in Ovando are American (13 | 29.5%), Irish (8 | 18.2%), European (7 | 15.9%), English (4 | 9.1%), and Lithuanian (3 | 6.8%), together accounting for 79.5% of all Ovando residents.
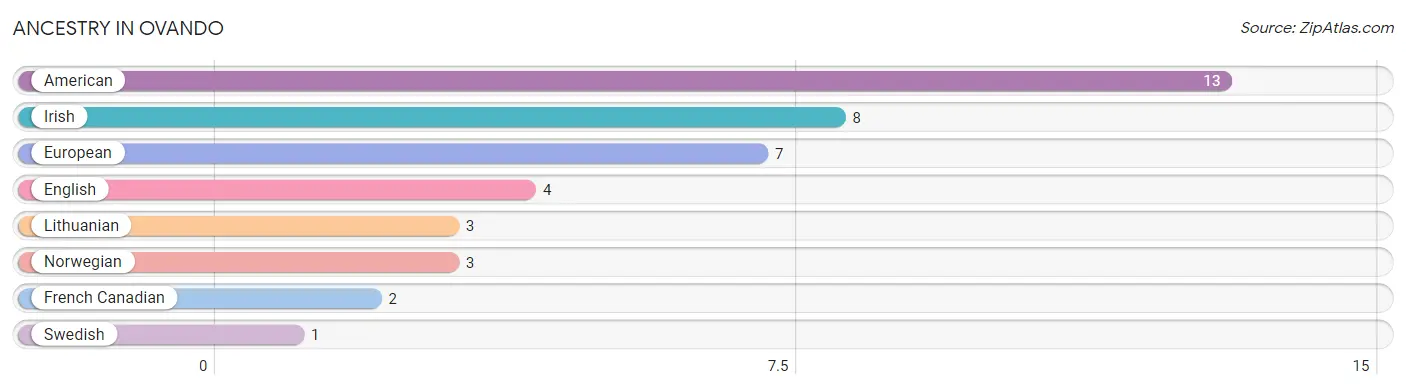
| Ancestry | # Population | % Population |
| American | 13 | 29.5% |
| English | 4 | 9.1% |
| European | 7 | 15.9% |
| French Canadian | 2 | 4.5% |
| Irish | 8 | 18.2% |
| Lithuanian | 3 | 6.8% |
| Norwegian | 3 | 6.8% |
| Swedish | 1 | 2.3% | View All 8 Rows |
Immigrants in Ovando

| Immigration Origin | # Population | % Population | View All 0 Rows |
Sex and Age in Ovando
Sex and Age in Ovando
The most populous age groups in Ovando are 65 to 69 Years (6 | 20.0%) for men and 45 to 49 Years (4 | 28.6%) for women.
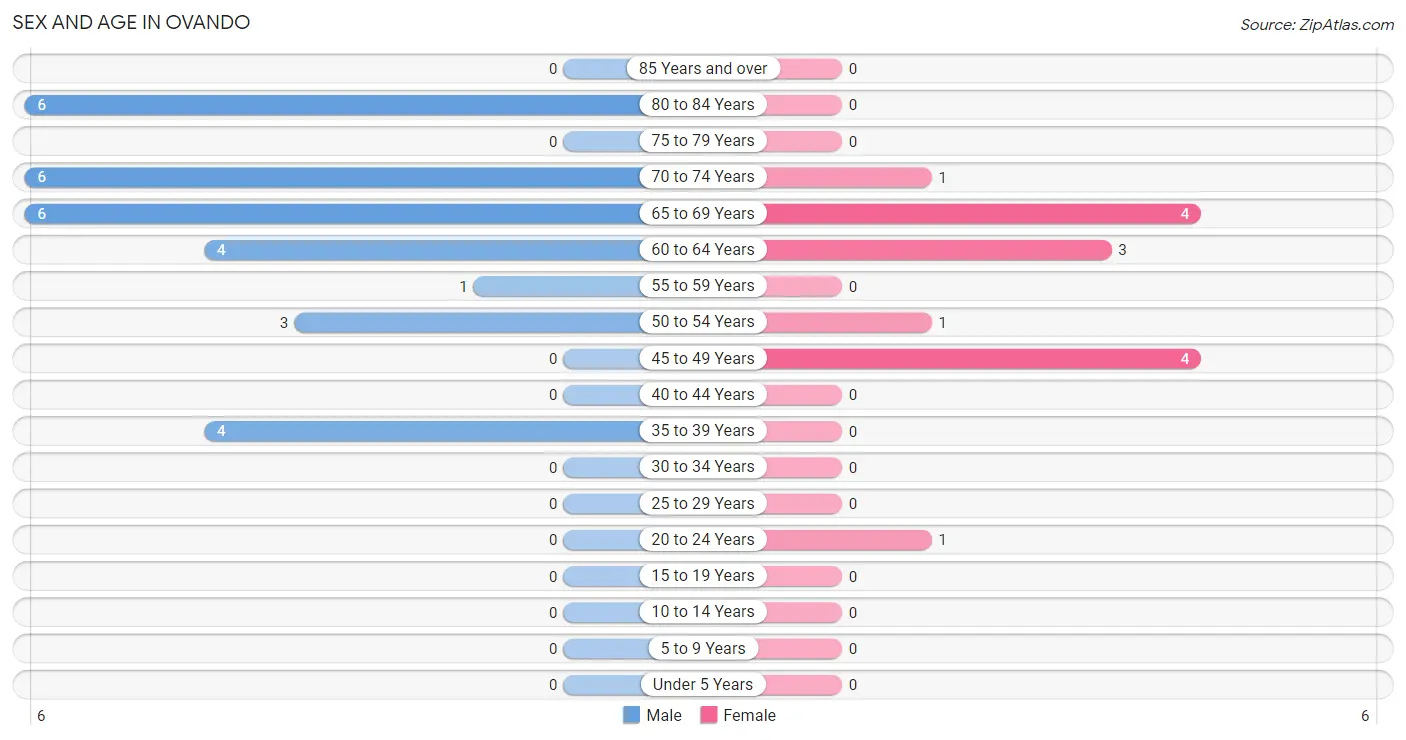
| Age Bracket | Male | Female |
| Under 5 Years | 0 (0.0%) | 0 (0.0%) |
| 5 to 9 Years | 0 (0.0%) | 0 (0.0%) |
| 10 to 14 Years | 0 (0.0%) | 0 (0.0%) |
| 15 to 19 Years | 0 (0.0%) | 0 (0.0%) |
| 20 to 24 Years | 0 (0.0%) | 1 (7.1%) |
| 25 to 29 Years | 0 (0.0%) | 0 (0.0%) |
| 30 to 34 Years | 0 (0.0%) | 0 (0.0%) |
| 35 to 39 Years | 4 (13.3%) | 0 (0.0%) |
| 40 to 44 Years | 0 (0.0%) | 0 (0.0%) |
| 45 to 49 Years | 0 (0.0%) | 4 (28.6%) |
| 50 to 54 Years | 3 (10.0%) | 1 (7.1%) |
| 55 to 59 Years | 1 (3.3%) | 0 (0.0%) |
| 60 to 64 Years | 4 (13.3%) | 3 (21.4%) |
| 65 to 69 Years | 6 (20.0%) | 4 (28.6%) |
| 70 to 74 Years | 6 (20.0%) | 1 (7.1%) |
| 75 to 79 Years | 0 (0.0%) | 0 (0.0%) |
| 80 to 84 Years | 6 (20.0%) | 0 (0.0%) |
| 85 Years and over | 0 (0.0%) | 0 (0.0%) |
| Total | 30 (100.0%) | 14 (100.0%) |
Families and Households in Ovando
Median Family Size in Ovando
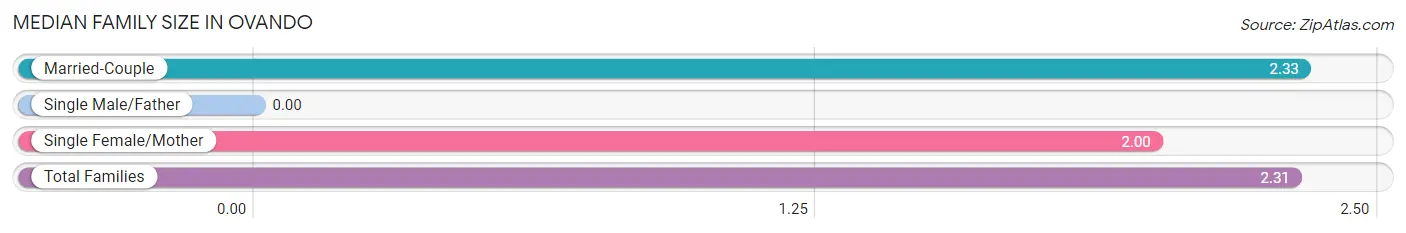
| Family Type | # Families | Family Size |
| Married-Couple | 12 (92.3%) | 2.33 |
| Single Male/Father | 0 (0.0%) | - |
| Single Female/Mother | 1 (7.7%) | 2.00 |
| Total Families | 13 (100.0%) | 2.31 |
Median Household Size in Ovando
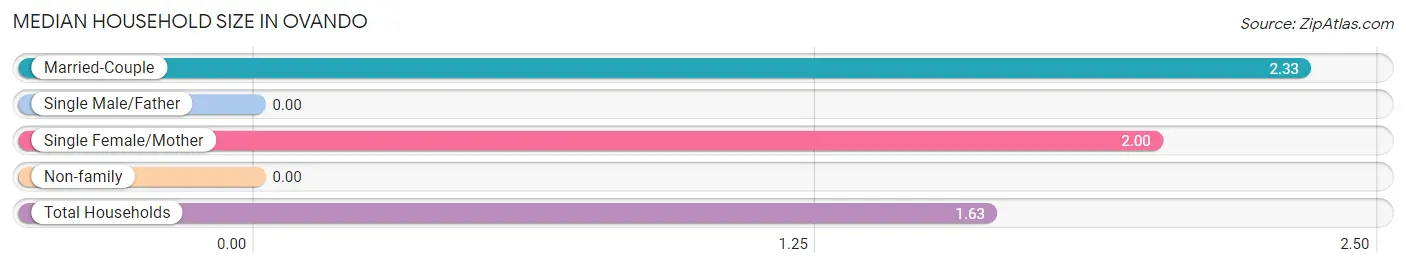
| Household Type | # Households | Household Size |
| Married-Couple | 12 (44.4%) | 2.33 |
| Single Male/Father | 0 (0.0%) | - |
| Single Female/Mother | 1 (3.7%) | 2.00 |
| Non-family | 14 (51.8%) | - |
| Total Households | 27 (100.0%) | 1.63 |
Household Size by Marriage Status in Ovando
Out of a total of 27 households in Ovando, 13 (48.1%) are family households, while 14 (51.8%) are nonfamily households. The most numerous type of family households are 2-person households, comprising 12, and the most common type of nonfamily households are 1-person households, comprising 14.
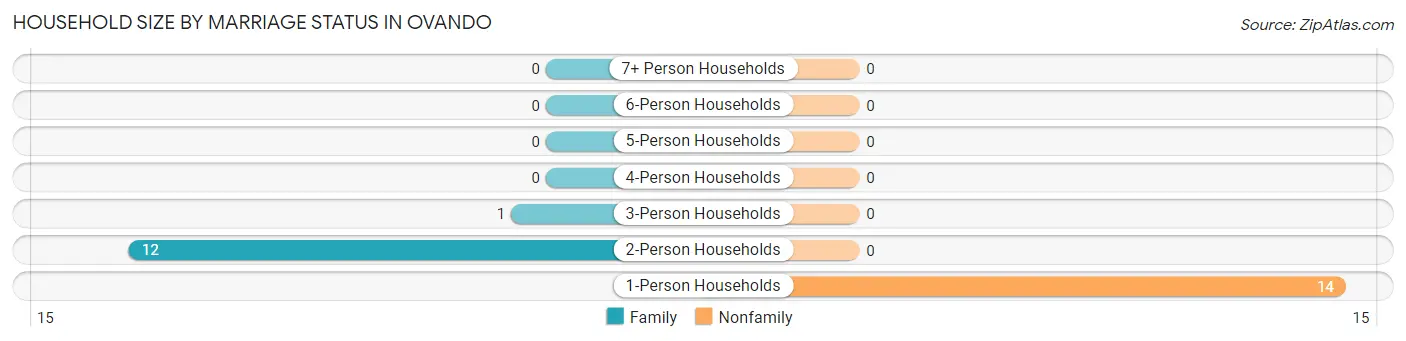
| Household Size | Family Households | Nonfamily Households |
| 1-Person Households | - | 14 (51.8%) |
| 2-Person Households | 12 (44.4%) | 0 (0.0%) |
| 3-Person Households | 1 (3.7%) | 0 (0.0%) |
| 4-Person Households | 0 (0.0%) | 0 (0.0%) |
| 5-Person Households | 0 (0.0%) | 0 (0.0%) |
| 6-Person Households | 0 (0.0%) | 0 (0.0%) |
| 7+ Person Households | 0 (0.0%) | 0 (0.0%) |
| Total | 13 (48.1%) | 14 (51.8%) |
Female Fertility in Ovando
Fertility by Age in Ovando
| Age Bracket | Women with Births | Births / 1,000 Women |
| 15 to 19 years | 0 (0.0%) | 0.0 |
| 20 to 34 years | 0 (0.0%) | 0.0 |
| 35 to 50 years | 0 (0.0%) | 0.0 |
| Total | 0 (0.0%) | 0.0 |
Fertility by Age by Marriage Status in Ovando
| Age Bracket | Married | Unmarried |
| 15 to 19 years | 0 (0.0%) | 0 (0.0%) |
| 20 to 34 years | 0 (0.0%) | 0 (0.0%) |
| 35 to 50 years | 0 (0.0%) | 0 (0.0%) |
| Total | 0 (0.0%) | 0 (0.0%) |
Fertility by Education in Ovando
| Educational Attainment | Women with Births | Births / 1,000 Women |
| Less than High School | 0 (0.0%) | 0.0 |
| High School Diploma | 0 (0.0%) | 0.0 |
| College or Associate's Degree | 0 (0.0%) | 0.0 |
| Bachelor's Degree | 0 (0.0%) | 0.0 |
| Graduate Degree | 0 (0.0%) | 0.0 |
| Total | 0 (0.0%) | 0.0 |
Fertility by Education by Marriage Status in Ovando
| Educational Attainment | Married | Unmarried |
| Less than High School | 0 (0.0%) | 0 (0.0%) |
| High School Diploma | 0 (0.0%) | 0 (0.0%) |
| College or Associate's Degree | 0 (0.0%) | 0 (0.0%) |
| Bachelor's Degree | 0 (0.0%) | 0 (0.0%) |
| Graduate Degree | 0 (0.0%) | 0 (0.0%) |
| Total | 0 (0.0%) | 0 (0.0%) |
Employment Characteristics in Ovando
Employment by Class of Employer in Ovando
Among the 23 employed individuals in Ovando, private company employees (16 | 69.6%), self-employed (not incorporated) (3 | 13.0%), and federal government employees (3 | 13.0%) make up the most common classes of employment.
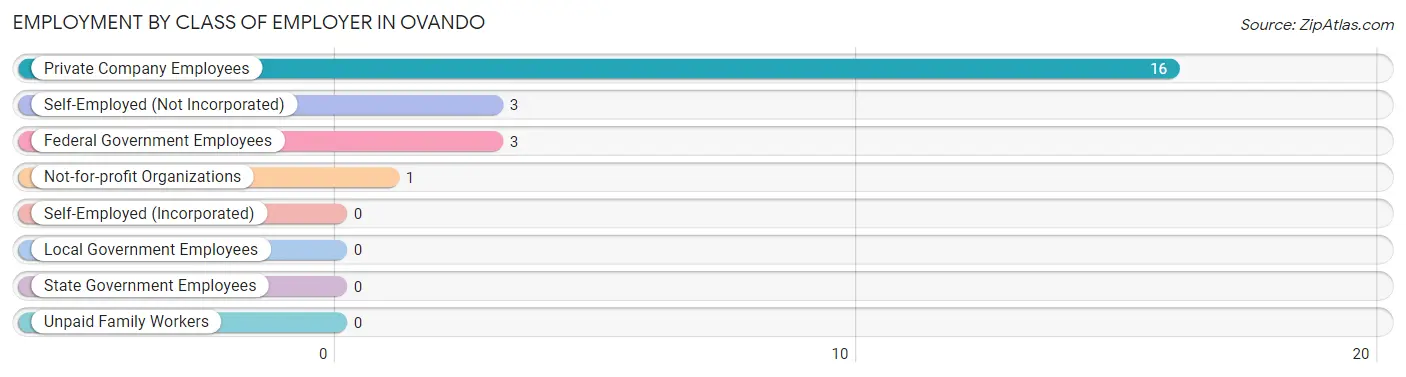
| Employer Class | # Employees | % Employees |
| Private Company Employees | 16 | 69.6% |
| Self-Employed (Incorporated) | 0 | 0.0% |
| Self-Employed (Not Incorporated) | 3 | 13.0% |
| Not-for-profit Organizations | 1 | 4.3% |
| Local Government Employees | 0 | 0.0% |
| State Government Employees | 0 | 0.0% |
| Federal Government Employees | 3 | 13.0% |
| Unpaid Family Workers | 0 | 0.0% |
| Total | 23 | 100.0% |
Employment Status by Age in Ovando
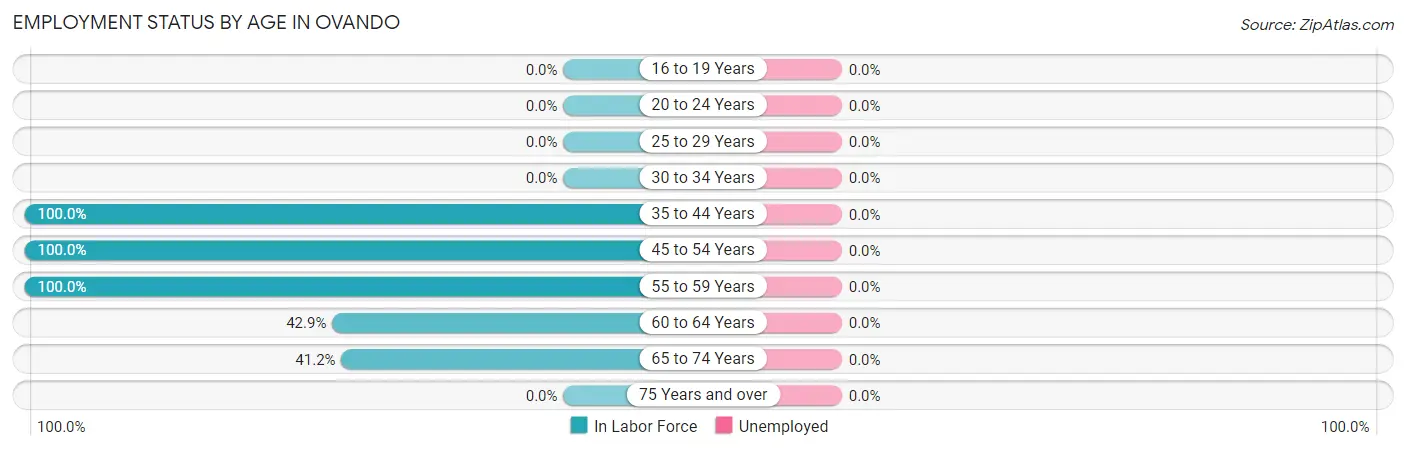
| Age Bracket | In Labor Force | Unemployed |
| 16 to 19 Years | 0 (0.0%) | 0 (0.0%) |
| 20 to 24 Years | 0 (0.0%) | 0 (0.0%) |
| 25 to 29 Years | 0 (0.0%) | 0 (0.0%) |
| 30 to 34 Years | 0 (0.0%) | 0 (0.0%) |
| 35 to 44 Years | 4 (100.0%) | 0 (0.0%) |
| 45 to 54 Years | 8 (100.0%) | 0 (0.0%) |
| 55 to 59 Years | 1 (100.0%) | 0 (0.0%) |
| 60 to 64 Years | 3 (42.9%) | 0 (0.0%) |
| 65 to 74 Years | 7 (41.2%) | 0 (0.0%) |
| 75 Years and over | 0 (0.0%) | 0 (0.0%) |
| Total | 23 (52.3%) | 0 (0.0%) |
Employment Status by Educational Attainment in Ovando
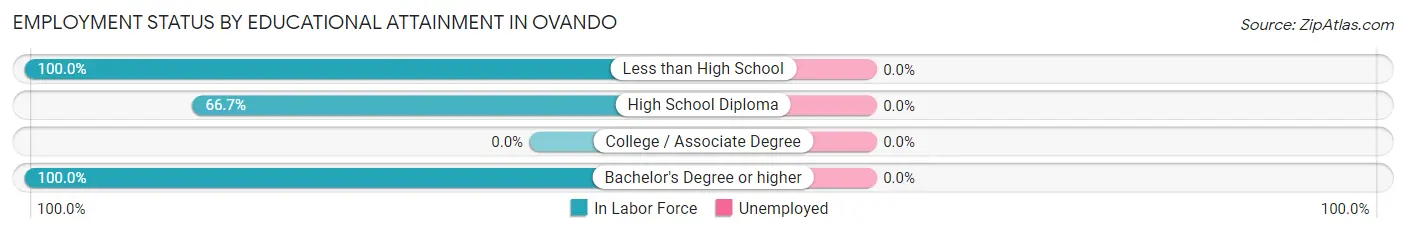
| Educational Attainment | In Labor Force | Unemployed |
| Less than High School | 1 (100.0%) | 0 (0.0%) |
| High School Diploma | 2 (66.7%) | 0 (0.0%) |
| College / Associate Degree | 0 (0.0%) | 0 (0.0%) |
| Bachelor's Degree or higher | 13 (100.0%) | 0 (0.0%) |
| Total | 16 (80.0%) | 0 (0.0%) |
Employment Occupations by Sex in Ovando
Management, Business, Science and Arts Occupations
The most common Management, Business, Science and Arts occupations in Ovando are Health Diagnosing & Treating (4 | 17.4%), Health Technologists (4 | 17.4%), and Management (2 | 8.7%).
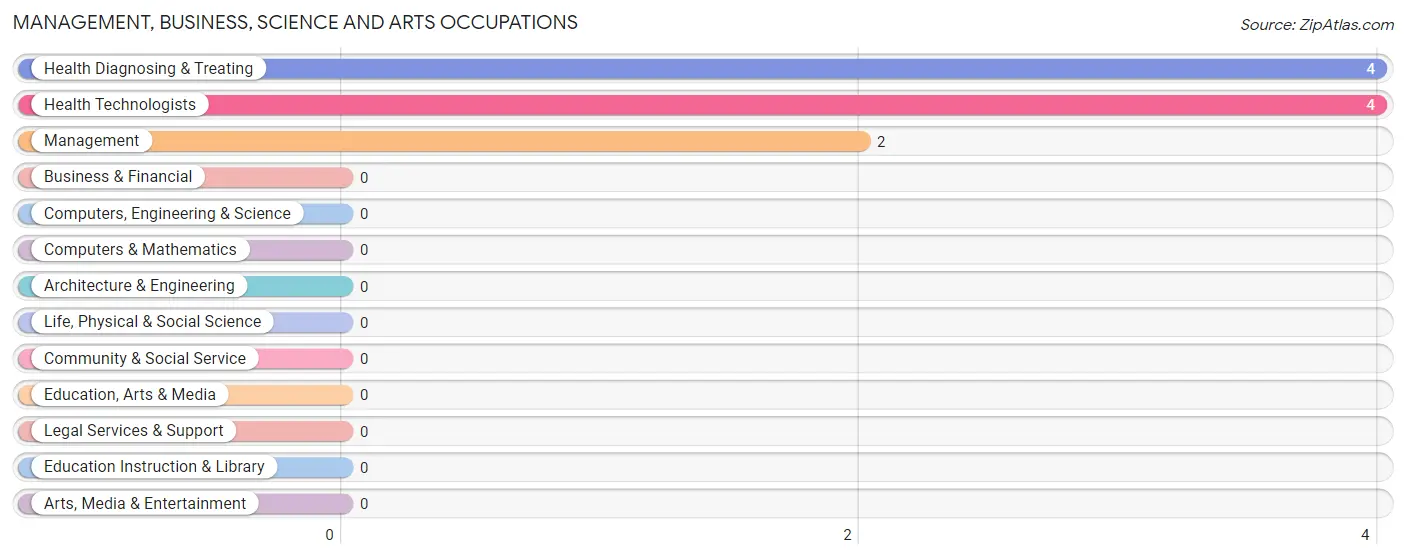
Management, Business, Science and Arts Occupations by Sex
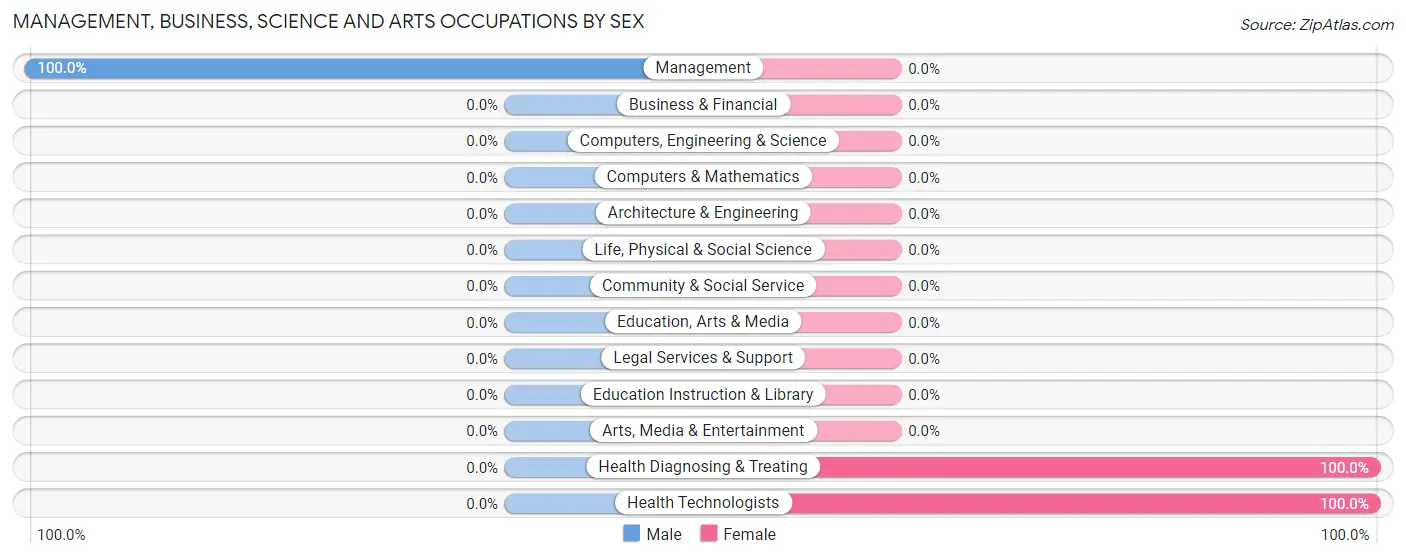
| Occupation | Male | Female |
| Management | 2 (100.0%) | 0 (0.0%) |
| Business & Financial | 0 (0.0%) | 0 (0.0%) |
| Computers, Engineering & Science | 0 (0.0%) | 0 (0.0%) |
| Computers & Mathematics | 0 (0.0%) | 0 (0.0%) |
| Architecture & Engineering | 0 (0.0%) | 0 (0.0%) |
| Life, Physical & Social Science | 0 (0.0%) | 0 (0.0%) |
| Community & Social Service | 0 (0.0%) | 0 (0.0%) |
| Education, Arts & Media | 0 (0.0%) | 0 (0.0%) |
| Legal Services & Support | 0 (0.0%) | 0 (0.0%) |
| Education Instruction & Library | 0 (0.0%) | 0 (0.0%) |
| Arts, Media & Entertainment | 0 (0.0%) | 0 (0.0%) |
| Health Diagnosing & Treating | 0 (0.0%) | 4 (100.0%) |
| Health Technologists | 0 (0.0%) | 4 (100.0%) |
| Total (Category) | 2 (33.3%) | 4 (66.7%) |
| Total (Overall) | 16 (69.6%) | 7 (30.4%) |
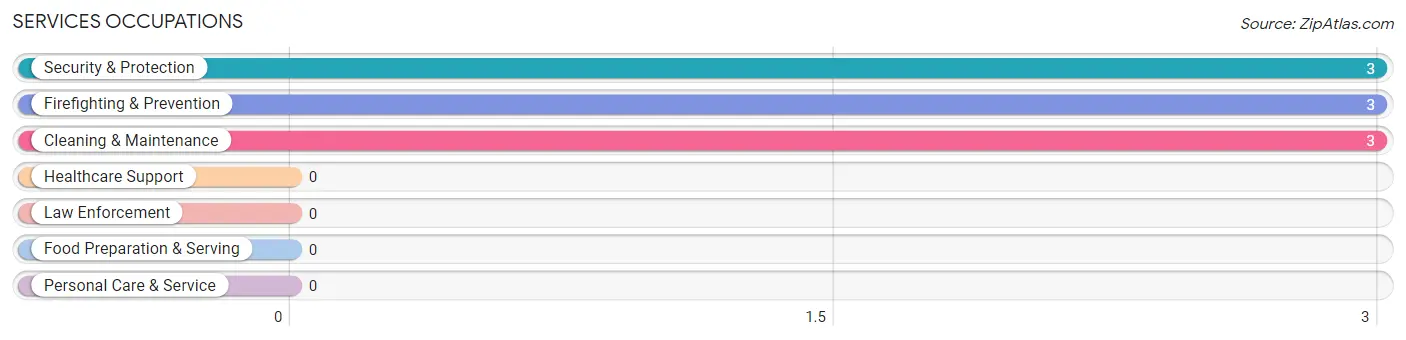
Services Occupations
The most common Services occupations in Ovando are Security & Protection (3 | 13.0%), Firefighting & Prevention (3 | 13.0%), and Cleaning & Maintenance (3 | 13.0%).
Services Occupations by Sex
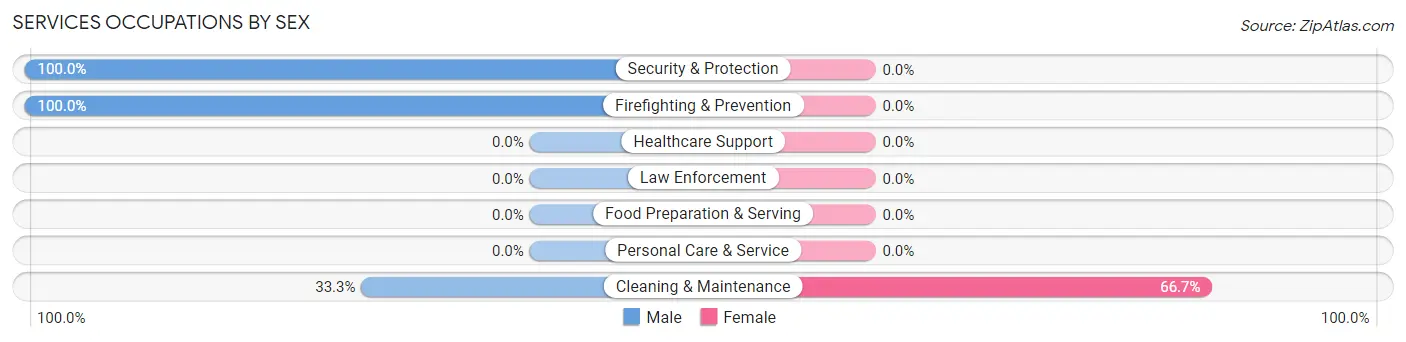
| Occupation | Male | Female |
| Healthcare Support | 0 (0.0%) | 0 (0.0%) |
| Security & Protection | 3 (100.0%) | 0 (0.0%) |
| Firefighting & Prevention | 3 (100.0%) | 0 (0.0%) |
| Law Enforcement | 0 (0.0%) | 0 (0.0%) |
| Food Preparation & Serving | 0 (0.0%) | 0 (0.0%) |
| Cleaning & Maintenance | 1 (33.3%) | 2 (66.7%) |
| Personal Care & Service | 0 (0.0%) | 0 (0.0%) |
| Total (Category) | 4 (66.7%) | 2 (33.3%) |
| Total (Overall) | 16 (69.6%) | 7 (30.4%) |
Sales and Office Occupations
The most common Sales and Office occupations in Ovando are , and Sales & Related (1 | 4.3%).
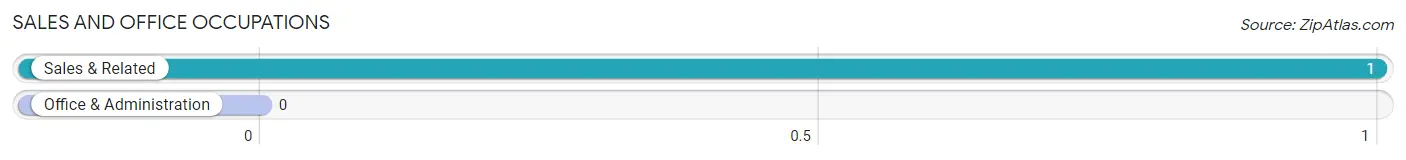
Sales and Office Occupations by Sex
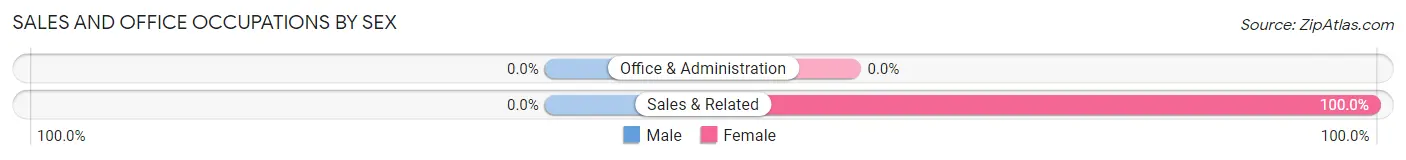
| Occupation | Male | Female |
| Sales & Related | 0 (0.0%) | 1 (100.0%) |
| Office & Administration | 0 (0.0%) | 0 (0.0%) |
| Total (Category) | 0 (0.0%) | 1 (100.0%) |
| Total (Overall) | 16 (69.6%) | 7 (30.4%) |
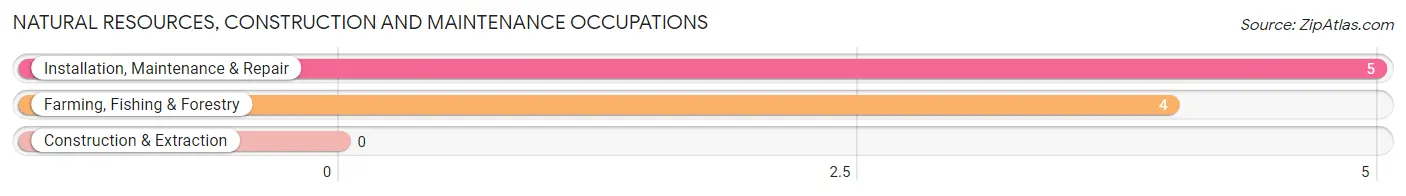
Natural Resources, Construction and Maintenance Occupations
The most common Natural Resources, Construction and Maintenance occupations in Ovando are Installation, Maintenance & Repair (5 | 21.7%), and Farming, Fishing & Forestry (4 | 17.4%).
Natural Resources, Construction and Maintenance Occupations by Sex
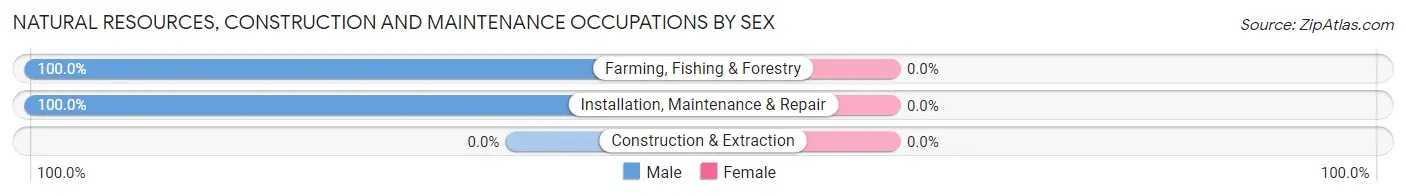
| Occupation | Male | Female |
| Farming, Fishing & Forestry | 4 (100.0%) | 0 (0.0%) |
| Construction & Extraction | 0 (0.0%) | 0 (0.0%) |
| Installation, Maintenance & Repair | 5 (100.0%) | 0 (0.0%) |
| Total (Category) | 9 (100.0%) | 0 (0.0%) |
| Total (Overall) | 16 (69.6%) | 7 (30.4%) |
Production, Transportation and Moving Occupations
The most common Production, Transportation and Moving occupations in Ovando are , and Production (1 | 4.3%).
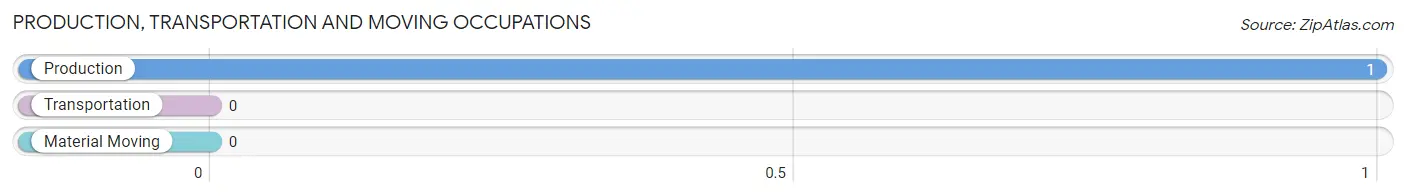
Production, Transportation and Moving Occupations by Sex
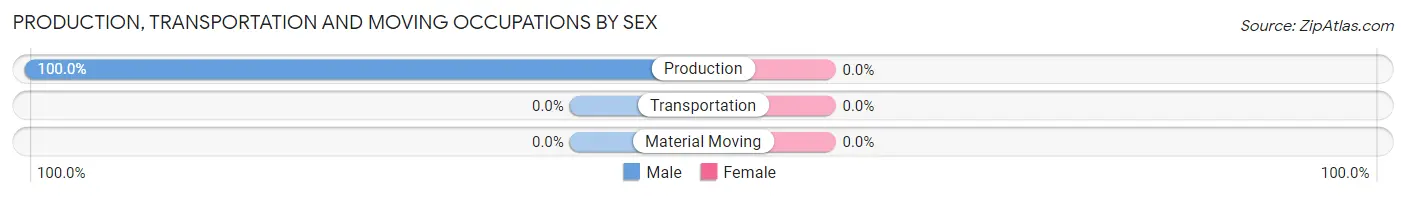
| Occupation | Male | Female |
| Production | 1 (100.0%) | 0 (0.0%) |
| Transportation | 0 (0.0%) | 0 (0.0%) |
| Material Moving | 0 (0.0%) | 0 (0.0%) |
| Total (Category) | 1 (100.0%) | 0 (0.0%) |
| Total (Overall) | 16 (69.6%) | 7 (30.4%) |
Employment Industries by Sex in Ovando
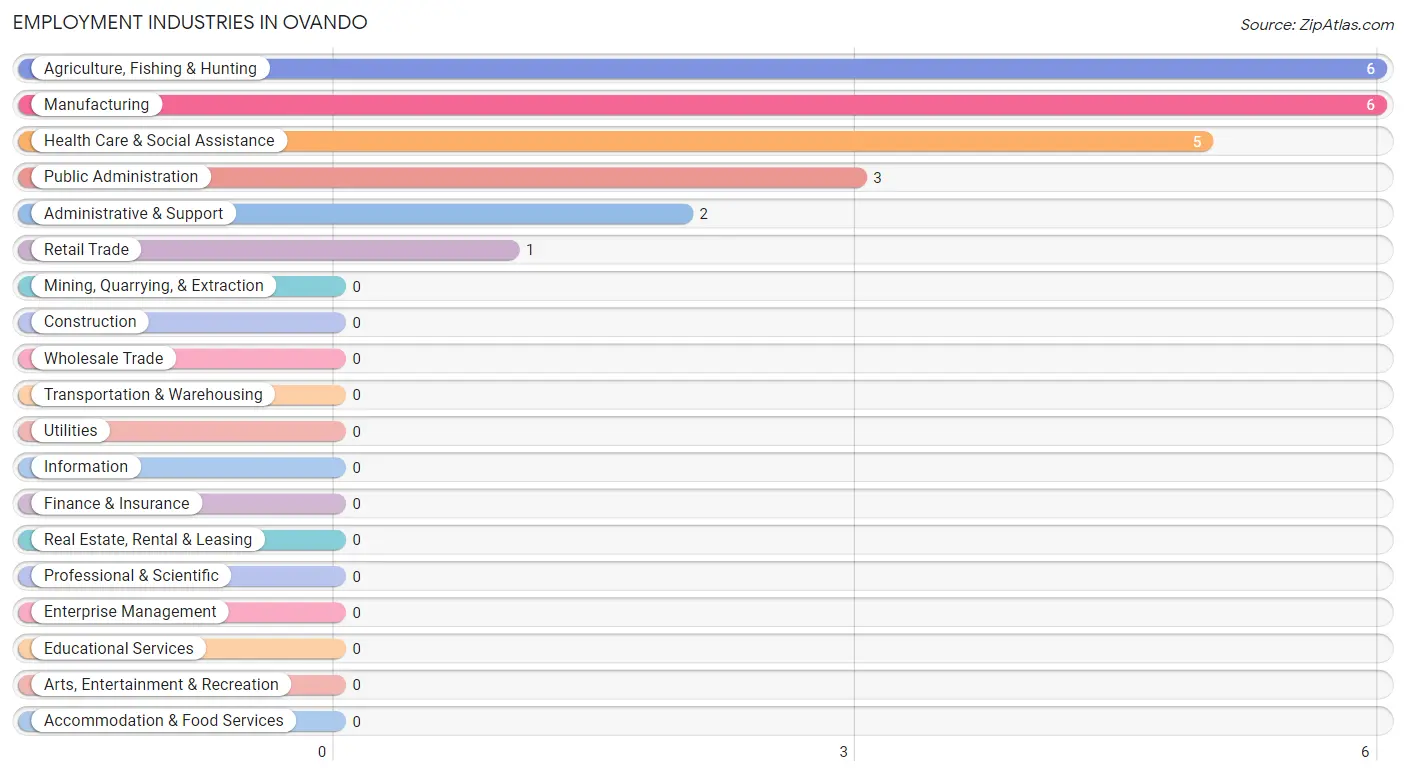
Employment Industries in Ovando
The major employment industries in Ovando include Agriculture, Fishing & Hunting (6 | 26.1%), Manufacturing (6 | 26.1%), Health Care & Social Assistance (5 | 21.7%), Public Administration (3 | 13.0%), and Administrative & Support (2 | 8.7%).
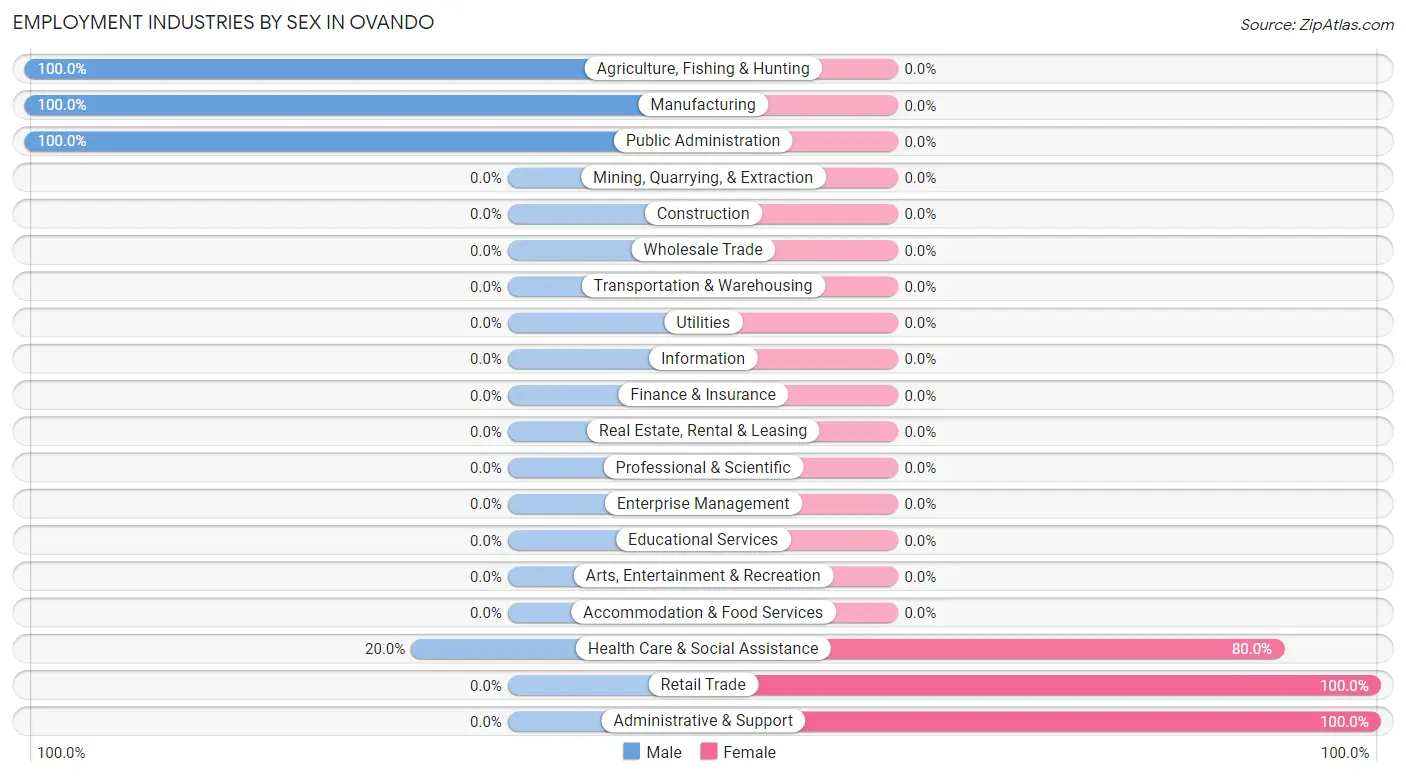
Employment Industries by Sex in Ovando
The Ovando industries that see more men than women are Agriculture, Fishing & Hunting (100.0%), Manufacturing (100.0%), and Public Administration (100.0%), whereas the industries that tend to have a higher number of women are Retail Trade (100.0%), Administrative & Support (100.0%), and Health Care & Social Assistance (80.0%).
| Industry | Male | Female |
| Agriculture, Fishing & Hunting | 6 (100.0%) | 0 (0.0%) |
| Mining, Quarrying, & Extraction | 0 (0.0%) | 0 (0.0%) |
| Construction | 0 (0.0%) | 0 (0.0%) |
| Manufacturing | 6 (100.0%) | 0 (0.0%) |
| Wholesale Trade | 0 (0.0%) | 0 (0.0%) |
| Retail Trade | 0 (0.0%) | 1 (100.0%) |
| Transportation & Warehousing | 0 (0.0%) | 0 (0.0%) |
| Utilities | 0 (0.0%) | 0 (0.0%) |
| Information | 0 (0.0%) | 0 (0.0%) |
| Finance & Insurance | 0 (0.0%) | 0 (0.0%) |
| Real Estate, Rental & Leasing | 0 (0.0%) | 0 (0.0%) |
| Professional & Scientific | 0 (0.0%) | 0 (0.0%) |
| Enterprise Management | 0 (0.0%) | 0 (0.0%) |
| Administrative & Support | 0 (0.0%) | 2 (100.0%) |
| Educational Services | 0 (0.0%) | 0 (0.0%) |
| Health Care & Social Assistance | 1 (20.0%) | 4 (80.0%) |
| Arts, Entertainment & Recreation | 0 (0.0%) | 0 (0.0%) |
| Accommodation & Food Services | 0 (0.0%) | 0 (0.0%) |
| Public Administration | 3 (100.0%) | 0 (0.0%) |
| Total | 16 (69.6%) | 7 (30.4%) |
Education in Ovando
School Enrollment in Ovando
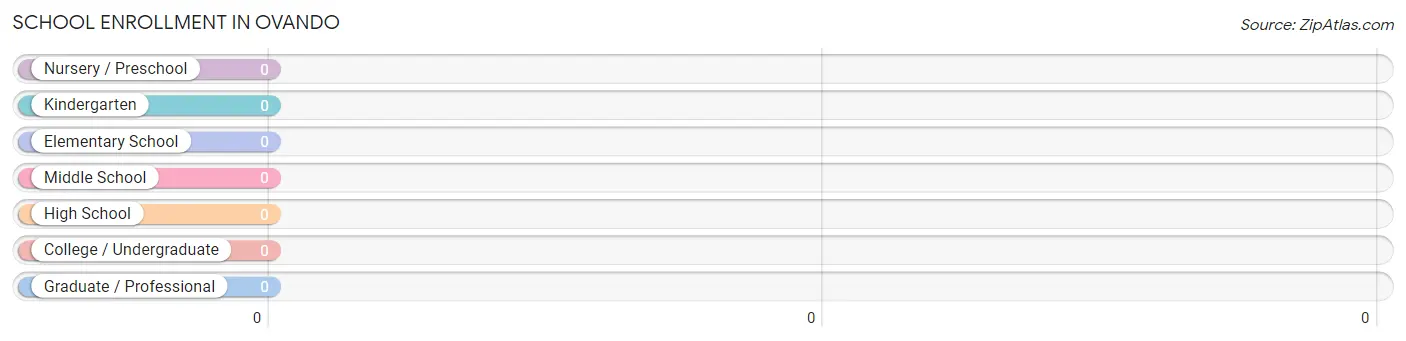
| School Level | # Students | % Students |
| Nursery / Preschool | 0 | 0.0% |
| Kindergarten | 0 | 0.0% |
| Elementary School | 0 | 0.0% |
| Middle School | 0 | 0.0% |
| High School | 0 | 0.0% |
| College / Undergraduate | 0 | 0.0% |
| Graduate / Professional | 0 | 0.0% |
| Total | 0 | 0.0% |
School Enrollment by Age by Funding Source in Ovando
| Age Bracket | Public School | Private School |
| 3 to 4 Year Olds | 0 (0.0%) | 0 (0.0%) |
| 5 to 9 Year Old | 0 (0.0%) | 0 (0.0%) |
| 10 to 14 Year Olds | 0 (0.0%) | 0 (0.0%) |
| 15 to 17 Year Olds | 0 (0.0%) | 0 (0.0%) |
| 18 to 19 Year Olds | 0 (0.0%) | 0 (0.0%) |
| 20 to 24 Year Olds | 0 (0.0%) | 0 (0.0%) |
| 25 to 34 Year Olds | 0 (0.0%) | 0 (0.0%) |
| 35 Years and over | 0 (0.0%) | 0 (0.0%) |
| Total | 0 (0.0%) | 0 (0.0%) |
Educational Attainment by Field of Study in Ovando
Business (6 | 37.5%), science & technology (4 | 25.0%), education (3 | 18.8%), and arts & humanities (3 | 18.8%) are the most common fields of study among 16 individuals in Ovando who have obtained a bachelor's degree or higher.
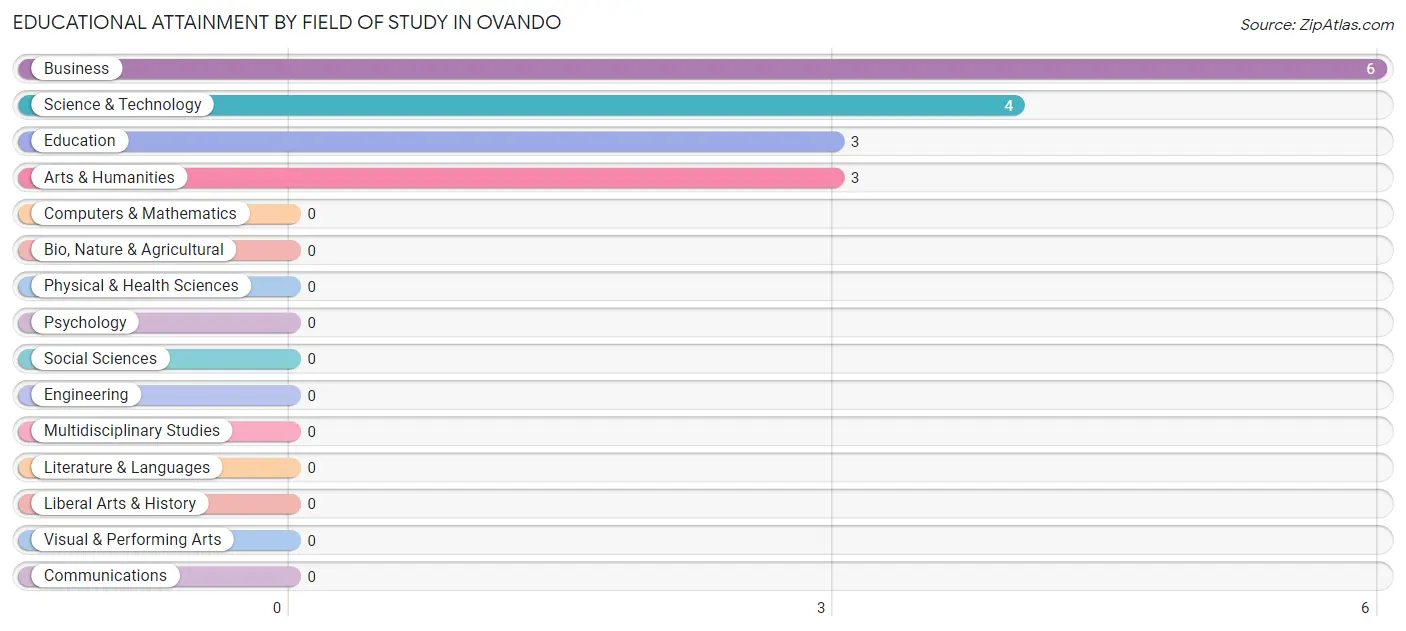
| Field of Study | # Graduates | % Graduates |
| Computers & Mathematics | 0 | 0.0% |
| Bio, Nature & Agricultural | 0 | 0.0% |
| Physical & Health Sciences | 0 | 0.0% |
| Psychology | 0 | 0.0% |
| Social Sciences | 0 | 0.0% |
| Engineering | 0 | 0.0% |
| Multidisciplinary Studies | 0 | 0.0% |
| Science & Technology | 4 | 25.0% |
| Business | 6 | 37.5% |
| Education | 3 | 18.8% |
| Literature & Languages | 0 | 0.0% |
| Liberal Arts & History | 0 | 0.0% |
| Visual & Performing Arts | 0 | 0.0% |
| Communications | 0 | 0.0% |
| Arts & Humanities | 3 | 18.8% |
| Total | 16 | 100.0% |
Transportation & Commute in Ovando
Vehicle Availability by Sex in Ovando
The most prevalent vehicle ownership categories in Ovando are males with 3 vehicles (9, accounting for 56.2%) and females with 3 vehicles (1, making up 128.6%).
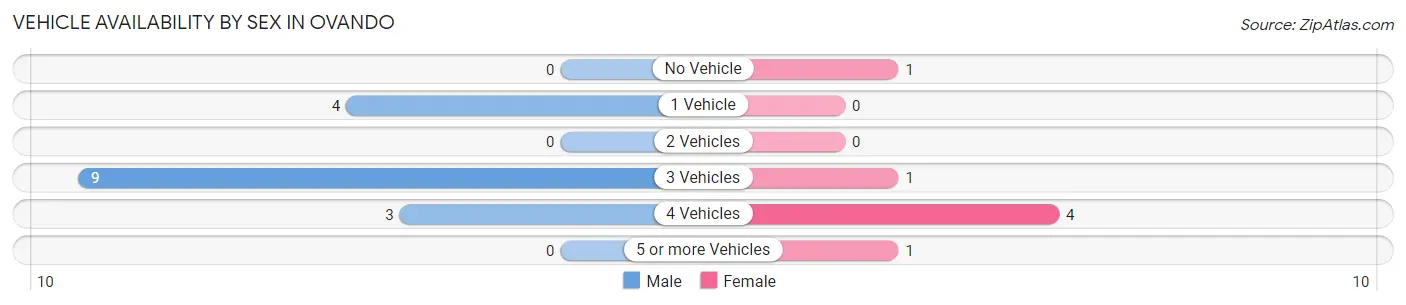
| Vehicles Available | Male | Female |
| No Vehicle | 0 (0.0%) | 1 (14.3%) |
| 1 Vehicle | 4 (25.0%) | 0 (0.0%) |
| 2 Vehicles | 0 (0.0%) | 0 (0.0%) |
| 3 Vehicles | 9 (56.2%) | 1 (14.3%) |
| 4 Vehicles | 3 (18.8%) | 4 (57.1%) |
| 5 or more Vehicles | 0 (0.0%) | 1 (14.3%) |
| Total | 16 (100.0%) | 7 (100.0%) |
Commute Time in Ovando
The most frequently occuring commute durations in Ovando are less than 5 minutes (7 commuters, 35.0%), 60 to 89 minutes (5 commuters, 25.0%), and 15 to 19 minutes (4 commuters, 20.0%).
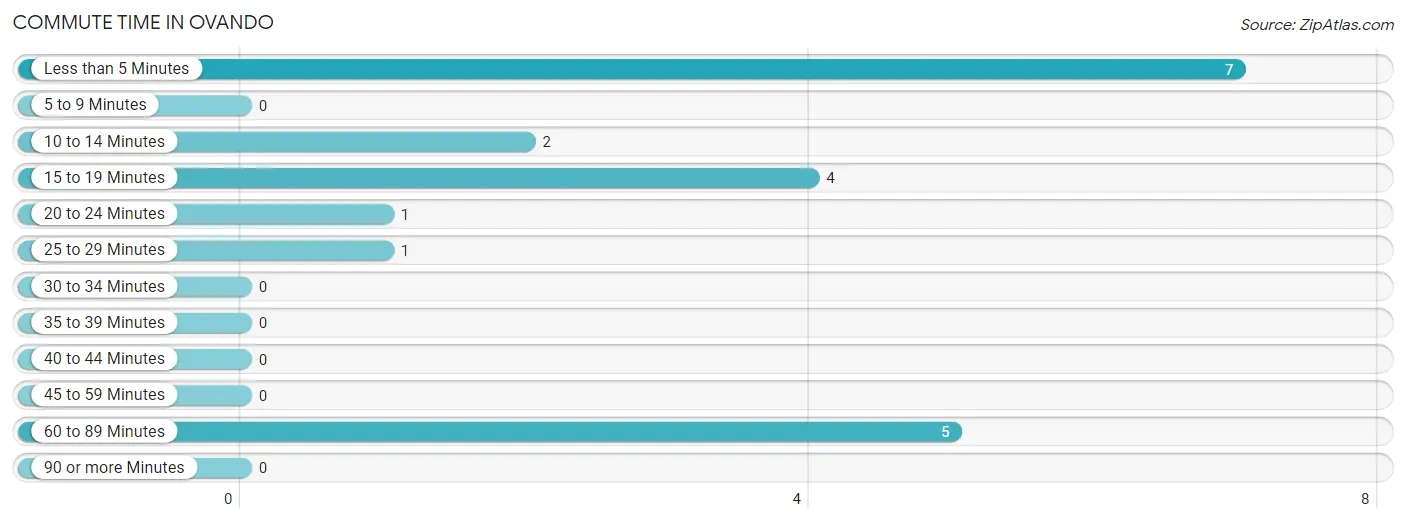
| Commute Time | # Commuters | % Commuters |
| Less than 5 Minutes | 7 | 35.0% |
| 5 to 9 Minutes | 0 | 0.0% |
| 10 to 14 Minutes | 2 | 10.0% |
| 15 to 19 Minutes | 4 | 20.0% |
| 20 to 24 Minutes | 1 | 5.0% |
| 25 to 29 Minutes | 1 | 5.0% |
| 30 to 34 Minutes | 0 | 0.0% |
| 35 to 39 Minutes | 0 | 0.0% |
| 40 to 44 Minutes | 0 | 0.0% |
| 45 to 59 Minutes | 0 | 0.0% |
| 60 to 89 Minutes | 5 | 25.0% |
| 90 or more Minutes | 0 | 0.0% |
Commute Time by Sex in Ovando
The most common commute times in Ovando are less than 5 minutes (7 commuters, 53.8%) for males and 60 to 89 minutes (5 commuters, 71.4%) for females.
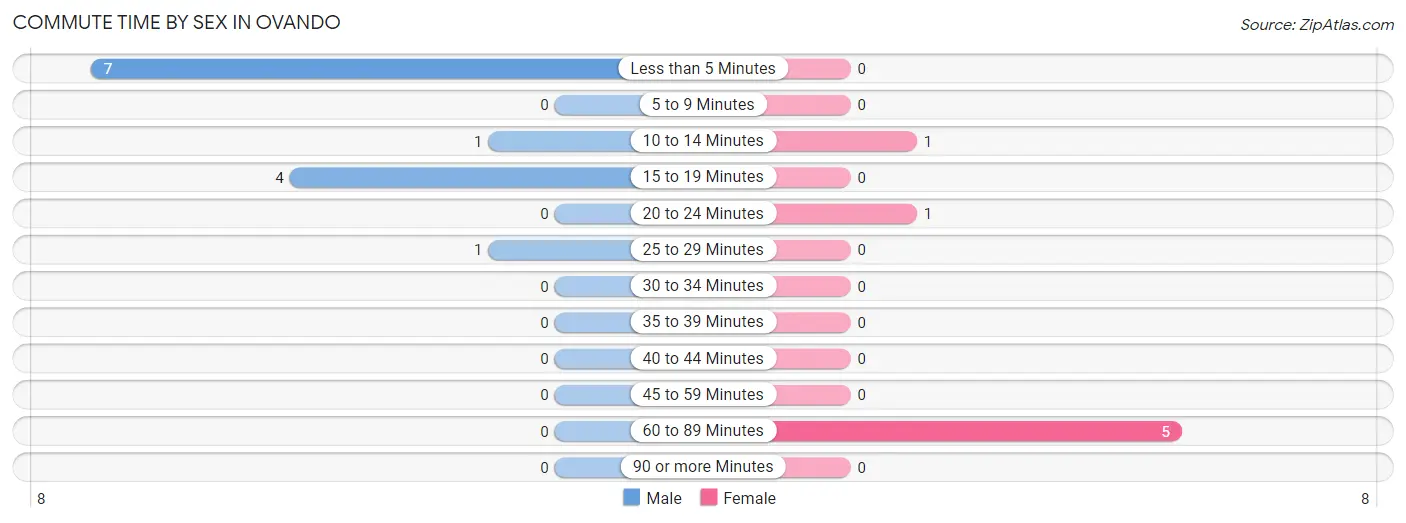
| Commute Time | Male | Female |
| Less than 5 Minutes | 7 (53.8%) | 0 (0.0%) |
| 5 to 9 Minutes | 0 (0.0%) | 0 (0.0%) |
| 10 to 14 Minutes | 1 (7.7%) | 1 (14.3%) |
| 15 to 19 Minutes | 4 (30.8%) | 0 (0.0%) |
| 20 to 24 Minutes | 0 (0.0%) | 1 (14.3%) |
| 25 to 29 Minutes | 1 (7.7%) | 0 (0.0%) |
| 30 to 34 Minutes | 0 (0.0%) | 0 (0.0%) |
| 35 to 39 Minutes | 0 (0.0%) | 0 (0.0%) |
| 40 to 44 Minutes | 0 (0.0%) | 0 (0.0%) |
| 45 to 59 Minutes | 0 (0.0%) | 0 (0.0%) |
| 60 to 89 Minutes | 0 (0.0%) | 5 (71.4%) |
| 90 or more Minutes | 0 (0.0%) | 0 (0.0%) |
Time of Departure to Work by Sex in Ovando
The most frequent times of departure to work in Ovando are 7:00 AM to 7:29 AM (5, 38.5%) for males and 12:00 AM to 4:59 AM (4, 57.1%) for females.
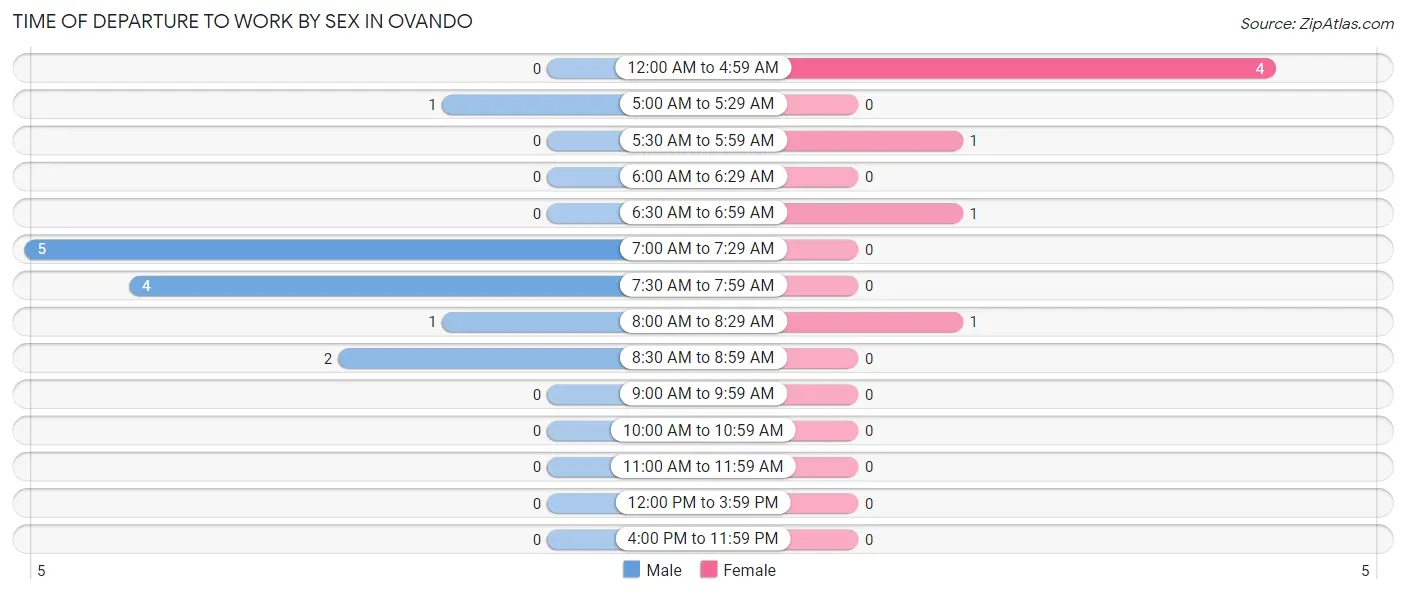
| Time of Departure | Male | Female |
| 12:00 AM to 4:59 AM | 0 (0.0%) | 4 (57.1%) |
| 5:00 AM to 5:29 AM | 1 (7.7%) | 0 (0.0%) |
| 5:30 AM to 5:59 AM | 0 (0.0%) | 1 (14.3%) |
| 6:00 AM to 6:29 AM | 0 (0.0%) | 0 (0.0%) |
| 6:30 AM to 6:59 AM | 0 (0.0%) | 1 (14.3%) |
| 7:00 AM to 7:29 AM | 5 (38.5%) | 0 (0.0%) |
| 7:30 AM to 7:59 AM | 4 (30.8%) | 0 (0.0%) |
| 8:00 AM to 8:29 AM | 1 (7.7%) | 1 (14.3%) |
| 8:30 AM to 8:59 AM | 2 (15.4%) | 0 (0.0%) |
| 9:00 AM to 9:59 AM | 0 (0.0%) | 0 (0.0%) |
| 10:00 AM to 10:59 AM | 0 (0.0%) | 0 (0.0%) |
| 11:00 AM to 11:59 AM | 0 (0.0%) | 0 (0.0%) |
| 12:00 PM to 3:59 PM | 0 (0.0%) | 0 (0.0%) |
| 4:00 PM to 11:59 PM | 0 (0.0%) | 0 (0.0%) |
| Total | 13 (100.0%) | 7 (100.0%) |
Housing Occupancy in Ovando
Occupancy by Ownership in Ovando
Of the total 27 dwellings in Ovando, owner-occupied units account for 20 (74.1%), while renter-occupied units make up 7 (25.9%).
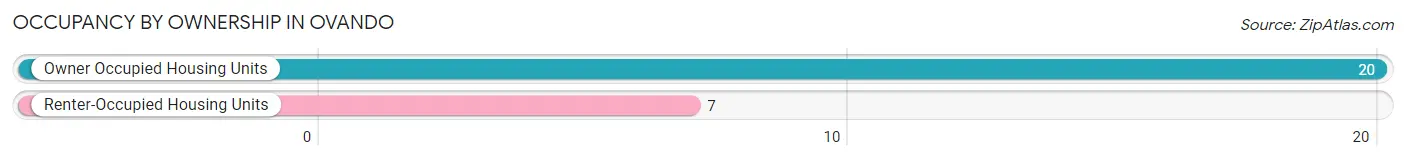
| Occupancy | # Housing Units | % Housing Units |
| Owner Occupied Housing Units | 20 | 74.1% |
| Renter-Occupied Housing Units | 7 | 25.9% |
| Total Occupied Housing Units | 27 | 100.0% |
Occupancy by Household Size in Ovando
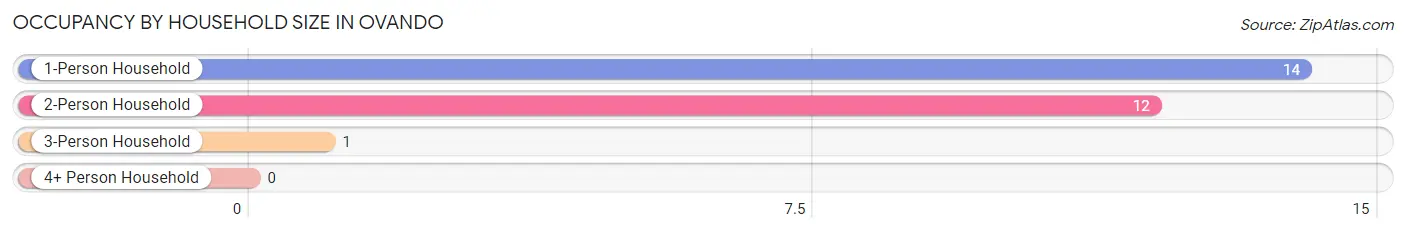
| Household Size | # Housing Units | % Housing Units |
| 1-Person Household | 14 | 51.8% |
| 2-Person Household | 12 | 44.4% |
| 3-Person Household | 1 | 3.7% |
| 4+ Person Household | 0 | 0.0% |
| Total Housing Units | 27 | 100.0% |
Occupancy by Ownership by Household Size in Ovando
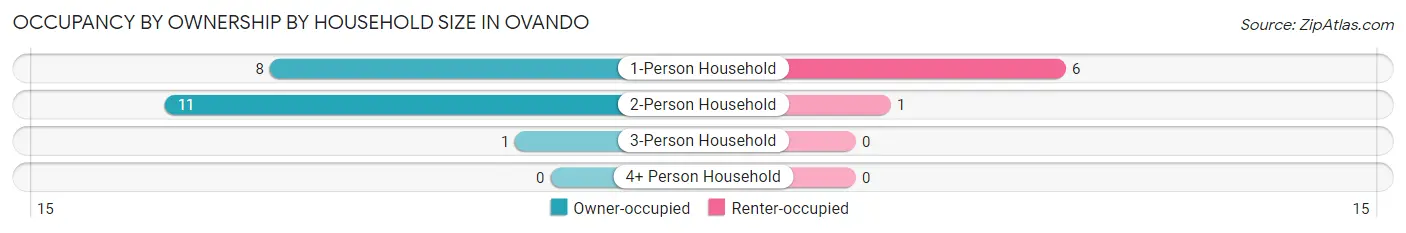
| Household Size | Owner-occupied | Renter-occupied |
| 1-Person Household | 8 (57.1%) | 6 (42.9%) |
| 2-Person Household | 11 (91.7%) | 1 (8.3%) |
| 3-Person Household | 1 (100.0%) | 0 (0.0%) |
| 4+ Person Household | 0 (0.0%) | 0 (0.0%) |
| Total Housing Units | 20 (74.1%) | 7 (25.9%) |
Occupancy by Educational Attainment in Ovando
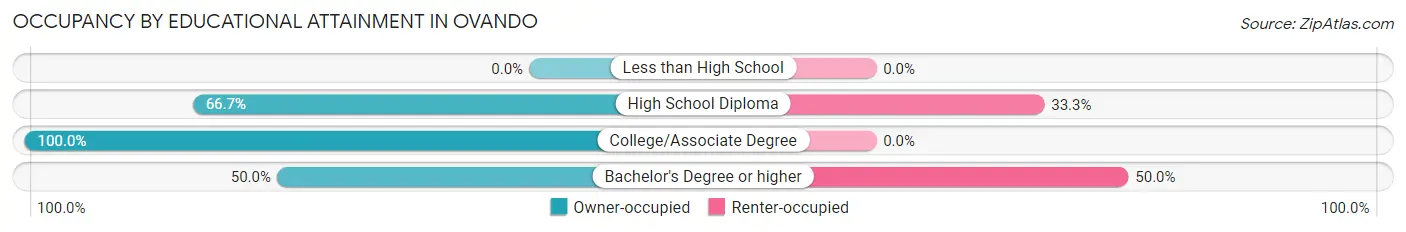
| Household Size | Owner-occupied | Renter-occupied |
| Less than High School | 0 (0.0%) | 0 (0.0%) |
| High School Diploma | 2 (66.7%) | 1 (33.3%) |
| College/Associate Degree | 12 (100.0%) | 0 (0.0%) |
| Bachelor's Degree or higher | 6 (50.0%) | 6 (50.0%) |
Occupancy by Age of Householder in Ovando
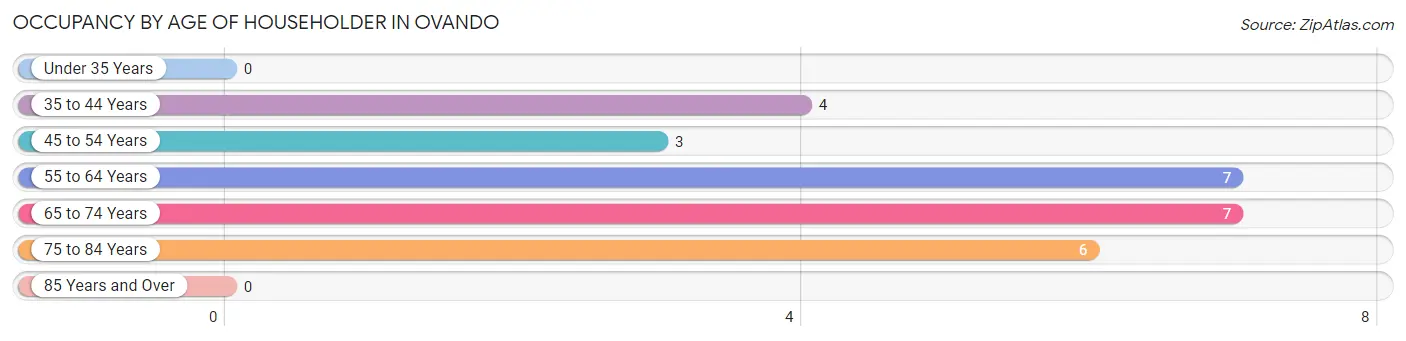
| Age Bracket | # Households | % Households |
| Under 35 Years | 0 | 0.0% |
| 35 to 44 Years | 4 | 14.8% |
| 45 to 54 Years | 3 | 11.1% |
| 55 to 64 Years | 7 | 25.9% |
| 65 to 74 Years | 7 | 25.9% |
| 75 to 84 Years | 6 | 22.2% |
| 85 Years and Over | 0 | 0.0% |
| Total | 27 | 100.0% |
Housing Finances in Ovando
Median Income by Occupancy in Ovando
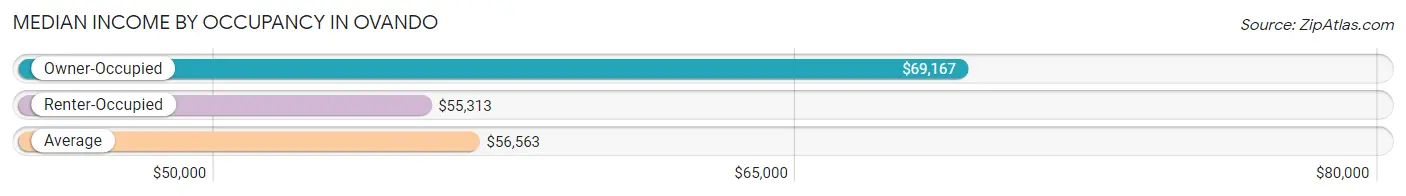
| Occupancy Type | # Households | Median Income |
| Owner-Occupied | 20 (74.1%) | $69,167 |
| Renter-Occupied | 7 (25.9%) | $55,313 |
| Average | 27 (100.0%) | $56,563 |
Occupancy by Householder Income Bracket in Ovando
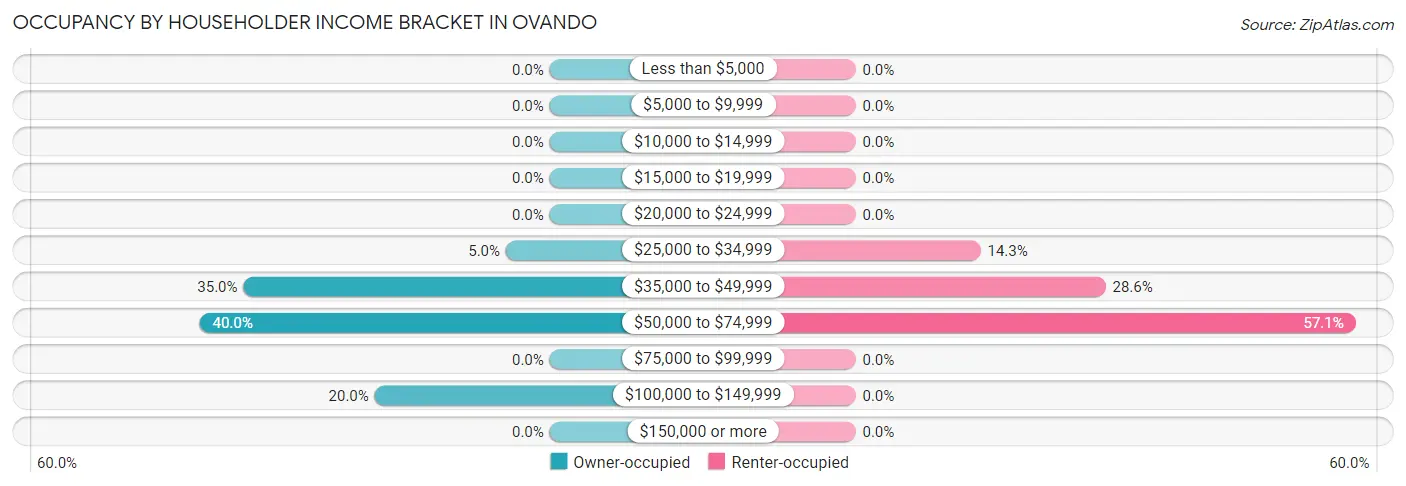
| Income Bracket | Owner-occupied | Renter-occupied |
| Less than $5,000 | 0 (0.0%) | 0 (0.0%) |
| $5,000 to $9,999 | 0 (0.0%) | 0 (0.0%) |
| $10,000 to $14,999 | 0 (0.0%) | 0 (0.0%) |
| $15,000 to $19,999 | 0 (0.0%) | 0 (0.0%) |
| $20,000 to $24,999 | 0 (0.0%) | 0 (0.0%) |
| $25,000 to $34,999 | 1 (5.0%) | 1 (14.3%) |
| $35,000 to $49,999 | 7 (35.0%) | 2 (28.6%) |
| $50,000 to $74,999 | 8 (40.0%) | 4 (57.1%) |
| $75,000 to $99,999 | 0 (0.0%) | 0 (0.0%) |
| $100,000 to $149,999 | 4 (20.0%) | 0 (0.0%) |
| $150,000 or more | 0 (0.0%) | 0 (0.0%) |
| Total | 20 (100.0%) | 7 (100.0%) |
Monthly Housing Cost Tiers in Ovando
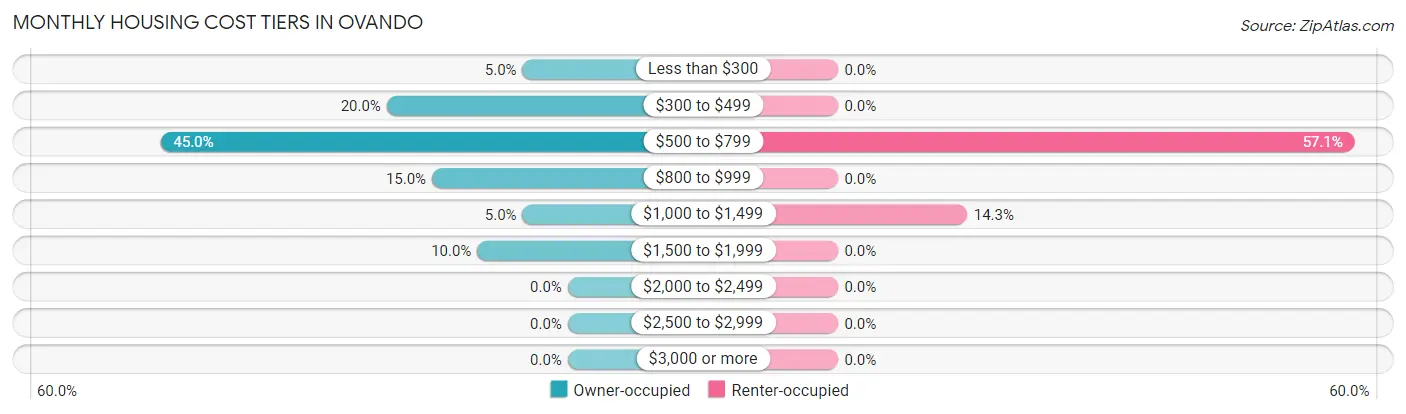
| Monthly Cost | Owner-occupied | Renter-occupied |
| Less than $300 | 1 (5.0%) | 0 (0.0%) |
| $300 to $499 | 4 (20.0%) | 0 (0.0%) |
| $500 to $799 | 9 (45.0%) | 4 (57.1%) |
| $800 to $999 | 3 (15.0%) | 0 (0.0%) |
| $1,000 to $1,499 | 1 (5.0%) | 1 (14.3%) |
| $1,500 to $1,999 | 2 (10.0%) | 0 (0.0%) |
| $2,000 to $2,499 | 0 (0.0%) | 0 (0.0%) |
| $2,500 to $2,999 | 0 (0.0%) | 0 (0.0%) |
| $3,000 or more | 0 (0.0%) | 0 (0.0%) |
| Total | 20 (100.0%) | 7 (100.0%) |
Physical Housing Characteristics in Ovando
Housing Structures in Ovando
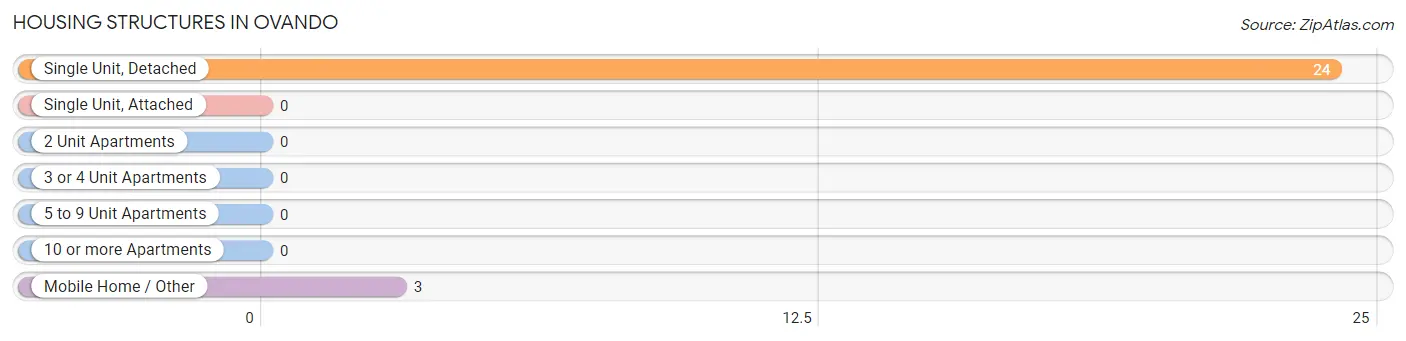
| Structure Type | # Housing Units | % Housing Units |
| Single Unit, Detached | 24 | 88.9% |
| Single Unit, Attached | 0 | 0.0% |
| 2 Unit Apartments | 0 | 0.0% |
| 3 or 4 Unit Apartments | 0 | 0.0% |
| 5 to 9 Unit Apartments | 0 | 0.0% |
| 10 or more Apartments | 0 | 0.0% |
| Mobile Home / Other | 3 | 11.1% |
| Total | 27 | 100.0% |
Housing Structures by Occupancy in Ovando
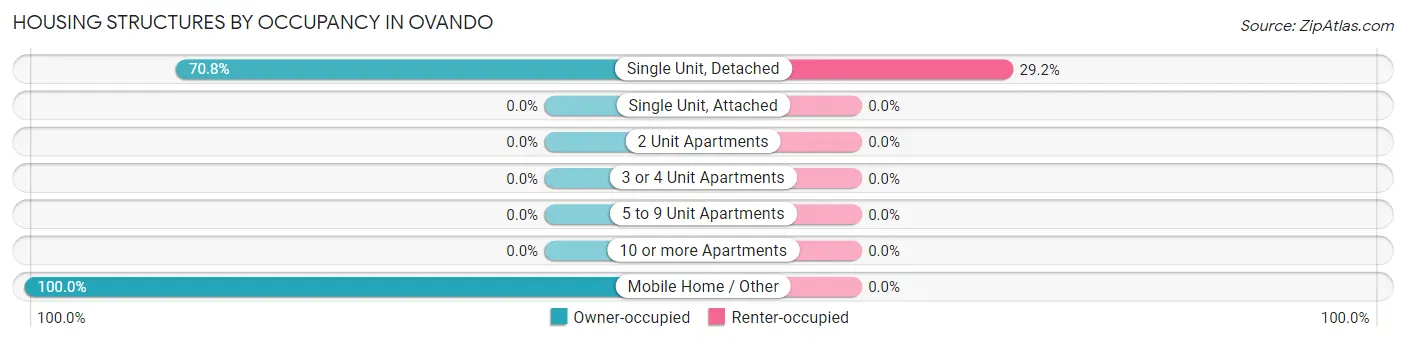
| Structure Type | Owner-occupied | Renter-occupied |
| Single Unit, Detached | 17 (70.8%) | 7 (29.2%) |
| Single Unit, Attached | 0 (0.0%) | 0 (0.0%) |
| 2 Unit Apartments | 0 (0.0%) | 0 (0.0%) |
| 3 or 4 Unit Apartments | 0 (0.0%) | 0 (0.0%) |
| 5 to 9 Unit Apartments | 0 (0.0%) | 0 (0.0%) |
| 10 or more Apartments | 0 (0.0%) | 0 (0.0%) |
| Mobile Home / Other | 3 (100.0%) | 0 (0.0%) |
| Total | 20 (74.1%) | 7 (25.9%) |
Housing Structures by Number of Rooms in Ovando
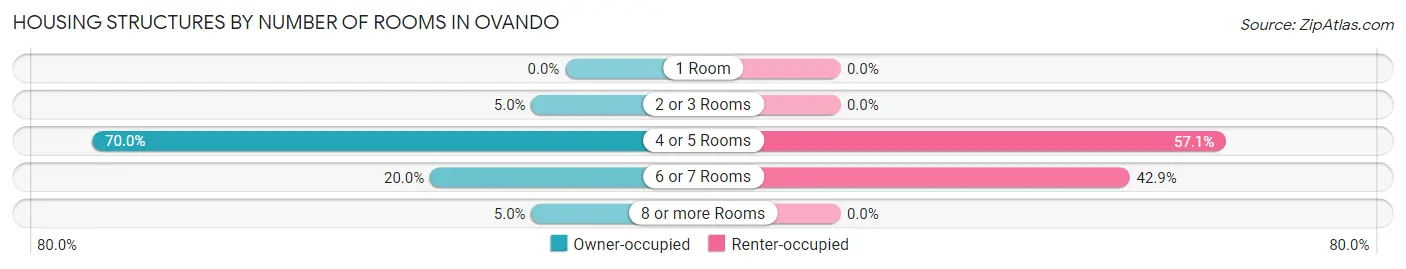
| Number of Rooms | Owner-occupied | Renter-occupied |
| 1 Room | 0 (0.0%) | 0 (0.0%) |
| 2 or 3 Rooms | 1 (5.0%) | 0 (0.0%) |
| 4 or 5 Rooms | 14 (70.0%) | 4 (57.1%) |
| 6 or 7 Rooms | 4 (20.0%) | 3 (42.9%) |
| 8 or more Rooms | 1 (5.0%) | 0 (0.0%) |
| Total | 20 (100.0%) | 7 (100.0%) |
Housing Structure by Heating Type in Ovando
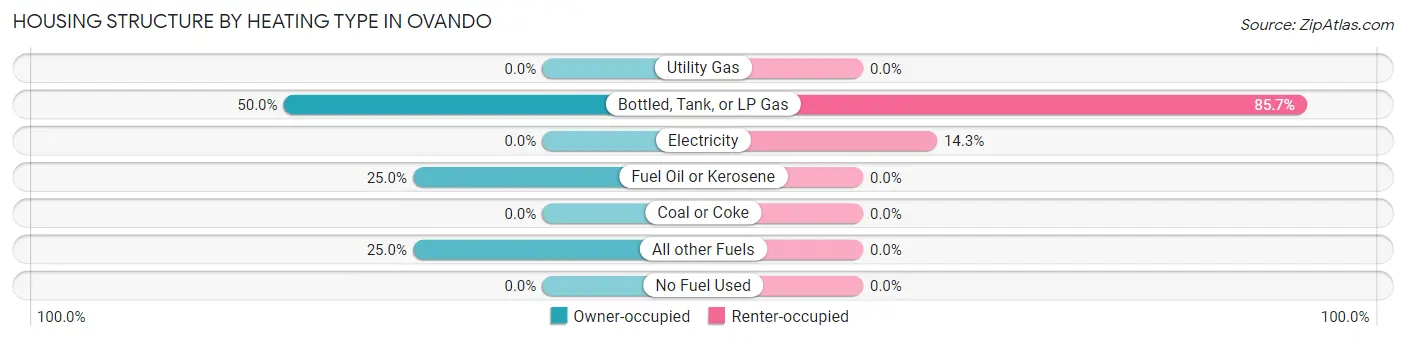
| Heating Type | Owner-occupied | Renter-occupied |
| Utility Gas | 0 (0.0%) | 0 (0.0%) |
| Bottled, Tank, or LP Gas | 10 (50.0%) | 6 (85.7%) |
| Electricity | 0 (0.0%) | 1 (14.3%) |
| Fuel Oil or Kerosene | 5 (25.0%) | 0 (0.0%) |
| Coal or Coke | 0 (0.0%) | 0 (0.0%) |
| All other Fuels | 5 (25.0%) | 0 (0.0%) |
| No Fuel Used | 0 (0.0%) | 0 (0.0%) |
| Total | 20 (100.0%) | 7 (100.0%) |
Household Vehicle Usage in Ovando
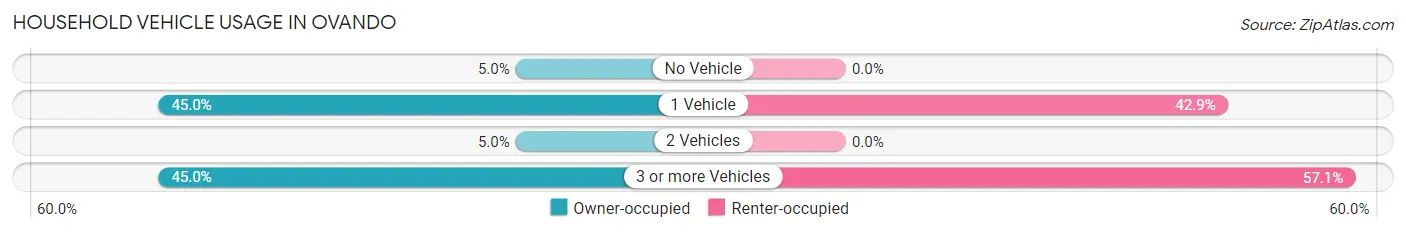
| Vehicles per Household | Owner-occupied | Renter-occupied |
| No Vehicle | 1 (5.0%) | 0 (0.0%) |
| 1 Vehicle | 9 (45.0%) | 3 (42.9%) |
| 2 Vehicles | 1 (5.0%) | 0 (0.0%) |
| 3 or more Vehicles | 9 (45.0%) | 4 (57.1%) |
| Total | 20 (100.0%) | 7 (100.0%) |
Real Estate & Mortgages in Ovando
Real Estate and Mortgage Overview in Ovando
| Characteristic | Without Mortgage | With Mortgage |
| Housing Units | 14 | 6 |
| Median Property Value | $455,600 | $283,300 |
| Median Household Income | $68,333 | $0 |
| Monthly Housing Costs | $622 | $0 |
| Real Estate Taxes | $1,806 | $0 |
Property Value by Mortgage Status in Ovando
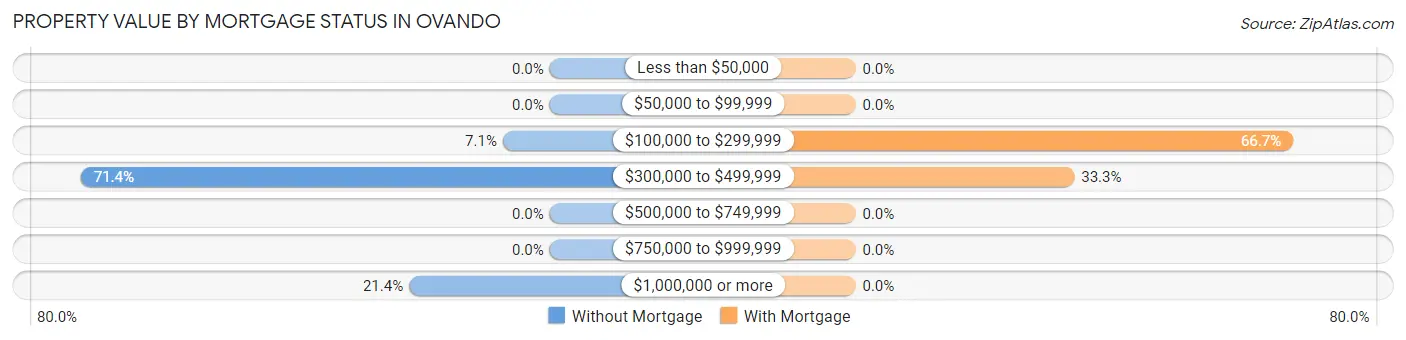
| Property Value | Without Mortgage | With Mortgage |
| Less than $50,000 | 0 (0.0%) | 0 (0.0%) |
| $50,000 to $99,999 | 0 (0.0%) | 0 (0.0%) |
| $100,000 to $299,999 | 1 (7.1%) | 4 (66.7%) |
| $300,000 to $499,999 | 10 (71.4%) | 2 (33.3%) |
| $500,000 to $749,999 | 0 (0.0%) | 0 (0.0%) |
| $750,000 to $999,999 | 0 (0.0%) | 0 (0.0%) |
| $1,000,000 or more | 3 (21.4%) | 0 (0.0%) |
| Total | 14 (100.0%) | 6 (100.0%) |
Household Income by Mortgage Status in Ovando
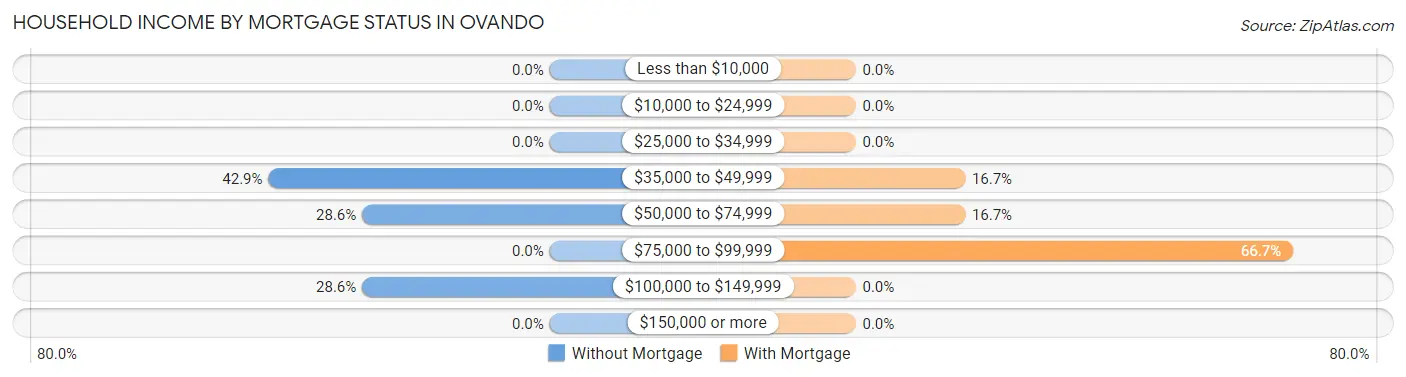
| Household Income | Without Mortgage | With Mortgage |
| Less than $10,000 | 0 (0.0%) | 0 (0.0%) |
| $10,000 to $24,999 | 0 (0.0%) | 0 (0.0%) |
| $25,000 to $34,999 | 0 (0.0%) | 0 (0.0%) |
| $35,000 to $49,999 | 6 (42.9%) | 1 (16.7%) |
| $50,000 to $74,999 | 4 (28.6%) | 1 (16.7%) |
| $75,000 to $99,999 | 0 (0.0%) | 4 (66.7%) |
| $100,000 to $149,999 | 4 (28.6%) | 0 (0.0%) |
| $150,000 or more | 0 (0.0%) | 0 (0.0%) |
| Total | 14 (100.0%) | 6 (100.0%) |
Property Value to Household Income Ratio in Ovando
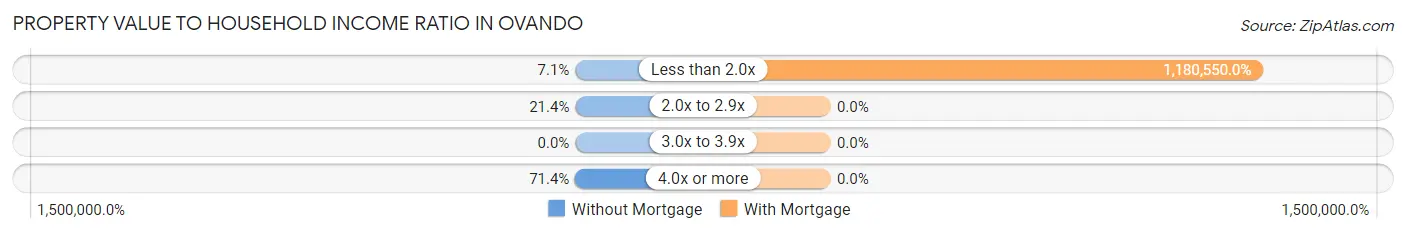
| Value-to-Income Ratio | Without Mortgage | With Mortgage |
| Less than 2.0x | 1 (7.1%) | 70,833 (1,180,550.0%) |
| 2.0x to 2.9x | 3 (21.4%) | 0 (0.0%) |
| 3.0x to 3.9x | 0 (0.0%) | 0 (0.0%) |
| 4.0x or more | 10 (71.4%) | 0 (0.0%) |
| Total | 14 (100.0%) | 6 (100.0%) |
Real Estate Taxes by Mortgage Status in Ovando
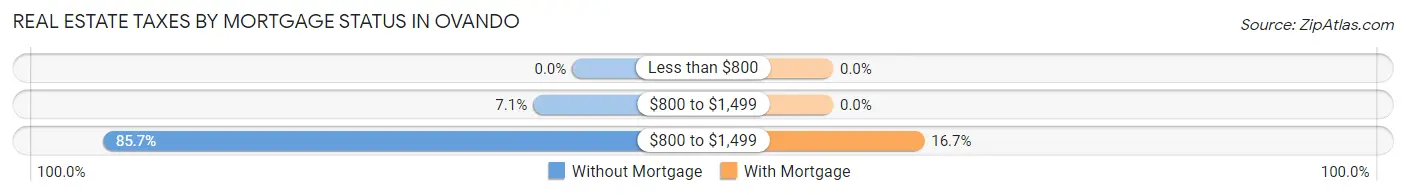
| Property Taxes | Without Mortgage | With Mortgage |
| Less than $800 | 0 (0.0%) | 0 (0.0%) |
| $800 to $1,499 | 1 (7.1%) | 0 (0.0%) |
| $800 to $1,499 | 12 (85.7%) | 1 (16.7%) |
| Total | 14 (100.0%) | 6 (100.0%) |
Health & Disability in Ovando
Health Insurance Coverage by Age in Ovando
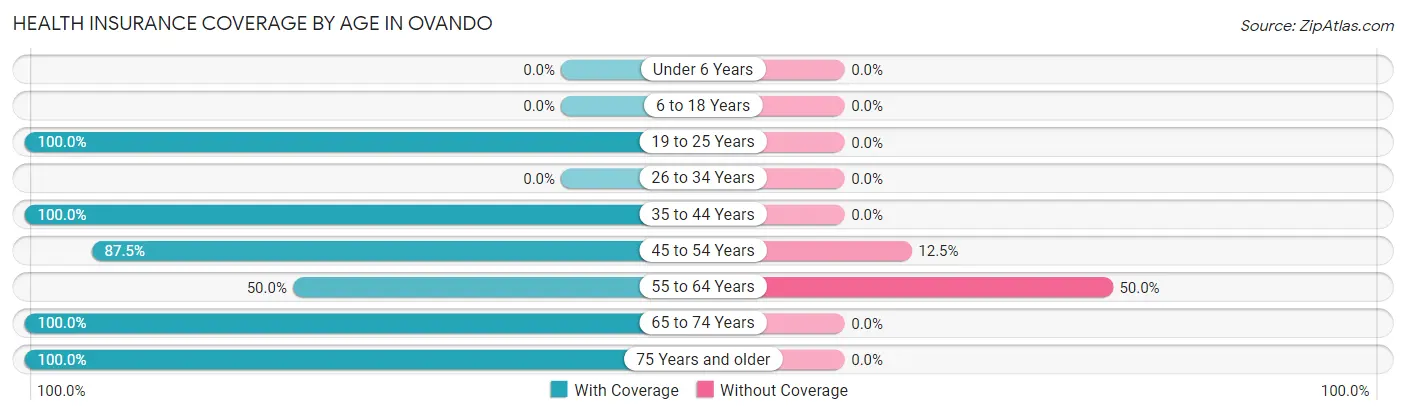
| Age Bracket | With Coverage | Without Coverage |
| Under 6 Years | 0 (0.0%) | 0 (0.0%) |
| 6 to 18 Years | 0 (0.0%) | 0 (0.0%) |
| 19 to 25 Years | 1 (100.0%) | 0 (0.0%) |
| 26 to 34 Years | 0 (0.0%) | 0 (0.0%) |
| 35 to 44 Years | 4 (100.0%) | 0 (0.0%) |
| 45 to 54 Years | 7 (87.5%) | 1 (12.5%) |
| 55 to 64 Years | 4 (50.0%) | 4 (50.0%) |
| 65 to 74 Years | 17 (100.0%) | 0 (0.0%) |
| 75 Years and older | 6 (100.0%) | 0 (0.0%) |
| Total | 39 (88.6%) | 5 (11.4%) |
Health Insurance Coverage by Citizenship Status in Ovando
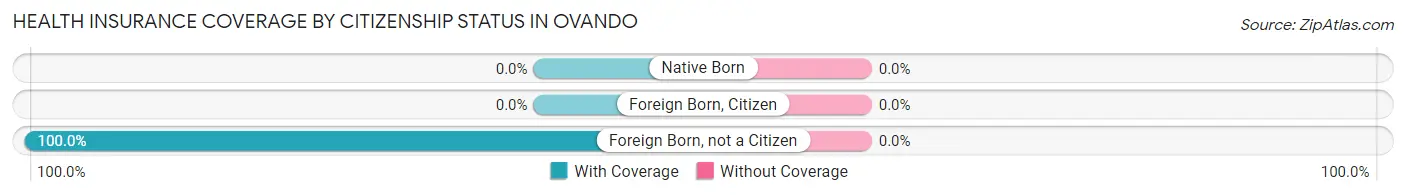
| Citizenship Status | With Coverage | Without Coverage |
| Native Born | 0 (0.0%) | 0 (0.0%) |
| Foreign Born, Citizen | 0 (0.0%) | 0 (0.0%) |
| Foreign Born, not a Citizen | 1 (100.0%) | 0 (0.0%) |
Health Insurance Coverage by Household Income in Ovando
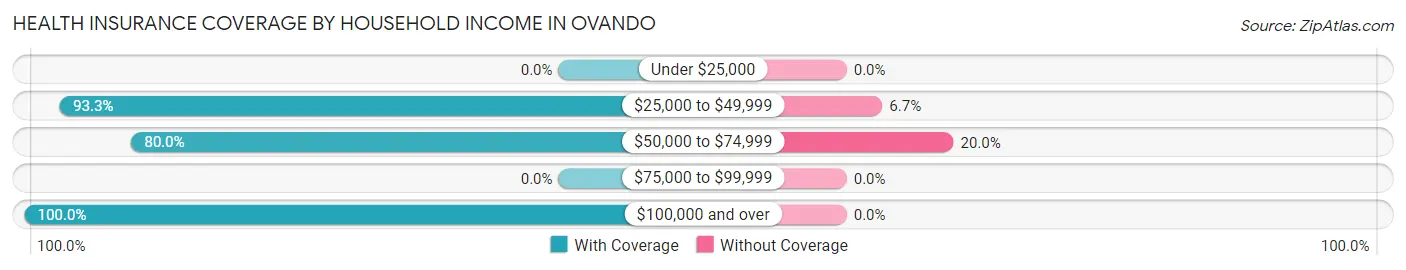
| Household Income | With Coverage | Without Coverage |
| Under $25,000 | 0 (0.0%) | 0 (0.0%) |
| $25,000 to $49,999 | 14 (93.3%) | 1 (6.7%) |
| $50,000 to $74,999 | 16 (80.0%) | 4 (20.0%) |
| $75,000 to $99,999 | 0 (0.0%) | 0 (0.0%) |
| $100,000 and over | 9 (100.0%) | 0 (0.0%) |
Public vs Private Health Insurance Coverage by Age in Ovando
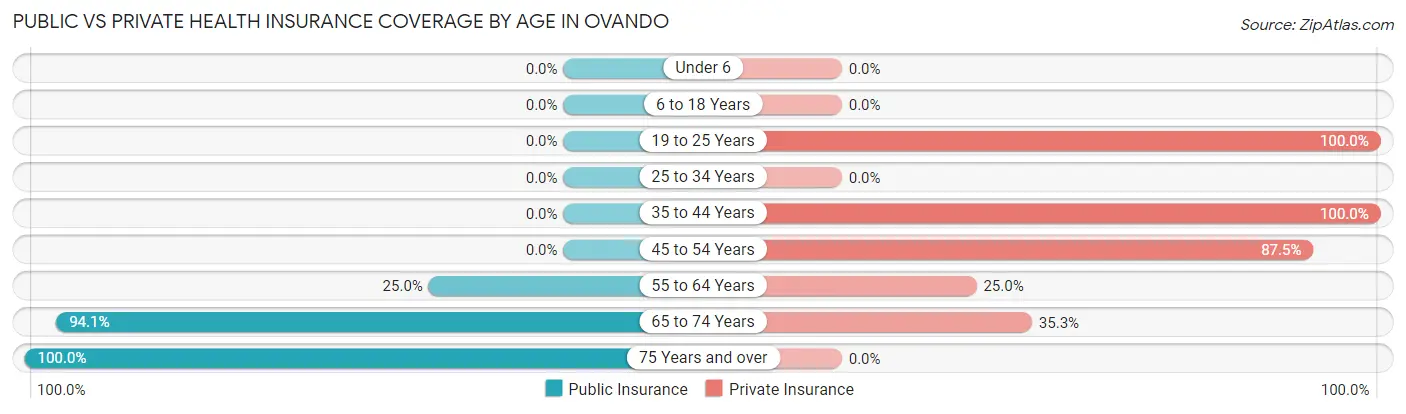
| Age Bracket | Public Insurance | Private Insurance |
| Under 6 | 0 (0.0%) | 0 (0.0%) |
| 6 to 18 Years | 0 (0.0%) | 0 (0.0%) |
| 19 to 25 Years | 0 (0.0%) | 1 (100.0%) |
| 25 to 34 Years | 0 (0.0%) | 0 (0.0%) |
| 35 to 44 Years | 0 (0.0%) | 4 (100.0%) |
| 45 to 54 Years | 0 (0.0%) | 7 (87.5%) |
| 55 to 64 Years | 2 (25.0%) | 2 (25.0%) |
| 65 to 74 Years | 16 (94.1%) | 6 (35.3%) |
| 75 Years and over | 6 (100.0%) | 0 (0.0%) |
| Total | 24 (54.5%) | 20 (45.5%) |
Disability Status by Sex by Age in Ovando
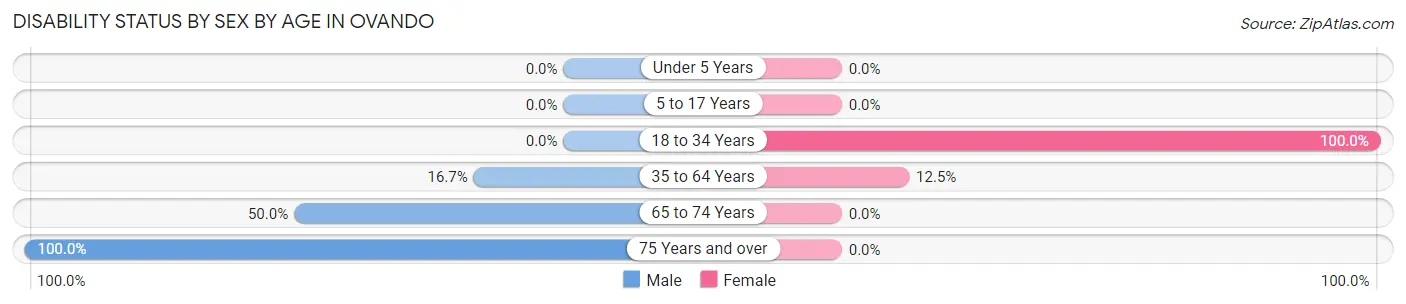
| Age Bracket | Male | Female |
| Under 5 Years | 0 (0.0%) | 0 (0.0%) |
| 5 to 17 Years | 0 (0.0%) | 0 (0.0%) |
| 18 to 34 Years | 0 (0.0%) | 1 (100.0%) |
| 35 to 64 Years | 2 (16.7%) | 1 (12.5%) |
| 65 to 74 Years | 6 (50.0%) | 0 (0.0%) |
| 75 Years and over | 6 (100.0%) | 0 (0.0%) |
Disability Class by Sex by Age in Ovando
Disability Class: Hearing Difficulty
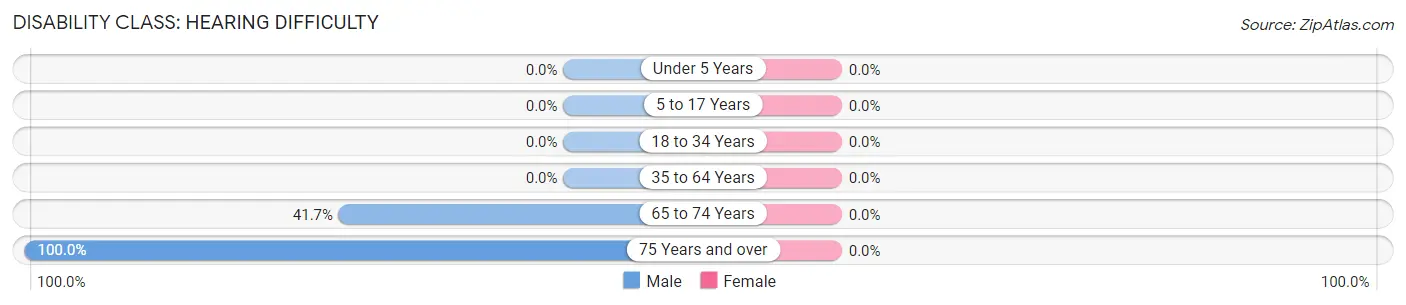
| Age Bracket | Male | Female |
| Under 5 Years | 0 (0.0%) | 0 (0.0%) |
| 5 to 17 Years | 0 (0.0%) | 0 (0.0%) |
| 18 to 34 Years | 0 (0.0%) | 0 (0.0%) |
| 35 to 64 Years | 0 (0.0%) | 0 (0.0%) |
| 65 to 74 Years | 5 (41.7%) | 0 (0.0%) |
| 75 Years and over | 6 (100.0%) | 0 (0.0%) |
Disability Class: Vision Difficulty
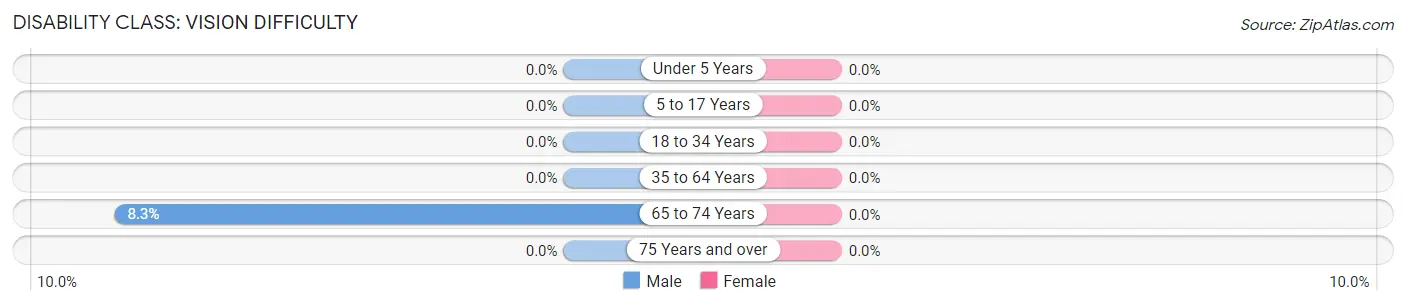
| Age Bracket | Male | Female |
| Under 5 Years | 0 (0.0%) | 0 (0.0%) |
| 5 to 17 Years | 0 (0.0%) | 0 (0.0%) |
| 18 to 34 Years | 0 (0.0%) | 0 (0.0%) |
| 35 to 64 Years | 0 (0.0%) | 0 (0.0%) |
| 65 to 74 Years | 1 (8.3%) | 0 (0.0%) |
| 75 Years and over | 0 (0.0%) | 0 (0.0%) |
Disability Class: Cognitive Difficulty
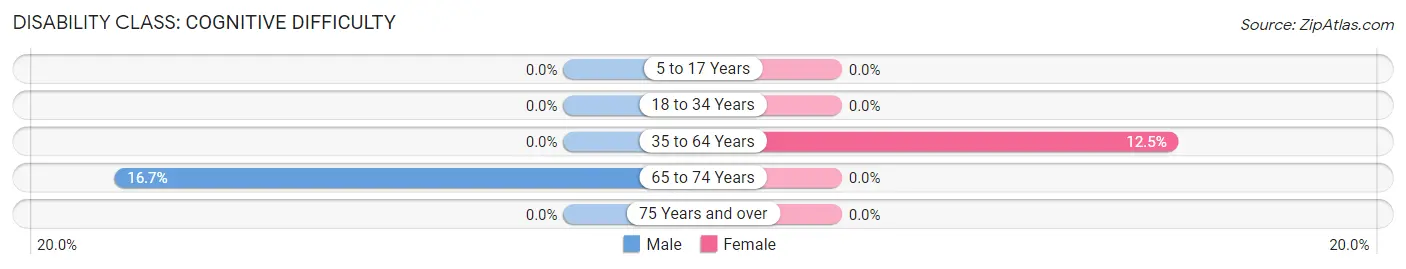
| Age Bracket | Male | Female |
| 5 to 17 Years | 0 (0.0%) | 0 (0.0%) |
| 18 to 34 Years | 0 (0.0%) | 0 (0.0%) |
| 35 to 64 Years | 0 (0.0%) | 1 (12.5%) |
| 65 to 74 Years | 2 (16.7%) | 0 (0.0%) |
| 75 Years and over | 0 (0.0%) | 0 (0.0%) |
Disability Class: Ambulatory Difficulty
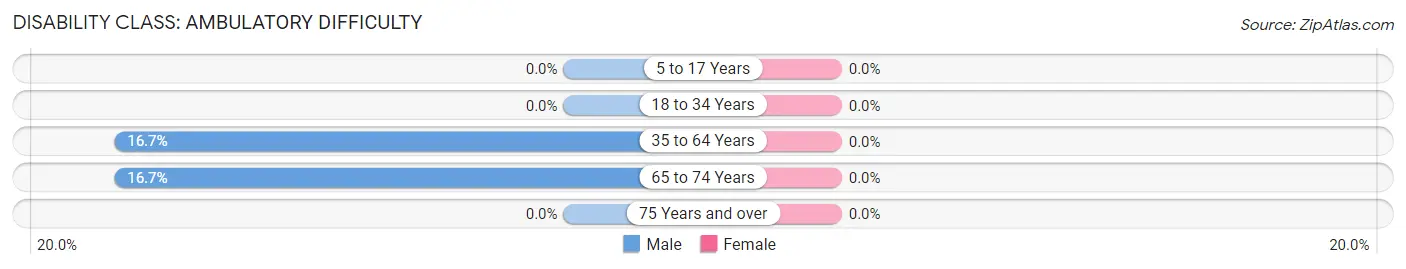
| Age Bracket | Male | Female |
| 5 to 17 Years | 0 (0.0%) | 0 (0.0%) |
| 18 to 34 Years | 0 (0.0%) | 0 (0.0%) |
| 35 to 64 Years | 2 (16.7%) | 0 (0.0%) |
| 65 to 74 Years | 2 (16.7%) | 0 (0.0%) |
| 75 Years and over | 0 (0.0%) | 0 (0.0%) |
Disability Class: Self-Care Difficulty
| Age Bracket | Male | Female |
| 5 to 17 Years | 0 (0.0%) | 0 (0.0%) |
| 18 to 34 Years | 0 (0.0%) | 0 (0.0%) |
| 35 to 64 Years | 0 (0.0%) | 0 (0.0%) |
| 65 to 74 Years | 0 (0.0%) | 0 (0.0%) |
| 75 Years and over | 0 (0.0%) | 0 (0.0%) |
Technology Access in Ovando
Computing Device Access in Ovando
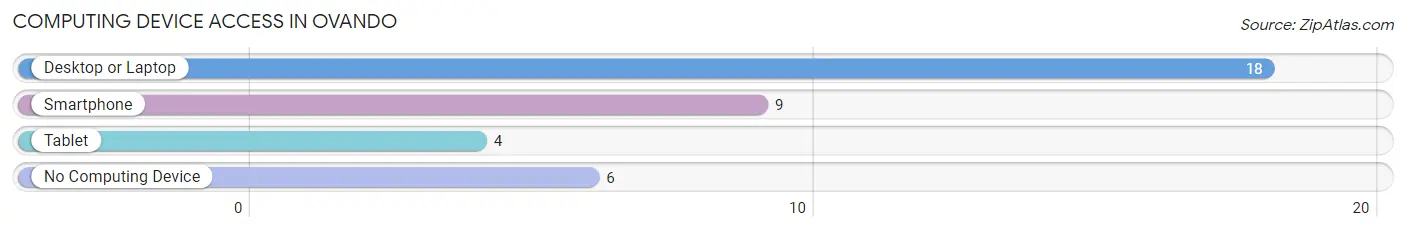
| Device Type | # Households | % Households |
| Desktop or Laptop | 18 | 66.7% |
| Smartphone | 9 | 33.3% |
| Tablet | 4 | 14.8% |
| No Computing Device | 6 | 22.2% |
| Total | 27 | 100.0% |
Internet Access in Ovando
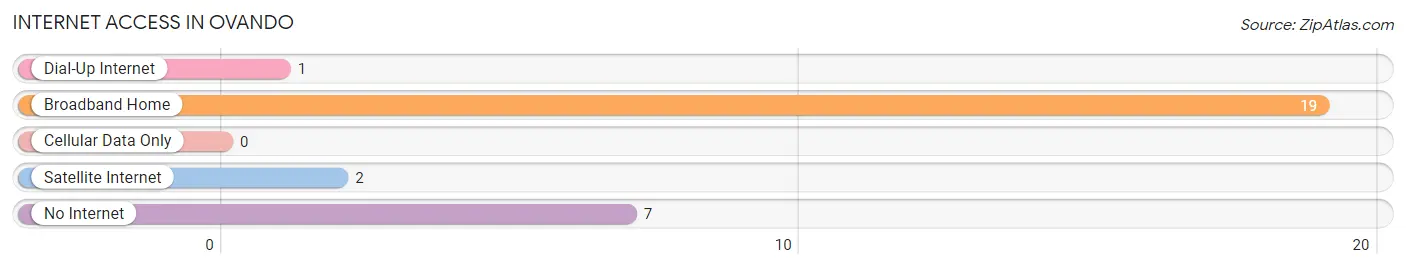
| Internet Type | # Households | % Households |
| Dial-Up Internet | 1 | 3.7% |
| Broadband Home | 19 | 70.4% |
| Cellular Data Only | 0 | 0.0% |
| Satellite Internet | 2 | 7.4% |
| No Internet | 7 | 25.9% |
| Total | 27 | 100.0% |
Ovando Summary
Ovando is a small town located in Powell County, Montana, United States. It is situated in the foothills of the Rocky Mountains, approximately 20 miles south of Helena, the state capital. The town was founded in 1883 and has a population of approximately 200 people.
History
Ovando was founded in 1883 by a group of settlers from the Midwest. The town was named after a local rancher, John Ovando, who had a large ranch in the area. The town was originally a small farming community, but it soon became a center for the timber industry. The town was also home to a number of sawmills and lumber yards.
In the early 1900s, the town began to experience a period of growth and prosperity. The population increased from just over 200 in 1900 to nearly 500 by 1910. During this time, the town was home to a number of businesses, including a bank, a hotel, a general store, and a post office.
In the 1920s, the timber industry began to decline and the town's population began to decline as well. By 1930, the population had dropped to just over 200. The town continued to decline until the 1950s, when the timber industry began to rebound. The population began to increase again and by 1960, the population had reached nearly 400.
Geography
Ovando is located in the foothills of the Rocky Mountains, approximately 20 miles south of Helena, the state capital. The town is situated in a valley surrounded by mountains on all sides. The town is located at an elevation of 4,400 feet above sea level.
The climate in Ovando is semi-arid, with hot summers and cold winters. The average annual temperature is around 50 degrees Fahrenheit. The average annual precipitation is around 15 inches.
Economy
The economy of Ovando is largely based on agriculture and timber. The town is home to a number of farms and ranches, as well as a number of sawmills and lumber yards. The town is also home to a number of small businesses, including a general store, a post office, and a bank.
Demographics
As of the 2010 census, the population of Ovando was 200 people. The racial makeup of the town was 97.5% White, 0.5% Native American, 0.5% Asian, and 1.5% from other races. The median household income was $31,250 and the median family income was $37,500.
Conclusion
Ovando is a small town located in Powell County, Montana, United States. It was founded in 1883 and has a population of approximately 200 people. The town is situated in the foothills of the Rocky Mountains and is home to a number of farms and ranches, as well as a number of sawmills and lumber yards. The economy of Ovando is largely based on agriculture and timber. The town has a semi-arid climate with hot summers and cold winters. As of the 2010 census, the population of Ovando was 200 people. The racial makeup of the town was 97.5% White, 0.5% Native American, 0.5% Asian, and 1.5% from other races. The median household income was $31,250 and the median family income was $37,500.
Common Questions
What is Per Capita Income in Ovando?
Per Capita income in Ovando is $46,518.
What is the Median Family Income in Ovando?
Median Family Income in Ovando is $70,417.
What is the Median Household income in Ovando?
Median Household Income in Ovando is $56,563.
What is Income or Wage Gap in Ovando?
Income or Wage Gap in Ovando is 24.3%.
Women in Ovando earn 75.7 cents for every dollar earned by a man.
What is Inequality or Gini Index in Ovando?
Inequality or Gini Index in Ovando is 0.22.
What is the Total Population of Ovando?
Total Population of Ovando is 44.
What is the Total Male Population of Ovando?
Total Male Population of Ovando is 30.
What is the Total Female Population of Ovando?
Total Female Population of Ovando is 14.
What is the Ratio of Males per 100 Females in Ovando?
There are 214.29 Males per 100 Females in Ovando.
What is the Ratio of Females per 100 Males in Ovando?
There are 46.67 Females per 100 Males in Ovando.
What is the Median Population Age in Ovando?
Median Population Age in Ovando is 66.2 Years.
What is the Average Family Size in Ovando
Average Family Size in Ovando is 2.3 People.
What is the Average Household Size in Ovando
Average Household Size in Ovando is 1.6 People.
How Large is the Labor Force in Ovando?
There are 23 People in the Labor Forcein in Ovando.
What is the Percentage of People in the Labor Force in Ovando?
52.3% of People are in the Labor Force in Ovando.